1
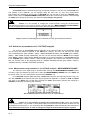
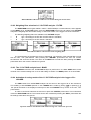
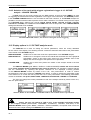
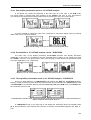
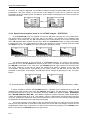
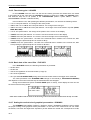
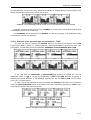
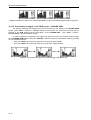
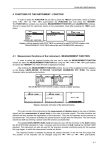
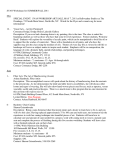
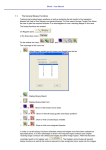
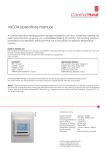
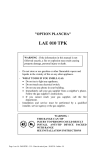
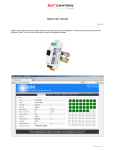
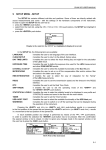
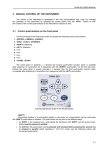
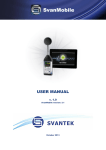
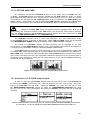
SVAN 953 USER MANUAL
10 1/1 OCTAVE ANALYSER
The instrument operates as 1/1 OCTAVE analyser in a very similar way to the SLM mode and,
in addition, 1/1 OCTAVE analysis is performed in parallel with the SLM operations. All ten, 1/1-octave
digital pass-band filters (with the centre frequencies from 16 kHz down to 31.5 Hz; in base two system)
are working in the real time with the weighting filters: Z, A or C selected in the SPECTRUM (path:
MENU / INPUT / SPECTRUM / FILTER) and the linear RMS detector. Additionally, the TOTAL RMS
values for the full frequency range with the A, C and Z weighting filters are calculated and displayed.
Notice: The TOTAL RMS results are measured with the weighting filters: A, C and Z
without taking into account the settings of the SLM profiles. The spectra are always linearly averaged.
Thus, the TOTAL values from 1/1 OCTAVE analysis can be different from those obtained for the SLM
profiles (if the RMS INTEGRATION was set as EXPONENTIAL).
The SVAN 953 instrument, which in SLM mode operates in one, wide measurement range,
as 1/1 OCTAVE analyser it operates in two ranges, called LOW and HIGH, which can be selected
in the MEASUREMENT RANGE window (path: MENU / INPUT / MEASUREMENT RANGE).
The results of 1/1 OCTAVE analysis (so-called spectrum) can be examined by the user
on a display in so-called SPECTRUM presentation mode. The availability of this mode can be switched on
or off by the user (path: MENU / DISPLAY / DISPLAY MODES / SPECTRUM).
1/1 OCTAVE spectrum for all ten centre frequencies of 1/1 octave pass-band filters together with
the TOTAL RMS values measured with A, C and Z weighting filters are presented in the switched on
SPECTRUM mode. The read-out of the interested value of 1/1 OCTAVE spectrum can be done by means
of the cursor controlled by the <>, <> push-buttons. Below the spectrum lines, the numerical value in
dB (Level) and the selected 1/1 octave filter (its centre frequency) or the selected TOTAL (indicated by
the letter A, C or Z) are displayed.
Displays in 1/1 OCTAVE analysis in the SPECTRUM display mode
10.1 Selection of 1/1 OCTAVE analysis mode
In order to select the 1/1 OCTAVE analysis mode the user has to enter the FUNCTION list
by pressing the <MENU> push-button, then - select by means of the <>, <> (or <>, <>) pushbuttons the FUNCTION text and finally - press the <ENTER> one. Then, the user has to open
the MEASUREMENT FUNCTION sub-list (to select the MEASUREMENT FUNCTION text using
the <>, <> (or <>, <>) push-buttons and press the <ENTER> one when this text is displayed
inversely).
b)
c)
a)
Main list with FUNCTION text selected (a), FUNCTION list opened with MEASUREMENT FUNCTION
text selected (b), 1/1 OCTAVE mode activated in MEASUREMENT FUNCTION window (c)
10-1
SVAN 953 USER MANUAL
_
1/1 OCTAVE mode is selected by placing the special character in the line with 1/1 OCTAVE text.
The position of the character can be changed using the <>, <> (or <>, <>) push-buttons.
After placing the character in the line with 1/1 OCTAVE text, the user has to press the <ENTER> pushbutton, which closes the MEASUREMENT FUNCTION sub-list and confirms the selection. After pressing
the <ESC> push-button the sub-list is also closed but any changes are ignored.
Notice: It is not possible to change the current function during the measurements.
The instrument displays in this case for about 2 seconds the text: ”MEASUREMENT IN PROGRESS”.
In order to change the current measurement function the instrument must be stopped!
Display with the text informing the user about the currently performed measurements
10.2 Selection of parameters of 1/1 OCTAVE analysis
The execution of 1/1 OCTAVE analysis depends on the certain number of the parameters, which
can be set in the different sub-lists of the INPUT list. Namely, the user can set there the range
of the measurements (path: MENU / INPUT / MEASUREMENT RANGE) and FILTER (path: MENU /
INPUT / SPECTRUM FILTER). Additionally, the user can be informed about the BAND of the analysis
(path: MENU / INPUT / SPECTRUM / BAND) and switch on or off the registration of 1/1 OCTAVE spectra
in the LOGGER (path: MENU / INPUT / SPECTRUM LOGGER). The output of the selected 1/1-octave
filter can be also used as the triggering signal in LOGGER TRIGGER window (path: MENU / INPUT /
TRIGGER SETUP / LOGGER TRIGGER / SOURCE).
10.2.1 Measurement range selection in 1/1 OCTAVE analysis - MEASUREMENT RANGE
The selection of the input range is possible after entering the MEASUREMENT RANGE window.
In order to open this window the user has to select the MEASUREMENT RANGE text in the INPUT list
by means of the <>, <> push-buttons and press the <ENTER> one.
In 1/1 OCTAVE analyser (differently than in SLM mode) the user can select (by means of the <>,
<> and <ENTER> push-buttons) the input ranges specified in Appendix C, named as LOW and HIGH.
The return to the INPUT list is made after pressing the <ESC> push-button (ignoring the changes) or
<ENTER> push-button (confirming the selection).
MEASUREMENT RANGE window in 1/1 OCTAVE analyser
Notice: It is not possible to change the measurement range during the execution
of the measurements. It is possible to open different lists and sub-lists but the positions in these lists are
not displayed inversely and so - not accessible. The “Loudspeaker” icon indicates that the instrument is
in the measurement process. In order to change the range the measurement must be stopped!
10-2
SVAN 953 USER MANUAL
MEASUREMENT RANGE window not accessible during the measurement
10.2.2 Weighting filter selection in 1/1 OCTAVE analysis - FILTER
The SPECTRUM sub-list (path: MENU / INPUT / SPECTRUM) is a context element, which appears
on the INPUT list in 1/1 OCTAVE mode. Using the SPECTRUM sub-list one can select in 1/1 OCTAVE
analysis the weighting filter and enable saving 1/1 OCTAVE results in the logger’s file of the instrument.
•
•
•
The following weighting filters are available in 1/1 OCTAVE analysis:
A
type 1 according to the IEC 651 and IEC 61672-1 standards,
C
type 1 according to the IEC 651 and IEC 61672-1 standards,
Z
type 1 according to the IEC 61672-1 standard.
<ENTER>
SPECTRUM windows with selection of the weighting filter
The characteristics of the filters are given in Appendix D. The selection of the required filter is made
with the <>, <> push-buttons. After pressing the <ENTER> push-button the user can confirm
the selection and close the window. The return to the INPUT list is made also after pressing the <ESC>
push-button but in this case the selection is ignored.
10.2.3 The 1/1 OCTAVE analysis band - BAND
In SVAN 953 instrument the 1/1 OCTAVE analysis is performed in so called AUDIO band, which
consists of ten octaves starting from 31.5 Hz and ending at 16 kHz. The BAND position is not accessible.
10.2.4 Activation of saving results of the 1/1 OCTAVE analysis in the logger’s file LOGGER
The RMS results from 1/1 OCTAVE analysis can be saved in the logger’s file of the instrument.
The enabling of 1/1 OCTAVE spectrum in the LOGGER file is made by placing ([√
√]) or replacing ([ ])
the special character in the displayed inversely line with the LOGGER text by means of the <>, <>
push-buttons.
In order to confirm the selection the user has to press the <ENTER> push-button. This confirmation
closes the SPECTRUM sub-list. The sub-list can be also closed after pressing the <ESC> push-button but
the settings made there are ignored.
Spectrum windows with disabled and enabled savings of 1/1 OCTAVE spectrum
10-3
SVAN 953 USER MANUAL
_
10.2.5 Selection of the result which triggers registration in logger in 1/1 OCTAVE
analysis - LOGGER TRIGGER
In SLM mode only the result coming from the RMS detector of the first profile (RMS(1)) is used
for triggering the measurement results registration in the logger of the instrument. The SOURCE position
in the LOGGER TRIGGER window is not accessible in that mode. However, in 1/1 OCTAVE analysis it is
possible to access mentioned above position and to make a selection. The results coming from the output
of 1/1 OCTAVE filters, starting from 125 Hz (125 Hz, 250 Hz, 500 Hz, 1.00 kHz, 2.00 kHz, 4.00 kHz,
8.00 kHz and 16.0 kHz), are available as well as RMS result from the first profile. Other LOGGER SETUP
settings are identical as for the SLM.
=>
...
LOGGER TRIGGER windows; the selection of the signal used for triggering
10.3 Display options in 1/1 OCTAVE analysis mode
The DISPLAY list is used for setting the various parameters, which are mainly dedicated
for the control of the display. The following sub-lists contain the elements that influence the presentation
of the results of 1/1 OCTAVE analysis:
DISPLAY MODES
enables one to select the mode of the presentation of 1/1 OCTAVE analysis;
DISPLAY SETUP
enables one to change the scale of the vertical and horizontal axis of the graphical
presentation, switch on and off the grid, select one of the available views of the
display and choose the type of the spectrum to be presented;
enables one to select and present the results of the analysis stored in the files
of the logger.
LOGGER VIEW
The DISPLAY MODES (path: MENU / DISPLAY / DISPLAY MODES) enables the user to switch
on or off the available modes of displaying the results of analysis. The activation is made by placing
and the deactivation by replacing the special character in the displayed inversely position
of the DISPLAY MODES sub-list by means of the <>, <> push-buttons. In order to confirm
the selection the user has to press the <ENTER> push-button. In order to change the presentation mode
to be switched on or off the user has to press the <> or <> push-buttons. The following presentation
modes are available: one-profile, SPECTRUM, 3 PROFILES, STATISTICS, LOGGER and FILE INFO.
The user can change the current presentation mode of the analysis results by means of the <>,
and <> push-buttons.
=>
=>
Main list, DISPLAY list and DISPLAY MODES window with available modes of presentation
Notice: The user can switch on ([√]) or off ([ ]) the available presentation modes
of the analysis results (SPECTRUM, 3 PROFILES, STATISTICS, LOGGER, FILE INFO) in the
DISPLAY MODES window (path: MENU / DISPLAY / DISPLAY MODES). One-profile mode cannot be
switched off. See Chapter dealing with DISPLAY list for the details.
10-4
SVAN 953 USER MANUAL
10.3.1 One-profile presentation mode in 1/1 OCTAVE analysis
In one-profile, the results are presented in the same way as in the case of the SLM mode.
The active profile is changed after each pressing of the <SHIFT> and <> or <> push-buttons.
The change of the result from the same profile is done by pressing the <>, <> push-buttons.
Displays in 1/1 OCTAVE analysis in one-profile mode
It is also possible to change the size of the characters in one-profile display mode by pressing
<ALT> and <> or <> push-buttons.
<ALT>+<>
Displays with the change of the size of characters in one-profile mode
10.3.2 Presentation of 1/1 OCTAVE analysis results - SPECTRUM
The basic view of the display presenting 1/1 OCTAVE spectrum was already discussed.
Additionally, in this view it is possible to shift the horizontal axis in relation to the vertical one using
the <SHIFT> and <>, <> push-buttons. After each pressing of these buttons the presented picture
is moved 10 dB down or up - respectively.
<SHIFT> + <
>
..
Displays in 1/1 OCTAVE analysis with the shifted horizontal axis in relation to vertical one
10.3.3 Three-profiles presentation mode in 1/1 OCTAVE analysis - 3 PROFILES
There is a slight difference in 3 PROFILES mode between the SLM and 1/1 OCTAVE analyser.
Namely, in order to inform the user about the current function of the instrument, the doted lines are used
in 3 PROFILES for the indication that the instrument does not work in the SLM mode. In the SLM mode,
the continuous lines are used.
a)
b)
3 PROFILES presentation mode with the doted lines stating the instrument does not work in SLM mode (a)
and the continuous lines in SLM mode (b)
In 3 PROFILES mode on the right side of the display the information about the weighting filter
(A, C, Z) and indicator of the detector time constant or indicator of linear RMS integration (S - Slow, F Fast,
10-5
SVAN 953 USER MANUAL
_
I -Impulse, L - Linear) are displayed. It is possible to change the view by pressing <ALT> and <> or <>
push-buttons. After that change on the left side of the display the scale can be observed, and the
information about the weighting filter and detector time constant are displayed in the first line below the
measurement results.
<ALT> + <>
Displays with the different 3 PROFILE presentation mode
10.3.4 Statistical presentation mode in 1/1 OCTAVE analysis - STATISTICS
In the STATISTICS mode it is possible to select the LN value using the <>, <> push-buttons.
The active profile is presented on the right side of the display. The indicator of the weighting filter
is displayed - in the fourth line. The LN corresponding to the current position of the cursor and the value
of the LN displayed down together with the units. When the STATISTICS mode of result’s presentation
is entered (the <>, <> push-buttons are used for this purpose) in order to change the active profile
the <SHIFT> and <> or <SHIFT> and <> push-buttons should be pressed.
<SHIFT>+<>
<SHIFT>+<>
Displays in 1/1 OCTAVE analysis with presentation of the statistical analysis in all profiles
The statistical analysis is also performed in 1/1 OCTAVE analysis. The results of this analysis,
performed for one of 1/1 OCTAVE bands selected by the cursor, are visible on the display after pressing
the <ENTER> push-button in the case when 1/1 OCTAVE spectrum was presented in the instrument.
The centre frequency of the filter for which the analysis was made is showed on the right side
of the display. The LN number corresponding to the cursor position, the LN value and the units are
presented on the bottom of the display. The LN value can be changed by pressing the <>, <> pushbuttons.
<ENTER>
1/1 OCTAVE spectrum and the statistical analysis performed for selected 1/1 OCTAVE band (here: 1 kHz)
It is also possible to examine 1/1 OCTAVE spectrum, calculated for the selected by the cursor LN
statistical level, after pressing once more the <ENTER> push-button. The LN value (e.g. L90) for which
the presented spectrum is given, the information about the TYPE of the spectrum (Aver - AVERAGED,
Inst - INSTANTANEOUS, MAX, MIN - path: MENU / DISPLAY / DISPLAY SETUP / SPECTRUM VIEW /
TYPE), the weighting filter (A, C or Z - path: MENU / INPUT / SPECTRUM / FILTER) and the real time
clock (e.g. 13:21) or the actual time of the recent measurement cycle in the case when the measurements
are performed are presented on the right side of the display.
The centre frequency of the band for which the analysis was made, the value at the cursor position
and the units are presented on the bottom of the display. On the left side of the display, the user can see
the graduation (scale) of the vertical axis. The effect of two consecutive pressings of the <ENTER> pushbutton in the case of 1/1 OCTAVE spectrum is given below.
10-6
SVAN 953 USER MANUAL
<ENTER>
<ENTER>
Displays with 1/1 OCTAVE spectrum, after entering the presentation of the statistical analysis results
performed for the selected 1/1 OCTAVE filter and after entering 1/1 OCTAVE spectrum of the LN
The centre frequency of the band can be changed by pressing the <>, <> push-buttons.
After two consecutive pressings of the <ESC> push-button, in the case when the LN spectra are
presented, the instrument returns to the presentation of 1/1 OCTAVE spectrum.
<ESC>
<ESC>
Displays with 1/1 OCTAVE spectrum of LN, after return to the presentation of the statistical analysis results
performed for the selected 1/1 OCTAVE filter and after return to the presentation of 1/1 OCTAVE spectrum
The statistical analysis and LN spectra calculation is also made for all TOTAL values of
1/1 OCTAVE analysis.
<ENTER>
<ENTER>
<ENTER>
<ENTER>
<ENTER>
<ENTER>
<
>
<
>
Presentation of the statistical analysis results performed for TOTAL results of 1/1 OCTAVE analysis
<ESC>
<ESC>
Displays after pressing <ESC> push-button in 1/1 OCTAVE spectrum of LN while TOTAL C value was
selected and after another pressing of <ESC> push-button - return to presentation of 1/1 OCTAVE spectrum
10-7
SVAN 953 USER MANUAL
_
10.3.5 Time history plot - LOGGER
In the LOGGER mode the user can see the time history plot with the results which are saved
in the logger file (in the case when the LOGGER x positions is switched on ([√
√]) in the PROFILE x sublists with the step set for all profiles in the LOGGER STEP position - path: MENU / INPUT /
MEASUREMENT RANGE / LOGGER STEP).
In this mode the user, after pressing the different push-buttons, can achieve the following results:
• <> or <> push-buttons - the change of the active profile
• <ALT> and <> or <ALT> and <> push-buttons - the change of the view type
• <ALT> and <> or <ALT> and <> push-buttons - the change of the result saved in a profile (PEAK,
MAX, MIN, RMS)
• <> or <> push-buttons - the change of the position of the cursor on the display
• <SHIFT> and <> push-buttons - the cursor is moved to the left corner of the display
• <SHIFT> and <> push-buttons - the cursor is moved to the right corner of the display
• <SHIFT> and <> push-buttons - the shift of the horizontal axis in relation to the vertical one; after
each pressing the presented picture is moved 10 dB up
• <SHIFT> and <> push-buttons - the shift of the horizontal axis in relation to the vertical one; after
each pressing the presented picture is moved 10 dB down
<>
<>
Displays in 1/1 OCTAVE analysis in LOGGER mode; registered results from all profiles
10.3.6 Basic data of the saved files - FILE INFO
In the FILE INFO window, the following information is presented:
• the file name
• the file size
• date of the registration of the main results (cf. App. B)
• time of the registration
• time (so-called ELAPSED TIME) during which the main results saved in the logger were measured.
The value presented in the ELAPSED TIME belongs to the interval [1, INTEGRATION PERIOD]
and depends on the moment and the way the measurements were stopped.
During the measurement (when the AUTO SAVE option is active), at the display the user can see
the name of the file being written.
FILE INFO window with the name of the file being written and with information about already saved file
10.3.7 Scaling the vertical axis of graphical presentation - DYNAMIC
The DYNAMIC (path: MENU / DISPLAY / DISPLAY SCALE / DYNAMIC) enables the user to select
the proper scaling of the graphical mode presentation. In the case of the vertical axis one can obtain
the double, four-times and eight-times expansion (as the default the vertical axis corresponds to 80 dB,
10-8
SVAN 953 USER MANUAL
after expansion it corresponds to 40 dB, 20 dB and 10 dB – respectively) using the <>, <> pushbuttons and pressing the <ENTER> for the confirmation.
<>
<>
<>
<>
1/1 OCTAVE analysis results presented with different value of DYNAMIC selected in DISPLAY SCALE
10.3.8 Scaling the horizontal axis of graphical presentation - X–ZOOM
The X–ZOOM (path: MENU / DISPLAY / DISPLAY SCALE / X–ZOOM) enables the user to change
the horizontal axis of the results of 1/1 OCTAVE analysis by means of the <>, <> push-buttons.
The following values are available in this mode: 3x, 4x, 5x and 6x.
In order to confirm the selection the user has to press the <ENTER> push-button, which closes
the sub-list. The sub-list can be also closed after pressing the <ESC> push-button but the settings made
there are ignored.
<>
<>
<>
<>
1/1 OCTAVE analysis results presented with different value of X–ZOOM selected in DISPLAY SCALE
Notice: The same result (the horizontal extension or narrowing of the analysis results)
can be achieved by pressing the <SHIFT> and <>, <> push-buttons while 1/1 octave spectrum is
presented on the display.
<SHIFT>+<
>
..
Displays in 1/1 OCTAVE SPECTRUM with different X–ZOOM parameter
10-9
SVAN 953 USER MANUAL
_
10.3.9 Switching on/off the grid in the graphical presentation - GRID
The GRID (path: MENU / DISPLAY / DISPLAY SCALE / X–ZOOM) enables the user to switch on
([√
√]) or off ([ ]) the grid in any graphical presentation placing or replacing the special character
in the displayed inversely line with the GRID text by means of the <>, <> push-buttons. In order
to confirm the selection the user has to press the <ENTER> push-button. This confirmation closes also
the DISPLAY SCALE window. The window can be also closed after pressing the <ESC> push-button but
the settings made there are ignored.
=>
<
>
=>
GRID option selection and switching it on and off
1/1 OCTAVE spectrum presented without and with GRID
10.3.10 View selection in 1/1 OCTAVE analysis - VIEW
The user can select the actually active view mode in the VIEW position of the SPECTRUM VIEW
sub-list (path: MENU / DISPLAY / DISPLAY SETUP / SPECTRUM VIEW / VIEW) by means of the <>,
<> push-buttons. In order to confirm the selection the user has to press the <ENTER> push-button,
which closes the sub-list. The sub-list can be also closed after pressing the <ESC> push-button but
the settings made there are ignored.
=>
<>
<>
<>
1/1 OCTAVE analysis results presented with different value of VIEW selected in SPECTRUM VIEW
Notice: The same result (change of the current view mode) can be achieved by pressing
the <ALT> and <>, <> push-buttons while 1/1 octave spectrum is presented on the display.
In so-called NORMAL view, on the right side of the display the user can see the text corresponding to
the value presented on the bottom of the display for the band selected with the cursor (1/1 RMS, 1/1 LEQ,
1/1 Max or 1/1 Min), the information about the type of the analysis result showed on display (Aver –
AVERAGED, Inst - INSTANTANEOUS, Max, Min - path: MENU / DISPLAY / DISPLAY SETUP /
SPECTRUM VIEW / TYPE), the weighting filter (A, C or Z - path: MENU / INPUT / SPECTRUM / FILTER)
and the real time clock (e.g.: 10:33) or the actual time of the recent measurement cycle in the case when
10-10
SVAN 953 USER MANUAL
the measurements are performed (e.g.: 00:13, 00:11, 00:09 - cf. displays below). On the left side of the
display the graduation (scale) of the vertical axis is given.
NORMAL view of the display with the results of 1/1 OCTAVE analysis actually performed
The FULL view looks nearly the same as the NORMAL one but the type of the analysis result showed
on the display and the clock are taken off.
The EXTENDED view looks the same as NORMAL one with the exception of the graduation (scale)
on the left side, which is not displayed.
10.3.11 Selection of the spectrum type for presentation - TYPE
The user can select the different 1/1 OCTAVE spectra to be visible on the display in the TYPE
window (path: MENU / DISPLAY / DISPLAY SETUP / SPECTRUM VIEW) by pressing the <>, <>
push-buttons. The following spectra are selectable: AVERAGED, INSTANTANEOUS, MAX or MIN.
<>
<>
<>
<>
Presentation of different 1/1 OCTAVE spectra
In the case when the AVERAGED or INSTANTANEOUS spectrum is selected the user can
additionally switch on ([√
√]) or off ([ ]) the presentation of MAX and/or MIN spectrum by placing or
replacing the special character in the displayed inversely line with the MAX or MIN text by means
of the <>, <> push-buttons.
In order to confirm the selection the user has to press the <ENTER> push-button. This confirmation
closes the SPECTRUM VIEW sub-list. The sub-list can be also closed after pressing the <ESC> pushbutton but the settings made there are ignored.
Displays with MAX and/or MIN spectrum switched on and off
10-11
SVAN 953 USER MANUAL
_
b)
c)
a)
Displays with MAX (a), MIN (b) or both, MAX and MIN (c) spectra presented together with averaged one
10.3.12 Presentation of logged 1/1 OCTAVE spectra - LOGGER VIEW
The spectra registered in the logger’s file can be presented on the display in the LOGGER VIEW
window (path: MENU / DISPLAY / LOGGER VIEW). These spectra are saved with the same step as
selected in the SLM profiles (see the description of the LOGGER STEP - path: MENU / INPUT /
MEASUREMENT SETUP/LOGGER STEP).
In order to display the registered in the logger’s file spectra the user has to select required logger
file in LOGGER VIEW window and press <ENTER>, select the spectrum presentation mode by pressing
<> push-button and then:
• press the <SHIFT> and <> push-buttons for the spectra registred later;
• press the <SHIFT> and <> push-buttons for the spectra registred earlier.
<SHIFT>+<
>
<SHIFT>+<
>
Displays with 1/1 OCTAVE spectra saved in the logger with 500 ms step
10-12