1
SVAN 106 User MANUAL
_
SVAN Vibration Meter
USER’S MANUAL
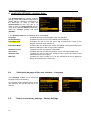
SVANTEK Sp. z o.o.
WARSAW, August 2012
1
SVAN 106 User MANUAL
_
Notice: This
user’s
manual
presents
the
software
revision
named
3.13.1
(cf. the description of the Unit Label position of the Instrument list). The succeeding software revisions
(marked with the bigger numbers) can slightly change the view of some displays presented in the text of the
manual.
2
SVAN 106 User MANUAL
_
CONTENTS
1.
INTRODUCTION
6
1.1. SVAN 106 main features
6
1.2. Accessories included
7
1.3. Accessories available
7
2. MANUAL CONTROL OF THE INSTRUMENT
2.1 Control push-buttons on the front panel
2.2 Input and output sockets of the instrument
3. SETTING THE INSTRUMENT
8
11
13
3.1. Basics of the instrument’s control
13
3.2. Powering of the instrument
16
3.3. Initial Setup of the instrument
17
3.4. Icons description
18
3.5. Memory organisation
19
4. FUNCTIONS OF THE INSTRUMENT – Function
4.1. Measurement functions of the instrument - Measurement Function
4.2. Instrument’s calibration – Calibration
21
21
22
4.3.1. Downloading and uploading TEDS data – TEDS
22
4.3.2. Calibration of the instrument channels – Channel x
22
4.3.3. Calibration by transducer's sensitivity – Calibr. By Sensitivity
23
4.3.4. Calibration by measurement – Calibr. By Measurement
23
4.3.5. History of the calibrations – Calibration History
25
4.3.6. Clear calibration records - Clear Calibr. History
25
5. MEASUREMENT PARAMETERS SETTING – Measurement
3
8
27
5.1 Selection of measurement parameters - General Settings
27
5.2 Setting the parameters for dose measurements – HAV/WBV Dosimeter
30
5.3 Setting parameters in a channels – Channels Setup
31
5.3.1 Assignment channels for the accelerometer axis - Channel/Axis Mapping
32
5.3.2 Setting parameters for channels – Channel x
32
5.4 Setting the vector parameters – Vector Setup
34
5.5 Setting of the logging functionality – Data Logging
34
5.6 The results history logging
35
5.6.1 Data logger programming – Logger Setup
35
5.6.2 Results selection – Logger Results
37
5.6.3 Logger trigger parameters setup – Logger Trigger
38
5.6.4 Event recording setup – Event Recording
41
5.6.5 The marker setup – Marker Setup
42
SVAN 106 User MANUAL
•
•
5.7 Wave recording
43
5.8 Measure triggering parameters selection – Measure Trigger
44
5.9 Settings whole body measurements with the use of seat accelerometer – “SEAT”
46
5.10 The alarm trigger setting– Alarm Trigger
47
5.11 Programming the instrument’s internal timer – Timer
47
DATA AVAILABLE ON THE DISPLAY – Display
50
6.1 Selection of the modes of measurement results presentation - Display Modes
50
6.1.1 Main presentation mode
51
6.1.2 Setting the result presentation parameters – Plot Scale
56
6.2 Setting the scale of result’s presentation– Results Scale
57
6.3 Setting the display brightness and power saver- Screen
57
SAVING THE MEASUREMENT RESULTS – File
59
7.1 Saving files in the instrument’s memory or external memory
59
7.2 Managing the files saved in the internal and external memory – File Manager
62
7.2.1 Setting the directory for saving files – Set Working Directory
63
7.2.2 Creating new catalogue and new file
64
7.2.3 Deleting all files from Internal memory – Delete All
64
7.2.4 Merging result and setup files memory – Defragmentation
65
7.2.5 Opening file/catalogue – Open
66
7.2.6 Deleting file/catalogue – Delete
66
7.2.7 Copying file/catalogue – Copy
66
7.2.8 Moving file/catalogue – Move
67
7.2.9 Renaming file/catalogue – Rename
67
7.2.10 Information about file/catalogue – Info
68
7.3 Managing the setup files – Setup Manager
7.3.1 Saving the setup files
•
•
4
_
68
68
7.4 Controlling the data storing in the instrument’s memory - Save Options
69
7.5 Options for setup files - Setup Options
71
SETTINGS OF THE INSTRUMENT PARAMETERS – Instrument
72
8.1 Selection of keyboard modes – Keyboard
72
8.2 Setting parameters of the I/O port - Multifunction I/O
73
8.3 Checking the powering of the instrument – Power Supply
74
8.4 Programming the instrument’s internal Real Time Clock – RTC
75
8.5 Activation the remote control error confirmation - Remote Control
75
8.6 Transducer's compensation activation – Transducers
76
8.7 Checking the specification of the instrument - Unit Label
76
AUXILIARY SETTINGS – Auxiliary Setup
77
SVAN 106 User MANUAL
•
5
_
9.4. Setting the language of the user interface – Language
77
9.5. Return to the factory settings – Factory Settings
77
9.6. Locking the menu - Instrument Lock
78
9.7. Setting the scope of instrument's functions — Instrument Mode
78
9.8. Reference signal in vibration measurements - Reference Levels
79
9.9. User filter setting – User Filters
80
9.10.
Selection of the Vibration units - Vibration Units
80
9.11.
Warnings selection – Warnings
80
1/1 AND 1/3 OCTAVE ANALYSER
83
10.1.
Selection of 1/1 Octave or 1/3 Octave analysis mode
83
10.2.
Setting the parameters of 1/1 Octave and 1/3 Octave analysis -
83
10.3.
Activation of saving of 1/1 Octave and 1/3 Octave analysis results in the logger’s file Logger Results
84
10.4.
Selection of the 1/1 Octave and 1/3 Octave bandpass results as triggering source
84
10.5.
Display options in 1/1 Octave and 1/3 Octave analysis mode
85
10.6.
Presentation of 1/1 Octave and 1/3 Octave analysis results
85
10.7.
Setting the scale of the spectrum results presentation – Spectrum Scale
86
10.8.
Setting the parameters of the spectrum presentation - Spectrum View
87
10.9.
Selection of the channels for presentation – Multichannel View
88
10.10. Setting the parameters for total values – Total Values
88
10.11. Setting user filter coefficients for 1/1 Octave and 1/3 Octave analysis – User Filters
89
SVAN 106 User MANUAL
_
1. INTRODUCTION
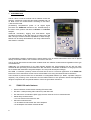
The SV 106 is a new six-channel human vibration meter and
analyser. Instrument meets ISO 8041:2005 standard and it is
an ideal choice for measurements according to ISO 26311,2&5 and ISO 5349.
pocketUsing computational power of its digital signal
processor the SVAN 106 instrument can, simultaneously to
the meter mode, perform real time 1/1 Octave or 1/3 Octave
analysis.
Advanced time-history logging and time-domain signal
recording (according to the ISO 2631-5) to built-in Micro SD
flash card give almost unlimited capabilities of data storage.
Results can be easily downloaded to PC using USB interface
and SvanPC+ software.
The Whole-Body vibration measurement is easier thanks to SV 38 seat-accelerometer which can be placed
directly on the seat-cushion, floor or fixed to the back of the seat.
The SV 50 set with triaxial accelerometer enables Hand-Arm vibration measurements regardless of the type
of evaluated tool.
Additionally, for measurements of very high impulse vibration the special adapter SA 55, with low pass
mechanical filter protecting accelerometer from DC shift effect, is available. Evaluation of the grip force will
be accessible with dedicated “integrated adapter” SV 105 (under development stage).
Fast USB 1.1 interface (12 MHz) creates real time link for the PC "front-end" application of the SVAN 106
instrument. The measurement results can be downloaded to PC using all mentioned above interfaces.
The instrument is powered from four AA standard or rechargeable batteries (i.e. NiMH - separate charger is
required). The powering of the instrument from the USB interface is also provided. Robust and lightweight
design accomplishes the exceptional features of this new generation instrument.
1.1.
6
SVAN 106 main features
•
Human Vibration measurements meeting ISO 8041:2005,
•
ISO 2631-1,2&5 (including VDV and MTVV) and ISO 5349
•
Six channels for acceleration (IEPE type) and two channels for force measurements
•
Whole-Body measurements:
- Low-cost seat accelerometer SV 38V
•
Hand-Arm measurements:
- SV 50 triaxial accelerometer with set of adapters
- SA 55 adapter with triaxial mechanical filter
SVAN 106 User MANUAL
_
- SV 105 integrated triaxial accelerometer adapter including grip force sensor (under development)
•
Time-domain signal recording (meeting ISO 2631-5)
•
1/1 octave and 1/3 octave spectrum parallel calculations,
•
Advanced data logger including spectral analysis
•
Micro SD flash card for mass data storage
•
USB 1.1 Client interface
•
Integration time programmable up to 24 h
•
SvanPC+ software for easy instrument setup and data download
•
Easy in use, user friendly interface with colour display
•
Pocket size (140 x 83 x 33 millimetres)
•
Weight only 390 grams including batteries
1.2.
Accessories included
The SV 106 set consist of the following parts:
•
SV 106
instrument with 4 AA batteries or 4 rechargeable AA batteries installed.
•
SC 56
mini USB 1.1 cable (typical 2m)
•
SC 118
LEMO 4-pin to LEMO 5-pin connector
•
SV 38V
triaxal accelerometer for Whole—Body measurements (MEMS type)
•
SV 105
integrated triaxal Hand-Arm adapter with grip force sensor (under development)
1.3.
7
Accessories available
•
Power supply unit with USB Connector
•
SC 38
Cable used to connect the triaxial accelerometer with the SV106 (4 pin Microtech to
LEMO 4 pin (typical 2.7 m))
•
SA 50
Hand-Arm measurement adapter, "shaped base" (for SV 3023M2 accelerometer)
•
SA 51
Hand-Arm measurement adapter, "flat base" (for SV 3023M2 accelerometer)
•
SA 52
Hand-Arm measurement adapter, "direct" (for the SV 3023M2 accelerometer)
•
SC 14
LEMO 5 pin to LEMO 5 pin extension cable (10 m)
•
SA 55
adapter with low pass mechanical filter
•
SV 39A\L
Seat Accelerometer (including SV 3143M1 and SC 38 cable)
•
SV 50
SA 51, SA 52
set for Hand-Arm measurement (Dytran accelerometer 3023M2; adapters SA 50,
•
SV 111
vibration calibrator (100 rad/1ms , 500 rad/10ms , 1000 rad/10ms )
-2
-2
-2
SVAN 106 User MANUAL
_
2. MANUAL CONTROL OF THE INSTRUMENT
The control of the instrument is developed in the fully dialogue way. The user can operate the instrument by
selecting the proper position from the Menu list. Thanks to that, the number of the control push-buttons of
the instrument is reduced to nine.
2.1 Control push-buttons on the front panel
On the front panel of the instrument, there are located the
following control push-buttons:
•
<ENTER>, (<Menu>), [<Save>],
•
<ESC>, (<Cal.>), [<S/P>],
•
<Shift>, [Markers]
•
<Alt>, [Markers]
•
<5
5>,
•
<3
3>,
<4
4>,
•
•
•
<6
6>,
<Start/Stop>.
The name given in (...) brackets denotes the second push-button function which is available after pressing it
in conjunction (or in sequence) with the <Shift> push-button. For the first two push-buttons the name given
in square brackets […] denotes also the third push-button function which is available after pressing it in
conjunction (or in sequence) with the <Alt> push-button.
<Shift>
The second function of a push-button (written in red colour on a push-button) can be
used when the <Shift> push-button is pressed. This push-button can be used in two
different ways:
• as Shift in the keyboard (e.g. while typing the filename); both <Shift> and the
second push-button must be pressed in parallel;
• as 2nd Fun; this push-button can be pressed and released before pressing the
second one or pressed in parallel (while operating in “2nd Fun” mode, see the
following notice) with the second push-button.
The <Shift> push-button pressed in conjunction with the <Alt> one enables the user to
enter the Markers on the plots during the measurement.
<Alt>
This push-button enables one to choose the third push-button function in case of
[<Save>] and [<Pause>] push-buttons. In order to select the third function the user must
press the <Alt> and the second push-button simultaneously.
Notice: The simultaneous pressing of the <Alt> and <Start/Stop> push-buttons switches the
instrument on and off.
<Start/Stop>
8
This push-button enables one to start the measurement process, when the instrument is
SVAN 106 User MANUAL
_
not measuring or to stop it, when the instrument is in course of the measurement. It is
also possible to set such mode of this push-button, in which in order to start or stop the
measurements the user has to press it simultaneously with the <Shift> one.
Notice: The change of the <Start/Stop> push-button mode is performed in the
Keyboard Settings window of the Instrument list (see description of the Instrument list).
<ENTER>
This push-button enables one to enter the selected operation mode or to confirm the
control options. Some additional functions of this push-button will be described in the
following chapters of this manual.
(<Menu>)
This push-button (pressed together with the <Shift> one) enables the user to enter the
main list containing six sub-lists: Function, Measurement, Display, File, Instrument,
Auxiliary Setup. Each of the mentioned above sub-lists consists of the sub-lists,
elements and data windows. These main sub-lists will be described in details in the
following chapters of the manual. Double pressed <Menu> push-button enters the list
containing eight last opened sub-lists. It often speeds up the control of the instrument as
the user has the faster access to the frequently used sub-lists.
[<Save>]
This push-button (pressed together with the <Alt> one) enables the user to save
measurement results as a file in the internal instrument’s memory or on the SD-card.
<ESC>
This push-button closes the control lists, sub-lists or windows. It acts in opposite to the
<ENTER> push-button. When the window is closed pressing the <ESC> push-button,
any changes made in it are ignored in almost all cases.
([Cal.])
This push-button (pressed together with the <Shift> one) enters the Calibration sub-list
in which the user can enter one of the available sub-lists (Calibr. by Sensitivity,
Calibr. by Measurement, Last Calibration and Clear Calibr. History).
[<S/P>]
This push-button enables one to jump to the Setup Manager window or to break the
measurement process temporarily.
<3
3>, <4
4>
These push-buttons enable one, in particular, to:
• select the column in a multi column parameter list;
• select the parameters value in an active position (e.g. filter Z, A or C, Integration
period: 1s, 2s, 3s, … etc.);
• control the cursor in Spectrum and Logger modes of result’s presentation;
• select the position of the character in the text edition;
• activate markers 2 and 3
• speed up the changing of the numerical values of the parameters when pressed and
hold.
(<3
3>, <4
4>)
The <3
3>, <4
4> push-buttons pressed in conjunction (or in sequence) with the <Shift>
enable one, in particular, to:
9
SVAN 106 User MANUAL
_
• •
speed up the changing of the numerical values of the parameters (i.e. the step is
increased from 1 to 10 in the setting of Start Delay - path: Menu / Measurement /
General Settings / Start Delay);
• jump to the end or first character of edited text line in the text edition modes,
[<3
3>, <4
4>]
The <3
3>, <4
4> push-buttons pressed in conjunction (or in sequence) with the <Alt>
enable one, in particular, to:
• select the parameters value in the multi column list,
• insert or delete a character in the text edition modes.
<5
5>, <6
6>
The <5
5>, <6
6> push-buttons enable one, in particular, to:
• select lines in the list;
• select the proper character from the list in the text edition mode;
• activate markers 1 and 4
(<5
5>, <6
6>)
The <5
5>, <6
6> push-buttons pressed in conjunction (or in sequence) with the <Shift>
enable one, in particular, to:
• change the relation between the Y-axis and X-axis of all plots presented on the
screen
[<5
5>, <6
6>]
The <5
5>, <6
6> push-buttons pressed in conjunction (or in sequence) with the <Alt>
enable one, in particular, to:
• change the mode of result’s presentation;
− programme the Real Clock (RTC) and Timer;
[Info]
The <Info> push-button (simultaneous pressing the
<3
3>, <4
4> push-buttons) opens the window with the
help information in the measurement display modes.
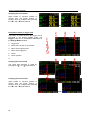
[Markers]
The Markers enable the user to mark special events, which occurred during the
performed measurements (i.e. the airplane flight, the train’s drive etc.). Event function is
active only when Logger is active. In order to activate the markers the logger has to be
switched on (path: <Menu> / Measurement / General Settings / Logger Mode= Logger)
and one or more logger results (PEAK, P–P, MAX, RMS, VDV) in profiles have to be
activated (path: <Menu> / Measurement / Data Logging / Logger Results).
In order to enter the marker the user must press <Shift> and <Alt> pushbuttons simultaneously during the measurement. Then four available
markers appears on the screen. To choose marker number 1 the user must
press <5
5> push button (number 2 - <3
3>, number - 3 <4
4> and number 4 <6
6>).
The markers disappear automatically and chosen marker is activated (after
pressing <Shift> + <Alt> again active marker number will be highlighted). In
order to switch off the marker, the user has to pressing <Shift> + <Alt> and
press the arrow push-button, which refers to the marker to be switched off.
10
<Shift> / <Alt>
<5
5>
SVAN 106 User MANUAL
_
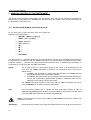
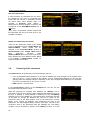
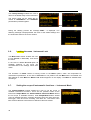
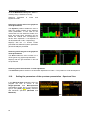
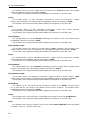
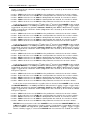
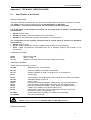
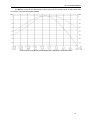
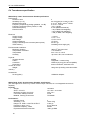
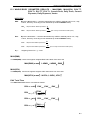
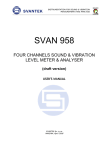
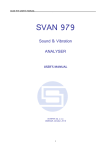
The current state of the markers is indicated in the logger’s file (cf. App. B
for details) and can be used to show them using dedicated presentation
software.
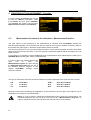
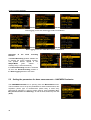
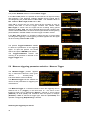
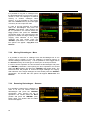
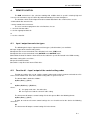
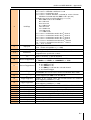
The exemplary presentation of the markers on the time history plot is shown
below (to view a plot with markers the user has to transfer data to the
proper software).
80
70
60
50
Leq
40
Marker 1
Marker 2
30
Marker 3
Marker 4
20
13:30:00 13:30:09 13:30:17 13:30:26 13:30:35 13:30:43 13:30:52
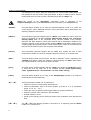
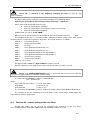
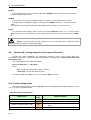
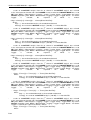
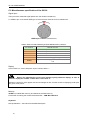
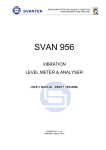
2.2 Input and output sockets of the instrument
Top cover of the instrument
The measurement inputs are placed on the top cover of the
instrument: two 5-pins Lemo compatible sockets type
ENB.0B.304 for Channels 1–3 and Channels 4-6, all with
IEPE power supply for the accelerometers.
11
SVAN 106 User MANUAL
_
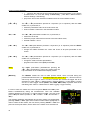
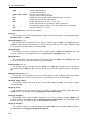
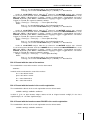
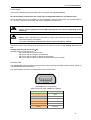
Bottom cover of the instrument
In the bottom cover there are two sockets, placed from the
right to the left as follows: USB Device 1.1 interface and multi
purpose input / output socket I/O.
The USB Device 1.1 interface is the serial interface working with 12 MHz clock. Thanks to its speed, it is
widely used in all PC. In the instrument, the standard 4-pins socket is used described in details in
Appendix C.
The additional multi purpose input / output socket, called I/O, is a two-pins LEMO socket. On this socket, in
the case when the Analogue Output functionality is selected, the signal from the input of the analogue /
digital converter (before the correction) is available. This signal can be registered using magnetic recorder or
observed on the oscilloscope. The Digital Input as another functionality serves as the external trigger, while
the Digital Output is used to generate the trigger pulse or alarm pulse from the instrument.
Notice: Switch the power off before connecting the instrument to any other device (e.g. a
printer or a Personal Computer).
12
SVAN 106 User MANUAL
_
3. SETTING THE INSTRUMENT
In order to perform the measurements using the instrument the user has only to plug-in the proper
transducer and to switch the power on.
3.1.
Basics of the instrument’s control
The instrument is controlled by means of nine push-buttons of the keyboard. Using these push-buttons one
can access all available functions and change the value of all available parameters. The functions are
placed in the system of lists and sub-lists.
The instrument's menu consists of different type of windows, which may be: main menu list, sub-menu list,
option list, parameter list, text editor window, information window and file manager window with file
command list.
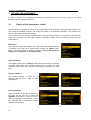
Main menu
The main list contains the headers of six lists, which also contain sub-lists
or positions. The main list is opened after pressing the <Menu> pushbutton. This list contains the following sub-lists: Function, Measurement,
Display, File, Instrument and Auxiliary Setup.
Recent Items list
The double pressing of the <Menu> push-button opens the list of recently
accessed menu items. Such solution enables one to access the most
frequently used lists quickly, without the necessity of passing the whole
path.
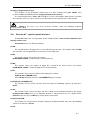
Position selection
The desired position in menu list is
selecting with the use of <5
5> or <6
6>
push-buttons.
<6
6>
Entering position
After the selection of the desired position in
the menu list, the user has to press the
<ENTER> push-button in order to enter it.
After this operation new sub-menu, option
list, parameter list or information window
appears on the display.
13
<EN>
SVAN 106 User MANUAL
_
List of parameters
The parameter list contains parameters for which the user may select the
value from the certain range. Next pressing of the <ENTER> push-button
enables one to access mentioned above sub-lists.
The desired position of a list is accessed after pressing the <5
5> or <6
6>
push-button.
The change of the value in a selected position is performed by the <3
3>
or <4
4> push-buttons (or pressed together with the <Shift> one).
If the parameter has numerical value the user may to speed up it’s selection keep pressing the <3
3> or <4
4>
push-buttons (or pressed together with the <Shift> one) longer than 1 second. In this case parameter starts
to change automatically until the user releases the pressed buttons.
The user may change the numerical parameter value with the step (usually 10, 20) by means of the <3
3> or
<4
4> push-buttons pressed together with the <Alt> one.
Option list
The option list consists of different options, from which the only one may be
selected. The selection of the option is performed next way. The user has to
highlight the desired option by means of <5
5> or <6
6> push-buttons and
then press the <ENTER> one. This option became active and the list is
closing. When the user enters this list again the selected option will be
marked.
Matrix of parameters
When the list of parameters consists of more than one column the user may
change:
column by means of <3
3> or <4
4>
line in the same column by means of <5
5> or <6
6>
value in a selected position by means of <3
3> or <4
4> with <Alt>
all values in the same column by means of <5
5> or <6
6> with <Shift>
all values in the same line by means of <3
3> or <4
4> with <Shift>.
Complex parameters
Some parameters like Start Hour, Start Day
etc. are complex (consists of more that one
value field). The selection of values for such
parameters is performed in a special window,
which is opened with the <3
3> or <4
4> pushbuttons. In the special window the value is
selected with the use of <3
3>, <4
4> or <5
5>,
<6
6> push-buttons and then is confirmed by
<ENTER>.
14
SVAN 106 User MANUAL
_
In all cases the <ENTER> push-button is used for the confirmation of the
selection in a position and for closing the opened sub-list.
The sub-list is closed ignoring changes made in a sub-list by pressing the
<ESC> push-button.
Information window
Some windows inform the user about the state of the instrument, available
memory, not existing files or loggers, standards fulfilled by the unit, etc. In
order to scroll the list, the user has to use the <5
5> or <6
6> push-button. In
order to close such window, the user has to press the <ESC> push-button.
Text edition window
There are also windows, in which the user may edit some text (i.e. the
name of the file, the header for the printed reports from the measurements).
This window consists the help information to guide the user how to edit the
text. The displayed inversely character may be edited.
One can select the position of the character in the edited text using the
<3
3>, <4
4> push-buttons.
The available ASCII characters can be changed using the <5
5> or <6
6>
push-button. The subsequent digits, underline, big letters and space
appear on the display in the inversely displayed position after each
pressing of the mentioned above push-buttons.
One can insert or delete the position in the edited text using the <3
3>,
<4
4> push-buttons pressed together with the <Alt> one.
Help information
In the most windows the last line or several lines
consist the help information. It informs the user
how to select or modify the parameter’s value,
change the character in the text line etc.
15
<4
4>
SVAN 106 User MANUAL
_
Not active parameters
If some functions or parameters are not active,
the positions in the menu or parameter lists
linked with this function or parameter became
not active (their colour became grey). For
example, if Dosimetr (path: <Menu> /
Measurement / General Settings / Dosimetr: Off)
is switched off the HAV/WBV Dosimetr line is
not active!
Grey colour of parameter position means that
this parameter has only one value and it is not
possible to change it.
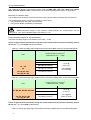
Simple and advanced menu modes
There are two instrument modes, which define
scope of available functions: Simple Mode and
Advanced Mode. These modes can be
selected in the Instrument Mode window of
Auxiliary Setup menu. Simple Mode defines
basic
instrument
functions,
while
Advanced Mode defines full scope of functions.
Many window thus have different views. Below
is an example of Measurement window for
simple and advanced modes.
3.2.
..
Powering of the instrument
The SVAN 106 can be powered by one of the following sources:
• Four AA standard internal batteries. In the case of alkaline type, fully charged set can operate more
than 12 h (6.0 V / 1.6 Ah). Instead of the ordinary, four AA rechargeable batteries can be used (for
charging them the separate charger is required). In this case, using the best NiMH type, the operation
time can be increased up to 16 h (4.8 V / 2.6 Ah)
• USB interface – 500 mA HUB
In the Power Supply window of the Instrument list one can see the
information about the power source.
When the instrument is powered from batteries, the “Battery” icon is
presented on the top of the display. When voltage of the batteries is too low,
the icon is flashing or during attempt of switching on the Low Battery
message occurs on the display for 2 seconds and the instrument switches
off by itself. To change the batteries the user has to switch off the
instrument, take off the black bottom cover of the instrument, unscrew
battery cover, change the batteries and reassemble the parts of the
instrument. The fully charged battery ensures more than 12 hours of the
continuous work of the instrument (with the backlight off). The battery
condition can be checked by means of the Battery function. It is also
16
SVAN 106 User MANUAL
_
presented continuously on the display by means of the “Battery” icon.
When there is a connection to the USB interface (USB Device socket is
connected by means of the cable to a PC), the “Computer” icon is
presented on the top of the display and in the Battery window, there is the
USB Power: 0.00V message.
Notice: In the case when “Battery” icon is red, it is strongly recommended to use as soon as
possible the external power adapter or USB interface. In the other case the instrument after a
while will be switched off automatically!
The saving of the internal source of the instrument’s power can be achieved by means of reducing the
brightness of the screen when possible. The settings of Brightness and power saver function may be done
in the Screen Setup window (path: <Menu> / Display / Screen).
3.3.
Initial Setup of the instrument
Switching the instrument on
To switch the power on the user should press the <Alt> and <Start/Stop>
push-buttons in parallel. The instrument passes the self-test after switching
on (in this time the producer and the name of the instrument is displayed on
the display) and then it enters the Select Setup window. This window
enables one to select predefined setup for specific measurements. To ignore
the selection one should press <Esc> push-button.
After selection or skip the predefined setup the unit has to warm-up during
one minute and then the measurement screen with two results appears.
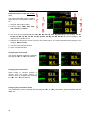
Starting measurement
To start the measurements the user has to
press the <Start/Stop> push-button. The
result of the measurement is displayed with
the unit of the measurement in so-called
two profile mode. Two results mode is
always available for most Functions of the
instrument.
<St>
Presentation modes
The results of the measurements can be
also presented in 6 Channels or
3 Profiles modes. In these modes the
results for six channels or 3 profiles are
presented on the screen. The user can
switch the presentation modes by means
of <Alt> and <5
5>, <6
6> push-buttons
pressed simultaneously.
17
<Alt/6
6>
SVAN 106 User MANUAL
_
Default settings measurements:
The default settings (set up by the producer) for the profiles of all channels are as follows:
−
signal type: Type: IEPE;
−
weighting filter: Filter: Wd;
−
type of the RMS detector: 1.0s;
−
dose meter: 1-3 Dosimeter: WBV; 4-6 Dosimeter: HAV.
The user can change all mentioned above settings using Measurement list. The instrument remembers all
changes. The return to the default settings (set up by the producer) is possible after the execution of the
Factory Settings position available in the Auxiliary Setup list.
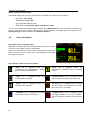
3.4.
Icons description
Description of the instrument state
Additional information about the instrument’s state is given by means
of the icon’s row visible in the top of the display.
The type of measurement function and the measurement mode (LM,
DLM, 1/1 and 1/3 etc.) as well as RTC is also displayed in the same
line together with icons.
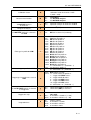
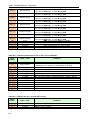
The meanings of the icons are as follows:
“play” icon is displayed when the
instrument is the measurement is started
and executed the measurement.
“plug” icon is displayed when the
instrument is powered from the external
source.
.
“stop” icon is displayed
measurement is stopped.
18
the
“Internal memory” icon is displayed when
internal memory is assigned for file saving.
“pause” icon is displayed when the
measurement is paused.
“SD Card” icon is displayed when external
SD card memory is assigned for file saving.
Micro SD card is connected.
“computer” icon is displayed when there
is the USB connection with the PC.
“Trigger Level +” icon is displayed when
the trigger condition is set up to „Level+”.
The icon appears alternately with the „play”
icon.
when
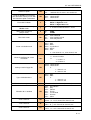
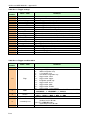
SVAN 106 User MANUAL
_
“curve” icon is presented when the current
measurement results are logged in the
instrument’s logger file.
“Trigger Level –“ icon is displayed when
the trigger condition is set up to „Level-”.
“arrow up”
icon is displayed when
overload appears.
“Trigger Slope +” icon is displayed when
the trigger condition is set up to „Slope+”.
“arrow down” icon is displayed when
underrange appears.
“Trigger Slope –“ icon is displayed when
the trigger condition is set up to „Slope-”
“tone” icon is displayed during wave
recording and event recording.
“Alt” icon is displayed when the <Alt>
push-button is pressed.
“clock” icon is displayed when timer is
On. Is active when the instrument is waiting
for the measurement start up. When the
measurement start up is close, the icon
change its colour to green and stats to
blink.
“battery” icon is displayed when the
instrument is powered from the batteries.
Icon corresponds to the batteries state
(three, two, one or none vertical bars in side
of the icon). When voltage of batteries is too
low, the icon became red.
“Shift” icon is displayed when the <Shift>
push-button is pressed.
3.5.
Memory organisation
All available measurement results as well as measurement and device settings can be stored in the internal
FLASH type memory of the instrument (16 MB) or in the external Memory (SD Card). Logger, wave and
event results can be save only in the external Memory.
The SD Card external memory is activated automatically after insertion of the card. The SD Card memory is
organised as standard memory with directories and sub-directories. It is possible to create and to delete the
directory.
The content of each memory type can be checked with the help of the File Manager or Setup Manager
function of the File menu.
The File Manager is used for checking the
contents of the memory and make
operation on result and logger files such as:
open, delete, copy, move, rename, create
new files or catalogues and display file and
catalogue information.
<ENT>
19
SVAN 106 User MANUAL
_
Memory selection
To change the memory type one should
press the <3
3> push-button in the
File Manager window, select the memory
type by means of the <5
5>, <6
6> pushbuttons and press the <4
4> one.
<3
3>
The file are saved in the Memory and in the catalogue which was set up as a working. The working Memory
type is displayed as the icon in the left position of the icon line.
“Internal” memory icon is displayed when internal memory is
saving.
assigned for file
“SD Card” icon is displayed when external SD card memory is assigned for file
saving. Micro SD card is connected.
The working directory is described in the bottom line of the File Manager
window.
To change the working directory and/or working memory one should select
the Memory type and in case of SD Card the desired directory and press
the <ENTER> push-button. After the new window is opening one should
select the Set Working Directory position and press the <ENTER> pushbutton again. The icon on the upper line and the directory path on the
bottom line will be changed accordingly. Same algorithm is applied for
directory changing for SD Card memory.
There are two options for storing result data in the internal or external memory. One option is to press
<Save> push-button right after the measurement performance. Another option is to create <New File> in the
File Manager.
After pressing the <Save> push-button the Save Results window appears.
After pressing the <Save> push-button the
Save Results window appears. In the
Save Results window the user can give the
name for the result file or choose automatic
name generation option.
<Save>
The Setup files can be stored also by means of <S/P> push-button and creating the <New File> in the
Setup Manager list. The logger, wave and event files are created automatically in the assigned directory on
the external memory drive.
20
SVAN 106 User MANUAL
_
4. FUNCTIONS OF THE INSTRUMENT – Function
In order to select the Function list one has
to press the <Menu> push-button, select
the Function text and press <ENTER>.
The Function list contains two elements:
Measurement Function and Calibration.
<ENT>
4.1.
Measurement functions of the instrument - Measurement Function
The main function of the instrument is the measurement of Vibration level (Level Meter) meeting the
ISO 8041:2005 standard. The instrument can also be used for the long-term vibration monitoring using for
this purpose the huge logger, in which the measurement results are stored.
The user may also use 1/1 and 1/3 octave analysis functions. These functions broaden the main Level Meter
functions of the instrument, because 1/1 and 1/3 analysis is performed together with all calculations of Level
Meter functions.
In all functions it is possible to perform additionally dose measurements. Dose parameters are setting up in
HAV/WBV Dose window (path: <Menu>/ Measurement).
In order to select the required function the
user
has
to
enter
the
Measurement Function list. After entering
the Measurement Function list, the set of
the available functions appears on the
display: Level Meter. Currently active
function is marked.
<ENT>
The type of measurement function and the measurement mode is displayed at the upper line of the screen:
- LM
- 1/1
- 1/3
Level Meter,
1/1 Octave,
1/3 Octave,
- DLM
- D1/1
- D1/3
Dose & Level Meter,
Dose & 1/1 Octave,
Dose & 1/3 Octave.
Optional functions that broadening the applications of the instrument can be install. These options can be
supported by the producer or purchased later.
Notice: It is not possible to change the measurement function during the measurements. The
instrument displays in this case for about 3 seconds the text: “Measurement in Progress”. In
order to change the mode of the instrument the measurement must be finished!
21
SVAN 106 User MANUAL
4.2.
_
Instrument’s calibration – Calibration
The instrument is factory calibrated with the
supplied accelerometers. In case of using
other transducers the calibration of the
measurement channels has to be done.
Periodic
calibration
of
standard
accelerometers is also required. In order to
select a calibration function the user has to
enter the Calibration sub-list.
<ENT>
The Calibration list consists of six positions: Channel 1, Channel 2 … Channel 6 which are used to
perform the calibration of each channel of the unit.
4.3.1.
Downloading and uploading TEDS data – TEDS
If accelerometer with new TEDS system is connected before switching the instrument on the TEDS data are
downloading automatically. TEDS data usually include: serial number, producer name, calibration factor, etc.
The TEDS position enables the user to
Download TEDS Data,
when
accelerometer
is
connected
during
instrument’s working session. It enables
also to Upload TEDS Data from the
instrument to the accelerometer’s TEDS
memory - calibration results, performed by
user.
4.3.2.
<ENT>
Calibration of the instrument channels – Channel x
The Channel x sub-list consists of three
positions: Calibr. By Sensitivity, Calibr.
By Measurement, which are used to
perform
the
calibration
and
Calibration History used for checking the
parameters of the previous calibrations.
<ENT>
Notice: The calibration factor is always added to the results in the Level Meter, 1/1 Octave,
1/3 Octave, FFT and other modes.
Notice: The calibration level and the calibration result is expressed in different units depending
on the settings of the instrument. The metric or non-metric Vibration units are set in the
Vibration Units (path: <Menu> / Auxiliary Setup / Vibration Units). Additionally, the linear or
logarithmic units are set in the Display Scale (path: <Menu> / Display / Display Scale).
22
SVAN 106 User MANUAL
_
Notice: It is not possible to calibrate the instrument during the execution of the measurements.
It is possible to open different lists and sub-lists but the positions in these lists are not displayed
inversely and so - not accessible. The “play” icon indicates that the instrument is in the
measurement process. In order to change the sensitivity the measurement must be finished!
4.3.3.
Calibration by transducer's sensitivity – Calibr. By Sensitivity
The calibration by the accelerometer’s sensitivity introduction can be done
in the following way:
1. Select this type of the calibration (highlight the Calibr. By Sensitivity
text) from the Calibration sub-list and press the <ENTER> push-button.
2. Set the sensitivity of the accelerometer taken from its calibration
certificate using the <3
3>, <4
4> push-buttons (or combination of the
<Shift> and <3
3>, <4
4> push-buttons).
The calibration factor is calculated, after pressing the <3
3>, <4
4> push-2
buttons, in the relation to 10.0 mV / ms . For the sensitivity of the
-2
accelerometer higher than 10.0 mV / ms the calibration factor is negative.
-2
For the sensitivity of the accelerometer lower than 10.0 mV / ms
calibration factor is positive.
the
The lowest applicable value of the sensitivity to be introduced is equal to
-2
10.0 µV / ms (it conforms to the calibration factor equal to 60.0 dB) and the
-2
highest one – 10.0 V / ms (calibration factor equal to -60.0 dB).
In order to save the selected calibration factor the user has to press <ENTER>. In order to return to the
Calibration sub-list the user has to press the <ESC> push-button.
4.3.4.
23
Calibration by measurement – Calibr. By Measurement
SVAN 106 User MANUAL
_
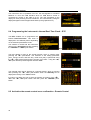
The calibration by measurements can be done in the following way:
1.
Select the calibration by measurement (highlight the Calibr.
By Measurement text) from the Calibration sub-list and press the
<ENTER> push-button.
2. Select filter: for hand-arm transducer –
BL Wh, for whole-body transducer –
BL Wk or equivalent.
<4
4>
3. Select the calibrator signal level.
4. Attach the vibration calibrator to the instrument’s accelerometer.
5. Switch on the calibrator and wait approximately 30 seconds before
starting the calibration measurement.
6. Start the calibration measurement by pressing the <Start/Stop> pushbutton.
The measurement starts after 5 seconds
delay. The measurement time is also
predefined to 5 seconds. During the
calibration period, the <ESC> and <Pause>
push-buttons do not operate but it is possible
to stop the measurement using the
<Start/Stop> push-button. Waiting for the
calibration measurement to begin, a Start
Delay is counted down. At the end of the
measurement, the result is displayed on the
display in the bottom line.
The calibration procedure should be repeated a few times to ensure the integrity of the calibration. The
obtained results should be almost identical (with ±0.1 dB difference). The reasons for unstable results are as
follows:
•
the calibrator is not properly attached to the instrument,
•
there are external disturbances,
•
the calibrator or the measurement channel (the accelerometer or the instrument itself) are damaged.
Notice: During the calibration period, external disturbances (vibrations or acoustic noise)
should not exceed 100 dB.
24
SVAN 106 User MANUAL
_
7. Press the <ENTER> push-button in order to accept the measurement
result.
The calibration factor is calculated, stored and displayed after pressing the
<ENTER> push-button.
4.3.5.
History of the calibrations – Calibration History
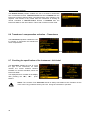
The Calibration History window displays
up to ten last calibration records.
<ENT>
In order to review all calibration record, the user has to use the <5
5>, <6
6>
push-buttons. The opened window contains the date and time of the
performed calibration measurement, the way the calibration was done
(Calibr. By Measurement or Calibr. By Sensitivity) and the obtained
calibration factor (Calibration Factor).
In the case when the calibration measurements were not performed, the
Calibration History window does not contain any record. The content of
this window is cleared after the Clear Calibr. History operation.
4.3.6.
25
Clear calibration records - Clear Calibr. History
SVAN 106 User MANUAL
The user can clear all calibrations records. In order to do this the user has
to choose the position Clear Calibr. History in the Calibration sub-list and
press <ENTER>.
The instrument requests the confirmation of the operation. The next
pressing of the <ENTER> push-button, when the No option is selected,
causes the closing of the window and the return to the Calibration sub-list.
After Clear Calibr. History operation the Calibration History window does
not contain any record.
26
_
SVAN 106 User MANUAL
_
5. MEASUREMENT PARAMETERS SETTING – Measurement
The Measurement list contains the
elements, which enable one to programme
the measurement parameters for all
channels and profiles. The Measurement
list appears after pressing the <Menu>
push-button, selecting the Measurement
text and pressing <ENTER>.
<ENT>
The Measurement list and some of sublist (General Settings and
Data Logging) contents depend on Instrument Mode selection from menu
Auxiliary Setup: Simple Mode or Advanced Mode. In Advanced Mode
some additional functions like triggering, markers, event and wave
recording appear.
Notice: Any parameter in the lists of the Measurement menu
can be changed only when the instrument does not execute a
measurement. The parameters are displayed with different
colour and any marker movement is impossible. The blinking
“play” icon indicates that the instrument is performing the
measurements.
2
Notice: The parameters can be presented in Logarithm (decibels) or Linear (m/s ) units. It
2
depends on the Scale position value (path: Menu / Display / Results Scale), e.g. 10 m/s can
be presented as 140 dB.
5.1
Selection of measurement parameters - General Settings
The General Settings list consists of the
following parameters: the delay of the start
of
measurements
(Start Delay),
the
integration period (Meas. Period) and the
repetition of the measurement cycles
(Repetition No.). In Advanced menu mode
there are three additional parameters:
Measure Trigger, Logging Mode and
Event Recording.
27
SVAN 106 User MANUAL
_
Setting time delay before the start of measurements
The Start Delay defines the delay period from the <Start/Stop> pushbutton pressing to the start of the measurements (the digital filters of the
instrument analyse constantly the input signal even when the
measurements are stopped). This delay period can be set from 0 second to
60 seconds (with 1 second step by means of the <3
3>, <4
4> push-buttons
and with 10 seconds step with the <3
3>, <4
4> push-buttons pressed
together with the <Shift> one.
Notice: The minimum delay period is equal to 0 second. In the Calibration mode, the delay
period is equal to 5 seconds.
Setting the integration period
The Measure Period defines the period in
which the signal is being averaged during the
measurements. The definitions of the
measurement results in which the integration
period is used is given in App. D.
<4
4>
The required value of this parameter can be set in the range of:
- from 1 s to 59 s (with 1 second or 10 seconds step),
from 1 m (min) to 59 m (with 1 minute or 10 minutes step),
- from 1 h to 24 h (with 1 hour or 10 hours step).
It is also possible to set Inf value. The Inf value denotes the infinite integration of the measurements (until
the pressing the <Start/Stop> push-button or after receiving the remote control code).
Additionally, the predefined periods: 1 m, 5 m, 15 m, 1 h, 8 h, 24 h and Inf, which are enumerated in the
standards, are also available (by pressing the <3
3> push-button or <3
3> with <Shift>; these values are
placed in the mentioned above sequence on the left in relation to 1 s).
Notice: In the case of switching on the Auto Save function, the minimum value of the
integration period should be equal to 10 seconds.
If the user wants to switch on Auto Save option (path: Menu / File /
Save Options) the integration period value has to be greater or equal than
10 seconds. When Auto Save option was switched on and new entered
integration period value is less than 10 seconds Auto Save option switches
off and Integration Period Too Short / Autosave Not Available message
appears on the display.
28
SVAN 106 User MANUAL
_
Setting the number of repetition of measurement cycles
The Repetition No. defines the number of cycles (with the measurement
period defined in the Meas. Period), which should be performed by the
instrument. The Repetition No. values are within the limits [1, 1000].
Activation of the measure trigger
The Measure Trigger position activates or
deactivates the measure trigger function.
This position doesn’t appear in the
Simple Mode
(path:
<Menu>
/
Auxiliary Setup / Instrument Mode). If the
Measure Trigger function is switched off,
then the Measure Trigger position in the
Measurement list will be not active.
<ENT>
Activation of the dose meter function
The Dosimeter position activates or
deactivates the dose meter function. If the
Dosimeter function is switched on, then all
channels will be assigned for whole-body
(WBV)
or
hand-arm
(HAV)
dose
measurement.
<ENT>
Dosimeter parameters can be setup in the HAV/WBV Dosimeter window, opened from the Measurement
list. If the Dosimeter function is switched on, then the HAV/WBV Dosimeter position in the Measurement
list will became active and DLM, D1/1 or D1/3 function abbreviations appear in the upper line.
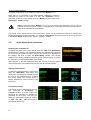
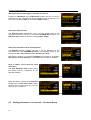
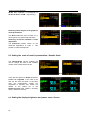
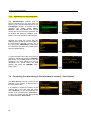
Setting the Logger mode
The Logger Mode position enables one to deactivate the logger function
(Off) or to activate this function by choosing the logger mode (Logger or
Wave). Wave option doesn’t appear in the Simple Mode (path: <Menu> /
Auxiliary Setup / Instrument Mode). In case the Logger is selected the
history of results will be saved in the logger file.
In case the Wave is selected the wave signals for the channels, selected in
the window Wave Channels, will be recorded in the logger file. The file
name is defining in the Logger Setup window and for history results will
have predefined name &LOG#, and for wave recording - &REC#.
Depending on what parameter of Logger Mode was chosen some positions
in the Measurement and Data Logging lists are not active.
29
SVAN 106 User MANUAL
_
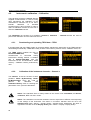
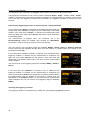
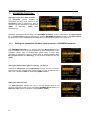
<ENTER>
<ENTER>
Data Logging screen view when Logger mode is switched on
<ENTER>
<ENTER>
Data Logging screen view when Wave mode is switched on
Activation
function
of
the
event
recording
The Event Recording position enables one
to activate the event recording function.
This position doesn’t appear in the
Simple Mode
(path:
<Menu>
/
Auxiliary Setup / Instrument Mode).
=>
If the Event Recording function is switched
off, then the Event Recording position in
the Data Logging list will be not active.
5.2
Setting the parameters for dose measurements – HAV/WBV Dosimeter
The HAV/WBV Dosimeter list is opening from the Measurement menu.
This list enables one to set up the parameters for dose measurements, like:
exposition period, type of measurement (whole body or hand arm),
performed in channels 1-3 and 4-6, limits, used for some standards (U.K.,
Italy, Poland, France and Germany), as well as limits, defined by the user
(User).
30
SVAN 106 User MANUAL
_
Setting the measurement type for channels 1-3 and 4-6
Positions 1-3 Dosimeter and 4-6 Dosimeter enable the user to set the
desired type of the measurement, performed with the use of channels 1,2,3
and 4,5,6 – hand-arm (HAV) or whole-body (WBV) vibration.
Setting the exposure time
The Exposure Time enables the user to set the desired value of the
exposure time that is used for the calculation HAV/WBV Dose results. The
Exposure Time values are within the range [00h01, 24h00].
Setting the standard for dose measurements
The Standard position enables the user to set the standards for the
measurements of the HAV/WBV Dosimeter. The available values of this
position are U.K., Italy, Poland, France, Germany and User.
Depending of settings in the position Standard it is possible to view (U.K.,
Italy, Poland, French, Germany) or edit (User) limits for dose calculation.
View or edition of the limits for dose
calculation
The View Standard Limits position opens
the window with the coefficients for the
selected standard.
<ENT>
When the User is selected in the Standard
position then the Edit User Limits position
appears on the screen where the user can
set up its own coefficients.
<ENT>
5.3
31
Setting parameters in a channels – Channels Setup
SVAN 106 User MANUAL
_
The Channel x position enables the user to assign the axis of three-axial
accelerometer for the specific channels, switch on or off channels or second
profiles, and to program the channels parameters as: transducer type
(Type) and weighting filter (Filter). The measurement range cannot be
changed and is displayed only for information purpose. The
Channels Setup list is opened from the Measurement list.
Notice: The change of the profile parameters is not possible when the measurement is
performed. The user has to finish the current measurement.
Activation of channels
The first two positions enable one to switch on or off some channels and the
second profile from the calculation process.
In the Enabled Channels the user may select All, 1-3 or 4-6 channels to be
active during measurement. Other channels will be disabled and will not be
displayed.
Activation of second profiles
In the Enabled 2nd profiles the user may switch on or off result
calculations for the second profiles.
If second profiles are switched off, there will no be calculations performed
and displayed in different presentation modes and all positions with settings
for second profiles will be not active.
5.3.1
Assignment channels for the accelerometer axis - Channel/Axis Mapping
The Channel/Axis Mapping position enables one to assign channels to the
transducer’s axis. The user can assign channels 1,2,3 to the axis X, Y, Z of
the first transducer, connected to the Lemo compatible sockets type
ENB.0B.304 for Channels 1–3 and channels 4,5,6 to the axis X, Y, Z of the
second transducer, connected to the Lemo compatible sockets type
ENB.0B.304 for Channels 4-6.
If same channel is assigned to the more than one axis there will be error
detected and the user will be proposed to reassign the channels.
5.3.2
32
Setting parameters for channels – Channel x
SVAN 106 User MANUAL
_
The Channel x positions enable one to set
up or display parameters for the individual
channel, like input type and filters for
profiles.
If Dosimeter is active the first profile filter is
set by default and it cannot be changed.
When second profile is switched off the
filter for second profile doesn’t appear as
parameter in the list.
Input type and range selection
The following inputs are available: IEPE and Direct.
The Range value cannot be changed; it always depends on the filter type
and calibration factor. If calibration factor is equal to zero the range is equal
2
to 126 m/s . .
Weighting filter selection
The following weighting filters are available for the first profile of the
instrument: Wh, Wk, Wd, Wc, Wj, Wm, Wg, Wb and Wf. The
characteristics of the filters are given in App. D.
The set of filters for the profile two is depending of the filter selected for
profile one. There is always available filter HP. Second available filter for
profile 2 is one of: BL Wh, BL Wk, BL Wd, BL Wc, BL Wj, BL Wm,
BL Wg, BL Wb and BL Wf; according to the rule – if Wh filter is selected in
the profile 1 then the apart of HP only BL Wh filter is available for profile 2.
If Wk filter is selected in the profile 1 then the apart of HP only BL Wk, filter
is available or profile 2. And so on.
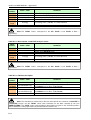
When Dosimeter function is active the filters for first profiles are predefined and depend on type of
dosimeter measurements for the channels – WBV or HAV.
If WBV measurements are performed in channels 1-3 or 4-6 the filters defined for channels are as follows:
Channel 1 or 4: Wd, Channel 2 or 5: Wd, Channel 3 or 6: Wk.
If HAV measurements are performed in channels 1-3 or 4-6 the filters defined for channels are as follows:
Channel 1 or 4: Wh, Channel 2 or 5: Wh, Channel 3 or 6: Wh.
If second profile is active during Dosimeter measurements, the filter can be HP or one of from BL Wd,
BL Wk or BL Wh depending on what filter was predefined for the first profile of the chosen channel,
according to the rule described above.
RMS detector
33
SVAN 106 User MANUAL
_
In the instrument the only one 1.0s RMS detectors is available.
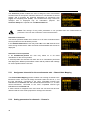
5.4
Setting the vector parameters – Vector Setup
The Vector Setup position enables the
user to select the coefficients to calculate
the vector for channels 1, 2, 3 and 4, 5, 6.
Vector is calculated based on different set
of coefficients for three axis (X, Y, Z), which
may be selected in the position Mode: for
hand-arm measurements (Standard H-A),
for
whole
body
measurements
(Standard WBV), for measurements with
user defined coefficients (User) and for
MTVV
measurements
(MTVV).
For
Standard H-A and Standard WBV modes
coefficients are predefined. For User and
MTVV modes it is possible to define
coefficients for vector calculation.
<ENT>
<4
4>
When the user needs to calculate vector with other than standard
coefficients, it is possible to select the coefficient within the values from 0.00
to 2.00.
The values presented above are taken into account during the
calculations of the measurement results. VECTOR is calculated
according to the formulae:
VECTOR = k12 x12 + k 22 x 22 + k 32 x32
Where k1, k2 and k3 are the coefficients and x1, x2 and x3 are RMS results for different channels. It is
important that the user should choose only coefficients corresponding with the proper channels.
5.5
Setting of the logging functionality – Data Logging
The Data Logging list enables one to program the logger functions –
history of results measurements, events and wave recording for all six
channels.
The Data Logging list content depends on Instrument Mode selection
from menu Auxiliary Setup: Simple Mode or Advanced Mode. In
Advanced Mode appear some additional functions like triggering, markers,
event and wave recording.
34
SVAN 106 User MANUAL
_
Depending on Logging Mode (Logger or
Wave), set up in the General Settings list
the Data Logging window will have
different view.
This is an example of Data Logging
window
in
Simple Mode
and
Logging Mode = Logger.
=>
Wave recording is enabled
advanced instrument mode.
only
in
When Wave function is chosen for the
Logging Mode, the Data Logging list
consists
of
three active positions:
Logger Setup,
Wave Channels
and
Wave Trigger.
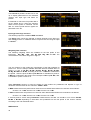
5.6
=>
The results history logging
When Logger function is chosen for the Logging Mode, the Data Logging list enables one to program
saving the history of results in the logger file.
Depending on the Instrument Mode, the
Data Logging list consists of two positions
in case of Simple Mode: Logger Setup,
Logger Results; or consists of four to five
active
positions
in
case
of
Advanced Mode:
Logger Setup,
Logger Results,
Logger Trigger,
Event Recording (which in turn is active
when Event Recording position in the
General Settings list would be active) and
Marker Setup.
5.6.1
35
Data logger programming – Logger Setup
SVAN 106 User MANUAL
_
The Logger Setup list enables the user to edit the name of the logger file
(history of results measurements or wave records) and to set other general
parameters. Depending on what Logging Mode was selected (Logger or
Wave) in General Settings window, the Logger Setup window has
different view.
When Logger mode was selected apart from logger file name the user may
define the interval of the data logging in a file (Logger Step). The
Logger Step can be set from 100 milliseconds to 1 hour.
The Logger Name enables the user to
name the logger file. The default one is
LOG# for Logger files and &REC# for
Wave files. The name cannot be longer
than eight characters. After pressing the
<3
3>, <4
4> push-buttons, the special
window with text editor function is opening.
<4
4>
The edited name is accepted and the file is saved after pressing the <ENTER> push-button. The special
warning is displayed in the case the file with the edited name already exists in the memory. The instrument
waits then for a reaction of the user (any push-button should be pressed except the <Shift> or the <Alt>
one).
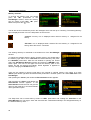
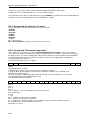
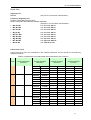
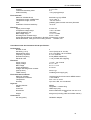
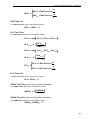
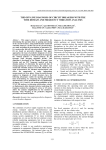
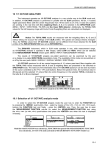
The main measurement results (cf. App. B) are calculated in the period set on in the Meas. Period. These
results can be saved in the result files in the instrument’s or external memory. In the case the Meas. Period
is greater than 9 seconds, it can be done also by means of the Auto Save operation. In case the
Repetition No. is greater than one, the Auto Save operation will be performed after the period set on in the
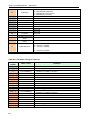
Meas. Period. The name of the file with the main results is increased by one after each saving.
In the same, when the Logger Mode is switched on (On), the partial measurement results are calculated in
the period set on in the Logger Step. Up to 60 results can be logged simultaneously from all channels and
profiles of the instrument (PEAK / P–P/ MAX / RMS / VDV) and two vectors (VEC13 and VEC46) with time
step down to 100 ms. These results are saved in one logger file. The name of the file is set on in the
Logger Name position. The registration in the logger’s memory is stopped after the period, which is equal to
Meas. Period multiplied by Repetition No., after pressing the <Start/Stop> push-button or after stopping
the measurements remotely.
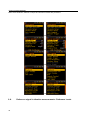
36
SVAN 106 User MANUAL
_
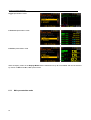
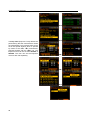
REP. CYCLE
n=1
0
REP. CYCLE
n=1
T
AUTO SAVE
@sig1.svn
main results
integration period
from 0 to T
PEAK, MAX, MIN or RMS
2T
INTEGR. PERIOD INTEGR. PERIOD
T
T
start
time history
REP. CYCLE
n=N-1
AUTO SAVE
@sig2.svn
main results
integration period
from T to 2T
(N-2)T
REP. CYCLE
n=N
(N-1)T
NT
measurements
end
INTEGR. PERIOD INTEGR. PERIOD
T
T
AUTO SAVE
@sigN-1.svn
main results
integration period
from (N-2)T
to (N-1)T
AUTO SAVE
@sigN.svn
main results
integration period
from (N-1)T
to NT
LOGGER: ON
&logger1.svn
RMS results logged
with LOGGER STEP.
Number of results
equal NT / LS
0
LS
LOGGER STEP
NT
Relations between Measurement Cycle (Integration Period) and Logger Step
5.6.2
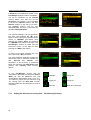
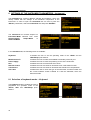
Results selection – Logger Results
The Logger Results list enables the user
to activate the results for all channels and
profiles (Channel x Profile x) and for
vectors (Vector) for recording their history
in the logger file.
The view of the Logger Results list
depends
on
the
settings
of
the
Enabled Channels
and
Enabled 2nd profiles parameters (path:
<Menu> / Measurement / Channels Setup).
37
time
main results
files
signal amplitude
Measurements started by <START/STOP> push-button, ended by last repetition cycle
time
SVAN 106 User MANUAL
_
In Advanced Mode it is possible to define
logger results for each channel and profile
individually.
Selection results for channels and profiles
Depending on Instrument Mode and Enable 2nd profiles parameter the
user may activate the results for channels and profiles (PEAK, P-P, MAX,
RMS and VDV), which will be recorded to the logger file (column Log),
activate plot (column Plot) and select its colour (column Color) in the
windows with names: Channels x-y / Channels x-y Profile z / Channel x /
Channel x Profile y.
The VDV history will not be recorded if Wh filer is chosen in this profile.
Activation / deactivation can be done by means of the <3
3>, <4
4> pushbuttons pressed together with the <Shift> one. The position is changed by
means of <3
3>, <4
4> and <5
5>, <6
6> push-buttons.
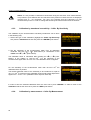
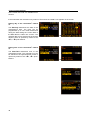
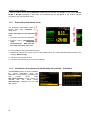
Example display
selected results.
of
Logger
with
two
=>
Selection vectors for logging
The Vector list enables the user to activate
the vectors (VEC13 and VEC46), which will
be recorded to the logger file, activate plot
and select its color.
<ENT>
5.6.3
38
Logger trigger parameters setup – Logger Trigger
SVAN 106 User MANUAL
_
The Logger Trigger position appears only
in advanced instrument mode (path:
<Menu>
/
Auxiliary Setup
/
Instrument Mode: Advanced Mode).
The Logger Trigger parameters influence
the way the measurement results are saved
in the logger. The Logger Trigger switches
on the result logging.
<ENT>
The logger triggering of the measurements (Enabled) can be switched on
with the <4
4> push-button.
In this sub-list the triggering of logger can be switched off or on (Enabled),
the parameters of the triggering signal determined (Trigger Parameters),
the number of the results saved in the logger before the fulfilment of the
triggering condition (Pre) and the number of the results saved in the logger
after the fulfilment of the triggering condition (Post) be select. If the
triggering condition is fulfilled, the logger contains:
•
the measurement results registered directly before the fulfilment of the triggering condition; time of the
registration can be calculated by multiplying the value set in the Pre by the time period taken from the
Logger Step (path: Menu / Measurement / Data Logging / Logger Setup);
•
all measurement results up to the moment the triggering condition disappears;
•
the results registered directly after the moment the triggering condition disappears; time of the
registration can be calculated by multiplying the value set in the Post position by the time period taken
from the Logger Step position (path: Menu / Measurement / Data Logging / Logger Setup).
Pre and post trigger registration
In the Pre/Post line the number of the
results registered in the logger’s file
before/after the fulfilment of the triggering
condition can be set. This number is within
the limit 0..20 for Pre trigger and 0..200 for
Post trigger.
=>
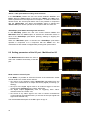
Trigger parameters setting
The position Trigger Parameters enables
to define the parameters of the triggering
signal. To open this position one should
select it and press <ENTER> push-button.
The Trigger position enables one to select
the trigger type: Level -, Level +, Slope -,
Slope +, Gradient - and Gradient +.
<ENT>
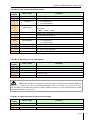
In each Trig. Step of the measurement the triggering condition is checked and:
•
39
in the case of Level + is selected, the triggering condition is fulfilled only when the Source has the
greater value than this determined in the Level position and in the other cases the triggering condition
is not fulfilled.
SVAN 106 User MANUAL
_
•
in the case of Level – is selected, the triggering condition is fulfilled only when the Source has the
lower value than this determined in the Level position and in the other cases the triggering condition is
not fulfilled.
•
in the case of Slope + is selected, the triggering condition is fulfilled only when the arising value of the
Source is passing the level determined by the Level parameter.
•
in the case of Slope – is selected, the triggering condition is fulfilled only when the falling down value
of the Source is passing the level determined by the Level parameter.
•
in the case of Gradient + is selected, the triggering condition is fulfilled only when the signal has the
greater level than this determined in the Level and the gradient of the signal is greater than this
determined in the Gradient position. In the other cases the triggering condition is not fulfilled.
•
in the case of Gradient - is selected, the triggering condition is fulfilled only when the signal has the
lower level than this determined in the Level and the gradient of the signal is lower than this
determined in the Gradient position. In the other cases the triggering condition is not fulfilled.
Step for
condition
checking
the
triggering
The Trig. Step position enables one to
select integration time for condition
evaluation: Logger step, 100ms, 1.0s,
Meas. Time and Meas. Period.
<4
4>
Source for triggering condition and
channel of triggering signal
The Source position enables one to select
the type of source for triggering condition
calculation: Vector or Profile 1.
The Channel position enables one to select
the channel of triggering source. Depending
on value of the Source parameter, the
value of Channel will be different.
<4
4>
Function for triggering condition definition and threshold
The Result position enables one to select the function for triggering
condition: PEAK, P-P, MAX, MIN, RMS or VDV. When Vector is selected
as a Source the only one function is available – RMS.
The Level position enables one to select the value of threshold for
triggering condition. The level of the triggering source can be set in a range
2
2
from 60 dB to 200 dB or from 1.00 mm/s to 10.0 km/s , depending on
what scale type was selected in the Scale position (path: <Menu> / Display
/ Results Scale).
Speed of the triggering signal change
This position appears when the Gradient - or Gradient + trigger is chosen.
The speed of the triggering signal changes (Gradient) can be set from 1 dB
to 100 dB range. Speed is defined as dB per Logger Step.
40
SVAN 106 User MANUAL
5.6.4
_
Event recording setup – Event Recording
The Event Recording position appears
only in Advanced Mode (path: <Menu> /
Auxiliary Setup / Instrument Mode) and
became active after Event Recording
parameter in the General Settings list was
switched on.
=>
The Event Recording enables the user to activate and to set the
parameters of event signal recording in the same logger file as for results
history.
The Sampling Rate position displays the sampling frequency of event
recording – 6000 Hz.
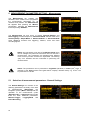
When Trigger position is selected then
event recording will start by trigger.
Trigger condition is set up in the window,
opened by position Trigger Parameters.
This position appears in the list after
activation the Trigger.
<ENT>
When Trigger On Marker position is selected then event recording will start
by the marker, initiated by the user. Markers for triggering are defined in the
Markers Setup window.
When Trigger and Trigger On Marker event recording are chosen then
event recording will start when one of these triggering conditions are
fulfilled.
When Trigger or Trigger On Marker event recording is chosen then
additional positions appears. These positions enable one to programme
additional parameters for the event recording.
41
SVAN 106 User MANUAL
_
When Pre Trigger position is switched on then the signal is recorded before
the triggering condition with interval, defined by the position Pre of the
Logger Trigger window (path: <Menu> / Measurement / Data Logging).
In the Rec. Limit position it is possible to select the time of event signal
recording after triggering. If the triggering condition appears then the signal
will be recording during the period defined in Rec. Time. The available
values of Rec. Limit are: Max Length, Fixed Len. or Off.
When Off is chosen then the event signal will be recording as long as
memory was filled or until the trigger condition was ceased. When
Max Length is chosen then the signal will be recording during period
defined in the Rec. Time, but can be stopped earlier if trigger condition was
ceased. When Fixed Len. is chosen then the signal will be recording during
period defined in the Rec. Time, even when trigger condition ceased.
In the Rec. Time position it is possible to
select the time of signal recording after
triggering. If next triggering condition
appears then the signal will be recording
additional Rec. Time.
<4
4>
The Channel x positions switch on or off
the channels for event recording.
<6
6>
5.6.5
The marker setup – Marker Setup
The Marker Setup position appears only in
advanced instrument mode (path: <Menu> /
Auxiliary Setup
/
Instrument Mode:
Advanced Mode).
The Marker Setup enables the user to
assign the name for each marker and
define markers for event recording.
42
<ENT>
SVAN 106 User MANUAL
5.7
_
Wave recording
All positions connected with wave recording
in Data Logging list appear only in
advanced instrument mode (path: <Menu> /
Auxiliary Setup
/
Instrument Mode:
Advanced Mode).
When Wave function is chosen for the
Logging Mode, the Data Logging list
consists
of
three active positions:
Logger Setup,
Wave Channels
and
Wave Trigger.
=>
Setting-up the Wave recorder function
The Logger Setup list enables the user to edit the name of the logger file
(history of results measurements or wave records) and to set other general
parameters.
The Wave Rec. position is not active. It only informs about the used type of
wave recording: Continuous.
The user may define the format of the wave file header (Format). Format of
the wave file header may be PCM or Extensible.
The Sampling Rate position is not active. It only informs about the used sampling rate: 6000Hz.
Selecting
recording
the
channels
for
Wave
The Wave Channels position appears only
in advanced instrument mode (path:
<Menu>
/
Auxiliary Setup
/
Instrument Mode: Advanced Mode).
The Channel x positions enable the user to
select the channels which signal will be
recorded.
<ENT>
Wave recorder trigger setup
The Wave Trigger position appears only in
advanced instrument mode (path: <Menu> /
Auxiliary Setup
/
Instrument Mode:
Advanced Mode).
The Wave Trigger enables the user to
activate and programme the wave recorder
trigger.
43
<ENT>
SVAN 106 User MANUAL
_
The position Enabled switches on/off the Wave Trigger.
In the Rec. Limit position it is possible to select the time of signal recording
after triggering. If the triggering condition appears then the signal will be
recording during the period defined in Rec. Time. The available values of
Rec. Limit are: Max Length, Fixed Len. or Off.
When Off is chosen then the event signal will be recording as long as
memory was filled or until the trigger condition was ceased. When
Max Length is chosen then the signal will be recording during period
defined in the Rec. Time, but can be stopped earlier if trigger condition was
ceased. When Fixed Len. is chosen then the signal will be recording during
period defined in the Rec. Time, even when trigger condition ceased.
In the Rec. Time position it is possible to select the time of event signal
recording after triggering. If next triggering condition appears then the signal
will be recording additional Rec. Time.
The position Trigger Parameters enables
to define the parameters of the triggering
signal. To open this position one should
select it and press <ENTER> push-button.
The Trigger Parameters window and
meaning of all positions is identical as for
Logger Trigger case.
5.8
<ENT>
Measure triggering parameters selection – Measure Trigger
The Measure Trigger position appears
only in advanced instrument mode (path:
<Menu>
/
Auxiliary Setup
/
Instrument Mode: Advanced Mode).
The Measure Trigger sub-list enables the
user to set the parameters for triggering the
measurement.
<ENT>
The Measure Trigger is a contexts sub-list in which the triggering can be
switched off or on (Trigger), in the case when on - the source of the
triggering signal can be determined (Source), channel of source signal
(Channel), its level (Level) and sometimes also the speed of changes
(Gradient). If RTC is selected as trigger type, start time (RTC Start) and
repetition of triggering (Repeat Every) is defined.
Switching the triggering on and off
44
<4
4>
SVAN 106 User MANUAL
_
The triggering of the measurements (Trigger) can be switched off using the <3
3> push-buttons.
The triggering is switched on if one of its six modes is selected: Slope +, Slope –, Level +, Level –, Grad +
or RTC. If the instrument works with the triggering switched on, the appropriate icon appears on the display
in the case when the triggering condition was not fulfilled. The triggering condition is checked every 0,5
seconds.
Switching the triggering by means of measured result - Slope/Level/Grad
In the case when the Slope + is selected, the measurement starts when the
arising result value (Source) will pass the level determined in the Level
position. In the case when the Slope – is selected, the measurement starts
when the falling down result value (Source) will pass the level determined
in the Level position.
The measurement is stopped when the conditions set in the
General Settings sub-list are fulfilled, after pressing the <Start/Stop>
push-button or after receiving the proper control code remotely.
The next sources of the triggering signal are available: RMS(1), VEC46, VEC13 or External. External
source means that the triggering will take place from the positive, or negative slope of the signal on the
input/output socket (I/O).
In the case when the Level + or Level – is selected, every 5 millisecond the
triggering condition is checked and the measurement is registered only
when the result value (Source) has the greater / lower level than this
determined in the Level position and in the other case the measurement
result is skipped.
The next sources of the triggering signal are available: RMS(1), VEC46 or
VEC13.
In the case when the Gradient + is selected, every 5 millisecond the
triggering condition is checked and the measurement is registered only
when the result value (Source) has the greater level than this determined in
the Level position and the gradient of the signal is greater than this
determined in the Gradient position. In the other case the measurement
result is skipped. The only one sources of the triggering signal is available:
RMS(1).
Checking the triggering condition
The triggering condition is checked every 5 millisecond. The position Trig. Step informs this.
45
SVAN 106 User MANUAL
_
Selection of the triggering signal
The user can select several sources of the:
vectors (VEC13 and VEC46), RMS of the
first profile (RMS(1)) and external signal of
the I/O socket (External).
<4
4>..
Setting the channel of the triggering signal
The Channel parameter denotes the channel of the triggering signal.
Setting the level of the triggering signal
The Level position enables one to select the value of threshold for
triggering condition. The level of the triggering source can be set in a range
2
2
from 60 dB to 200 dB or from 1.00 mm/s to 10.0 km/s , depending on
what scale type was selected in the Scale position (path: <Menu> / Display
/ Results Scale).
Setting the speed of the triggering signal changes
This position appears when the Gradient - or Gradient + trigger is chosen.
The speed of the triggering signal changes (Gradient) can be set from 1 dB
to 100 dB range. Speed is defined as dB per Logger Step.
Switching the triggering by means of RTC
In the case when the RTC (Real Time Clock) is selected the triggering
starts at the time set up by RTC Start. The user has to press <Start> pushbutton and the measurement will be triggered on time selected in
RTC Start.
The measurement is repeated with the step selected in Repeat Every
position.
The
parameter
Repeat Every
can
have
values:
Measurement Cycle or Period. If Period is selected then additional
position RTC Period appears.
5.9
46
Settings whole body measurements with the use of seat accelerometer –
“SEAT”
SVAN 106 User MANUAL
_
The “SEAT” window enables the user to
switch on “SEAT” measurements and to
assign channels for tree axial seat
accelerometer
(Seat channels)
or
accelerometer for base measurements
(Base channels).
<ENT>
5.10 The alarm trigger setting– Alarm Trigger
The Alarm Trigger position appears only in
advanced instrument mode (path: <Menu> /
Auxiliary Setup
/
Instrument Mode:
Advanced Mode).
The Alarm Trigger position enables the
user to program the trigger, which
generates alarm pulse on the I/O socket, if
Mode parameter of Multifunction I/O
window is set to Digital Out.
<ENT>
The Alarm Trigger window and meaning of all positions is identical as for Logger Trigger case.
5.11 Programming the instrument’s internal timer – Timer
The Timer position appears only
Advanced Mode
(path:
<Menu>
Auxiliary Setup / Instrument Mode).
in
/
The Timer enables one to programme
internal timer. The instrument can
switched
on
automatically
in
programmed time and perform
measurement with settings used before
instrument was switched off.
the
be
the
the
the
<ENT>
Selecting the mode of the timer function
The timer can be switched off – Off,
switched on only once – Single, or
switched on many times regularly –
Regular with the period between two
consecutive measurements set in the
Repeat Time line as 24 hours. It means
that the unit will be switched on once a day
47
<4
4>
SVAN 106 User MANUAL
_
at the same time until one disables timer
function.
If the instrument was switched on by means of Timer then the “clock” icon appears on the screen.
Setting day of the instrument’s switch
on
The Start Day determines the date of the
measurement start. The timer can be
programmed up to one month ahead and
during the date setting the current state of
the Real Clock is taken into account. The
required date can be selected in the special
window, which is opened by means of the
<3
3>, <4
4> push-buttons.
<4
4>
Setting time of the instrument’s switch
on
The Start Time determines hour of the
measurement start. The required hour can
be selected in the special window, which is
opened by means of the <3
3>, <4
4> pushbuttons.
48
<4
4>
SVAN 106 User MANUAL
49
_
SVAN 106 User MANUAL
_
6. DATA AVAILABLE ON THE DISPLAY – Display
The Display list contains the elements that
enable one the independent programming
of the display parameters. In order to open
the Display list the user has to press the
<Menu> push-button, select the Function
text and press <ENTER>.
<ENT>
The Display list is used for setting the various parameters, which are mainly dedicated for the control of the
display. The list consists of:
Display Modes
enables one to select the mode of the measurement results presentation;
Plot Scale
enables one to change the plot scale of results presentation;
Results Scale
enables one to change the scale of result’s presentation;
Screen
enables one to set the brightness and the switch on/off the screen saver of the
instrument’s display.
6.1 Selection of the modes of measurement results presentation - Display Modes
The Display Modes list enables one to switch on or off the currently
available modes of displaying the results of measurement. The mode of the
results presentation is related with the selection of the instrument’s function
(LM, 1/1 Octave, 1/3 Octave, etc.).
When all display modes in the Display Modes list are switch off the only
main presentation mode with two results is available. Any attempt to switch
the mode by means of <Alt> and <5
5>, <6
6> push-buttons gives no results.
Two results main presentation mode
=>
=>
50
SVAN 106 User MANUAL
_
Logger presentation mode
=>
6 Channels presentation mode
=>
6 Profiles presentation mode
=>
When all display modes in the Display Modes list are switched on they all are available and can be selected
by means of <Alt> and <5
5>, <6
6> push-buttons.
6.1.1
51
Main presentation mode
SVAN 106 User MANUAL
_
Fields description of the two results
view
1
The main presentation mode is always
active and it is not possible to switch it
off.
2
4
1
1. Channel and Profile number.
5
2
6
2. Function name: RMS, VDV, CRF, 3
OVL, PEAK, P–P, MTVV.
4
5
6
3
3. The name of the implemented filter: Wh, Wk, Wd, Wc, Wj, Wm, Wg, Wb, Wf (for first profiles) and HP,
BL Wh, BL Wk, BL Wd, BL Wc, BL Wj, BL Wm, BL Wg, BL Wb, BL Wf (for second profiles); and
detector time constant: 1.0 s.
4. Elapsed time shows the current second of the measurement. The value presented there belongs to the
range [1, Meas. Period].
5. The value of measured function.
6. Units of measured value.
Changing the active fields
The change between positions is made by
pressing the <5
5> or <6
6> push-buttons.
<6
6>
Changing the field content
When Profile or Function position is
chosen, then the profile number or
function name is changed after pressing
the <3
3> and <4
4> push-buttons.
<4
4>
Changing the presentation mode
The presentation mode is changed after pressing the <5
5> or <6
6> push-buttons pressed together with the
<Alt> one.
52
SVAN 106 User MANUAL
_
When Auto Save function is active the file name is indicated on the upper
screen field.
Presentation mode for all channels
The
six
channels
measurement
result’s
presentation
mode
(6 Channels)
shows
simultaneously results for six channels. If not All
channels are enabled in Channel Activation
window (path: <Menu> / Measurement /
Channels Setup) the 6 Channels mode is not
active.
4
5
6
4
5
6
1
2
1. Result line for Channel 1.
2. Result line for Channel 2.
3
3. Result line for Channel 6.
4. Function name: RMS, VDV, CRF, OVL, TIME,
PEAK, P–P and MTVV.
5. The value of measured function and units of
measured value.
6. Elapsed time shows the current second of the
measurement. The value presented there
belongs to the range [1, Meas. Period].
1
2
Changing the active fields
The change between position is made by
pressing the <5
5> , <6
6> or <3
3> , <4
4>
push-buttons.
3
<4
4>
53
SVAN 106 User MANUAL
_
Changing the field content
When Channel or Function position is
chosen, then the profile number or
function name is changed after pressing
the <3
3> or <4
4> push-buttons in
conjunction with the <Alt> one.
<Alt/4
4>
Presentation mode for three results
The three profiles measurement
presentation
mode
(3 Profiles)
simultaneously results for three profiles.
4
6
5
result’s
shows
1
1. Line for first result.
2. Line for second result.
3. Line for third result.
2
4. Function name: RMS, VDV, CRF, OVL,
TIME, PEAK, P–P and MTVV.
3
5. File name when Auto Save function is active
(path: <Menu> / File / Save Options )
6. The value of measured function and units of
measured value.
4
5
7. Elapsed time shows the current second of the
measurement. The value presented there
belongs to the range [1, Integration Period]. 1
2
3
Changing the active fields
The change between positions is made by
pressing the <5
5> or <6
6> push-buttons.
<6
6>
54
6
SVAN 106 User MANUAL
_
Changing the field content
When Profile or Function position is
chosen, then the profile number or
function name is changed after pressing
the <3
3> and <4
4> push-buttons.
<4
4>
Presentation mode for logger view
The history of results saved in the logger can be
presented in the special Logger mode. The
Logger mode can be activated or deactivated in
the Display Modes window.
4
5
6
4
5
6
1
1. Logger plot
2. Result value for the cursor position
2
3. Name of the logged result
4. Name of the logger file
3
5. Cursor
6. Cursor position.
6.
Changing the active fields
The result field activation is made by
pressing the <5
5> or <6
6> push-buttons.
1
2
<6
6>
Changing the field content
3
When Profile or Function position is
chosen, then the profile number or
function name is changed after pressing
the <3
3> and <4
4> push-buttons.
<Alt/4
4>
55
SVAN 106 User MANUAL
_
Changing the cursor position
The user may change the cursor position
by means of the <3
3>, <4
4> push-buttons.
The appropriate value is presented in the
line below the plot.
<3
3> …
When Logger view is switched on there is also combined view of logger
plot and the result presentation available.
6.2 Setting the result presentation parameters – Plot Scale
The Plot Scale sub-list enables the user
to change the plot scale of results
presentation.
<ENT>
Setting the scale of the measurement results presentation
Two options are available: Linear and Logarithm. In the case of the first
one the graphical presentation and the units both are linear. In the latter
case the graphical presentation is given in the logarithmic scale and the
measurement results are expressed in decibels (the result is related to the
values set in the Reference Levels (path: Menu / Auxiliary Setup /
Reference Levels).
Scaling the vertical axis of the graphical
mode presentation
The Dynamic position appears when the
Logarithmic value of Scale parameter was
chosen. The Dynamic parameter enables
the user to select the proper scaling of the
graphical mode presentation. In the case of
the vertical axis one can obtain the double,
four times and eight times expansion (as
the default the vertical axis corresponds to
56
=>
SVAN 106 User MANUAL
_
80 dB, after expansion it corresponds to
40 dB, 20 dB and 10 dB – respectively).
=>
Switching on/off the grid in the graphical
mode presentation
The Grid enables the user to switch on or
off the grid in any graphical presentation.
Switching on/off the automatic Y-scale
adjustment
The Autoscale position switch on the
automatic adjustment of scale Y. This
position is under development.
=>
6.3 Setting the scale of result’s presentation– Results Scale
The Results Scale sub-list enables the
user to change the scale in the available
modes of the measurement results.
<ENT>
There are two options for Scale parameter:
Linear and Logarithm. In the case of the
first one the units are linear. In the latter
case the measurement results are
expressed in decibels (the results are
related to the values set in the
Reference Level (path: <Menu> / Auxiliary
Setup / Reference Levels).
6.4 Setting the display brightness and power saver- Screen
57
..
SVAN 106 User MANUAL
_
The Screen window enables the user to set
the brightness of the display and switch on
the screen saver.
Setting the brightness of the display
The Brightness enables the user by means
of the <3
3>, <4
4> push-buttons to set the
proper brightness of the display. The user
can select 20 different values of this
parameter.
<ENT>
Notice: The new value of the brightness is confirmed after each pressing of the <3> or <4>
push-buttons (new value is selected without any confirmation from the <ENTER> push-button).
Setting the power saver function
The saving of the internal source of the instrument’s power can be achieved
by means of reducing the brightness of the screen when possible.
It is possible to set the Power Saver automatically. The screen may be
switch off (Screen Off) or dimmed (Dim). In the case when any of these
options is set, after 15 seconds from pressing any push-button the screen
is switched off or dimmed. If it happened, the first pressing of any pushbutton would cause the switch on of the screen. Power Saver function may
also be deactivated if Disabled parameter is selected.
Setting the power saver delay
The Power Saver Delay defines the delay period from last use of any pushbutton to the Power saver mode. This delay period can be set from 5 s to
60 s .
58
SVAN 106 User MANUAL
_
7. SAVING THE MEASUREMENT RESULTS – File
The File list contains the elements that enable one to manage the files,
created and saved in the internal memory of the instrument or external
memory carriers.
The registration of the measurement results is an essential task for the
efficient use of the instrument. All available measurement results and also
instrument's settings are stored as a file in the internal FLASH type memory
of the instrument or on the external SD Card memory.
Instrument's files containing data:
• from Level Meter;
• measurement results from 1/1 Octave analysis;
• measurement results from 1/3 Octave analysis;
• stored in the logger file,
• stored in the wave file,
• settings.
Result files can be saved manually or automatically, Setup files are saved manually, Logger and Wave files
are saved automatically.
Each file consists of some elements, which are the same for all kind of files:
• a file header;
• the unit and software specification;
• the user’s text stored together with the measurement data;
• the parameters and global settings;
• the special settings for profiles;
• the marker of the end of the file.
The File list contains the following items:
File Manager
Setup Manager
Save Options
Setup Options
7.1
59
enables one to manage the files saved in the
instrument’s or on external memory;
enables one to manage the Setup files;
enables one to set the options of the measurement
result savings.
enables one to set the options of the setup savings.
Saving files in the instrument’s memory or external memory
SVAN 106 User MANUAL
_
There are two options for storing result data
in the internal or external memory. One
option is to press <Save> push-button right
after the measurement performance.
Another option is to create <New File> in
the File Manager.
After pressing the <Save> push-button the
Save Results window appears.
<Save>
There are two available options for saving files: with the edited name, or with the name automatically
changed with the name increased by one. These options can be selected in the position Auto Name. If
Auto Name is switched off (Off) the name of the saved file is like in the position File Name. This file name
can be edited in the special window, which is opening by means of <4
4> push-button. When the Auto Name
function is set on Number, then a file is saved with the name as displayed above, but after the last nonnumeric letter of the text there will be added digit 0. If there already exists any chain of digits on the end of
the file text the number that these digits create will be increased by one.
The number can be changed from 0 to N. The only limitation of the N value is the length of the file name,
which cannot be longer than eight characters. In the case, when such limitation is achieved and the
instrument can not change automatically the file’s name the only possibility is to edit new file name.
The default name for a file is displayed in the case of the first entering to this position (after power on). The
default name consists of the day and the month’s abbreviation and cannot exceed 8 characters.
The user can skip the file’s name edition and start saving file pressing the <ENTER> push-button or return to
the File list or measurement display by pressing the <ESC> one.
To start file edition the user has to select
the File name position and to press <3
3>
or <4
4> push-button. After that the special
window with edition function is opening.
The edition process is presented on the
Figure below.
<4
4>
Selection of the character’s position to
be edited
One can select the position of the
character in the edited text using the
<3
3>, <4
4> push-buttons. For the current
position the character can be changed,
position can be deleted or inserted.
60
<4
4>
SVAN 106 User MANUAL
_
Changing the edited character
The available ASCII characters can be
changed using the <5
5> (or <6
6>) pushbutton. The subsequent digits, letters and
other characters appear on the display in
the inversely displayed position after each
pressing of the mentioned above pushbuttons.
<5
5>
Position insertion, deletion
One can delete or insert the position in
the edited text using the <3
3>, <4
4> pushbuttons, pressed together with the <Alt>
one.
<Al/4
4>
The edited name is accepted and the instrument returns to the
Save Results window after pressing the <ENTER> push-button. The
second pressing of the <ENTER> push-button saves the file in the working
directory. The special warning is displayed in the case the file with the
edited name already exists in the memory. The instrument waits then for a
reaction of the user (any push-button should be pressed except the <Shift>
or the <Alt> one).
Notice: The files can be overwritten (the use of the same file name) without any warning if the
Replace option is switched on (path: <Menu> / File / Save Options).
The saving is not possible in the case when the instrument is measuring the
signal. The message “Measurement in progress!” is displayed for about 3
seconds.
The presented below message is displayed after trying to execute the save
operation in the case when no measurements were performed and there
are no results to be saved. The instrument then waits for the reaction of the
user (any push-button should be pressed except the <Shift> or the <Alt>
one) and after pressing a push-button it returns to the Save Results
window.
Notice: The direct access to the Save Results window is possible after pressing
simultaneously the <ENTER> and <Alt> push-buttons if the Auto Save option is switched off
(path: Menu / File / Save Options). In another case, (Auto Save option is switched on) the
results are saved, after pressing these push-buttons, in the file with the automatically
incremented name.
61
SVAN 106 User MANUAL
7.2
_
Managing the files saved in the internal and external memory – File Manager
The File Manager is used for checking the
contents of the memory and make
operation on result and logger files such as:
open, delete, copy, move, rename, create
new files or catalogues and display file and
catalogue information.
<ENT>
In the File Manager window the list of files,
catalogues and memory devices is
presented. Files are stored in catalogues,
which
are
organised
hierarchically.
Catalogues names are of capital letters and
have no extensions. By pressing the
<ENTER> push-button the window with the
list of available operations is opening for
marked (highlighted) position.
<ENT>
When SD Card is selected the first two positions <New Directory> and
<New File> can be used to create new elements. When Internal memory is
selected the only <New File> position is available.
The list of operations on files saved in the
Internal memory differs from that one for
the SD Card by one position. It is not
possible to rename the files saved in the
Internal memory and thus Rename
position in this list is not active.
<ENT>
When the memory disk is selected after
pressing the <ENTER> push-button the list
of operations on disk appears.
<ENT>
62
SVAN 106 User MANUAL
_
If SD Card is not installed it's position in the
File Manager window became unavailable.
The list of operations on the Internal
memory differs from that one for the
SD Card by one position. It is not possible
to rename the Internal memory and thus
Rename position in this list is not active.
The Internal memory can be also
defragmentated and this is performed by
operation Defragmentation.
<ENT>
The selected catalogue can be opened by
two ways: after pressing the <4
4> pushbutton or after opening the operation list by
means of <ENTER> push-button, then
selection the position Open and pressing
the <ENTER> push-button once again. The
File Manager window is closed and the
instrument returns to the File list after
pressing the <ESC> push-button.
<4
4>
To return to the upper catalogue the user
has to press the <3
3> push-button.
The upper (highest) catalogue contains the
names and icons of memories available for
files:
SD Card
and
Internal.
The
description of the memory is presented
below the memories list: Disk Name, Free
memory and Capacity (total memory
space).
In the File Manager window files are
described by file name with extension (SVN or
WAV) as well as additional icon and
measurement abbreviation (SLM, S:1/1 etc.).
The names in which the first character is @
are coming from the Auto Save function.
Below the table with the description of icons is
presented.
7.2.1
63
<3
3>
Catalogue
Result file
Logger file
Setup file
Wave file
New file or catalogue
Setting the directory for saving files – Set Working Directory
SVAN 106 User MANUAL
It is possible to assign the catalogue for
automatic saving logger files and result
files. In order to do this one should choose
the required catalogue and press the
<ENTER> push-button. After opening the
list of operations one should press the
<ENTER>
push-button
and
Set Working Directory operation will be
performed. The new catalogue name will
appear at the bottom line of the display.
Starting from this moment all files will be
saved in this catalogue.
7.2.2
There is another than pressing the <Save>
push-button way of saving results as a file
in the internal or external memory. This can
be done in the File Manager window by
creating new file in the file system. In order
to this one should enter the catalogue in
which the new file will be created and press
the
<ENTER>
push-button
at
the
<New File> position.
<ENT>
<ENT>
Deleting all files from Internal memory – Delete All
It is possible to delete all result and/or
setup files from the instrument's memory. In
order to do this one should select the
memory and press the <ENTER> pushbutton. After opening the list of operations
one should select with the <5
5>, <6
6>
push-buttons the Delete All position and
press the <ENTER> push-button again.
64
<ENT>
Creating new catalogue and new file
It is possible to create new catalogue in the
file system on SD Card. In order to do this
one should enter the catalogue in which the
new one will be created and press the
<ENTER>
push-button
at
the
<New Directory> position. The proposition
of new catalogue name will appear at the
bottom line of the display. If there already
exists a directory with such name the
warning message will appear. In other case
this operation will be performed.
7.2.3
_
<ENT>
SVAN 106 User MANUAL
_
To delete files from the Internal memory
the user shall mark the desired file type
then press the <ENTER> push-button. The
Delete All window with the list of file types
will be opened.
<ENT>
7.2.4
Merging result and setup files memory – Defragmentation
The Defragmentation is used to make the Internal memory continuous. All
new files are saved starting from the beginning of the free memory space.
The memory occupied by the deleted file, assuming that the file was not the
last one, remains unused for the next files saving. After the removing a file
the files memory becomes discontinuous, with unused parts, which cannot
be utilized in the future.
The situation changes after the process called defragmentation. During this
process, the files saved in the files memory are moved in order to obtain the
continuous occupied space.
After pressing the <ENTER> push-button on the active Yes option, the
instrument checks whether the used result and Setup files memory is
continuous or not. If this memory is continuous, the Defragmentation
operation is not executed and the special message is displayed. The
instrument waits for the reaction of the user (any push-button should be
pressed except the <Shift> and <Alt> one) and after pressing a pushbutton it returns to the Defragmentation sub-list.
If there are conditions to execute the Defragmentation operation the
current progress of defragmentation is shown on the display. After the
successful defragmentation, the special message is displayed and the
instrument waits for the reaction of the user. Any push-button should be
then pressed except the <Shift> and <Alt> one. After pressing a pushbutton, the instrument returns to the Defragmentation sub-list.
65
SVAN 106 User MANUAL
7.2.5
_
Opening file/catalogue – Open
It is possible to open file or catalogue from
the file/catalogue list. In order to do this one
should select the file/catalogue and press
the <ENTER> push-button. After opening
the list of operations one should select with
the <5
5>, <6
6> push-buttons the Open
position and press the <ENTER> pushbutton again. The effect of such operation
for the catalogue is the same as opening
the catalogue by means of the <4
4> pushbutton.
<ENT>
Opening the measurement file means that
the measurement results saved in this file
will be loaded to the instrument's operation
memory.
<ENT>
7.2.6
Deleting file/catalogue – Delete
It is possible to delete file or catalogue from
the file/catalogue list. In order to do this one
should select the file/catalogue and press
the <ENTER> push-button. After opening
the list of operations one should select the
Delete position and press the <ENTER>
push-button again.
<ENT>
7.2.7
66
Copying file/catalogue – Copy
SVAN 106 User MANUAL
_
It is possible to copy file or catalogue from
the file/catalogue list in one memory type to
another or from one catalogue of external
memory to another catalogue same
memory. It is not possible to copy logger
files to the Internal memory since this type
of memory do not accept such files.
In order to do this operation one should
select the file/catalogue and press the
<ENTER> push-button. After opening the
list of operations one should select the
Copy position and press the <ENTER>
push-button again. The instrument then will
propose to choose the target catalogue for
copying. After selection of the target
catalogue the user should press the
<ENTER> push-button. The window with
two options will appear: Copy Here and
Rename.
7.2.8
<ENT>
<ENT>
Moving file/catalogue – Move
It is possible to move file or catalogue from the file/catalogue list in one
memory type to another or from one catalogue of external memory to
another catalogue same memory. . It is not possible to move logger files to
the Internal memory since this type of memory do not accept such files.
In order to do this operation one should select the file/catalogue and press
the <ENTER> push-button. After opening the list of operations one should
select the Move position and press the <ENTER> push-button again. The
instrument then will propose to choose the target catalogue for copying.
After selection of the target catalogue the user should press the <ENTER>
push-button. The window with two options will appear: Move Here and
Rename.
7.2.9
Renaming file/catalogue – Rename
It is possible to rename file or catalogue. In
order to do this one should select the
file/catalogue and press the <ENTER>
push-button. After opening the list of
operations one should select the Move
position and press the <ENTER> pushbutton again. The window with text editor
function will appear.
67
<ENT>
SVAN 106 User MANUAL
_
7.2.10 Information about file/catalogue – Info
It is possible to get information about file or
catalogue. In order to do this one should
select the file/catalogue and press the
<ENTER> push-button. After opening the
list of operations one should select the Info
position and press the <ENTER> pushbutton again. The instrument then will
display the information about selected
file/catalogue.
7.3
<ENT>
Managing the setup files – Setup Manager
The Setup Manager is used for checking
the contents of the memory and make
operation on Setup files such as: open,
delete, copy, move, rename files, create
new files and display file information.
In the Setup Manager window only setup
files are displayed. Setup files have
extension SVN and icon attribute
7.3.1
<ENT>
.
Saving the setup files
There are two options to open the
Setup Manager window. One option is to
press <S/P> push-button when the
measurement is not performed. Another
option is to open the Setup Manager
position from File menu.
<S/P>
In order to save the setup file one should
enter the catalogue in which the new file
will be created and press the <ENTER>
push-button at the <New File> position.
Save Setup window is opening then.
<ENT>
68
SVAN 106 User MANUAL
7.3.2
_
Operations on the setup files
The Setup Manager enables one to
perform operations on the setup files the
same way as it was described above for the
File Manager position. To perform any of
operation like: Open, Copy, Move,
Rename, Info and Delete one should
choose the file for which this operation will
be applied and press the <Enter> pushbutton. The list of operations then will open.
<ENT>
Opening the setup file means that the
settings saved in this file will be loaded to
the instrument's operation memory. So if
the user press <Start/Stop> push-button
the instrument will start the measurement
with the loaded settings.
<ENT>..
To get information about the setup file one
should for selected file press the <ENTER>
push-button on the Info position in the file
operations list. After opening the list of
operations one should select the Info
position and press the <ENTER> pushbutton again.
<ENT>
7.4
Controlling the data storing in the instrument’s memory - Save Options
The Save Options sub-list is used for the
selection of the options of data storing in
the instrument's files.
It is possible to replace the existing in the
memory file by the new with the same
name (Replace), to save automatically the
results of the measurements (Auto Save),
to save the results with the automatically
incremented name (Direct Save).
69
<ENT>
SVAN 106 User MANUAL
_
Replacement of the existing files by the new ones
This option is used in remote mode and for the files created by with the use
of Auto Save function. The result of the attempt to save the file with the
name, which already exists in the memory, depends on the setting of the
Replace. If position is active then the old file will be erased and the new file
will be saved with the same name.
The message is displayed that such operation is not available in the case
when this position is not active – cf. the description of the Save. In the other
case, the existing file is overwritten.
Controlling the measurement results savings
Using the Auto Save one can set the self-saving of the measurement
results with automatic number increment (Number) or to switch it off (Off).
This position was also established in order not to waist too much memory of
the instruments when the self-saving is not necessary. The Auto Name
position appears after switching on the Auto Save function.
Notice: The Auto Save function can be performed only in the case when the Meas. Period
(path: Menu / Measurement / General Settings) is not less than 10 seconds. If it is less than
10 seconds, the measurement results are not saved without any indication of that fact! There is
only one exception - when the Repetition Cycles (path: Menu / Measurement / General
Settings) is equal to one, the Auto Save function is executed disregarding of the value of the
integration period.
When the Meas. Period is too short for switching on the Auto Save option
or the Repetition No. is set to one the following message appears on the
display:
When the Auto Save option is active, after starting the measurements by pressing the <Start/Stop> pushbutton the results are saved in the file with the selected name.
Another measurement is started after next pressing of the <Start/Stop> push-button. The measurement is
stopped after the selected Measa. Cycle Time (path: Menu / Measurement / General Settings ). The name
numbers of the next saved files are automatically incremented by one. The same remarks are valid in this
case as it was already stated in the description of the Save Next function.
70
SVAN 106 User MANUAL
_
Edition the name of the Auto Save file
The Auto Name enables one to edit the
name of the Auto Save file. To edit the file
name the user has to press the <4
4> pushbutton. The text edition window is opening.
<4
4>
Direct access to the Save function
The Direct Save enables one to select the instrument’s reaction on the
simultaneous pressing of the <ENTER> and <Alt> push-buttons. If this
option is not active, after pressing these push-buttons the Save window is
accessed (if the measurements are not performed). If the option is active,
after pressing the <ENTER> and <Alt> push-buttons the results are saved
in the file with the automatically incremented name.
Press the <ENTER> and <Alt> push-buttons during the execution of the
measurements causes, disregarding the option set in the Direct Save, that
the message “Measurement in Progress” is displayed.
7.5
Options for setup files - Setup Options
The Setup Options sub-list is used for the
selection of the options for storing setup
files.
The Save User Filters is used for saving
the user filters together in the setup files.
<ENT>
71
SVAN 106 User MANUAL
_
8. SETTINGS OF THE INSTRUMENT PARAMETERS – Instrument
The Instrument list contains different sub-lists and positions, which are
directly related with the settings of the hardware components of the
instrument. In order to open the Instrument list one has to press the
<Menu> push-button, select the Instrument text and press <ENTER>.
The Instrument list contents depend on
Instrument Mode selection from menu
Auxiliary Setup:
Simple Mode
or
Advanced Mode.
In the Instrument list, the following items are available:
Keyboard
Multifunction I/O
Power Supply
RTC
Remote Control
Transducers
Unit Label
it enables the user to set the operating mode of the <Shift> and the
<Start/Stop> push-buttons.
it enables the user to select the available functionality of the I/O port.
it enables the user to check the powering source of the instrument.
it enables the user to set the Real Time Clock.
it enables the user to activate or deactivate error confirmation function.
it enables the user to activate or deactivate the transducer's compensation.
it enables the user to check the type of the instrument, its serial number and
the current software version installed in it and the standards, which the
instrument fulfils.
8.1 Selection of keyboard modes – Keyboard
The Keyboard position enables the user to
programme the operation mode of the
<Shift>, <Alt> and <Start/Stop> pushbuttons.
<ENT>
72
SVAN 106 User MANUAL
_
<Shift> / <Alt> push-button working mode selection
In the Shift Mode position the user can choose between 2nd Fun. and
Direct. When the Direct option is selected, the <Shift> and <Alt> pushbuttons operates as in the keyboard of a computer – in order to achieve the
desired result, the second push-button has to be pressed in conjunction
with the <Shift>/<Alt> one. When the 2nd Fun. option is selected the
<Shift>/<Alt> push-button operates in the sequence with the other one.
<Start/Stop> push-button working mode selection
In the Start/Stop position the user can choose between Direct and
With Shift. When the Direct option is selected the instrument reacts on
each of the <Start/Stop> push-button pressing, starting or stopping the
measurements.
When the With Shift option is selected the <Start/Stop> push-button
operates in conjunction or in a sequence with the <Shift> one. The
measurements are started or stopped after pressing both push-buttons.
8.2 Setting parameters of the I/O port - Multifunction I/O
The Multifunction I/O enables the user to
select the available functionality of the I/O
port.
<ENT>
Mode selection of the I/O port
In the Mode, it is possible to select the function of the instrument’s socket
named as I/O. This socket can be used as
• the output of the analogue signal (Analog Out) transmitted from the
input of the instrument to its output without any digital processing (i.e.
filtering),
• the input of the digital signal used as an external trigger to start the
measurements (Digital In) in the “slave” instrument,
• the digital output (Digital Out) used for triggering other “slave”
instrument from the “master” one,
• the source of any alarm signal in the case of certain circumstances
occurred during the measurements (i.e. the level of the input signal was
higher than selected one).
The more detailed description of the I/O is given in App. C.
73
<4
4>
SVAN 106 User MANUAL
_
Selection the channel for analogue output
In the Channel position it is possible to select the channel which signal is assigned to the analogue out.
Digital output function selection of the I/O socket
In the Function position, it is possible to set the function of the digital
output of the I/O instrument’s socket. The socket can be used as the source
of the trigger pulse (Trig. Pulse) which starts the measurement in another
“slave” instrument linked to the “master” one or the alarm signal which
appears there after fulfilling certain measurement conditions (Alarm Pulse).
Polarisation selection of the digital output signal
In the Polarisation position, it is possible to select which polarisation of the
signal (negative or positive) will be valid.
Active level selection of the digital output signal
In the Active Level position, it is possible to select which level of the signal
should be treated as a valid one (“negative” or “positive” logic): Low or
High.
Alarm duration selection
In the Hold Time position, it is possible to select the minimum duration of
alarm signal.
8.3 Checking the powering of the instrument – Power Supply
The Power Supply enables the user to
check the powering of the instrument:
internal battery condition, source and
voltage of the external power supply, and
also set the battery type for checking their
condition.
<ENT>
74
SVAN 106 User MANUAL
_
The instrument can be powered from four AA rechargeable or standard
batteries or from the USB interface when its USB Device socket is
connected by means of the cable to a PC. The view presented on the
display for each powering sources is different. The current battery voltage is
displayed together with its approximate state (in the graphical form).
8.4 Programming the instrument’s internal Real Time Clock – RTC
The RTC enables one to programme the
internal Real Time Clock. This clock is
displayed in the different places depending
on the selected presentation mode.
The window is closed and the instrument
returns to the Instrument list after pressing
the <ENTER> or <ESC> push-button.
<ENT>
The time edition is doing in the special window, which is opening after
pressing the <4
4> push-button. The selection of the setting parameter
(hour, minute, second, and also day, month and year) is performed using
the <3
3>, <4
4> push-buttons and the change of its value – using the <5
5>,
<6
6> push-buttons pressed together with the <Alt>.
The required date can be selected in a special window, which is opening
after pressing the <3
3>, <4
4> push-buttons when the Start Day text is
displayed inversely in the Timer sub-list.
In order to set data one has to select its position by means of the <3
3> ,
<4
4> and <5
5>, <6
6> push button and then press the <ENTER> pushbutton.
8.5 Activation the remote control error confirmation - Remote Control
75
SVAN 106 User MANUAL
_
The Remote Control position enables the user to activate or deactivate
error confirmation function. If Remote Control function is Enabled then the
instrument confirms warnings after 5 seconds and the user reaction is not
required. This function is very useful when the instrument is working as
remote controlled. If Remote Control function is Disabled then the
instrument waits for the user reaction. This mode is used in normal mode.
8.6 Transducer's compensation activation – Transducers
The Transducers position enables the user
to activate or deactivate the transducer's
noise compensation.
<ENT>
8.7 Checking the specification of the instrument - Unit Label
The Unit Label enables the user to check
the type of the instrument, its serial
number, the current software versions
installed in it and the standards, which the
instrument fulfils.
The displayed text is scrolled on the display
after pressing the <5
5>, <6
6>
pushbuttons.
<ENT>
Notice: The contents of the Unit Label should be always transmitted to the Svantek’s service
in the case of any problems faced by the user during the instrument’s operation.
76
SVAN 106 User MANUAL
_
9. AUXILIARY SETTINGS – Auxiliary Setup
The Auxiliary Setup list contains positions
directly related with measurements and not
related with the hardware components of
the instrument. In order to open the
Auxiliary Setup list the user has to: In
order to open the Auxiliary Setup list the
user has to press the <Menu> push-button,
select the Function position and press
<ENTER>.
<ENT>
In the Auxiliary Setup list, the following items are available:
Language
it enables the user to set language of the user interface.
Factory Settings
it enables the user to return to the default, factory settings.
Instrument Lock
it enables the user to lock the menu and to reduce the access to the
program functions of the instrument.
Instrument Mode
it enables the user to define the scope of available instrument functions and
adjust accordingly the lists in some menu windows.
Reference Levels
it enables the user to program the user filters.
User Filters
it enables the user to select the Vibration units in which the results of the
Vibration Units
it enables the user to select the Vibration units in which the results of the
measurements are to be given.
Warnings
it enables the user to switch on or off the warnings that can be displayed
during the operation of the instrument.
:
9.4.
Setting the language of the user interface – Language
The Language enables one to select the
language of the user interface.
For activation of the Russian version of the
user interface, the special code has to be
entered.
<ENT>
9.5.
77
Return to the factory settings – Factory Settings
SVAN 106 User MANUAL
_
The Factory Settings enables the user to
return to the default setup of the instrument.
The factory setup can be install also by
means of <Shift/Enter> and <Alt/Start>
push-buttons pressed together.
<ENT>
During the clearing process the message WAIT... is displayed. The
following message is displayed after the return to the default settings and
the instrument waits for the user’s reaction.
9.6.
Locking the menu - Instrument Lock
The Menu Lock sub-list enables the user
to lock (Pertial or Full Lock) and unlock
the menu.
In the case of default No Lock option all
available positions in the menu are
accessible due to the settings, which were
made.
<ENT>
The activation of Partial results in locking access to the Menu options, which are responsible for
measurement parameters. In the case of Full Lock no one position from the Menu lists is accessible and
after attempt of enter Menu the Menu Lock window appears on the display. The Menu is available after
unlocking it.
9.7.
Setting the scope of instrument's functions — Instrument Mode
The Instrument Mode sub-list enables the user to set the scope of
available instrument's functions. There are two possible modes of the
instrument: Simple Mode and Advanced Mode. Advanced Mode defines
the full scope of available functions, while Simple Mode defines limited
scope of available functions, excluding functions which are using quite rare,
like trigger, wave and event recording, user filters etc. Thus some menu
lists will have different view/contetn for different instrument modes.
78
SVAN 106 User MANUAL
_
Below some windows, different in simple and advanced modes are presented.
<=>
<=>
<=>
<=>
<=>
9.8.
79
Reference signal in vibration measurements - Reference Levels
SVAN 106 User MANUAL
_
The Reference Levels sub-list enables the
user to set the reference level of the
vibration signal. The values, which are set
here, are taken into account during the
calculations of the measurement results
expressed in the Logarithmic scale (with
the dB as the units).
<ENT>
-2
In the Acceleration position the user can set the reference level of the acceleration signal from 1 µms to
-2
100 µms . In the Velocity position, the user can set the reference level of the velocity signal. It is possible to
-1
-1
set this level from 1 nms to 100 nms .
9.9.
User filter setting – User Filters
The User Filters position enables the user to introduce the values of the
coefficients of the user filters. This position is active only in 1/1 Octave and
1/3 Octave modes.
9.10.
Selection of the Vibration units - Vibration Units
The Vibration Units position enables the
user to select the metric or non-metric
units.
It is possible to select the Non-Metric units
(e.g. g, ips, mil etc.) or Metric units (e.g.
2
m/s , m/s, m etc.).
<ENT>
9.11.
80
Warnings selection – Warnings
SVAN 106 User MANUAL
_
The Warnings enables the user to select
the messages, which could be displayed
during the operation of the instrument.
<ENT>
Saving the measurement results in a file
When the position is set to be active the special warning can be displayed
after pressing the <Start/Stop> push-button. It will be happened in a case
when the result of the previous measurement was not saved in a file of the
instrument.
The question Continue? appears with the warning message. There are
three options: Yes, No or Save. If Yes is chosen, the instrument returns to
the active mode of result presentation starting the new measurement
process. If No is chosen, the instrument returns to the active mode of
measurement result’s presentation without starting the new measurement
process. If Save option is chosen, then the measurement results are saved.
When the Vector Settings position is set to be active the special warning can be displayed after
Saving the measurement results in a file
When the position is set to be active the special warning can be displayed
after pressing the <Start/Stop> push-button. It will be happened in a case
when the result of the previous measurement was not saved in a file of the
instrument.
The question Continue? appears with the warning message. There are
three options: Yes, No or Save. If Yes is chosen, the instrument returns to
the active mode of result presentation starting the new measurement
process. If No is chosen, the instrument returns to the active mode of
measurement result’s presentation without starting the new measurement
process. If Save option is chosen, then the measurement results are saved.
If parameter Power Off is switch on then the instrument will send the message in case when the user is
switching it off.
Confirmation of the instrument switch off
If this parameter is switch on then the instrument will send the message in
case when the user is switching it off.
When the Power Off position is set to be active the special warning
appears after pressing the <On/Off> push-button to switch off the
instrument.
81
SVAN 106 User MANUAL
82
_
SVAN 106 User MANUAL
_
10. 1/1 AND 1/3 OCTAVE ANALYSER
The instrument operates as 1/1 Octave or 1/3 Octave analyser in a very similar way to the Level Meter
mode and, in addition, 1/1-octave or 1/3-octave analysis is performed in parallel with the Level Meter
operations. All 1/1-octave (with the centre frequencies from 2 kHz down to 0,5 Hz; in base two system) and
1/3-octave (with the centre frequencies from 2,50 kHz down to 0.40 Hz; in base two system) digital passband filters work in the real-time with the HP weighting filter (type 1 according to the IEC 61672-1 standard;
the filter characteristics are given in Appendix D) and the linear RMS detector.
The results of 1/1 Octave and 1/3 Octave
analysis (also called spectrum analysis)
can be examined by the user on a display
in the Spectrum presentation mode. The
availability of this mode can be switched on
or off by the user (path: <Menu> / Display /
Display Modes ).
..
1/1 Octave and 1/3 Octave spectrum for all centre frequencies of pass-band filters together with three
Total Values measured with selected by the user weighting filters are presented in the switched on
Spectrum mode.
10.1.
Selection of 1/1 Octave or 1/3 Octave analysis mode
In order to select the 1/1 Octave or
1/3 Octave analysis mode the user has to
enter the Function list by pressing the
<Menu> push-button, then - select the
Function text and press the <ENTER>
one.
<ENT>
Notice: It is not possible to change the current function during the measurements.
The instrument displays in this case for about 2 seconds the text: ”Measurement in
Progress”. In order to change the current measurement function the instrument must be
stopped!
10.2.
Setting the parameters of 1/1 Octave and 1/3 Octave analysis -
The execution of 1/1 Octave or 1/3 Octave analysis depends on settings of the General Settings list:
Measure Period and Repetition No.. Other parameters are setting up by default: weighing filter (HP),
frequency range (from 0,5 Hz up to 2 kHz for 1/1-octave analysis and from 0.40 Hz up to 2,50 kHz for 1/32
octave analysis) and measurement range (126 m/s ). In every 1/1 octave or 1/3 octave bandpass the RMS
result is measured.
83
SVAN 106 User MANUAL
_
Additionally to the bandpass RMS results three Total values are measured during 1/1 and 1/3 octave
analysis. Total values parameters (weighting filter, type of integration filer for acceleration, velocity or
displacement results and additional calibration factor) are setting up in the Total Values window (path:
<Menu> / Display / Spectrum Display Setup).
The output of the selected 1/1 Octave or 1/3 Octave filter can be also used as the triggering signal for
different trigger applications: triggering the logger, triggering the event recording, triggering the wave
recording and triggering the alarms.
10.3.
Activation of saving of 1/1 Octave and 1/3 Octave analysis results in the
logger’s file - Logger Results
The RMS results from 1/1 Octave or
1/3 Octave analysis can be saved in the
logger file. The spectrum saving in the
logger file can be activete for each channel
in the appropriate window (path: <Menu> /
Measurement
/
Data logging
/
Logger Results / 1/1 Octave or 1/3 Octave
).
<ENT>
If the None value is selected in the position Channel x then spectrum data
will not be saved in the logger file. If RMS value is selected, then RMS
spectrum will be saved in the logger file for this channel.
10.4.
Selection of the 1/1 Octave and 1/3 Octave bandpass results as triggering
source
For the 1/1 Octave or 1/3 Octave analysis functions it is possible to define
trigger events for logger, event, wave and alarm triggers, based on the
spectrum selected band level.
This trigger condition for above applications can be programmed in
windows: Logger Trigger, Event Recording Trigger, Wave Trigger and
Alarm Trigger. In these lists one should set up the Source to Spectrum
and select required band pass in the Result position.
84
SVAN 106 User MANUAL
_
The trigger condition can be defined for the selected in the position Result
bandpass of 1/1 Octave filters (0.50 Hz, 1.00 Hz, 2.00 Hz, 4.00 Hz,
8.00 Hz, 16.0 Hz, 31.5 Hz, 63.0 Hz, 125 Hz, 250 Hz, 500 Hz, 1.00 kHz and
2.00 kHz), or 1/3 Octave filters (0.40 Hz, 0.50 Hz, 0.63 Hz, 0.80 Hz,
1.00 Hz, 1.25 Hz, 1.60 Hz, 2.00 Hz, 2.50 Hz, 3.15 Hz, 4.00 Hz, 5.00 Hz,
6.30 Hz, 8.00 Hz, 10.0 Hz, 12.5 Hz, 16.0 Hz, 20.0 Hz, 25.0 Hz, 31.5 Hz,
40.0 Hz, 50.0 Hz, 63.0 Hz, 80.0 Hz, 100 Hz, 125 Hz, 160 Hz, 200 Hz,
250 Hz, 315 Hz, 400 Hz, 500 Hz, 630 Hz, 800 Hz, 1.00 kHz, 1.25 kHz,
1.60 kHz, 2.00 kHz, and 2.50 kHz), Total Level results with appropriate
filters can also be selected as a source: Total 1 (HP), Total 2 (Wd),
Total 3 (Bl Wd).
10.5.
Display options in 1/1 Octave and 1/3 Octave analysis mode
The Display list is used for setting the
various parameters, which are mainly
dedicated for the control of the spectrum
view. The following windows contain the
elements that influence the presentation of
the results of 1/1 Octave and 1/3 Octave
analysis:
<ENT>
Display Modes
enables one to switch on the spectrum presentation mode;
Spectrum Display Setup
enables one to select options for spectrum presentation:
10.6.
Spectrum Scale
to change the scale of the vertical axis of the graphical presentation, switch
on or off the grid, switch on or off autoscale;
Spectrum View
to choose the type of the spectrum to be presented;
Multichannel View
to select how many channels will be displayed simultaneously,
Total Values
to select parameters for Total Values presentation.
Presentation of 1/1 Octave and 1/3 Octave analysis results
The
Single Spectrum
and
Multiple spectrum
positions
of
the
Display Modes list are accessible only for
1/1 Octave and 1/3 Octave functions.
When Single Spectrum mode is switched
on the measurement screen in Spectrum
visualisation mode is like below.
85
=>
SVAN 106 User MANUAL
_
The user may shift the Y-axis during the
spectrum presentation after pressing the
<Shift> and <5
5> (or the <Shift> and
<6
6>) push-buttons.
<Sh/6
6>
The user may change the cursor position
by means of the <3
3>, <4
4> push-buttons.
The frequency and appropriate value are
presented in the line below the plot.
<4
4>...
When Multiple spectrum mode is switched
on the measurement screen in Spectrum
visualisation mode is like below.
=>
10.7.
Setting the scale of the spectrum results presentation – Spectrum Scale
The Spectrum Scale sub-list enables the
user to change the scale in the available
modes of graphical presentation of the
measurement results and switch on/off the
grid.
<ENT>
Setting the scale of the measurement
results presentation
Two options are available for the Scale
position: Linear and Logarithm. In the
case of the first one the graphical
presentation and the units both are linear.
In the latter case the graphical presentation
is given in the logarithmic scale and the
measurement results are expressed in
decibels (the result is related to the values
86
SVAN 106 User MANUAL
_
set in the Reference Level (path: <Menu> /
Auxiliary Setup / Reference Levels).
Spectrum presented
logarithmic scale
in
linear
and
Scaling the vertical axis of the graphical
mode presentation
The Dynamic position enables the user to
select the proper scaling of the graphical
mode presentation. In the case of the
vertical axis one can obtain the double, four
times and eight times expansion (as the
default the vertical axis corresponds to
80 dB, after expansion it corresponds to
40 dB, 20 dB and 10 dB – respectively).
Displays with the 1/1 Octave results
presented with different Dynamic parameter
(80 and 40 dB) are presented.
Switching on/off the grid in the graphical
mode presentation
The Grid enables the user to switch on or
off the grid in any graphical presentation.
Displays with the grid switched on and off
are presented.
Switching on/off the automatic Y-scale adjustment
The Autoscale position switch on the automatic adjustment of scale Y. This position is under development.
10.8.
Setting the parameters of the spectrum presentation - Spectrum View
In the Spectrum View window the user can
program the view of screen in the
Single spectrum and Multi spectrum
presentation modes and to set: spectrum
type to view (View),.filter (Filter), minimum
and maximum spectrum (Minimum and
Maximum).
<ENT>
87
SVAN 106 User MANUAL
_
In the position View the user can select the
different type of spectrum like: Averaged,
Instantaneous, Max or Min.
=>
In the case when the Averaged or
Instantaneous spectrum is selected the
user can additionally switch on the
presentation of Max and/or Min spectrum.
=>
10.9.
Selection of the channels for presentation – Multichannel View
The Multichannel View window enables
one to select for which channels spectrum
will be viewed during multi spectrum display
mode and to assign special color for the
spectrum curve.
<ENT>
10.10.
Setting the parameters for total values – Total Values
The position Total Values enables the user
to program parameters for total values
calculation. The are three total values,
calculated for each channel and for all three
total values it is possible to define weighting
filter, integration method and accordingly
type of signal measurement (acceleration,
velocity or displacement) as well as
calibration factor.
88
<ENT>
SVAN 106 User MANUAL
_
By default for the first Total value HP filter is denote. Second and third
Totals have same filters as were set up for profiles (Prof. 1 and Prof. 2) in
the Channels window (path: <Menu> / Measurement / Channels).
It is possible to select also tree user filters: FUSR1, FUSR2 and FUSR3.
When user filter is selected, two additional position appear: Type and
Cal. Factor.
In the position Type one can define type of integration to present measured
signal as acceleration (ACC), velocity (VEL) or displacement (DIL).
In the position Cal. Factor one can define additional calibration factor which
will be applied to the calculation of Total value.
Same settings can be done for Total 2 and Total 3 values.
10.11. Setting user filter coefficients for 1/1 Octave and 1/3 Octave analysis –
User Filters
The User Filters position (path: <Menu> / Auxiliary Settings / User Filters)
enables the user to introduce the values of the coefficients of the user
filters. This position is active only in 1/1 Octave and 1/3 Octave modes.
The User Filters position opens the window in which the user can clear
(Clear Vibration Filters) or edit (Edit Filter) the filter coefficients for
selected user filter FUSR1, FUSR2 and FUSR3.
The Clear Vibration Filters position opens
the window with warning before deletion the
user filter coefficients. In case of positive
answer, all coefficients of selected filter will
be zeroed.
<ENT>
The Edit Filter position opens the window
with table of filter coefficients. All positions
in this table can be edited.
<ENT>
The opened window contains the centre frequencies of the filters and their coefficients:
89
SVAN 106 User MANUAL
90
•
0.40 Hz: available values for 0.4 Hz centre frequency filter: -100.0dB ... 100.0dB
•
0.50 Hz: available values for 0.5 Hz centre frequency filter: -100.0dB ... 100.0dB
•
0.63 Hz: available values for 0.63 Hz centre frequency filter: -100.0dB ... 100.0dB
•
0.80 Hz: available values for 0.8 Hz centre frequency filter: -100.0dB ... 100.0dB
•
1.00 Hz: available values for 1Hz centre frequency filter: -100.0dB ... 100.0dB
•
...
•
2.50kHz: available values for 2.50 kHz centre frequency filter: -100.0dB ... 100.0dB
_
SVAN 106 User MANUAL
_
11. DOSIMETER FUNCTION
Activation of the dose meter function
The Dosimeter position activates or
deactivates the dose meter function. If the
Dosimeter function is switched on, then all
channels will be assigned for whole-body
(WBV)
or
hand-arm
(HAV)
dose
measurement.
<ENT>
Dosimeter parameters can be setup in the HAV/WBV Dosimeter window, opened from the Measurement
list. If the Dosimeter function is switched on, then the HAV/WBV Dosimeter position in the Measurement
list will became active and DLM, D1/1 or D1/3 function abbreviations appear in the upper line.
11.1.
Setting the parameters for dose measurements – HAV/WBV Dosimeter
The HAV/WBV Dosimeter list is opening from the Measurement menu.
This list enables one to set up the parameters for dose measurements, like:
exposition period, type of measurement (whole body or hand arm),
performed in channels 1-3 and 4-6, limits, used for some standards (U.K.,
Italy, Poland, France and Germany), as well as limits, defined by the user
(User).
Setting the measurement type for channels 1-3 and 4-6
Positions 1-3 Dosimeter and 4-6 Dosimeter enable the user to set the
desired type of the measurement, performed with the use of channels 1,2,3
and 4,5,6 – hand-arm (HAV) or whole-body (WBV) vibration.
Setting the exposure time
The Exposure Time enables the user to set the desired value of the
exposure time that is used for the calculation HAV/WBV Dose results. The
Exposure Time values are within the range [00h01, 24h00].
91
SVAN 106 User MANUAL
_
Setting the standard for dose measurements
The Standard position enables the user to set the standards for the
measurements of the HAV/WBV Dosimeter. The available values of this
position are U.K., Italy, Poland, France, Germany and User.
Depending of settings in the position Standard it is possible to view (U.K.,
Italy, Poland, French, Germany) or edit (User) limits for dose calculation.
View or edition of the limits for dose
calculation
The View Standard Limits position opens
the window with the coefficients for the
selected standard.
<ENT>
When the User is selected in the Standard
position then the Edit User Limits position
appears on the screen where the user can
set up its own coefficients.
<ENT>
11.2.
Setting parameters for channels – Channel x
The Channel x positions enable one to set up or display parameters for the
individual channel, like input type and filters for profiles.
If Dosimeter is active the first profile filter is set by default and it cannot be
changed. When second profile is switched off the filter for second profile
doesn’t appear as parameter in the list.
When Dosimeter function is active the filters for first profiles are predefined and depend on type of
dosimeter measurements for the channels – WBV or HAV.
If WBV measurements are performed in channels 1-3 or 4-6 the filters defined for channels are as follows:
Channel 1 or 4: Wd, Channel 2 or 5: Wd, Channel 3 or 6: Wk.
If HAV measurements are performed in channels 1-3 or 4-6 the filters defined for channels are as follows:
Channel 1 or 4: Wh, Channel 2 or 5: Wh, Channel 3 or 6: Wh.
92
SVAN 106 User MANUAL
_
If second profile is active during Dosimeter measurements, the filter can be HP or one of from BL Wd,
BL Wk or BL Wh depending on what filter was predefined for the first profile of the chosen channel,
according to the rule described above.
11.3.
Dosimeter presentation mode
The dosimeter presentation mode is 1
always active when Dosimeter is
switched on.
4
Fields description of the dosimeter 2
view
5
1
2
1. Channels used for dose calculation.
6
2. Function name: Daily Exposure, 3
AEQ,
MAX(RMS),
EAV Total Time, EAV Time Left,
ELV Total Time, ELV Time Left.
3
3. Second field for dose results measurement.
4. Elapsed time shows the current second of the measurement. The value presented there belongs to the
range [1, Meas. Period].
5. The value of measured function.
6. The value of measured function in the second field.
11.4.
Calculation of hand-arm and whole-body daily results – Calculator
The Calculator position is used to calculate
the various parameters, which are
dedicated to the dosimeter measurements.
This
position
opens
menu
Vibr. Dose calculator, which based on
selected
files
with
partial
results
(Selected Files) calculates HA and WB
daily results.
<ENT>
93
SVAN 106 User MANUAL
_
The Selected Files position is used to load
data from the files with dosimeter results. It
is possible to select up to 10 files. The
name of the file is accepted and the file is
loaded after pressing the <ENTER> pushbutton. The name of this file appears in a
list as it is presented below.
<ENT>
The message Invalid File Content is
displayed when the selected file does not
include dosimeter data. The instrument
waits for the reaction of the user until
pressing any push-button except the
<Shift> and <Alt>. After that, it returns to
the Selected Files list.
<ENT>
<Al/4
4>
<ENT>
<ENT>
<ENT>
94
SVAN 106 User MANUAL
_
<ENT>
<ENT>
The Exp Time (Exposure Time) defines the
period during that the measurement results
are extrapolated. The required value can be
set in the special window, which is opened
by means of the <3
3>, <4
4> push-buttons,
pressed together with the <Alt> one. The
Exposure Time can be set from 00h00m to
24h00m. The user can set the Exposure
Time for each file separately.
<Al/4
4>
<Al/4
4>
<ENT>
95
SVAN 106 User MANUAL
_
<ENT>
<ENT>
<ENT>
<ENT>
96
SVAN 106 User MANUAL
97
_
SV 106 USER MANUAL
A.
REMOTE CONTROL
The USB 1.1 interface is the serial one working with 12 MHz clock. Its speed is relatively high and
it ensures the common usage of USB in all produced nowadays Personal Computers.
The functions which are developed in order to control data flow in the serial interface ensure:
- bi-directional data transmission,
- remote control of the instrument.
The user, in order to programme the serial interface, has to:
1. send "the function code",
2. send an appropriate data file
or
3. receive a data file.
A.1.
Input / output transmission types
The following basic input / output transmission types (called functions) are available:
#1 input / output of the control setting codes,
#2 output of the measurement data in the vibration level meter (VLM) mode,
#3 output of the measurement data in 1/1 OCTAVE or 1/3 OCTAVE mode,
#4 read out the data file from the internal Flash-disc and/or the special file located in the RAM memory,
#6 remote setting of the user filters,
#7 special control functions,
#9 send the setup file to the internal Flash-disc.
A.2.
Function #1 – input / output of the control setting codes
Function #1 enables the user to send the control setting codes to the instrument and read out a file
of the current control state. A list of the control setting codes is given in Tab. A.1.
The format of #1 is defined as follows:
#1,Xccc,Xccc,(...),Xccc;
or
#1,Xccc,X?,Xccc,(...),X?,Xccc;
where:
X - the group code, ccc - the code value,
X? - the request to send the current X code setting.
The instrument will output a control settings file for all requests X? in the following format:
#1,Xccc,Xccc,(...),Xccc;
In order to read out all current control settings the user should send to the device the following
characters:
#1;
The instrument will output a control settings file in the format:
A−1
SV 106 USER MANUAL
.
#1,Xccc,Xccc,(...),Xccc;
Example: The following sequence of characters:
#1,U106,N4000,Z0:1,Z0:2,Z0:3,Z0:4,Z0:5,Z0:6,M3,Y1000,Xa1,Xv1,Xd1,XA0,XR0,S0;
means that:
-
the SV 106 is investigated (U106),
the unit’s number is 4000 (N4000),
the Vibration Level Mode is selected in channel 1 (Z0:1),
the Vibration Level Mode is selected in channel 2 (Z0:2),
the Vibration Level Mode is selected in channel 3 (Z0:3),
the Vibration Level Mode is selected in channel 4 (Z0:4),
the Vibration Level Mode is selected in channel 5 (Z0:5),
the Vibration Level Mode is selected in channel 6 (Z0:6),
the 1/3 OCTAVE analyser function is selected (M3),
the measurement start delay is equal to 1000 milliseconds (Y1000),
-2
the reference level for acceleration measurement is set to 1 µms (Xa1),
-1
the reference level for velocity measurement is set to 1 nms (Xv1),
the reference level for displacement measurement is set to 1 pm (Xd1),
the AutoSave option is switched off (XA0),
the RAM file will not be created (XR0),
the instrument is in the STOP state (S0).
Note: All bytes of that transmission are ASCII characters.
Note: Any setting can be changed only when the instrument is in the STOP state (S0).
A.3.
Function #2 – read-out of the measurement results in the VLM mode
Function #2 enables one to read out the current measurement data in the VLM Mode.
Notice: This function can also be programmed while measurements are taking place.
In this case, the RMS values measured after entering #2 function will be sent out.
#2 function has a format defined as follows:
#2,p,X?,X?,X?,(...),X?;
where:
X - the code of the result,
p - the number of the results set
-1,-2 – for reading vibration dose results for channels 1-3 and 4-6
13,14 - for reading vector results for channels 1-3 and 4-6
1,2,3,..,12 – for reading profile results
(calculated from the formulae: ChannelNumber + 6 * (ProfileNumber - 1)
Notice: After entering the STOP condition, #2 function is no longer active and has to be
reprogrammed in order to read-out successive measurements.
A−2
SV 106 USER MANUAL
The instrument will send the values of the results in the format defined as follows:
#2,p,Xccc,Xccc,Xccc,(...),Xccc;
(where p - the number of the results set)
#2,?;
(when the results are not available).
or
The codes of the results in the case of VLM mode are defined as follows:
V
the overload flag (ccc equals to 0 or 1);
T
time of the measurement (ccc – value in seconds);
P
the P–P value (ccc – the value in dB);
Q
the PEAK value (ccc – the value in dB);
M
the MTVV value (ccc – the value in dB);
R
the RMS value (ccc – the value in dB);
H
the VDV value (ccc – the value in dB);
v
the underrange value (ccc – the value in dB).
Example: After sending to the instrument the string:
#2,1,T?,V?,P?,R?;
one should receive the following answer:
#2,1,T3,V0,P76.92,R64.50;
The codes of the results in the case of Vibration Dose mode are defined as follows:
a
the Current Dose value (ccc – the value in dB);
b
the Daily Dose value (ccc – the value in dB);
c
the Current Exposure value (ccc – the value in dB);
f
the Daily Exposure value (ccc – the value in dB);
g
the EAV Time value (ccc – value in seconds);
h
time left to reach EAV value (ccc – value in seconds);
i
the ELV Time value (ccc – value in seconds);
j
time left to reach ELV value (ccc – value in seconds).
Example: After sending to the instrument the string:
#2,-1,c?,f?,g?,h?;
one should receive the following answer:
#2,-1,c-27.89,f-13.44,g172800,h172800,i172800,j172800;
The codes of the results in the case of Vector mode are defined as follows:
P
the PPV value if vector type is set to PPV (ccc – value in dB).
M
the MTVV value if vector type is set to MTVV (ccc – value in dB).
R
the RMS value if vector type is set to RMS (ccc – value in dB).
Notice: All bytes of that transmission are ASCII characters.
A−3
SV 106 USER MANUAL
.
A.4. Function #3 – read-out of the measurement results in 1/1 OCTAVE and
1/3 OCTAVE mode
Function #3 enables one to read out the current measurement data in 1/1 OCTAVE, 1/3 OCTAVE.
#3 function format is defined as follows:
#3,n;
where: n – the number of channel (1, 2, 3, 4, 5, or 6)
The device will respond, sending the last measured spectrum (when in STOP state) or currently
measured spectrum (in RUN state) in the following format:
#3,n;<Status Byte> <LSB of the transmission counter> <MSB of the transmission counter>
<data byte> (...) <data byte>
Status Byte gives the information about the current state of the instrument.
D7
D6
D5
D4
D3
D2
D1
D0
where:
D7
D6
D5
=1
=1
=0
=1
D0 to D4
denotes "overload indicator",
denotes "averaged spectrum",
the instantaneous current result (RUN State),
the final result (STOP State),
reserved bits.
Note: The measurement result is coded in binary form as dB•100 (e.g. 34.5 dB is sent as
binary number 3450).
A.5. Function #4 – read-out of the data file from the internal flash-disc and/or the
special file located in the RAM memory
Function #4 enables the user to read-out the data file from the internal Flash-disc memory.
The data file formats are given in Appendix B.
#4 function formats are defined as follows:
#4,0,\;
#4,1,FILE NAME;
#4,1,FILE NAME,addr;
#4,2,Bnnn;
#4,3;
the file containing the catalogue,
the file containing the measurement results or saved setup,
the file containing the measurement results or saved setup,
the file containing logger,
the special file contained in the RAM memory (RAMfile),
where:
FILE NAME
addr
nnn
RAMfile
A−4
not longer than eight-character name,
is the logical address of the file in the internal Flash-disc memory,
the number of the logger file (one or more digits - depends on
requirements).
the special name for the file contained in the RAM memory, may be used
also with the format:
#4,1,RAMfile;
SV 106 USER MANUAL
Notice: The "\" character is the obligatory catalogue file name (it must be sent
to the instrument).
The device will respond sending the specified file/catalogue in the following format:
#4,k;<4 bytes giving the file size (in binary form)><data byte>...<data byte>
where character k corresponds to the file type:
0 for the file containing the catalogue,
1 for the file containing the measurement results or saved setup,
2 for the file containing the logger file.
All data words are sent as <LSB>,<MSB>.
When an error is detected in the file specification or data, the instrument will send:
#4,?;
The catalogue of the files is a set of the records containing 16 words (16 bits each). Each record
describes one file saved in the instrument’s Flash-disc. The record structure is as follows:
words 0 - 3
8 character file name,
word 4
file type (binary number),
word 5
reserved,
word 6
least significant word of the file size,
word 7
most significant word of the file size,
word 8
least significant word of the file logical address,
word 9
most significant word of the file logical address,
word 10
measurement start date,
word 11
measurement start time,
words 12 - 15 reserved.
For logger and the RAMfile the logical address is always set to 0.
For files containing saved setup measurement start date and time are always set to 0.
Notice: If the DEFRAGMENTATION function is performed after the read out of the files
catalogue the logical addresses of the files could be wrong.
The measurement start date is coded as a word with bits:
b15 ... b3 b2 b1 b0
where:
b15 b14 b13 b12 b11 b10 b9 is a year minus 2000.
b8 b7 b6 b5
is a month (1..12),
b4 b3 b2 b1 b0
is a day (1..31).
The measurement start time is coded as number of seconds counted from 00:00:00 divided by 2.
The structure of the files containing the measurement results, saved setups and/or logger files
is described in details in Appendix B.
A.7.
Function #6 – remote setting of the user filters
Function #6 enables one to send to the instrument the coefficients of the user filters.
In the available formats description of #6 functions the following symbols are used:
A−5
SV 106 USER MANUAL
type
name, name1, name2
v
first
pos
avd
cal
chn
.
- 0 for the vibration filters,
- 1 for the acoustic filters,
- filter names given by the user,
- real type value, expressed in [dB],
- integer type value (number of the coefficient in the user filter),
- integer type value (Total value number),
- for the vibration filters: 0 - Acc, 1- Vel, 2 - Dil,
- for the acoustic filters this parameter is always equal to 0,
- the calibration coefficient given as the real number expressed in [dB].
- channel number (1, 2, 3 or 4).
#6 function formats are defined as follows:
#6,type,L;
This function returns the list of the defined (existing in the instrument) filters in the following format:
#6,type,n,name1, ... ,namen;
#6,type,W,name,v,v,...,v;
This function sets the coefficients of the new user filter named as name. The name parameter
should be unique (in the instrument there is not any other filter with the same name, otherwise it will
be an error). The function answers in the format: #6;
#6,type,R,name;
This function returns the coefficients of the user filter named as name. If the name filter does not
exist, an error occurs. The function returns in the following format: #6,type,n,v1,v2, ... ,vn;
#6,type,D,name;
This function deletes from the instrument the user filter named as name. If the name filter does not
exist, an error occurs. The function answers in the format: #6;
#6,type,S,name,v,v,...,v;
This function sets the user filter named as name. If the name filter already exists, its coefficients
are redefined. If the name filter does not exist, the filter is created. The function answers in the format:
#6;
#6,type,C,name,first,v,v,...,v;
This function sets the coefficients in the user filter named as name starting from the first position.
If the name filter does not exist, an error occurs. The function answers in the format: #6;
#6,type,N, name1, name2;
This function changes the name of the user filter from name1 to name2. The function answers
in the format: #6;
#6,type,@,chn,L;
This function returns the names of the user filters, assigned to the channel chn consecutive
TOTAL values, in the following format: #6,type,chn,3,name1,name2,name3;
#6,type,@,chn,pos,?;
This function returns the description record of the user filter assigned to the pos TOTAL value
of channel chn in the following format: #6,type,@,chn,pos,name,avd,cal; (the description record
contains: the name of the filter, its type and the calibration coefficient).
#6,type,@,chn,pos,*;
This function recovers the predefined filter for the pos TOTAL value of channel chn and returns
the following format: #6,type,@,chn,pos,name,avd,cal;
A−6
SV 106 USER MANUAL
#6,type,@,chn,pos,name,avd,cal;
This function sets the description record of the user filter assigned to the pos TOTAL value
of channel chn in the following format: #6,type,@,chn,pos,name,avd,cal;
The returned parameters: name, avd and cal are set in the description record after the execution
of the function. In the case of an error they can differ from the current parameters of the function.
Notice: In the case of an error all these functions return the following sequence
of the characters: #6?;
A.8.
Function #7 – special control functions
Function #7 enables the user to perform special control functions. Some of them should be used
with the extreme care.
#7 function formats are defined as follows:
#7,CB;
This function deletes all logger files in current directory on SD card. The function returns #7,CB;
This function is not accepted while the instrument is in the RUN state.
#7,BF;
This function returns free space in the format:
#7,BF,ddddd; (ddddd - number of bytes in decimal format).
#7,BN;
This function returns the number of logger files created to the current time in the format:
#7,BN,ddddd; (ddddd - number of logger files in decimal format).
#7,RT;
This function returns current real time clock settings in the format:
#7,RT,hh,mm,ss,DD,MM,YYYY;
where hh:mm:ss denotes the time and DD/MM/YYYY gives the date.
#7,RT,hh,mm,ss,DD,MM,YYYY;
This function sets the current real time clock and returns the following sequence of characters:
#7,RT;
#7,AS;
This function returns current real time and date settings for the AutoStart function in the format:
#7,AS,e,hh,mm,ss,DD; where e=1 if AutoStart function is switched ON or 0 if it is switched OFF,
hh:mm:ss gives the time and DD gives the day for the current date.
#7,AS,e,hh,mm,DD;
This function uses the given time and date settings for AutoStart function and returns the following
sequence of characters: #7,AS;
#7,SS;
A−7
SV 106 USER MANUAL
.
This function saves the current settings of the instrument in the EEPROM memory. The function
returns the following sequence of characters: #7,SS;
This function is not accepted and not performed while the instrument is in the RUN state.
#7,DA;
This function deletes all files containing measurement results and instrument’s settings
from the current directory. The function returns the following sequence of characters: #7,DA;
This function is not accepted and not performed while the instrument is in the RUN state.
#7,DF;
This function deletes all files containing measurement results from current directory.
The function returns the following sequence of characters: #7,DF;
This function is not accepted and not performed while the instrument is in the RUN state.
#7,DF,fileName;
This function deletes file named fileName containing measurement results. The function returns
the following sequence of characters: #7,DF;
This function is not accepted and not performed while the instrument is in the RUN state.
#7,DF,fileName<iAddr;
This function deletes file located at internal address iAddr containing measurement results
from the internal flash memory. The function returns the following sequence of characters: #7,DF;
This function is not accepted and not performed while the instrument is in the RUN state.
#7,DS;
This function deletes all files containing instrument’s settings from the internal flash memory.
The function returns the following sequence of characters: #7,DS;
This function is not accepted and not performed while the instrument is in the RUN state.
#7,DS,fileName;
This function deletes file named fileName containing instrument's settings from the internal flash
memory. The function returns the following sequence of characters: #7,DS;
This function is not accepted and not performed while the instrument is in the RUN state.
#7,DS,fileName<iAddr;
This function deletes file containing instrument's settings located at internal address iAddr
from the internal flash memory. The function returns the following sequence of characters: #7,DS;
This function is not accepted and not performed while the instrument is in the RUN state.
#7,AN,FName;
This function sets the name of the file for the Autosave function as the FName. The given name
has to start with the '@' character and contain no more than 8 characters. The function returns
the following sequence of characters: #7,AN;
This function is not accepted and not performed while the instrument is in the RUN state.
#7,AN;
This function returns current file name used by Autosave function in the format: #7,AN,FName;.
This function is not accepted and not performed while the instrument is in the RUN state.
#7,AV;
This function returns analyser firmware version in the format #7,AV,XX.XX.XXC; where XX.XX.XX
is firmware version, C – firmware subversion.
A−8
SV 106 USER MANUAL
#7,US;
This function returns unit subtype in the format #7,US,XX; where XX is subtype number.
#7,AL,?;
This function returns activated alarms list in the format: #7,AL,XX,XX,...,XX; where XX is alarm identifier.
#7,AL,XX;
This function returns SMS message text for activated alarm, where XX is alarm identifier.
#7,AL,R;
This function disables all alarm conditions and returns #7,AL,R1;
#7,LB;
This function returns current file name used for logging in the format: #7,LB,FName;.
#7,UH;
This function returns device selected for file storing in the format: #7,UH,XX;, where XX can be one
of: 0 - internal memory, 2 - SD card.
#7,UH,XX;
This function sets the device selected for file storing, where XX can be one of: 0 - internal memory,
2 - SD card. Function returns #7,UH,XX; where XX is selected device.
This function is not accepted and not performed while the instrument is in the RUN state.
#7,RC,?;
This function returns state of remote control mode in the format: #7,RC,x; where x can be 0
(disabled) or 1 (enabled).
#7,RC,x;
This function sets state of remote control mode to disabled in case X equals 0 or enabled
otherwise. Function returns #7,RC; upon success.
#7,CS;
This function loads factory settings.
The function returns the following sequence of characters: #7,CS;
This function is not accepted and not performed while the instrument is in the RUN state.
#7,PO;
This function switches the instrument off.
The function returns the following sequence of characters: #7,PO;
This function is not accepted and not performed while the instrument is in the RUN state.
#7,LT;
This function reloads transducer parameters from TEDS.
The function returns the following sequence of characters: #7,LT;
This function is not accepted and not performed while the instrument is in the RUN state.
A−9
SV 106 USER MANUAL
.
#7,IM,?;
This function returns instrument mode in the format #7,IM,X; where X equal to 0 means Simple
mode and Advanced otherwise
#7,IM,X;
This function sets instrument mode to Simple if X equals 0, and to Advanced if X equals 1.
Function returns the following sequence of characters: #7,IM,X;, where X is current instrument
mode.
This function is not accepted and not performed while the instrument is in the RUN state.
#7,BS;
This function returns battery charge level in the format #7,BS,nn; where nn is a percent value.
When battery state is not available (i.e. unit is powered from external source) function returns #7,BS,1;.
Notice: For the unknown function and/or in the case of the other error, all these functions
return the following sequence of characters: #7,?;
A.9.
Function #9 – writing setup files to the internal flash-disc
Function #9 allows uploading files containing instrument setup to the internal Flash-disc.
The function expects files in format described in Appendix B, paragraph B.9. Function should be used
with extreme care.
The #9 function format is defined as follows:
#9,2,Len,<data byte> ... <data byte>
where:
Len - length of transferred file in bytes as ASCII,
<data byte> - byte of data in binary form.
Function responds with “#9,1;” on success and with “#9,0;” on failure.
A.10. Control setting codes
The control setting codes used in the SV 106 instrument (starting from the internal software version
3.21.6) are given in the table below.
Table A.1. Control setting codes
Group name
Group
code
Unit type
Serial number
U
N
Software version number * 100
W
U106 (read only)
Nxxxx (read only)
Wxxx xxx - Analyzer version number * 100 (read
only)
Channel mode
Z
Z0:n -
A−10
Code description
Vibration LM / Analyzer for channel n
SV 106 USER MANUAL
Calibration factor
Q
Qnnnn:c nnnn - real number with the value of the
calibration factor for channel c in dB
∈(-99.9 ÷ 99.9)
Measurement function
M
M1 M2 M3 -
Level Meter
1/1 OCTAVE analyser
1/3 OCTAVE analyser
Execution of 1/1 OCTAVE or
1/3 OCTAVE analysis
in channel n
e
e0:n e1:n -
Spectrum analysis in channel n disabled
Spectrum analysis in channel n enabled
Range of channel n
R
R1:n -
316 ms (VLM)
Filter type in 1/1 OCTAVE or
1/3 OCTAVE analysis in channel n
for VLM
i
i0:n -
HP filter in channel n (read only)
I0:m
I5:m
I16:m
I17:m
I18:m
I19:m
I20:m
I21:m
I22:m
I23:m
I24:m
I118:m
I119:m
I120:m
I121:m
I122:m
I123:m
I124:m
HP filter for profile m
Vel3 filter for profile m
Wk filter for profile m
Wd filter for profile m
Wc filter for profile m
Wj filter for profile m
Wm filter for profile m
Wh filter for profile m
Wg filter for profile m
Wb filter for profile m
Wf filter for profile m
BL Wc filter for profile m
BL Wj filter for profile m
BL Wm filter for profile m
BL Wh filter for profile m
BL Wg filter for profile m
BL Wb filter for profile m
BL Wf filter for profile m
m = ChannelNo + 6 * (ProfileNo - 1)
-2
Filter type in profile for VLM
I
Detector type in profile for VLM
E
E4:m - 1 s detector in profile m
m = ChannelNo + 6 * (ProfileNo - 1)
Logger type in profile in the case of
VLM
G
G0:m - None logger in profile
Gxx:m - xx - sum of values for profile m:
1 – logger with PEAK values
2 – logger with P–P values
4 – logger with MAX values
8 – logger with RMS values
16 – logger with VDV values
m = ChannelNo + 6 * (ProfileNo - 1)
Storing the results of 1/1 OCTAVE
or 1/3 OCTAVE analysis in channel
n in logger file
g
g0:n g4:n -
d
dnnnn - nnnn number in milliseconds ∈(100, 200,
500, 1000)
dnns - nn number in seconds ∈(1 ÷ 60)
dnnm - nn number in minutes ∈(1 ÷ 60)
Logger time step
Integration time
D
D0
Dnns
Dnnm
Dnnh
switched off (none) in channel n
switched on (RMS) in channel n
“infinite” number
nn number in seconds
nn number in minutes
nn number in hours
A−11
SV 106 USER MANUAL
.
K0 Repetition cycle
K
Detector type in the LEQ (for SLM)
and/or RMS (for VLM) function
L
Measurement Trigger Mode
(TriggerMode)
Source of the triggering signal for
measurement functions: M1 and M6
(TriggerSource)
Channel of the triggering signal
infinity (measurement stopped when the
STOP button is pressed or when remote
setting S0 is received)
Knnnn - nnnn number of repetitions ∈(1 ÷ 1000)
L0 -
LINEAR
m
m0 m1 m2 m3 m4 m5 m6 m7 -
OFF
SLOPE +
SLOPE –
LEVEL +
LEVEL –
reserved
GRAD +
RTC
s
s0 s1 s2 s3 s4 -
Vector 1-3 value
Vector 4-6 value
reserved
RMS value from profile 1
External trigger
c
c1 c2 c3 c4 c5 c6 -
channel 1
channel 2
channel 3
channel 4
channel 5
channel 6
Source of the triggering signal for
measurement function
o
Source of the triggering signal for
measurement function M3
t
VLM’s trigger level (TriggerLev)
n
o0 Vector 1-3 value
o1 Vector 4-6 value
o2 reserved
o3 RMS value from profile 1
o4 External trigger
t0 Vector 1-3 value
t1 Vector 4-6 value
t2 reserved
t3 RMS value from profile 1
t4 External trigger
nxxx - xxx level given in dB ∈(60 ÷ 200)
VLM’s vector trigger level
(VecTriggerLev)
h
hxxx - xxx level given in dB ∈(60 ÷ 200)
Number of the records from the
logger taken into account before the
fulfilment of the triggering condition
(TriggerPre)
p
Number of the records from the
logger taken into account after the
fulfilment of the triggering condition
(TriggerPost)
q
Delay in the start of measurement
pnn -
nn number of the records taken into account
before the fulfilment of the triggering
condition ∈(0 ÷ 20)
qnn -
number of the records taken into account
after the fulfilment of the triggering condition
∈(0 ÷ 200)
Y
Ynn
nn delay given in milliseconds ∈(0 ÷ 60000)
Reference level for acceleration
(RefLev_a)
Xa
Xannn nnn reference level for acceleration given in
-2
µms ∈(1 ÷ 100)
Reference level for velocity
(RefLev_v)
Xv
Xvnnn nnn reference level for velocity
-1
given in nms ∈(1 ÷ 100)
Reference level for displacement
(RefLev_d)
Xd
Xdnnn nnn reference level for displacement given in
pm ∈(1 ÷ 100)
A−12
SV 106 USER MANUAL
AutoSave option
XA
XA0 XA1 -
Using the RAMfile instead of the
flash disk while storing results with
the AutoSave option switched on
XR
XR0 - switched OFF
XR1 - switched ON
Extended I/O Mode
x
x0 x1 x2 -
AC/Int. in Analogue mode
AC/Int. in Digital In mode
AC/Int. in Digital Out mode
External I/O Channel for analogue
AC/Int. mode
y
yn -
n - channel number between 1 and 6
State of the instrument
(Stop or Start)
S
S0 S1 -
STOP
START
Menu lock mode
Xb
Xb0 Xb1 Xb2 -
menu unlocked
menu partially locked
menu fully locked
Vector calculation mode
XB
switched OFF
switched ON, file names are numbered
XB0:n - switched OFF
XB1:n - HAV
XB2:n - WBV
XB3:n - user defined
XB3:n - MTVV
XB4:n - PPV
n - 1 for channels 1-3, 2 for channels 4-6
Channel coefficient for vector
calculation
XC
XCxx:k:n - xx - value of coefficient *100 ∈(0 ÷ 200)
- n - channel number
- k:
1 - vector 1-3
2 - vector 4-6
XD0:k - switched OFF
XD8:k - switched ON
Storing vector in logger file
XD
k:
1 - channels 1-3
2 - channels 4-6
Type of vibration dose
XE
XE1:k - HAV
XE2:k - WBV
k:
1 - channels 1-3
2 - channels 4-6
Vibration dose exposure time
XF
XFnn
nn - time in minutes ∈(0 ÷ 1440)
Vibration dose standard
XG
XG0 XG1 XG2 XG3 XG4 XG5 XG6 -
Great Britain
Italy
Poland
French
user defined
German
China
X axis channels
XH
XHN:1 - N - x axis channel for channels 1-3
XHN:2 - N - x axis channel for channels 4-6
Y axis channels
XI
XIN:1 - N - y axis channel for channels 1-3
XIN:2 - N - y axis channel for channels 4-6
Z axis channels
XJ
XJN:1 - N - z axis channel for channels 1-3
XJN:2 - N - z axis channel for channels 4-6
A−13
SV 106 USER MANUAL
.
Spectrum MAX store
XT
XT0
XT1
spectrum MAX switched OFF
spectrum MAX switched ON
Spectrum MIN store
Xt
Xt0
Xt1
spectrum MIN switched OFF
spectrum MIN switched ON
Trigger gradient level for VLM
Xh
Xgnn - nn – gradient level in dB/ms ∈ [1,100]
RTC trigger start time
Xr
Xrnn - nn – time in seconds ∈ [0,86399]
RTC trigger step time
Xs
Xs0 - use integration time for step
Xsnn - nn – step in seconds ∈ [1,86400]
Function for Digital In AC/Int. mode
XP
XP0 -
Function for Digital Out AC/Int.
mode
XQ
XQ0 - trigger pulse
XQ1 - alarm pulse
AC/Int. polarization
XU
XU0 - positive
XU1 - negative
AC/Int. active level
XV
XV0 XV1 -
Logger writing trigger
XXk
XXk0 - switched OFF
XXk1 - switched ON
Wave writing trigger
XXl
XXl0 - switched OFF
XXl1 - switched ON
Logging mode
XXm
trigger pulse
active low
active high
XXm0 - switched OFF
XXm1 - logger
XXm2 - wave
A−14
Channel input type
XXn
XXn0:P - direct
XXn1:P - IEPE
XXn2:P - building direct
XXn3:P - building IEPE
P - channel number
Measurement trigger
XXu
XXu0 - switched OFF
XXu1 - switched ON
Dosimeter enable
XXv
XXv0 - switched OFF
XXv1 - switched ON
Noise compensation
XXK
Simple trigger mode
XXXi
XXK0 - switched OFF
XXK1 - switched ON
XXXi0:K - OFF
XXXi1:K - LEVEL XXXi2:K - LEVEL +
XXXi3:K - SLOPE XXXi4:K - SLOPE +
XXXi5:K - GRADIENT –
XXXi6:K - GRADIENT +
K: simple trigger identifier. One of:
0 - alarm trigger
1 - logger trigger
2 - wave trigger
5 - event trigger
SV 106 USER MANUAL
Simple trigger integration period
XXXj
Simple trigger source
XXXk
Simple trigger level
XXXl
Simple trigger source type
XXXm
Simple trigger source channel
XXXp
XXXj0:K - logger step
XXXj1:K - 100 ms
XXXj2:K - 1 s
XXXj3:K - elapsed integration time
XXXj4:K - integration period
K: simple trigger identifier. One of:
0 - alarm trigger
1 - logger trigger
2 - wave trigger
5 - event trigger
XXXk0:K:M - Vector
XXXk1:K:M - PEAK
XXXk2:K:M - P–P
XXXk3:K:M - MAX
XXXk4:K:M - RMS
XXXk5:K:M - VDV
XXXk6:K:M - first spectrum bar
...
XXXk21:K:M - last 1/1 Octave spectrum bar
XXXk22:K:M - first 1/1 Octave total
XXXk23:K:M - second 1/1 Octave total
XXXk24:K:M - third 1/1 Octave total
XXXk44:K:M - last 1/3 Octave spectrum bar
XXXk45:K:M - first 1/3 Octave total
XXXk46:K:M - second 1/3 Octave total
XXXk47:K:M - third 1/3 Octave total
K: simple trigger identifier. One of:
0 - alarm trigger
1 - logger trigger
2 - wave trigger
5 - event trigger
M: simple trigger source type (cf. XXXm)
XXXlN:K - N – level in dB*10
K: simple trigger identifier. One of:
0 - alarm trigger
1 - logger trigger
2 - wave trigger
5 - event trigger
XXXm0:K - Vector
XXXm1:K - Profile
XXXm2:K - Spectrum
K: simple trigger identifier. One of:
0 - alarm trigger
1 - logger trigger
2 - wave trigger
5 - event trigger
XXXpN:K - N - channel
K: simple trigger identifier. One of:
0 - alarm trigger
1 - logger trigger
2 - wave trigger
5 - event trigger
A−15
SV 106 USER MANUAL
.
Simple trigger source channels
XXXq
XXXq0:K - Channels 1-3
XXXq1:K - Channels 4-6
K: simple trigger identifier. One of:
0 - alarm trigger
1 - logger trigger
2 - wave trigger
5 - event trigger
Hand-Arm EAV User limit
XXXr
XXXrN - N – limit value*100
Hand-Arm ELV User limit
XXXs
XXXsN - N – limit value*100
Whole Body EAV User limit
XXXt
Whole Body ELV User limit
XXXu
vibration dosimeter user unit type
XXXv
enabled channels
XXXw
enable 2nd profile
XXXx
interface language
XXXy
A−16
XXXtN:P - N – limit value*100
Paxis number
1 - X axis
2 - Y axis
3 - Z axis
XXXuN:P - N – limit value*100
Paxis number
1 - X axis
2 - Y axis
3 - Z axis
2
XXXv0:P - m/s
1.75
XXXv1:P - m/s
Plimit index
0 - H-A EAV
1 - H-A ELV
2 - WBV EAV
3 - WBV ELV
XXXw0 - all channels
XXXw1 - channels 1-3
XXXw2 - channels 4-6
XXXx0 - 2nd profiles disabled
XXXx1 - 2nd profiles enabled
XXXy0 - english
XXXy1 - polish
XXXy2 - italian
XXXy3 - russian
XXXy7 - german
SVAN 106 USER MANUAL – Appendix B
B.
DATA FILE STRUCTURES (v3.21)
B.1.
Structure of the SVAN 106 file
Each file containing data from the SVAN instrument consists of several groups of words. In the
case of the SVAN 106 there are some different types of files that contain:
• the measurement results from the Level Meter mode (cf. App. B.3.1.);
• the results from the Level Meter mode stored in the file in the instrument’s logger (cf. App. B.3.1. and
App. B.4);
• the setup data of the instrument (cf. App.B.3.3);
• the results from 1/1 OCTAVE analysis (cf. App. B.3.4.);
• the results from 1/3 OCTAVE analysis (cf. App. B.3.5.);
• the results from 1/1 OCTAVE or 1/3 OCTAVE analysis stored in the file in the instrument’s logger
(cf. App. B.4 and App. B.3.6);
•
•
•
Each file has the following elements:
a file header (cf. Tab. B.1.1);
the unit and internal software specification (cf. Tab. B.1.2);
the marker for the end of the file (cf. Tab. B.1.11).
The other elements of the file structure are not obligatory for each file type stated above.
They depend on the file type (LM, 1/1 OCTAVE, 1/3 OCTAVE, file from the logger, setup file). These
elements are as follows:
• the parameters and global settings, common for all channels (cf. Tab. B.1.3);
• the hardware settings for channels (cf. Tab. B.1.4);
• the software settings for channels (cf. Tab. B.1.5);
• the VECTOR measurement settings (cf. Tab. B.1.6);
• the hand-arm and whole-body vibration dose measurement settings (cf. Tab. B.1.7);
• the main results (cf. Tab. B.1.8);
• the logger header (cf. Tab. B.1.9);
• the data stored during the measurements in the logger (cf. Tab. B.1.10);
• the setup data of the instrument (cf. Tab. B.1.12);
• the trigger settings (cf. Tab. B.1.13, Tab.B.1.14);
• event recording settings( cf. Tab.B.1.15);
• the 1/1 OCTAVE or 1/3 OCTAVE analysis header (cf. Tab. B.1.16);
• the results coming from 1/1 OCTAVE analysis (cf. Tab. B.1.17);
• the results coming from 1/3 OCTAVE analysis (cf. Tab. B.1.18);
• the totals description in 1/1 OCTAVE or 1/3 OCTAVE analysis (cf. Tab. B.1.19);
• the user-defined filter description (cf. Tab. B.1.21);
• the 1/1 OCTAVE or 1/3 OCTAVE logger header (cf. Tab. B.1.22);
• the Max results coming from 1/1 OCTAVE analysis (cf. Tab. B.1.23);
• the Min results coming from 1/1 OCTAVE analysis (cf. Tab. B.1.24);
• the Max results coming from 1/3 OCTAVE analysis (cf. Tab. B.1.25);
• the Min results coming from 1/3 OCTAVE analysis (cf. Tab. B.1.26);
• the SEAT measurements settings (cf. Tab. B.1.27);
Below, all file structure groups are described separately in Tab. B.1.1 ÷ Tab. B.1.27. The format
used in the columns, named Comment with the square parenthesis ( [xx, yy] ), means the contents
of the word with xx is the most significant byte (MSB) and yy the least significant byte (LSB) of the word.
The format 0xnnnn means that the nnnn is four-digit number in hexadecimal form.
B-1
SVAN 106 USER MANUAL – Appendix B
.
Table B.1.1. File header
Word
number
Name / Value
Comment
0
0xnn01
1..4
FileName
5
FileType
6
7
8..11
…
CurrentDate
CurrentTime
AssBufFileName
…
[01, nn=header_length]
file or logger name (8 characters)
if the name starts with two '@' characters, following 6 bytes contain
measurement date and time coded as BCD (each saved digit is
increased by one)
0x0000 - file containing results from logger’s file
0x01nn - file containing measurements results
0x0200 - file containing instrument’s setup data
0x4000 - file containing time-domain signal
file creation date
file creation time
name of the associated logger or file (8 bytes)
…
Table B.1.2. Unit and software specification
Word
number
Name / Value
0
1
2
3
4
5
6
7
8
…
0xnn02
UnitNumber
UnitType
SoftwareVersion
SoftwareIssueDate
UnitSubtype
FilesystemVersion
reserved
0xmmcc
…
Comment
[02, nn=specification_length]
unit number
unit type: 106
software version * 100
software issue date
unit subtype: 1
file system version * 100
Reserved
[mm=software minor version, cc=software subversion]
…
Table B.1.3. Parameters and global settings
Word
number
Name / Value
0
1
2
0xnn04
CycleStartDate
CycleStartTime
3
DeviceFunction
B-2
Comment
[04, nn=block_length]
measurement cycle start date
measurement cycle start time
1 - LEVEL METER, 2 - 1/1 OCTAVE analyser,
3 - 1/3 OCTAVE analyser, 4 - sound DOSE METER,
6 - FFT analyser, 8 - RT60 meter, 13 - FFT CROSS-SPECTRUM,
14 - SOUND INTENSITY, 17 - WAVERECORDER
SVAN 106 USER MANUAL – Appendix B
4
5
6
7..8
9
10
11
12
13
14
15
16
17
18
19
20
21
22
23
24
flags word (16 bits): b15 ... b3 b2 b1 b0
b0 - if set to 1: calibration coefficient is used
b1 - if set to 1: overload occurred
b2 - if set to 1: "Human vibrations" excluded (0 - means "Human
vibrations" included and then VDV result is present)
b5,b4,b3: type of the result Result[p][7] (p = 1,2,3,4)
000 - Lden result is not available
001 - Ld result
010 - Le result
011 - Lde result
UnitFlags
100 - Ln result
101 - Lnd result
110 - Len result
111 - Lden result
th
b6 - if set to 1: overload occurred in the 6 channel
th
b7 - if set to 1: overload occurred in the 5 channel
th
b8 - if set to 1: overload occurred in the 4 channel
rd
b9 - if set to 1: overload occurred in the 3 channel
nd
b10 - if set to 1: overload occurred in the 2 channel
st
b11 - if set to 1: overload occurred in the 1 channel
b12, ..., b15 - reserved
0 - infinity
RepCycle
nnnn - number of repetitions ∈(1 ÷ 1000)
StartDelay
start delay time specified in milliseconds ∈(1 ÷ 60000)
0 - infinity
IntTimeSec
integration time specified in seconds
MeasureTriggerChann source channel of the triggering signal:
st
th
el
0 (the 1 channel) .. 5 (the 6 channel)
trigger mode: 0 - OFF, 1 - SLOPE+, 2 - SLOPE– ,
MeasureTriggerMode
3 - LEVEL+, 4 - LEVEL–, 6 - GRADIENT+, 7 - RTC
source of the triggering signal:
0 - the VEC 1-3 result
MeasureTriggerSource
1 - the VEC 4-6 result
4 - the RMS(1) result from the selected channel
5 - the External trigger
level of triggering:
MeasureTriggerLev
60..200 dB in the case of source channel in Vibration Meter mode
MeasureVecTriggerLe
level of triggering for VEC result: 60..200 dB
v
number of the records taken into account before the fulfilment
LoggerTriggerPre
of the triggering condition ∈(1 ÷ 20)
number of the records taken into account after the fulfilment
LoggerTriggerPost
of the triggering condition ∈(1 ÷ 200)
LeqInt
detector's type in the LEQ function: 0 - LINEAR, 1 - EXPONENTIAL
Reserved
Reserved
-2
RefLev_a
reference level for acceleration given in µms ∈(1 ÷ 100)
-1
RefLev_v
reference level for velocity given in nms ∈(1 ÷ 100)
RefLev_d
reference level for displacement given in pm ∈(1 ÷ 100)
NofChannels
number of channels (6)
NofProfiles
number of profiles (12)
NotSpect
number of spectrum
reserved
Reserved
B-3
SVAN 106 USER MANUAL – Appendix B
25
26
27
28
29
30
31
32
33
34
35
36
37..38
39
…
CalibrType
.
calibration type:
0 - calibration not performed
1 - calibration by measurement
2 - calibration by sensitivity
date of the last calibration
time of the last calibration
the gradient level for gradient trigger mode
Reserved
Reserved
Reserved
Reserved
Reserved
Reserved
Reserved
CalibrDate
CalibrTime
MeasureTriggerGrad
reserved
reserved
reserved
reserved
reserved
reserved
reserved
CycleMeasurementSta
measure start date
rtDate
CycleMeasurementSta
measure start time
rtTime
Channels used for measurement as bitfield:
b0 - channel 1 enabled
enabledChannels
b1 - channel 2 enabled
..
b5 - channel 6 enabled
…
…
Table B.1.4. Hardware settings for channels
Word
number
Name / Value
0
1
0xnn05
0xkk06
2
ChannelMode[1]
3
4
5
6
7
8
9
…
kk*5 + 1
CalibrFactor[1]
Reserved
Reserved
Reserved
Reserved
Reserved
RangeDB[1]
…
0xkk06
kk*5 + 2
ChannelMode[6]
kk*5 + 3
kk*5 + 4
kk*5 + 5
kk*5 + 6
kk*5 + 7
kk*5 + 8
kk*5 + 9
CalibrFactor[6]
Reserved
Reserved
Reserved
Reserved
Reserved
RangeDB[6]
B-4
Comment
[05, nn=block_length]
[06, kk=sub-block_length]
st
mode of the 1 channel
0 - Vibration Level Meter / Analyser
st
calibration factor (*10 dB) in the 1 channel
always 1
Reserved
Reserved
Reserved
Reserved
st
Range in the 1 channel as dB*100
…
[06, kk=sub-block_length]
th
mode of the 6 channel:
0 - Vibration Level Meter / Analyser
th
calibration factor (*10 dB) in the 6 channel
always 1
Reserved
Reserved
Reserved
Reserved
th
Range in the 6 channel as dB*100
SVAN 106 USER MANUAL – Appendix B
force_flags1
force_buffer1
force_flags2
force_buffer2
…
…
flags word (16 bits): b15 ... b3 b2 b1 b0
b0 - if set to 1: 1st force channel results have been calculated
b1 ... b15 – reserved
logger contents in the 1st force channel defined as a sum of:
1 - for PEAK results,
2 - for MAX results,
4 - for MIN results,
8 - for AVER results,
flags word (16 bits): b15 ... b3 b2 b1 b0
b0 - if set to 1: 2nd force channel results have been calculated
b1 ... b15 - reserved
logger contents in the 2nd force channel defined as a sum of:
1 - for PEAK results,
2 - for MAX results,
4 - for MIN results,
8 - for AVER results,
…
Table B.1.5. Software settings for channels
Word
number
Name / Value
0
1
0xnn07
0x040C
2..7
ProfileSett[1]
the 1 profile settings for the 1 channel, defined
in the case of VLM mode - in Table B.1.5_VLM
8..13
ProfileSett[2]
the 1 profile settings for the 2 channel, defined
in the case of VLM mode - in Table B.1.5_VLM
14..19
ProfileSett[3]
the 1 profile settings for the 3 channel, defined
in the case of VLM mode - in Table B.1.5_VLM
20..25
ProfileSett[4]
the 1 profile settings for the 4 channel, defined
in the case of VLM mode - in Table B.1.5_VLM
26..31
ProfileSett[5]
the 1 profile settings for the 5 channel, defined
in the case of VLM mode - in Table B.1.5_VLM
32..37
ProfileSett[6]
the 1 profile settings for the 6 channel, defined
in the case of VLM mode - in Table B.1.5_VLM
38..43
ProfileSett[7]
the 2 profile settings for the 1 channel, defined
in the case of VLM mode - in Table B.1.5_VLM
44..49
ProfileSett[8]
the 2 profile settings for the 2 channel, defined
in the case of VLM mode - in Table B.1.5_VLM
50..55
ProfileSett[9]
the 2 profile settings for the 3 channel, defined
in the case of VLM mode - in Table B.1.5_VLM
56..61
ProfileSett[10]
the 2 profile settings for the 4 channel, defined
in the case of VLM mode - in Table B.1.5_VLM
62..67
ProfileSett[11]
Comment
[07, nn=block_length]
[used_channel, used profile]
st
st
st
nd
st
rd
st
th
st
th
st
th
nd
st
nd
nd
nd
rd
nd
th
nd
th
the 2 profile settings for the 5 channel, defined
in the case of VLM mode - in Table B.1.5_VLM
B-5
SVAN 106 USER MANUAL – Appendix B
.
nd
68..73
ProfileSett[12]
…
…
th
the 2 profile settings for the 6 channel, defined
in the case of VLM mode - in Table B.1.5_VLM
…
Table B.1.5_VLM. Software settings for a channel in the case of VLM mode
Word
number
Name / Value
Comment
0
1
0xnn08
ChannelNo
2
FilterP
3
DetectorP
4
BufferP
5
ProfileFlags
…
…
[08, nn=sub-block_length]
st
channel number: 0 - the 1 channel
filter type in the channel: 0 - HP, 5 - VEL3, 16 - Wk, 17 - Wd, 18 Wc, 19 - Wj, 20 - Wm, 21 - Wh, 22 - Wg, 23 - Wb, 24 - Wf, 116 BL Wk, 117 - BL Wd, 118 - BL Wc, 119 - BL Wj, 120 - BL Wm,
121 - BL Wh, 122 - BL Wg, 123 - BL Wb, 124 - BL Wf
detector type in the channel:
0 - 100 ms,
1 - 125 ms,
2 - 200 ms,
3 - 500 ms,
4 - 1 s,
5 - 2 s,
6 - 5 s,
7 - 10 s
logger contents in the channel defined as a sum of:
1 - for PEAK results,
2 - for P–P results,
4 - for MAX results,
8 - for RMS results,
16 - for VDV results
flags word (16 bits): b15 ... b3 b2 b1 b0
b0 - if set to 1: profile results have been calculated
b1 ... b15 - reserved
…
Table B.1.6. Vector measurement settings
Word
number
Name / Value
0
1
0xnn38
vecNo
2
vecChMask
3
4
5
6
7
Buffer
VectorCoeff[1]
VectorCoeff[2]
VectorCoeff [3]
VectorCoeff [4]
B-6
Comment
[1E, nn=sub-block_length]
Vector id: 0 - VEC 1-3, 1 - VEC 4-6
Channels used for vector calculation:
b0 - if set to 1: channel 1 was used for calculation
b1 - if set to 1: channel 2 was used for calculation
b2 - if set to 1: channel 3 was used for calculation
b3 - if set to 1: channel 4 was used for calculation
b4 - if set to 1: channel 5 was used for calculation
b5 - if set to 1: channel 6 was used for calculation
vector result logging: 0 - OFF, 8 – RMS
st
vector coefficient for the RMS value from the 1 channel (*100)
nd
vector coefficient for the RMS value from the 2 channel (*100)
rd
vector coefficient for the RMS value from the 3 channel (*100)
th
vector coefficient for the RMS value from the 4 channel (*100)
SVAN 106 USER MANUAL – Appendix B
8
9
10
…
VectorCoeff [5]
VectorCoeff [6]
type
…
th
vector coefficient for the RMS value from the 5 channel (*100)
th
vector coefficient for the RMS value from the 6 channel (*100)
vector type: 0 - RMS vector, 1 - MTVV, 2 - PPV
…
Table B.1.7. Settings for vibration dose measurement
Word
number
0
Name / Value
Comment
0xnn1F
[1F, nn=block_length]
0 - dosimeter 1-3
1 - dosimeter 4-6
type of dosimeter: 1 - Hand-Arm measurement, 2 - Whole-Body
measurement
channel of x axis
channel of y axis
channel of z axis
exposure time in minutes
standard: 0 - UK, 1 - Italy, 2 - Poland, 3 - French, 4 - User, 5 German
Hand-Arm x-axis action value*100
Hand-Arm y-axis action value*100
Hand-Arm z-axis action value*100
Hand-Arm x-axis limit value*100
Hand-Arm y-axis limit value*100
Hand-Arm z-axis limit value*100
Whole-Body x-axis action value*100
Whole-Body y-axis action value*100
Whole-Body z-axis action value*100
Whole-Body x-axis limit value*100
Whole-Body y-axis limit value*100
Whole-Body z-axis limit value*100
type of HAV_EAV value ( 0 - RMS based, 1-VDV based )
type of HAV_ELV value ( 0 - RMS based, 1-VDV based )
type of WBV_EAV value ( 0 - RMS based, 1-VDV based )
type of WBV_ELV value ( 0 - RMS based, 1-VDV based )
…
1
doseIdx
2
doseType
3
4
5
6
xAxis
yAxis
zAxis
ExposureTime
7
Standard
8
8
8
9
9
9
10
10
10
11
11
11
12
13
14
15
…
HAV_EAV_X
HAV_EAV_Y
HAV_EAV_Z
HAV_ELV_X
HAV_ELV_Y
HAV_ELV_Z
WBV_EAV_X
WBV_EAV_Y
WBV_EAV_Z
WBV_ELV_X
WBV_ELV_Y
WBV_ELV_Z
Unit[1]
Unit[2]
Unit[3]
Unit[4]
…
Table B.1.8. Main results
Word
number
Name / Value
0
1
0xnn0D
0x040C
2..15
MainResults[1]
16..29
MainResults[2]
30..43
MainResults[3]
Comment
[0D, nn=sub-block_length]
[used_channel, used profiles]
st
st
main results from the 1 profile of the 1 channel, defined
in the case of VLM mode - in Table B.1.8_VLM
st
nd
main results from the 1 profile of the 2 channel, defined
in the case of VLM mode - in Table B.1.8_VLM
st
rd
main results from the 1 profile of the 3 channel, defined
in the case of VLM mode - in Table B.1.8_VLM
B-7
SVAN 106 USER MANUAL – Appendix B
.
st
44..57
MainResults[4]
58..71
MainResults[5]
72..85
MainResults[6]
86..99
MainResults[7]
100..113
MainResults[8]
114..127
MainResults[9]
128..141
MainResults[10]
142..155
MainResults[11]
156..169
MainResults[12]
170
171
172..
Vec13
Vec46
Force13
Force46
...
...
th
main results from the 1 profile of the 4 channel, defined
in the case of VLM mode - in Table B.1.8_VLM
st
th
main results from the 1 profile of the 5 channel, defined
in the case of VLM mode - in Table B.1.8_VLM
st
th
main results from the 1 profile of the 6 channel, defined
in the case of VLM mode - in Table B.1.8_VLM
nd
st
main results from the 2 profile of the 1 channel, defined
in the case of VLM mode - in Table B.1.8_VLM
nd
nd
main results from the 2 profile of the 2 channel, defined
in the case of VLM mode - in Table B.1.8_VLM
nd
rd
main results from the 2 profile of the 3 channel, defined
in the case of VLM mode - in Table B.1.8_VLM
nd
th
main results from the 2 profile of the 4 channel, defined
in the case of VLM mode - in Table B.1.8_VLM
nd
th
main results from the 2 profile of the 5 channel, defined
in the case of VLM mode - in Table B.1.8_VLM
nd
th
main results from the 2 profile of the 6 channel, defined
in the case of VLM mode - in Table B.1.8_VLM
RMS value of vector VEC 1-3 (*100 dB)
RMS value of vector VEC 4-6 (*100 dB)
st
main results from the 1 force channel
nd
main results from the 2 force channel
...
Table B.1.8_VLM. One-profile main results in the case of VLM mode
Word
number
Name / Value
Comment
0
0xnn0E
1..2
MeasureTime
3
4
5
6
7
8
9
10
11
12
13
…
Result[1]
Result[2]
Result[3]
Result[4]
Result[5]
Result[6]
Result[7]
Result[8]
Result[9]
Result[10]
Result[11]
…
[0E, nn=sub-block_length]
st
time of the measurement in the channel (if the 1 profile in channel)
overload time in the channel (if second profile in channel)
PEAK value in the profile (*100 dB)
P–P value in the profile (*100 dB)
reserved
reserved
MTVV (or MAX) value in the profile (*100 dB)
VDV value in the profile (if UnitFlags bit b2 is set to 0) (*100 dB)
RMS value in the profile (*100 dB)
reserved
reserved
reserved
reserved
…
Table B.1.8_FORCE. One force channel main results
Word
number
Name / Value
0
1
2
0xnn49
Result[1]
Result[2]
B-8
Comment
[49, nn=sub-block_length]
PEAK force value (*100 N)
MIN force value (*100 N)
SVAN 106 USER MANUAL – Appendix B
3
4
…
Result[3]
Result[4]
…
MAX force value (*100 N)
AVERAGE force value (*100 N)
…
Table B.1.9. Header of the file from the logger
Word
number
Name / Value
0
1
2
3
4..5
6..7
0xnn18
BufResOffs
BuffTSec
BuffTMilisec
BuffLength
RecsInBuff
8..9
RecsInObserv
10..11
AudioRecs
…
…
Comment
[18, nn=header_length]
position of the first saved result
logger time-step - full seconds part
logger time-step - milliseconds part
logger length (bytes)
number of records in the logger
number of records in the observation period equal to:
number of records in the logger + number of records not saved
number of audio records in the logger
…
Note: The current logger time step in seconds can be obtained from the formulae:
T = BuffTSec + BuffTMilisec / 1000.
Table B.1.10. Contents of the file from the logger
Word number
Name / Value
0..(BuffLength/2-1)
Comment
result#1, result#2, ... result#(BuffLength/2-1)
Table B.1.11. File end marker
Word number
Name / Value
0
0xFFFF
Comment
file end marker
Table B.1.12. Data block of instrument’s setup
Word number
Name / Value
0
1
2..BlockLength-1
…
0x0020
BlockLength
SetupData
…
Comment
[20, 00=block length in the next word]
block length
saved setup values
…
B-9
SVAN 106 USER MANUAL – Appendix B
.
Table B.1.13. Trigger settings
Word
number
Name / Value
0
1
2
3
4
5
...
...
…
...
...
...
...
…
…
…
…
…
…
…
0x0031
BlockLen
NProfileTriggers
NSpectTriggers
NVectTriggers
Vector13Condidtion
Vector46Condidtion
ProfTriggCond1
…
ProfTrigCondN
SpectTriggCond1
...
SpectTriggCondN
AlarmCond
LoggerCond
WaveCond
SMSCond
MailCond
EventCond
…
Comment
[31, 00=block length in the next word]
block length
number of trigger conditions per profile
number of trigger conditions per spectrum channel
number of trigger conditions per vector
vector 1-3 trigger block (table B.1.14)
vector 4-6 trigger block (table B.1.14)
st
trigger condition block for the 1 profile (table B.1.14)
…
trigger condition block for the last profile (table B.1.14)
trigger condition block for the first spectrum (table B.1.14)
trigger condition block for the last spectrum (table B.1.14)
alarm trigger (table B.1.28)
logger trigger (table B.1.28)
wave recording trigger (table B.1.28)
SMS alert trigger (table B.1.28)
E-mail alert trigger (table B.1.28)
event recording trigger (table B.1.28)
…
Table B.1.14. Trigger condition block
Word
number
Name / Value
Comment
0
0xnn32
1..2
Flags
3
Mode
4
Source
5
primaryLevel
6
secondaryLevel
…
…
[32, nn=block length]
b1 logger integration step
b2 100ms integration step
b3 1s integration step
b4 current time integration step
b9 trigger action: alarm
b12 - trigger action: logger
b15 - integration period step
b17 - trigger action: wave
b19 - trigger action: SMS
b21 - trigger action: E-MAIL
b23 - trigger action: event recorder
0 - OFF, 1 - LEVEL -, 2 - LEVEL +, 3 - SLOPE -, 4 - SLOPE +,
5 - GRADIENT -, 6 - GRADIENT +, 7 - DECAY
0 - VECTOR RMS, 1 - PEAK, 2 - P-P, 3 - MAX, 4 - MIN, 5 - RMS,
6 - VDV, 7 - PEAK, 8 - MAX, 9 - MIN, 10 - RMS
triggering level in dB*100
in the case of GRADIENT mode:
gradient level in dB*100
in the case of DECAY mode:
signal drop level in dB*100
…
B-10
SVAN 106 USER MANUAL – Appendix B
Table B.1.15. Event Recording Settings
Word
number
Name / Value
0
0xnn39
1
eventSampleRate
2
eventChannel
3
4
5
event16b
eventGain
triggerEventTime
6
triggerEventTimeLimit
…
…
Comment
[39, nn=block length]
sampling rate:
0 - 6kHz
recorded channels mask:
b0 - 1st channel
b1 - 2nd channel
...
b5 - 6th channel
1 - 16 bits per sample
0 - signal gain +0dB
time constant for triggerEventTimeLimit in seconds
0 - unlimited recording time
1 - fixed length
2 - maximum length
…
Table B.1.16. Octave analysis header
Word
number
Name / Value
0
1
0xnn09
0xkknn
2..5
OctaveHead[1]
…
2+4*used_
spectrum..
5+4*used_
spectrum
…
…
Comment
[09, nn=block_length]
[nn=spectrum_mask, kk=used_spectrum]
header of the first enabled octave analysis, defined
in Table B.1.16_VLM
…
OctaveHead[used_spe header of the last enabled octave analysis, defined
in Table B.1.16_VLM
ctrum]
…
…
Table B.1.16_VLM. Octave analysis header entry
Word
number
Name / Value
0
1
2
3
…
0xnn0A
SpectrumChannel
SpectrumFilter
SpectrumBuff
…
Comment
[0A, nn=sub-block length]
spectrum channel
1/1 or 1/3 OCTAVE analysis filter: 0 - HP
1/1 or 1/3 OCTAVE logging: 1 - ON, 0 - OFF
…
Table B.1.17. One-channel 1/1 OCTAVE analysis results
B-11
SVAN 106 USER MANUAL – Appendix B
Word
number
0
1
2
3
4… block_
length
…
Name / Value
0xnn0F
LowestFreq
Noct
NoctTot
Octave[i]
.
Comment
[0F, nn=block_length]
the lowest 1/1 OCTAVE frequency (*100 Hz)
number of 1/1 OCTAVE values
number of TOTAL values = 3
1/1 octave[i] value (*100 dB); i=1..NOct+NOctTot
…
…
Note: The TOTAL values, correspond to the HP, Profile 1 and Profile 2 filters –
respectively.
Table B.1.18. One-channel 1/3 OCTAVE analysis results
Word
number
0
1
2
3
4... block_
length
…
Name / Value
0xnn10
LowestFreq
Nter
NterTot
Tercje[I]
…
Comment
[10, nn=block_length]
the lowest 1/3 OCTAVE frequency (*100 Hz)
number of 1/3 OCTAVE values
number of TOTAL values = 3
1/3 octave[i] value (*100 dB); i=1..NTer+NTerTot
…
Note: The TOTAL values, correspond to the HP, Profile 1 and Profile 2 filters –
respectively.
Table B.1.19. TOTALS description
Word
number
0
1...
1+4*Ntotal
…
Name / Value
0xnn1A
OneChnlTotDesc[1]
…
OneChnlTotDesc[k]
…
…
Comment
[1A, nn=block_length = 1+(1 + Ntotal*4)*k (words)]
one-channel totals description block for the
with TOTALS in user filters (Table B.1.20.)
…
one-channel totals description block for the
with TOTALS in user filters (Table B.1.20.)
…
first
channel
last
channel
Note: This data block is created only in the case when the file was saved for 1/1 OCTAVE or
1/3 OCTAVE analysis and the TOTAL values were calculated for the filters selected by the user
(USER FILTERS). The TOTAL values corresponding to those filters are given in the TotValue positions
and the definitions of the proper filters are presented in the Table B.1.20.
B-12
SVAN 106 USER MANUAL – Appendix B
Table B.1.20. One-channel TOTALS description
Word
number
Name / Value
Comment
0
1
0xnn1B
SpectChannel
2
FilterNo[1]
3
FilterType[1]
4
calFactor[1]
5
TotValue[1]
…
…
nn-4
FilterNo[Ntotal]
nn-3
nn-2
FilterType[Ntotal]
calFactor[Ntotal]
nn-1
TotValue[Ntotal]
…
…
[1B, nn=block_length = 1 + Ntotal*4 (words)]
spectrum channel
logical filter no. for the first total value
0, 1, 2 - standard filters
3,… - user-defined filters
for sound:
0
for vibration:
0 - ACC., 1 - VEL., 2 - DIL.
calibration factor used to modify the computed TOTAL value
TOTAL value computed for the filter with logical no. FilterNo or
zero value for standard filter
…
logical filter no. for the last total value
0, 1, 2 - standard filters
3,… - user-defined filters
0 - ACC., 1 - VEL., 2 - DIL.
calibration factor used to modify the computed TOTAL value
TOTAL value computed for the filter with logical no. FilterNo or
zero value for standard filter
…
Table B.1.21. Description of user-defined filter
Word
number
Name / Value
Comment
0
1
2..4
0xnn1D
FilterNo
FilterName
5..49
FilterVal[i]
…
…
[1D, nn=block_length = 5 + NTer (words)]
FilterNo as saved in one-channel description (Table B.1.20)
filter name (up to 5 letters, zero-ending string)
filter value (*10 dB) corresponding to the 1/3 octave[i] position;
i=1..NTer (1..45)
…
Note: Such data block is created for each filter with the logical number FilterNo greater or
equal to 3, expressed in the TOTALS DESCRIPTION block (cf. Tab. B.1.19 and Tab B.1.20).
The description of the filter with the logical number FilterNo is given only once, disregarding the number
of FilterNo repetition in Tab. B.1.20.
Table B.1.22. Spectrum header of the file from the logger
Word
number
Name / Value
0
0xnn21
1
ChannelNo
Comment
[21, nn=block_length=1+4*NumberOfBufferedSpectrums ]
channel number of the first logged spectrum minus 1
B-13
SVAN 106 USER MANUAL – Appendix B
.
2
LowestFreq
3
NSpectRes
4
NTotal
the lowest 1/1 OCTAVE or 1/3 OCTAVE frequency (*100 Hz) of the
first logged spectrum
number of 1/1 OCTAVE or 1/3 OCTAVE results of the first logged
spectrum
number of TOTAL values of the first logged spectrum
…
…
…
block_
length-4
block_
length-3
block_
length-2
block_
length-1
…
ChannelNo
LowestFreq
NSpectRes
NTotal
…
channel number of the last logged spectrum minus 1
the lowest 1/1 OCTAVE or 1/3 OCTAVE frequency (*100 Hz)
of the last logged spectrum
number of 1/1 OCTAVE or 1/3 OCTAVE results of the last logged
spectrum
number of TOTAL values of the last logged spectrum
…
Table B.1.23. Maximum results of 1/3 OCTAVE analysis in one channel
Word
number
0
1
2
3
…
4 - length
block
…
Name / Value
0xnn2D
LowestFreq
Noct
NoctTot
…
MaxOctave[i]
…
Comment
[2D, nn=block length]
the lowest 1/1 OCTAVE frequency (*100 Hz)
number of 1/1 OCTAVE values
number of TOTAL values = 3
…
maximum result of the 1/1 octave analysis (*100 dB);
i = 1…NOct + NOctTot
…
Note: The TOTAL values, correspond to the HP, Profile 1 and Profile 2 filters –
respectively.
Table B.1.24. Minimum results of 1/1 OCTAVE analysis in one channel
Word
number
0
1
2
3
…
4 - length
block
…
B-14
Name / Value
0xnn2E
LowestFreq
Noct
NoctTot
…
MinOctave[i]
…
Comment
[2E, nn=block length]
the lowest 1/1 OCTAVE frequency (*100 Hz)
number of 1/1 OCTAVE values
number of TOTAL values = 3
…
minimum result of the 1/1 octave analysis (*100 dB);
i = 1…NOct + NOctTot
…
SVAN 106 USER MANUAL – Appendix B
Note: The TOTAL values, correspond to the HP, Profile 1 and Profile 2 filters –
respectively.
Table B.1.25. Maximum results of 1/3 OCTAVE analysis in one channel
Word
number
0
1
2
3
…
4 - length
block
…
Name / Value
0xnn2F
LowestFreq
Nter
NterTot
…
MaxTercje[I]
…
Comment
[2F, nn=block length]
the lowest 1/3 OCTAVE frequency (*100 Hz)
number of 1/3 OCTAVE values
number of TOTAL values = 3
…
maximum result of the 1/3 octave analysis (*100 dB);
i = 1…NTer + NterTot
…
Note: The TOTAL values, correspond to the HP, Profile 1 and Profile 2 filters –
respectively.
Table B.1.26. Minimum results of 1/3 OCTAVE analysis in one channel
Word
number
0
1
2
3
…
4 - length
block
…
Name / Value
0xnn30
LowestFreq
Nter
NterTot
…
MinTercje[I]
…
Comment
[30, nn=block length]
the lowest 1/3 OCTAVE frequency (*100 Hz)
number of 1/3 OCTAVE values
number of TOTAL values = 3
…
minimum result of the 1/3 octave analysis (*100 dB);
i = 1…NTer + NterTot
…
Note: The TOTAL values, correspond to the HP, Profile 1 and Profile 2 filters –
respectively.
Table B.1.27. Seat measurement
Word
number
Name / Value
0
1
2
…
0xnn2C
SEATBase
SEATSeat
…
Comment
[2C, nn=block length]
base channels: 0 - channels 1-3, 1 - channels 4-6
seating channels: 0 - channels 1-3, 1 - channels 4-6
…
B-15
SVAN 106 USER MANUAL – Appendix B
.
Table B.1.28. Trigger condition block
Word
number
Name / Value
Comment
0
0xnn4C
1..2
Flags
3
Mode
4
Source
5
primaryLevel
6
secondaryLevel
7
srcIndex
8
srcType
…
…
[4C, nn=block length]
b1 logger integration step
b2 100ms integration step
b3 1s integration step
b4 current time integration step
b9 trigger action: alarm
b12 - trigger action: logger
b15 - integration period step
b17 - trigger action: wave
b19 - trigger action: SMS
b21 - trigger action: E-MAIL
b23 - trigger action: event recorder
0 - OFF, 1 - LEVEL -, 2 - LEVEL +, 3 - SLOPE -, 4 - SLOPE +,
5 - GRADIENT -, 6 - GRADIENT +, 7 - DECAY
0 - VECTOR RMS, 1 - PEAK, 2 - P-P, 3 - MAX, 4 - MIN, 5 - RMS,
6 - VDV, 7 - PEAK, 8 - MAX, 9 - MIN, 10 - RMS
triggering level in dB*100
in the case of GRADIENT mode:
gradient level in dB*100
in the case of DECAY mode:
signal drop level in dB*100
in case of VECTOR Source:
0 - channels 1-3
1 - channels 4-6
other cases:
channel No + 1
Trigger source
0 - vector
1 - profile
2 - spectrum
…
Table B.1.29. TEDS data block
Word
number
Name / Value
0
1
2
3
...
...
0xnn4A
TEDSCnt
FORCECnt
TEDSBlock1
...
TEDSBlockN
k
valid[1]
…
k+Channel
sCount-1
k+Channel
sCount
…
B-16
valid[ChannelsCount]
validF[1]
Comment
[4A, nn=block length]
Number of TEDS data blocks
Number of force inputs
first TEDS data block (cf. Tab B.1.30)
last TEDS data block (cf. Tab B.1.30)
0 - channel 1 data is valid
1 - channel 1 data is invalid
…
0 - last channel data is valid
1 - last channel data is invalid
0 - force channel 1 data is valid
1 - force channel 1 data is invalid
SVAN 106 USER MANUAL – Appendix B
...
...
k+Channel
0 - last force channel data is valid
sCount+F
validF[FORCECnt]
ORCECnt1 - last force channel data is invalid
1
k+Channel
calibration factor read from TEDS for the first channel in dB*100
calFact[1]
sCount+F
ORCECnt
...
...
k+2*Chan
nelsCount calFact[ChannelsCount
calibration factor read from TEDS for the last channel in dB*100
]
+FORCEC
nt-1
k+2*Chan
nelsCount
reserved
+FORCEC
nt
...
...
k+2*Chan
nelsCount
reserved
+2*FORC
ECnt-1
B.2.
Structure of the block with meteorological data
In the case when the instrument is working in a monitoring station which contains also the components
for the meteorological measurements (temperature, pressure, humidity, wind speed and its direction),
the data coming from them are added by SvanPC+ software to all files with the data from SVAN 106.
The structure of such data block is presented in the Tab. B.2.1.
Table B.2.1. METEO data from monitoring station
Word number
Name / Value
0
1
2
0x0033
BlockLen
UnitNumber
3
4
5..6
7
8
9
10
11
12
13..14
15
Comment
[33, 00=block length in the next word]
block length
unit number
type of the unit: 211 or 210
UnitType
(SV 211 or SV 210)
SoftVersion
software version
IntTimeSec
integration time specified in seconds
Temperature
temperature [*10°C]
Pressure
pressure [hPa]
Humidity
humidity [*10%]
2
AvgWindSpeed Average wind speed [*10m/s ]
wind direction for max wind speed [degrees]. 0xFFFF if direction is
WindDirection
unavailable
max wind speed [*10 m/s ]
MaxWindSpeed
(ignored if WindDirection is unavailable)
WindDirTotalPuffs number of total wind puffs in distribution vector of wind direction
NofWindDir
number of elements in distribution vector of wind direction
B-17
SVAN 106 USER MANUAL – Appendix B
16..
16+NofWindDir-1
16+NofWindDir
17+NofWindDir..
17+NofWindDir+
NofWindMax-1
17+NofWindDir+
NofWindMax
18+NofWindDir+
NofWindMax...
18+NofWindDir+
NofWindMax+
NofWindAvg-1
18+NofWindDir+
NofWindMax+
NofWindAvg
…
WindDir[i]
NofWindMax
WindMax[i]
NofWindAvg
WindAvg[i]
RainDetection
.
WindDir[i] value [*10 %]
number of elements in distribution vector of max wind speed
WindMax[i] value [*10 m/s ]
number of elements in distribution vector of avg wind speed
WindAvg[i] value [*10 m/s ]
Rain detection flag
…
…
B.3.1. Structure of the file with the results from Level Meter Mode
File header - cf. Tab. B.1.1.
Unit and software specification - cf. Tab. B.1.2.
Parameters and global settings - cf. Tab. B.1.3.
Hardware settings for channels - cf. Tab. B.1.4.
Software settings for channels - cf. Tab. B.1.5.
Trigger settings (cf. Tab. B.1.13, Tab.B.1.14).
Vector measurement settings - cf. Tab. B.1.6.
Settings for vibration dose measurement (the presence depends on the MEASURE DOSE and channel
filter settings) - cf. Tab. B.1.7.
Main results - cf. Tab. B.1.8.
File end marker - cf. Tab. B.1.11.
B.3.2. Structure of the file containing LM results from logger’s file
File header - cf. Tab. B.1.1.
Unit and software specification - cf. Tab. B.1.2.
Parameters and global settings - cf. Tab. B.1.3.
Hardware settings for channels - cf. Tab. B.1.4.
Software settings for channels - cf. Tab. B.1.5.
Trigger settings (cf. Tab. B.1.13, Tab.B.1.14).
Vector measurement settings - cf. Tab. B.1.6.
Event Recording settings - cf. Tab. B.1.15.
Header of the file from the logger - cf. Tab.B.1.9.
Contents of the file from the logger - cf. Tab.B.1.10.
File end marker - cf. Tab. B.1.11.
B-18
SVAN 106 USER MANUAL – Appendix B
B.3.3. Structure of the file containing saved instrument’s setup
File header - cf. Tab. B.1.1.
Unit and software specification - cf. Tab. B.1.2.
Data block of instrument’s setup - cf. Tab.B.1.12.
File end marker - cf. Tab. B.1.11.
B.3.4. Structure of the file with 1/1 OCTAVE analysis results
File header - cf. Tab. B.1.1.
Unit and software specification - cf. Tab. B.1.2.
Parameters and global settings - cf. Tab. B.1.3.
Hardware settings for channels - cf. Tab. B.1.4.
Software settings for channels - cf. Tab. B.1.5.
Trigger settings (cf. Tab. B.1.13, Tab.B.1.14).
Vector measurement settings - cf. Tab. B.1.6.
Octave analysis header - cf. Tab.B.1.16.
The hand-arm and whole-body vibration dose measurement settings - cf. Tab. B.1.7.
Main results - cf. Tab. B.1.8.
One-channel 1/1 Octave analysis results (one for each channel with spectrum analysis enabled) cf. Tab. B.1.17.
TOTALS description (if needed) - cf. Tab. B.1.19.
Description of user-defined filter (if needed) - cf. Tab. B.1.21.
Maximum 1/1 Octave analysis results in one channel (one for each channel with spectrum analysis
enabled, presence depends on the MAX. SPECT. setting) - cf. Tab. B.1.23.
Minimum 1/1 Octave analysis results in one channel (one for each channel with spectrum analysis
enabled, presence depends on the MIN. SPECT. setting) - cf. Tab. B.1.24.
File end marker - cf. Tab. B.1.11.
B.3.5. Structure of the file with 1/3 OCTAVE analysis results
File header - cf. Tab. B.1.1.
Unit and software specification - cf. Tab. B.1.2.
Parameters and global settings - cf. Tab. B.1.3.
Hardware settings for channels - cf. Tab. B.1.4.
Software settings for channels - cf. Tab. B.1.5.
Trigger settings (cf. Tab. B.1.13, Tab.B.1.14).
Vector measurement settings - cf. Tab. B.1.6.
Octave analysis header - cf. Tab.B.1.16.
The hand-arm and whole-body vibration dose measurement settings - cf. Tab. B.1.7.
Main results - cf. Tab. B.1.8.
One-channel 1/3 OCTAVE analysis results (one for each channel with spectrum analysis enabled) cf. Tab. B.1.18.
Maximum 1/3 OCTAVE analysis results in one channel (one for each channel with spectrum analysis
enabled, presence depends on the MAX. SPECT. setting) - cf. Tab. B.1.25.
Minimum 1/3 OCTAVE analysis results in one channel (one for each channel with spectrum analysis
enabled, presence depends on the MIN. SPECT. setting) - cf. Tab. B.1.26.
TOTALS description (if needed) - cf. Tab. B.1.19.
Description of user-defined filter (if needed) - cf. Tab. B.1.21.
File end marker - cf. Tab. B.1.11.
B-19
SVAN 106 USER MANUAL – Appendix B
.
B.3.6. Structure of the file containing 1/1 or 1/3 OCTAVE analysis results from
logger’s file
File header - cf. Tab. B.1.1.
Unit and software specification - cf. Tab. B.1.2.
Parameters and global settings - cf. Tab. B.1.3.
Hardware settings for channels - cf. Tab. B.1.4.
Software settings for channels - cf. Tab. B.1.5.
Trigger settings (cf. Tab. B.1.13, Tab.B.1.14).
Vector measurement settings - cf. Tab. B.1.6.
Header of the file from the logger - cf. Tab.B.1.9.
Octave analysis header - cf. Tab.B.1.16.
Spectrum analysis header of the file from the logger - cf. Tab.B.1.22.
Contents of the file from the logger - cf. Tab.B.1.10.
File end marker - cf. Tab. B.1.11.
B.4.
Contents of the file in the logger
The records with the results and the records with the state of the markers as well as the records
with the breaks in the results registration are saved in the files in the logger.
B.4.1. Record with the results
The contents of the record with the results depends on the measurement function, selected channels
modes, values set in the Logger menu and its sub-lists. Profile results are written on 15 most significant
bits in dB*10, while least significant bit is used for overload indication flag. The following elements can be
present (in the given sequence):
-
st
<result1> <result2> <result3> <result4> <result5> -
PEAK result in the case of VLM if the first position was marked, else no value is written;
P–P result in the case of VLM if the second position was marked, else no value is written;
MAX result in the case of VLM if the third position was marked, else no value is written;
RMS result in the case of VLM if the fourth position was marked, else no value is written;
VDV result in the case of VLM if the fifth position was marked, else no value is written;
st
nd
results of the measurement from the 1 profile of the 2 channel if the LOGGER list was marked
and LOGGER MODE was set to ON (path: MENU / Measurement / Logging / Logger / Logger Setup /
Logger Mode: On) and if any position in Channel 2 Profile 1 (path: MENU / Measurement / Logging /
Logger / Logger Result / Channel 2 Profile 1) Log column was selected, up to five words are written
in the given sequence:
<result1> <result2> <result3> <result4> <result5> -
-
st
results of the measurement from the 1 profile of the 1 channel if the LOGGER list was marked
and LOGGER MODE was set to ON (path: MENU / Measurement / Logging / Logger / Logger Setup /
Logger Mode: On) and if any position in Channel 1 Profile 1 (path: MENU / Measurement / Logging /
Logger / Logger Result / Channel 1 Profile 1) Log column was selected, up to five words are written
in the given sequence:
PEAK result in the case of VLM if the first position was marked, else no value is written;
P–P result in the case of VLM if the second position was marked, else no value is written;
MAX result in the case of VLM if the third position was marked, else no value is written;
RMS result in the case of VLM if the fourth position was marked, else no value is written;
VDV result in the case of VLM if the fifth position was marked, else no value is written;
st
rd
results of the measurement from the 1 profile of the 3 channel if the LOGGER list was marked
and LOGGER MODE was set to ON (path: MENU / Measurement / Logging / Logger / Logger Setup /
Logger Mode: On) and if any position in Channel 3 Profile 1 (path: MENU / Measurement / Logging /
B-20
SVAN 106 USER MANUAL – Appendix B
Logger / Logger Result / Channel 3 Profile 1) Log column was selected, up to five words are written
in the given sequence:
<result1> <result2> <result3> <result4> <result5> -
st
st
PEAK result in the case of VLM if the first position was marked, else no value is written;
P–P result in the case of VLM if the second position was marked, else no value is written;
MAX result in the case of VLM if the third position was marked, else no value is written;
RMS result in the case of VLM if the fourth position was marked, else no value is written;
VDV result in the case of VLM if the fifth position was marked, else no value is written;
st
th
PEAK result in the case of VLM if the first position was marked, else no value is written;
P–P result in the case of VLM if the second position was marked, else no value is written;
MAX result in the case of VLM if the third position was marked, else no value is written;
RMS result in the case of VLM if the fourth position was marked, else no value is written;
VDV result in the case of VLM if the fifth position was marked, else no value is written;
nd
st
results of the measurement from the 2 profile of the 1 channel if the LOGGER list was marked
and LOGGER MODE was set to ON (path: MENU / Measurement / Logging / Logger / Logger Setup /
Logger Mode: On) and if any position in Channel 1 Profile 2 (path: MENU / Measurement / Logging /
Logger / Logger Result / Channel 1 Profile 2) Log column was selected, up to five words are written
in the given sequence:
<result1> <result2> <result3> <result4> <result5> -
-
th
results of the measurement from the 1 profile of the 6 channel if the LOGGER list was marked
and LOGGER MODE was set to ON (path: MENU / Measurement / Logging / Logger / Logger Setup /
Logger Mode: On) and if any position in Channel 6 Profile 1 (path: MENU / Measurement / Logging /
Logger / Logger Result / Channel 6 Profile 1) Log column was selected, up to five words are written
in the given sequence:
<result1> <result2> <result3> <result4> <result5> -
-
PEAK result in the case of VLM if the first position was marked, else no value is written;
P–P result in the case of VLM if the second position was marked, else no value is written;
MAX result in the case of VLM if the third position was marked, else no value is written;
RMS result in the case of VLM if the fourth position was marked, else no value is written;
VDV result in the case of VLM if the fifth position was marked, else no value is written;
results of the measurement from the 1 profile of the 5 channel if the LOGGER list was marked
and LOGGER MODE was set to ON (path: MENU / Measurement / Logging / Logger / Logger Setup /
Logger Mode: On) and if any position in Channel 5 Profile 1 (path: MENU / Measurement / Logging /
Logger / Logger Result / Channel 5 Profile 1) Log column was selected, up to five words are written
in the given sequence:
<result1> <result2> <result3> <result4> <result5> -
-
th
results of the measurement from the 1 profile of the 4 channel if the LOGGER list was marked
and LOGGER MODE was set to ON (path: MENU / Measurement / Logging / Logger / Logger Setup /
Logger Mode: On) and if any position in Channel 4 Profile 1 (path: MENU / Measurement / Logging /
Logger / Logger Result / Channel 4 Profile 1) Log column was selected, up to five words are written
in the given sequence:
<result1> <result2> <result3> <result4> <result5> -
-
PEAK result in the case of VLM if the first position was marked, else no value is written;
P–P result in the case of VLM if the second position was marked, else no value is written;
MAX result in the case of VLM if the third position was marked, else no value is written;
RMS result in the case of VLM if the fourth position was marked, else no value is written;
VDV result in the case of VLM if the fifth position was marked, else no value is written;
nd
nd
results of the measurement from the 2 profile of the 2 channel if the LOGGER list was marked
and LOGGER MODE was set to ON (path: MENU / Measurement / Logging / Logger / Logger Setup /
Logger Mode: On) and if any position in Channel 2 Profile 2 (path: MENU / Measurement / Logging /
B-21
SVAN 106 USER MANUAL – Appendix B
.
Logger / Logger Result / Channel 2 Profile 2) Log column was selected, up to five words are written
in the given sequence:
<result1> <result2> <result3> <result4> <result5> -
PEAK result in the case of VLM if the first position was marked, else no value is written;
P–P result in the case of VLM if the second position was marked, else no value is written;
MAX result in the case of VLM if the third position was marked, else no value is written;
RMS result in the case of VLM if the fourth position was marked, else no value is written;
VDV result in the case of VLM if the fifth position was marked, else no value is written;
nd
rd
results of the measurement from the 2 profile of the 3 channel if the LOGGER list was marked
and LOGGER MODE was set to ON (path: MENU / Measurement / Logging / Logger / Logger Setup /
Logger Mode: On) and if any position in Channel 3 Profile 2 (path: MENU / Measurement / Logging /
Logger / Logger Result / Channel 3 Profile 2) Log column was selected, up to five words are written
in the given sequence:
-
<result1> <result2> <result3> <result4> <result5> -
PEAK result in the case of VLM if the first position was marked, else no value is written;
P–P result in the case of VLM if the second position was marked, else no value is written;
MAX result in the case of VLM if the third position was marked, else no value is written;
RMS result in the case of VLM if the fourth position was marked, else no value is written;
VDV result in the case of VLM if the fifth position was marked, else no value is written;
nd
th
results of the measurement from the 2 profile of the 4 channel if the LOGGER list was marked
and LOGGER MODE was set to ON (path: MENU / Measurement / Logging / Logger / Logger Setup /
Logger Mode: On) and if any position in Channel 4 Profile 2 (path: MENU / Measurement / Logging /
Logger / Logger Result / Channel 4 Profile 2) Log column was selected, up to five words are written
in the given sequence:
-
<result1> <result2> <result3> <result4> <result5> -
PEAK result in the case of VLM if the first position was marked, else no value is written;
P–P result in the case of VLM if the second position was marked, else no value is written;
MAX result in the case of VLM if the third position was marked, else no value is written;
RMS result in the case of VLM if the fourth position was marked, else no value is written;
VDV result in the case of VLM if the fifth position was marked, else no value is written;
nd
th
results of the measurement from the 2 profile of the 5 channel if the LOGGER list was marked
and LOGGER MODE was set to ON (path: MENU / Measurement / Logging / Logger / Logger Setup /
Logger Mode: On) and if any position in Channel 5 Profile 2 (path: MENU / Measurement / Logging /
Logger / Logger Result / Channel 5 Profile 2) Log column was selected, up to five words are written
in the given sequence:
-
<result1> <result2> <result3> <result4> <result5> -
PEAK result in the case of VLM if the first position was marked, else no value is written;
P–P result in the case of VLM if the second position was marked, else no value is written;
MAX result in the case of VLM if the third position was marked, else no value is written;
RMS result in the case of VLM if the fourth position was marked, else no value is written;
VDV result in the case of VLM if the fifth position was marked, else no value is written;
nd
th
results of the measurement from the 2 profile of the 6 channel if the LOGGER list was marked
and LOGGER MODE was set to ON (path: MENU / Measurement / Logging / Logger / Logger Setup /
Logger Mode: On) and if any position in Channel 6 Profile 2 (path: MENU / Measurement / Logging /
Logger / Logger Result / Channel 6 Profile 2) Log column was selected, up to five words are written
in the given sequence:
-
<result1> <result2> <result3> <result4> <result5> -
B-22
PEAK result in the case of VLM if the first position was marked, else no value is written;
P–P result in the case of VLM if the second position was marked, else no value is written;
MAX result in the case of VLM if the third position was marked, else no value is written;
RMS result in the case of VLM if the fourth position was marked, else no value is written;
VDV result in the case of VLM if the fifth position was marked, else no value is written;
VECTOR 1-3 measurement result if the LOGGER list was marked and LOGGER MODE was set
to ON (path: MENU / Measurement / Logging / Logger / Logger Setup / Logger Mode: On) and if
position at VEC13 row Log column (path: MENU / Measurement / Logging / Logger / Logger
Result / Auxiliary Logger) is selected and VECTOR 1-3 measurement was enabled; one word is
SVAN 106 USER MANUAL – Appendix B
written;
-
VECTOR 4-6 measurement result if the LOGGER list was marked and LOGGER MODE was set
to ON (path: MENU / Measurement / Logging / Logger / Logger Setup / Logger Mode: On) and if
position at VEC46 row Log column (path: MENU / Measurement / Logging / Logger / Logger Result /
Auxiliary Logger) is selected and VECTOR 4-6 measurement was enabled; one word is written;
-
results of the measurement from the 1 force channel if the LOGGER list was marked and
LOGGER MODE was set to ON (path: MENU / Measurement / Logging / Logger / Logger Setup /
Logger Mode: On) and if any position in Force 1-3 Logger (path: MENU / Measurement / Logging /
Logger / Logger Result / Auxiliary / Force 1-3 Logger) Log column was selected, up to four words are
written in the given sequence:
st
<result1> <result2> <result3> <result4> -
nd
results of the measurement from the 2 force channel if the LOGGER list was marked and
LOGGER MODE was set to ON (path: MENU / Measurement / Logging / Logger / Logger Setup /
Logger Mode: On) and if any position in Force 4-6 Logger (path: MENU / Measurement / Logging /
Logger / Logger Result / Auxiliary / Force 4-6 Logger) Log column was selected, up to four words are
written in the given sequence:
<result1> <result2> <result3> <result4> -
-
PEAK result if the first position was marked, else no value is written;
MAX result if the second position was marked, else no value is written;
MIN result if the third position was marked, else no value is written;
AVER result if the fourth position was marked, else no value is written;
PEAK result if the first position was marked, else no value is written;
MAX result if the second position was marked, else no value is written;
MIN result if the third position was marked, else no value is written;
AVER result if the fourth position was marked, else no value is written;
st
results of 1/1 OCTAVE analysis from the 1 channel if 1/1 OCTAVE analysis was selected
as the measurement function and if the LOGGER list was marked and LOGGER MODE was set to
ON (path: MENU / Measurement / Logging / Logger / Logger Setup / Logger Mode: On) and if
Channel 1 position (path: MENU / Measurement / Logging / Logger / Logger Result / 1/1 Octave
Logger)
is
selected;
the
sequence
of
words
is
written:
<flags> <Octave[1]> <Octave[2]> ... <Octave[NOct+NOctTot]>
where:
flags = 1 - the overload detected, 0 - the overload not detected
Octave[i] - the result of 1/1 OCTAVE analysis (*100 dB); i = 1..NOct+NOctTot
-
nd
results of 1/1 OCTAVE analysis from the 2 channel if 1/1 OCTAVE analysis was selected
as the measurement function and if the LOGGER list was marked and LOGGER MODE was set to
ON (path: MENU / Measurement / Logging / Logger / Logger Setup / Logger Mode: On) and if
Channel 2 position (path: MENU / Measurement / Logging / Logger / Logger Result / 1/1 Octave
Logger)
is
selected;
the
sequence
of
words
is
written:
<flags> <Octave[1]> <Octave[2]> ... <Octave[NOct+NOctTot]>
where:
flags = 1 - the overload detected, 0 - the overload not detected
Octave[i] - the result of 1/1 OCTAVE analysis (*100 dB); i = 1..NOct+NOctTot
-
rd
results of 1/1 OCTAVE analysis from the 3 channel if 1/1 OCTAVE analysis was selected
as the measurement function and if the LOGGER list was marked and LOGGER MODE was set to
ON (path: MENU / Measurement / Logging / Logger / Logger Setup / Logger Mode: On) and if
Channel 3 position (path: MENU / Measurement / Logging / Logger / Logger Result / 1/1 Octave
Logger)
is
selected;
the
sequence
of
words
is
written:
<flags> <Octave[1]> <Octave[2]> ... <Octave[NOct+NOctTot]>
where:
flags = 1 - the overload detected, 0 - the overload not detected
Octave[i] - the result of 1/1 OCTAVE analysis (*100 dB); i = 1..NOct+NOctTot
B-23
SVAN 106 USER MANUAL – Appendix B
-
.
th
results of 1/1 OCTAVE analysis from the 4 channel if 1/1 OCTAVE analysis was selected
as the measurement function and if the LOGGER list was marked and LOGGER MODE was set to
ON (path: MENU / Measurement / Logging / Logger / Logger Setup / Logger Mode: On) and if
Channel 4 position (path: MENU / Measurement / Logging / Logger / Logger Result / 1/1 Octave
Logger)
is
selected;
the
sequence
of
words
is
written:
<flags> <Octave[1]> <Octave[2]> ... <Octave[NOct+NOctTot]>
where:
flags = 1 - the overload detected, 0 - the overload not detected
Octave[i] - the result of 1/1 OCTAVE analysis (*100 dB); i = 1..NOct+NOctTot
-
th
results of 1/1 OCTAVE analysis from the 5 channel if 1/1 OCTAVE analysis was selected
as the measurement function and if the LOGGER list was marked and LOGGER MODE was set to
ON (path: MENU / Measurement / Logging / Logger / Logger Setup / Logger Mode: On) and if
Channel 5 position (path: MENU / Measurement / Logging / Logger / Logger Result / 1/1 Octave
Logger)
is
selected;
the
sequence
of
words
is
written:
<flags> <Octave[1]> <Octave[2]> ... <Octave[NOct+NOctTot]>
where:
flags = 1 - the overload detected, 0 - the overload not detected
Octave[i] - the result of 1/1 OCTAVE analysis (*100 dB); i = 1..NOct+NOctTot
-
th
results of 1/1 OCTAVE analysis from the 6 channel if 1/1 OCTAVE analysis was selected
as the measurement function and if the LOGGER list was marked and LOGGER MODE was set to
ON (path: MENU / Measurement / Logging / Logger / Logger Setup / Logger Mode: On) and if
Channel 6 position (path: MENU / Measurement / Logging / Logger / Logger Result / 1/1 Octave
Logger)
is
selected;
the
sequence
of
words
is
written:
<flags> <Octave[1]> <Octave[2]> ... <Octave[NOct+NOctTot]>
where:
flags = 1 - the overload detected, 0 - the overload not detected
Octave[i] - the result of 1/1 OCTAVE analysis (*100 dB); i = 1..NOct+NOctTot
-
st
results of 1/3 OCTAVE analysis from the 1 channel if 1/3 OCTAVE analysis was selected
as the measurement function and if the LOGGER list was marked and LOGGER MODE was set to
ON (path: MENU / Measurement / Logging / Logger / Logger Setup / Logger Mode: On) and if
Channel 1 position (path: MENU / Measurement / Logging / Logger / Logger Result / 1/3 Octave
Logger)
is
selected;
the
sequence
of
words
is
written:
-
-
nd
results of 1/3 OCTAVE analysis from the 2 channel if 1/3 OCTAVE analysis was selected
as the measurement function and if the LOGGER list was marked and LOGGER MODE was set to
ON (path: MENU / Measurement / Logging / Logger / Logger Setup / Logger Mode: On) and if
Channel 2 position (path: MENU / Measurement / Logging / Logger / Logger Result / 1/3 Octave
Logger)
is
selected;
the
sequence
of
words
is
written:
-
-
<flags> <Terave[1]> < Terave [2]> ... < Terave [Nter+NterTot]>
where:
flags = 1 - the overload detected, 0 - the overload not detected
Terave[i] - the result of 1/3 OCTAVE analysis (*100 dB); i = 1..Nter+NterTot
<flags> <Terave[1]> < Terave [2]> ... < Terave [Nter+NterTot]>
where:
flags = 1 - the overload detected, 0 - the overload not detected
Terave[i] - the result of 1/3 OCTAVE analysis (*100 dB); i = 1..Nter+NterTot
rd
results of 1/3 OCTAVE analysis from the 3 channel if 1/3 OCTAVE analysis was selected
as the measurement function and if the LOGGER list was marked and LOGGER MODE was set to
ON (path: MENU / Measurement / Logging / Logger / Logger Setup / Logger Mode: On) and if
Channel 3 position (path: MENU / Measurement / Logging / Logger / Logger Result / 1/3 Octave
Logger) is selected; the sequence of words is written:
- <flags> <Terave[1]> < Terave [2]> ... < Terave [Nter+NterTot]>
where:
B-24
SVAN 106 USER MANUAL – Appendix B
flags = 1 - the overload detected, 0 - the overload not detected
Terave[i] - the result of 1/3 OCTAVE analysis (*100 dB); i = 1..Nter+NterTot
th
-
results of 1/3 OCTAVE analysis from the 4 channel if 1/3 OCTAVE analysis was selected
as the measurement function and if the LOGGER list was marked and LOGGER MODE was set to
ON (path: MENU / Measurement / Logging / Logger / Logger Setup / Logger Mode: On) and if
Channel 4 position (path: MENU / Measurement / Logging / Logger / Logger Result / 1/3 Octave
Logger) is selected; the sequence of words is written:
- <flags> <Terave[1]> < Terave [2]> ... < Terave [Nter+NterTot]>
where:
flags = 1 - the overload detected, 0 - the overload not detected
Terave[i] - the result of 1/3 OCTAVE analysis (*100 dB); i = 1..Nter+NterTot
-
results of 1/3 OCTAVE analysis from the 5 channel if 1/3 OCTAVE analysis was selected
as the measurement function and if the LOGGER list was marked and LOGGER MODE was set to
ON (path: MENU / Measurement / Logging / Logger / Logger Setup / Logger Mode: On) and if
Channel 5 position (path: MENU / Measurement / Logging / Logger / Logger Result / 1/3 Octave
Logger) is selected; the sequence of words is written:
- <flags> <Terave[1]> < Terave [2]> ... < Terave [Nter+NterTot]>
where:
flags = 1 - the overload detected, 0 - the overload not detected
Terave[i] - the result of 1/3 OCTAVE analysis (*100 dB); i = 1..Nter+NterTot
-
results of 1/3 OCTAVE analysis from the 6 channel if 1/3 OCTAVE analysis was selected
as the measurement function and if the LOGGER list was marked and LOGGER MODE was set to
ON (path: MENU / Measurement / Logging / Logger / Logger Setup / Logger Mode: On) and if
Channel 6 position (path: MENU / Measurement / Logging / Logger / Logger Result / 1/3 Octave
Logger) is selected; the sequence of words is written:
- <flags> <Terave[1]> < Terave [2]> ... < Terave [Nter+NterTot]>
where:
flags = 1 - the overload detected, 0 - the overload not detected
Terave[i] - the result of 1/3 OCTAVE analysis (*100 dB); i = 1..Nter+NterTot
th
th
B.4.2. Record with the state of the markers
The record with the state of the markers consists of one word:
<0x8nnn>
in which 12 bits nnn denote the state of the markers:
b11 = state of #12 marker
b10 = state of #11 marker
...
b1 = state of #2 marker
b0 = state of #1 marker
B.4.3. Record with the breaks in the results registration
The record with the breaks in the results registration consists of four words:
<0xB0ii> <0xB1jj> <0xB2kk> <0xB3nn>
in which ii, jj, kk, nn bytes denote 4-bytes counter of left or skipped records: nnkkjjii (ii is the least
significant byte, nn - the most significant byte).
B.4.4. Record with the breaks account PAUSE in the results registration
The record with the breaks in the results registration consists of four words:
<0xA0ii> <0xA1jj> <0xA2kk> <0xA3nn>
B-25
SVAN 106 USER MANUAL – Appendix B
.
in which ii, jj, kk, nn bytes denote 4-bytes counter duration of PAUSE in milliseconds:
nnkkjjii (ii is the least significant byte, nn - the most significant byte).
Pause duration means time passed between pressing <PAUSE> key and measurement continuation key.
Start delay after pressing continuation key isn't added to the counter.
B.4.5 Record with the auto-save file name
The record with the auto-save file name consists of six words:
<0xC0aa>
<0xccbb>
<0xeedd>
<0xggff>
<0xiihh>
<0xC8aa>
in which:
aa - size of record,
bb cc dd ee ff gg hh ii - 8-bytes name of auto-save file name
B.4.6 Record with Time-domain signal data
This record exists only in the case when the Time-domain signal recording is active. The samples
of the signal are saved in the blocks. Each block is divided into frames, which are stored in a file among
the logger results. The frame starting block and the frame ending it are marked with the b10 and b9 bits
set in the header of the frame, respectively. It happens in the case of stopping the recording that
the ending frame does not exist.
The format of the data frame is as follows:
HS
L
S
L
HE
where:
HS starting header (1 word)
L block length (1 word), expressed in words (4 + number of samples)
S samples of the measured signal (each sample is written in two bytes; the recording starts
with the least significant byte)
HE ending header (1 word), which differs from the HS only on b11 bit (thanks to it, it is possible
to analyse the recorded file starting from its end)
The HEADER format is as follows:
b15
b14
b13
b12
b11
b10
b9
b8
b7
b6
b5
b4
b3
b2
where:
b15 - 1
b14 - 0
b13 - 0
b12 - 1, bits b15 ÷ b12 = 9 constitute the marker of the frame
b11 - header type:
0 - HS
1 - HE
b10 - 1 denotes the first frame in the block
b9 - 1 denotes the last frame in the block
b7 - 1 denotes an error (the samples were overwritten in the cycle buffer, which means that
the recording in the analysed block is not correct)
b8, b6÷b0 - reserved
B-26
b1
b0
SV 106 USER MANUAL.
Appendix C. TECHNICAL SPECIFICATIONS
C1.
Specification of the SV106
System configuration
The meter measured simultaneous in six channels with independent set of filters and detector constants.
The SV106 instrument meets requirements of the ISO 8041:2005, and ISO 5349.
Thus SV106 I s a convenient instrument for tests according to the ISO 2631-1,2&5
The configuration of the complete instrument and its normal mode of operation for Whole-Body
measurements::
•
•
•
SV 106 vibration meter,
SV 38V seat accelerometer (see Chapter C4 for specification ),
SV 39A/L seat accelerometer (optional, see Chapter C4 for specification ),
The configuration of the complete instrument and its normal mode of operation for Hand-Arm
measurements::
• SV 106 vibration meter,
• SV105 triaxial accelerometer with set of adapters (see Chapter C4 for specification ),
• SV 50 triaxial accelerometer (SV3023M2) with set of adapters (optional, see Chapter C4 for
specification ),
Accessories included
SA 61
SC 56
SC 118
MicroSD card 4GB,
USB 1.1 cable,
Integrated connector LEMO 5-pin plug to LEMO 4-pin socket,
Accessories available
Power supply unit with USB Connector
SV 38V
Whole-Body seat accelerometer,
SV 105
Hand-Arm adapter with triaxial accelerometer,
SV 111
SA 47
Vibration calibrator for HVM 1 m/s2 @ 16 Hz, 10 m/s2 @ 80 Hz,
Carrying bag,
SA 54
SA 105
SA 146
SA 50
SA 51
SA 52
SC 14
SC 38
Power supply unit by USB interface using cables SC 56 (cables not included),
Calibration adapter for SV 105
Carrying case,
Hand-Arm measurement adapter, "shaped base" (for SV 3023M2 acceler.)
Hand-Arm measurement adapter, "flat base" (for SV 3023M2 acceler.)
Hand-Arm measurement adapter, "direct" (for the SV 3023M2 acceler.)
LEMO 5 pin to LEMO 5 pin extension cable (10 m)
Cable used to connect the triaxial accelerometer with the SV106 (4 pin
Microtech to LEMO 4 pin (typical 2.7 m))
Seat Accelerometer (including SV 3143M1 and SC 38 cable)
Hand-Arm accelerometer
SV 39A\L
SV 3023M2
Notice: System conforms to the ISO 8041:2005 and ISO 5349 standards.
Measured quantities
1
SV 106 USER MANUAL
.
The measured quantities in the vibration meter mode are RMS, VDV, CRF, OVL, PEAK, P–P, MTVV,
MAX, VECTOR, A(8), ELV, EAV. The definitions for mentioned parameters are given in Appendix D.
Mounting for vibration tests
The accelerometer should be connected with SV106 using proper cable provided by the manufacturer.
The accelerometer can be mounted on the plate in various ways:
• using threaded stud onto a flat, smooth surface,
• using proper adapter provided by manufacturer.
Notice: Maximum length of the extension cable between the accelerometer and the
instrument is 10m. Recommended length of the cable is 2.7 m.
Linear operating ranges for the acceleration
The linear operating ranges for the distance from noise > 10 dB
Values of the measured acceleration using the accelerometer with the nominal sensitivity equal to
50 mV / ms-2 (e.g. the SV38V seat accelerometer):
Table C.1. Linear operating ranges with SV38V accelerometer (RMS values for the sinusoidal signals)
type SV38V
Filter
nominal sensitivity 50mV/ms-2
(calibration factor = -14 dB)
from
to
2
HP
94.0 dB (50 mm/s )
Wf
Wc, Wk, Wh, Wb Wd, Wm, Wg
BL – Wf
Wj
BL- Wb, BL- Wc, BL- Wm,
BL- Wj, BL- Wd,
BL- Wg, BL- Wk
70.0 dB (3.16 mm/s2)
2
80.0 dB (10.0 mm/s )
85.0 dB (17.8 mm/s2)
151.0 dB
(35.5 m/s2)
153.8 dBpeak
(49 m/s2 peak)
90.0 dB (31.6 mm/s2)
Table C.2. Linear operating ranges with SV39A/L accelerometer (RMS values for the sinusoidal signals)
type SV39A/L
Filter
nominal sensitivity 10mV/ms-2
(calibration factor = 0 dB)
from
HP
Wc, Wk, Wh, Wb Wd, Wm, Wg
BL- Wb, BL- Wc, BL- Wm,
BL- Wj Wj, BL- Wd,
BL- Wg, BL- Wk
94.0 dB (50 mm/s2)
to
80.0 dB (10.0 mm/s2)
161.0 dB
(112 m/s2)
90.0 dB (31.6 mm/s2)
164.0 dBpeak
(159 m/s2 peak)
Values of the measured acceleration using the accelerometer with the nominal sensitivity equal to
28 mV / ms-2 (e.g. the SV105 accelerometer):
Table C.3. Linear operating ranges with SV105 accelerometer (RMS values for the sinusoidal signals)
2
SV 106 USER MANUAL.
type SV105
nominal sensitivity 10mV/ms-2
(calibration factor = 0 dB)
Filter
From
Wh
to
162.0 dB
(125 m/s2)
110 dB (320 mm/s2)
165.0 dBpeak
(177 m/s2 peak)
Values of the measured acceleration using the accelerometer with the nominal sensitivity equal to
1 mV / ms-2 (e.g. the 3023M2 accelerometer):
Table C.4. Linear operating ranges with 3023M2 accelerometer (RMS values for the sinusoidal signals)
type 3023M2
nominal sensitivity 1mV/ms-2
(calibration factor = +20.0 dB)
Filter
From
Wh
110 dB (320 mm/s2)
BL-Wh
120.0 dB (1 m/s2)
to
181.0 dB
(1122 m/s2)
184.0 dBpeak
(1587 m/s2 peak)
Frequency range for the acceleration measurement (+/- 10%) 0.02 Hz ÷ 2 kHz
Basic error for the acceleration measurement:
< ± 0.5 dB
Electrical substitute for accelerometer
In order to obtain an electrical input, an accelerator must be replaced by electrical impedance SV48/106.
Calibration
Direct:
Indirect:
by the measurement of the standard signal generated by the external vibration calibrator.
by the declaration of the transducer's sensitivity (according to the calibration chart).
Notice: Calibration procedure is given in Chapter 4 of the Manual.
Accelerometer input
Connector
2 x LEMO 5 -pins: six channels IEPE type or Direct and two
channels for force transducers
Impedance
Vibration transducers powering
130 kΩ / 20 pF (typical)
IEPE type: 28 V / 1.5 mA current source
Direct type: 5.15 V DC @ 20 mA power supply, 150 mA
short current limit
Range of the measured voltage
5 VPeak (indication 174 dBPeak for the calibration factor
0.0)
Maximum input voltage
3
SV 106 USER MANUAL
.
The SV106 is the instrument with the II security class according to the international standard IEC 348.
The input voltage should be within the 30 V Peak – Peak
RMS detector
•
•
•
•
•
Digital
Resolution
Range
Crest Factor
Time weighting filters:
“True RMS“ with Peak detection
0.1 dB
327.7 dB
unlimited for signals within 20 kHz band
100 ms, 125 ms, 200 ms, 500 ms, 1 s, 2 s, 5 s and 10 s
PEAK and P–P detectors:
Digital with 0.1 dB sampling step
Overload detector
The instrument has the built-in overload detectors. The overload in the measurement channel (in its
analogue part) and the overload of the analogue / digital converter are both detected. The “overload”
indication is when the input signal amplitude is 0.5 dB above the declared “Peak measurement range”.
Underrange detector
The instrument has the built-in underrange detector. The “underrange” indication appears when the
minimum value of the RMS detector output goes below the specified lower linear operating range.
Analogue/Digital conversion
6 x 16 bits resolution (IEPE or Direct channels)
Antialiasing filter
Built-in antialiasing filter. Second-order analogue filter, active type, combined with on-chip FIR digital filter
of the analog-to-digital converter, ensuring correct sampling of the measured signal.
Pass band(-1 dB)
2500 Hz,
Pass band(-3 dB)
2900 Hz,
Stop band
5600 Hz,
Attenuation in the stop band
> 70 dB.
Sampling frequency
6 kHz (internal only).
Reference conditions
• Reference frequency
15.915 Hz or 79.580 Hz ,
• Reference temperature
+23°C,
• Reference relative humidity
50 %,
Pre-heating time
1 minute (for 0.1 dB accuracy).
Typical stabilization time after change in environmental conditions is 1 minute.
Notice: When the instruments are moved from a warm environment with high humidity,
to a colder environment, care should be taken not to produce condensation inside
the instruments. In this case, much longer stabilization periods may be necessary.
4
SV 106 USER MANUAL.
Digital filters
High-pass filter
HP filter
(see part C.2 for the filter characteristics).
Frequency weighting filters
All filters include Band Limiting filters.
Band Limited filters are listed and available separately.
(See part C.2 for the filters characteristics).
• Wk, BL-Wk
from 0.1 Hz to 400 Hz
• Wd, BL-Wd
from 0.1 Hz to 400 Hz
• Wc, BL-Wc
from 0.1 Hz to 400 Hz
• Wj, BL-Wj
from 0.1 Hz to 400 Hz
• Wm, BL-Wm
from 0.1 Hz to 400 Hz
• Wb, BL-Wb
from 0.1 Hz to 400 Hz
• Wg, BL-Wg
from 0.8 Hz to 100 Hz
• Wh, BL-Wh
from 0.8 Hz to 2000 Hz
• Wf, BL-Wf
from 0.02 Hz to 2 Hz
Filters Noise Level
Typical noise level from the combination of the vibration transducer and the SV106 for the frequencyweighted response:
Table C.5 Typical noise level of the SV106 with accelerometers (for each axis)
Filter
type SV39A\L
type SV38V
type SV105
type 3023M2
nominal sensitivity
10mV/ms-2
nominal sensitivity
50mV/ms-2
nominal sensitivity
10mV/ms-2
nominal sensitivity
1mV/ms-2
65.0 dB
2.5 mm/s2
68.1 dB
BL-Wk
2
3.2 mm/s
70.0 dB
2
7.9 mm/s
77.9 dB
Wd
1.8 mm/s2
65.0 dB
2.7 mm/s2
68.6 dB
70.0 dB
2
78.2 dB
2
68.9 dB
Wk
BL-Wd
Wc
BL-Wc
Wj
BL-Wj
1.8 mm/s2
2
3.2 mm/s
2
2.0 mm/s
2
3.2 mm/s
2
3.0 mm/s
2
2.8 mm/s
2
70.0 dB
11.7 mm/s
81.4 dB
69.0 dB
2
72.8 dB
4.4 mm/s
2
70.4 dB
11.5 mm/s
81.2 dB
2
64.0 dB
2
1.3 mm/s
65.3 dB
BL-Wm 3.2 mm/s2
70.0 dB
7.9 mm/s2
77.9 dB
Wm
Wh
BL-Wh
Wg
BL-Wg
3.3 mm/s
66.0 dB
8.1 mm/s
1.6 mm/s
2
1.6 mm/s
2
7.4 mm/s
2
1.3 mm/s
2
3.1 mm/s
64.0 dB
77.4 dB
62.5 dB
69.6 dB
-
2
2
80.9 dB
2
42.2 mm/s
92.5 dB
69.1 dB
76.3 dB
-
-
2
-
-
2
2.9 mm/s
6.5 mm/s
63.5 dB
2.0 mm/s
66.1 dB
69.8 dB
7.6 mm/s2
77.6 dB
1.5 mm/s
2
63.2 dB
2.4 mm/s
2
67.8 dB
-
-
-
99.0 dB
3.1 mm/s2
-
-
-
89.1 mm/s
1.5 mm/s
BL-Wf
-
-
2
BL-Wb
-
-
-
25.1 mm/s
Wb
-
-
-
2
Wf
2
88 dB
-
11.1 mm/s
-
5
SV 106 USER MANUAL
.
Environmental, electrostatic and radio frequency criteria
Notice: In the measurement conditions with the strong electromagnetic disturbances
(e.g. near the high-voltage transmission lines) the lower measurement limit can be drastically shifted
as the result of the external field influence on the measurement cables. In such cases, the careful
shielding of the measurement cables is strongly recommended. It is worth to underline that the
estimation of the external influence can be performed in-site by the observations of the measurement
signal spectrum.
Effect of humidity
< 0.5 dB (for 30% < RH < 90% at 40°C and 1000 Hz)
Effect of radio frequency fields (meets requirements of the ISO 8041:2005)
The greatest susceptibility (the least immunity) is achieved when in the SV106 the HP filter is selected
and the RMS measurements are considered.
The greatest susceptibility is achieved when the SV106 and accelerometer with cable is placed along
field and the cable is coil as solenoid.
Effect of electrostatic discharge (meets requirements of the ISO 8041:2005)
During electrostatic discharge, the influence of the displayed results could be observed.
No changes in instrument operation state, configuration or stored data corruption were found out.
Operating range
from -10°C to + 50°C
Storage and Transportation
from -20°C to + 60°C
Effect of temperature
< 0.5 dB (from -10°C to + 50°C)
Effect of Vibration
< 0.1 dB (measured at the instrument vibration 1m/s2 in the
2 kHz band)
Effect of Acoustic Signal.
Typical effect measured noise level from the combination of the vibration transducer and the SV106 for
the “Human Vibration” frequency-weighted response Wb, Wd, Wk and Wh. Measured with accelerometer
exposed to the acoustic sinusoidal signal of 100 dB
The effect for the SV38V transducer is marginal and can be neglected!
The effect for the SV105 transducer is marginal and can be neglected!
Table C.6 Typical effect of acoustic signal perpendicular to the z axis of 3023M2 accelerometer
filter
Typical effect of acoustic
signal [mm/s-2]
filter
Typical effect of acoustic
signal [mm/s-2]
6
Wb
Wd
channel 1 channel 2 channel 3 channel 1 channel 2 channel 3
8,29
15,94
6,56
28,81
23,68
38,56
Wk
Wh
channel 1 channel 1 channel 1 channel 1 channel 2 channel 3
2,38
2,38
2,38
1,28
1,18
0,65
SV 106 USER MANUAL.
Effect of the acoustic signal on the SV 106 with 3023M2 accelerometer
3,00
2,50
[m m /s^2]
2,00
1,50
1,00
0,50
0,00
Channel 1
Channel 2
Channel 3
Channel 1
Wb
Channel 2
Channel 3
Channel 1
Channel 2
Wd
Channel 3
Channel 1
Wk
Channel 2
Channel 3
Wh
filter
Table C.7 Typical effect of acoustic signal perpendicular to the z axis of the SV39A/L ( 3143M1)
accelerometer
Filter
Typical effect of
acoustic signal [mm/s-2]
Wb
Wd
Wk
channel channel channel channel channel channel channel channel channel
1
2
3
1
2
3
1
2
3
0,80
2,10
2,19
1,17
2,11
2,51
0,95
1,41
1,71
7
SV 106 USER MANUAL
C2.
.
Frequency characteristics of the implemented digital filters
The HP filter is used for the acceleration measurements (the vibration signal) in the frequency
range from 0.2 Hz to 2 kHz.
Characteristics of the HP digital filter implemented in the VM
8
SV 106 USER MANUAL.
In the SV 106 instrument there are various filters conforming to ISO 8041:2005 standards (Wk, BLWk, Wd, BL-Wd, Wc, BL-Wc, Wj, BL-Wj, Wm, BL-Wm, Wh, BL-Wh, Wg, BL-Wg, Wb, BL-Wb, Wf, and
BL-Wf).
. The Wk filter is used for the assessment of the influence of the vibration signal on the human
body in the z direction and for vertical recumbent direction. It conforms to the ISO 2631-1-97 and
ISO 8041:2005 standard.
Characteristics of the BL-Wk and Wk digital filters implemented in the instrument
The Wd filter is used for the assessment of the influence of the vibration signal on the human body
in the x and y directions and for horizontal recumbent direction. It conforms to the ISO 2631-1-97 and
ISO 8041:2005 standards.
Characteristics of the BL-Wd and Wd digital filters implemented in the instrument
9
SV 106 USER MANUAL
.
The Wc filter is used for the assessment of the influence of the vibration signal on the human body
during the seat-back measurements. It conforms to the ISO 2631-1-97 and ISO 8041:2005 standards.
Characteristics of the BL-Wc and Wc digital filter implemented in the instrument
The Wj filter is used for the assessment of the influence of the vibration signal under the head of
the recumbent person. It conforms to the ISO 2631-1-97 and ISO 8041:2005 standards.
Characteristics of the BL-Wj and Wj digital filter implemented in the instrument
10
SV 106 USER MANUAL.
The Wm filter is used for the assessment of the influence of the vibration signal on the human
body. It conforms to the ISO 2631-1-97 and ISO 8041:2005 standards.
Characteristics of the BL-Wm and Wm digital filter implemented in the instrument
The Wh filter is used for the assessment of the influence of the vibration signal on the human body.
It conforms to the ISO 2631-1-97 and ISO 8041:2005 standards.
Characteristics of the BL-Wh and Wh digital filter implemented in the instrument
11
SV 106 USER MANUAL
.
The Wg filter is used for the assessment of the influence of the vibration signal on the human body.
It conforms to the BS 6841:1987 standard.
Characteristics of the BL-Wg and Wg digital filter implemented in the instrument
The Wb filter is used for the assessment of the influence of the vibration signal on the human body.
It conforms to the ISO 8041:2005 standard.
Characteristics of the BL-Wb and Wb digital filter implemented in the instrument
12
SV 106 USER MANUAL.
The Wf filter is used for the assessment of the influence of the vibration signal on the human body.
It conforms to the ISO 8041:2005 standard.
Characteristics of the BL-Wf and Wf digital filter implemented in the instrument
13
SV 106 USER MANUAL
.
C3. Miscellaneous specification of the SV106
Signal input
The input of the measured signal (taken form the vibration transducer):
2 x LEMO 5-pin: six channels IEPE type or Direct and two channels for force transducers.
LEMO 5-pin connector (external view)
Table C.8 Pin out of the LEMO 5-pin (ENG.0B.305.CYM ) connector
Pin number
1
2
3
4
5
Shield
ENG.0B.305.CYM
Input for channel 1 or 4
Input for channel 2 or 5
Input for channel 3 or 6
Input for force measurement, channels 1-3 or 4-6
+5.15V Supply Voltage
Signal Ground / Supply Ground, channels 1-3 or
4-6
Display
Colour OLED 2.4”, 320 x 240 pixels, super contrast 10000 : 1
Notice: The manufacturer of the color displays specify defective display. In case of
defective display the number of dark dots is more than 4.
Definition of dark dots: dots appear dark and unchanged in size in which module is displaying under pure
red, green, blue picture.
Memory
16 MB non-volatile flash memory and 256 kB of the RAM memory.
FLASH-disk for storing the measurement data files - 4GB MicroSD Card
Keyboard
Nine pushbuttons – see manual for detailed description
14
SV 106 USER MANUAL.
Power supply
Instrument is dedicated for the operation from the internal exchangeable batteries.
SV 106 should be powered from the 4 x AA Type rechargeable batteries or dry alkaline cells
Typical operating time from AA NIMH 2.5 Ah rechargeable batteries with one SV 38V accelerometer is
ca. 12 hours, connection second SV 38V reduce operational time about 5 %.
Notice: For the temperatures below 0°C operating time can decrees (depending on the
batteries) !
Notice: Using of the MicroSD card (memory card) for the continuous time domain recording
will increase power consumption.
In such a case battery operating time will be reduced to approx. 8 hours!
Instrument can be also powered from the external mini USB source with the DC Voltage from 4.5 V to
5 V.
Voltage ripple should not exceed ± 5%.
External Power requirement for 5 V:
- 150 mA DC without accelerometers,
- 155 mA DC with one SV38V accelerometer,
- 180 mA DC with one IEPE 3-channel accelerometer,
- 185 mA DC with one IEPE 3-channel accelerometer and one SV38V.
Interface USB
The SV 106 USB interface enables remote control of the instrument and data transfer with the speed up
to that attainable with 12 MHz clock.
The USB interface can work as external power source of the meter.
Mini USB socket (external view)
Table C.9 Pin-out of the USB-Device connector
Pin number
USB
1
Vbus
2
D-
3
D+
4
ID
5
GND
Shield
Ground
15
SV 106 USER MANUAL
.
I/O – User programmable Analogue Outputs, Digital Input / Output connector
3.5 mm Mini Stereo Jack type (cable plug and instrument socket are shown)
Table C. 10 Pin out of the 3.5 mm Mini Stereo Jack
Pin Number
1
2
Chassis (3)
Function
Analog Output
Digital Input / Output
Ground
*depending on instrument set-up
The user may set-up in window MENU / INSTRUMENT / EXTENDED I/O one of MODES, which are
available in the instrument: ANALOG, DIGITAL IN, DIGITAL OUT
1. ANALOG , in this mode analogue signal from the instrument is fed to it’s IO connector, with following
user-selectable options:
1.1 Analog – when this option is selected, the measured signal from the select channel is fed to the
terminal [1] of the I/O connector. Output voltage, frequency band and the output impedance are
following:
a) Output Voltage:
Tthe output voltage is equal to 1.0 VRMS (± 5 %) at 170 dB indication of the instrument, on
measurement range, when calibration factor is set to 0.0 dB.
b) Frequency Band (-3 dB):
0.02 Hz ÷ 4 kHz.
c) Output Impedance:
51 Ω / 5%
2. DIGITAL IN, when the EXT. TRIGGER function is activated, the external triggering of the instrument
may be provided. In order to do that the user has to select TRIGGER and to set SOURCE: EXT. IO
(path: MENU / MEASUREMENT / TRIGGER / MEASURE TRIGGER). The external signal for
triggering is specified as follows:
2.1. Trigger voltage threshold level is set to +1 V
2.2. Trigger voltage slope (path: MENU / MEASUREMENT / TRIGGER / MEASURE TRIGGER /
TRIGGER:) set by the user as SLOPE+ (uprising as default) or SLOPE– (falling, auxiliary)
2.3. Minimal duration of the trigger impulse: 10 μsec.
2.4. 100 μsec. release time after previous measurement is necessary before next trigger
2.5. Recommended trigger voltage should not exceed ± 5 V
2.6. Input impedance in this DIGITAL IN mode - ca. 10 kΩ / 100 pF, ESD type safety
2.7. When the instrument is switched-off in the DIGITAL IN mode, the voltage impulse on the pin [1]
will be able to switch-on the instrument, however in this case the minimal duration of the trigger
impulse of 100 msec is necessary, with uprising voltage slope
3. DIGITAL OUT - two different functions are available in this mode:
3.1. FUNCTION: TRIG. PULSE, when this function is selected, the terminal [1] is set as output, which
enables one to trigger another instrument (one instrument or more with trigger inputs connected
together in parallel), output trigger impulse meets specification given below:
16
SV 106 USER MANUAL.
a) trigger impulse is generated before every measurement
b) output voltage range from 0 V or 3 V
c) triggering slope: uprising
d) output impedance: 51 Ω
e) duration of the impulse: ca. 30 μsec.
3.2. FUNCTION: ALARM PULSE, when this function is selected, the terminal [1] is set as an output,
which changes its output level, when current result of measurement exceeds user-programmable
threshold level. In this case the terminal [1] output operates as an output of analogue comparator
with user-programmable threshold. This feature enables one to control an external device as
alarm-indicator or similar
a) electrical specification of this output are as follows: 0 V to 3 V voltage range, 51 Ω output
impedance
b) output produces a voltage level (not impulse)
c) ACTIVE LEVEL setting may be selected by the user in menu as LOW or HIGH. If HIGH is
selected, the output alternates from 0 V to 3 V till measurement result is greater than threshold
value
d) SOURCE setting selects source of measurement result to be compared with the threshold
value. One of three results sources may be selected RMS(1), VEC13 or VEC46
e) LEVEL enables one setting-up threshold value
Real Time Clock
Accuracy better then
1 minute/month.
Weight with the battery
390 g (without accelerometer).
Dimensions
140x83x33 mm (without accelerometer).
Electromagnetic Compatibility (EMC)
The product described above is compliant with the following EMC standards:
1. For the EMC emissions specification:
according to EN ISO8041: 2005 (Chapters 7.5, 12.20.7), applying test methods in accordance with
CISPR 22: 2003, Clause 10 and CISPR 16-1-1,
2. For the EMC immunity specification:
according to EN ISO8041: 2005 (Chapters 7.4, 7.6, 12.20.6, 12.20.8), applying test methods in
accordance with IEC 61000-4-2:2001, IEC 61000-4-3:2002 and IEC 61000-4-8.
Notice: EMC compatibility is guaranteed only with the original accessories supplied
by SVANTEK!
Safety
The product described above is compliant with following standards:
EN 61010-1:2001 and IEC 61010-1:2001
Compliance with EU Directives
CE mark indicates compliance with EMC Directive 89/336/EEC and Low Voltage Directive 2006/95/EC.
Environmental parameters
• Working temperature range
-10°C ÷ +50°C
• Storing temperature range
-20°C ÷ +50°C
• Humidity
up to 90% RH (non-condensed)
17
SV 106 USER MANUAL
.
C4. Transducers specification
Whole-Body “Seat” Accelerometer SV 38V specification:
Performance:
Number of axis
Sensitivity (± 5 %)
Measurement range
Frequency response (by design guideline, ± 3 dB)
Frequency response (factory tested, ± 3 dB)
Resonant frequency
Electrical noise
3
50 mV/(m/s2) at 15.915 Hz, HP1
0.01 ms-2 RMS ÷ 50 ms-2 PEAK
0.01 Hz ÷ 100 Hz
4 Hz ÷ 125 Hz
5 kHz (MEMS transducer)
< 25 μV RMS, Wd weighting
< 60 μV RMS, Wk weighting
< 230 μV RMS, HP1 weighting
Electrical:
Supply current
Supply voltage
Bias voltage
Output impedance
Charge / discharge time constant (start-up time)
TEDS memory
< 5,0 mA
5,2 V ÷ 16 V
2,5 V ± 0.05 V
51 Ohms
30 sec. typ.
installed (power supply pin)
Environmental Conditions:
Maximum vibration
Temperature coefficient
Temperature
Humidity
2
980 m/s shock survival
<+0.012 dB/°C
from -10°C to +50°C
up to 90 % RH, non-condensed
Physical:
Sensing element
Cable
Connector
Dimensions
3.6 mm to 12 mm
Weight
cushion)
Accessories:
SA 38 (option)
MEMS
integrated 1.4 meters long
LEMO 5-pin plug (SV 106 compatible)
236 mm diameter; thickness from
550 grams (including cable and rubber
Calibration adapter
Whole Body “Seat” Accelerometer SV 39A/L specification:
(SV 106 supports SV 39A/L only in IEPE mode of input channels; SC 118 Integrated connector is
required)
Physical:
Weight
16 Grams
Size, L X W X H
.82 x .82 x .34 Inches
Mounting provision, thru hole
4mm x 0.7
Connector, radially mounted
4-PIN
Material, housing & connector
TITANIUM
Performance:
Number of axis
Sensitivity, ± 5%
Range F.S. FOR ± 5 VOLTS OUTPUT
Frequency range, ± 5%
Resonant frequency, NOM.
Equivalent electrical noise floor
18
3
100.0 mV/g
± 500 g’s
0.5 to 3000 Hz
25 kHz
.0007 g’s RMS
SV 106 USER MANUAL.
Linearity
Transverse sensitivity, MAX.
Strain sensitivity
± 1% % F.S.
5%
.012 g’s/μσ @ 250 μσ
Environmental:
Maximum vibration/shock
Temperature range, OPERATING
Temperature range, survival
Seal,
Coefficient of thermal sensitivity
600/1500 ± g’s/g’s PEAK
-60 to +185 °F
-100 TO +225 °F
(welded, glass-to-metal connector) Hermetic
.03 %/oF
Electrical:
Supply current range
2 to 20 mA
Compliance voltage range
+18 to +30 Volts
Output impedance, typ.
100 Ohms
Bias voltage range
+11 to +13 VDC
Discharge time constant range
0.8 to 1.2 Sec
Output signal polarity for acceleration in direction of toward top Positive
Electrical isolation, case ground to mounting surface 10 Mohm, min.
Hand-Arm triaxial Accelerometer SV105 specification:
Performance:
Number of axis
Sensitivity (± 5 %)
Measurement range
Frequency response
Resonant frequency
Electrical noise
Electrical:
Supply current
Supply voltage
Bias voltage
Output impedance
Charge / discharge time constant
(start-up time)
TEDS memory
Environmental Conditions:
Maximum vibration
Temperature coefficient
Temperature
Humidity
Physical:
Sensing element
Cable
Connector
Dimensions
Weight
Accessories:
SA 105 (option)
3
10 mV/(m/s2) at 79..915 Hz,
0.01 ms-2 RMS ÷ 50 ms-2 PEAK
0.1 Hz ÷ 2000 Hz
5 kHz (MEMS transducer)
< 316 μV RMS, HP weighting
< 5 mA ÷ per channel
5.2 V ÷ 16 V
2.5 V +/- 0.2 V
51 Ohms
30 sec. typ.
installed (power supply pin)
100 000 m/s2 shock survival for MEMS sensor
<+0.012 dB/°C
from -10°C to +50°C
up to 90 % RH, non-condensed
MEMS
integrated 1.4 meters long
LEMO 5-pin plug
236 mm diameter; thickness from 3.6 mm to 12
mm
550 grams (including cable and rubber cushion)
Calibration adapter
19
SV 106 USER MANUAL
.
Hand-Arm triaxial Accelerometer 3023M2 (SV 50 included accelerometer) specification:
(SV 106 supports 3023M2 only in IEPE mode of input channels; SC 118 Integrated connector is
required)
Physical:
Weight 4 grams
Size
Mounting
Connector
Material
Performance:
Sensitivity,-10 +15%
Range
Frequency response
Element natural frequency
Equivalent electrical noise
Linearity
Transverse sensitivity
Signal polarity
(height x width x depth) 0.49 x .36 x .36 inch
10-32 TAPPED HOLE IN BASE
4-PIN
HOUSING/CONNECTOR TITANIUM ALLOY
1mV / ms-2
F.S. (each axis) +/- 500 g
-5 / +15%
Axis 1 & 2 1.5 to 5000 Hz
Axis 3 1.5 to 10000 Hz
NOM. 40 kHz
0.0095 g rms
1 %F.S.
MAX, 5 %
Positive for motion in direction of arrows on
housing
Environmental:
Maximum vibration
Maximum shock
Temperature range
Environmental seal
Coefficient of thermal sensitivity
+/- 600 gpk
5000 gpk
-60 to +320 °F
HERMETIC:
0.03 %/°F
Electrical:
Supply current range, (each axis)
Compliance (supply) voltage range
Output impedance, TYP
Output bias voltage, NOM.
Discharge time constant, NOM.
Ground isolation
2-to 20 mA
+18 to +30 VDC
100 OHMS
+10 VDC
0.3 SEC
Case grounded
20
SVAN 106 USER MANUAL – Appendix D
D. FORMULAE FOR RESULTS
D.1. BASIC RESULTS – RMS, VDV, CRF, OVL, PEAK, P-P, MTVV
NOTATION
T-
measurement time
TE -
exposure time (period during which a person is exposed to the action of vibration).
T0 -
period equal to 8 hours (28 800 seconds)
τ-
detector time constant (τ =1s)
a W (t ) - the temporary value of the measured vibration with the weighting filter W (e.g. Wd) on
the input of the RMS detector
p W (t ) - the temporary value of the measured vibration with the weighting filter W (e.g. Wd) on the
output of the RMS detector calculated from the equation:
1 t
t −t
p W (t ) =
a 2W (t x ) exp x
dt x
τ
τ
−∞
where:
∫
1
2
tx - time (variable of the integration)
For RMS, VDV, PEAK, PEAK-PEAK, MTVV results when saved in the logger T is equal to logger step
For RMS, VDV, PEAK, PEAK-PEAK, MTVV results when saved as the main results T is equal to
measurement period value
FORMULAE
RMS
The Root Mean Square result is calculated as follows:
1T
RMS = ∫ a 2W (t ) dt
T 0
1
2
VDV
The Vibration Dose Value result (expressed in m/s
T 4
VDV = ∫ a W (t ) dt
0
1
1.75
) as follows:
4
D-1
SVAN 106 USER MANUAL – Appendix D
CRF
The Crest Factor value is obtained from the proportion PEAK/RMS.
OVL
The Overload presents the percentage of the time the input signal was overloaded.
PEAK
The PEAK value is calculated for the given T as follows:
PEAK = max T a W (t )
P–P
The Peak to Peak result is calculated as follows:
P − P = max T (0, a W (t )) − min T (0, a W (t ))
MTVV
The Maximum Transient Vibration Value is defined (according to the ISO 8041 standard) as:
MTVV = max T (p W (t ))
D.2 HAND-ARM DOSIMETER RESULTS - MAX(RMS), EAV TT, EAV TL, ELV TT,
ELVTL, AEQ, Current Exposure, Daily Exposure
NOTATION
EAV -
Exposure Action Value – constant value defined by USER or defaultly set for U.K., Italy,
France, Germany, - according to local standards (in Poland MNDN8h value)
ELV -
Exposure Limit Value – constant value defined by USER or defaultly set for U.K., Italy,
France, Germany – according to local standards (in Poland MDND30 value)
MAX(RMS)
The MAX(RMS) result is the highest RMS value taken from three axis
{
MAX (RMS) = max RMS x , RMS y , RMS z
}
EAV Total Time
The EAV Total Time result is calculated as follows:
EAVTT
EAV
= T0
AEQ
2
D-2
SVAN 106 USER MANUAL – Appendix D
EAV Time Left
The EAV Time Left result is calculated as follows:
EAVTL = EAVTT − T
ELV Total Time
The ELV Total Time result is calculated as follows:
ELVTT
ELV
= T0
AEQ
2
ELV Time Left
The ELV Time Left result is calculated as follows:
ELVTL = ELVTT − T
MNDN Total Time (result only for polish standards)
The MNDN Total Time result is calculated as follows:
MNDN8h
MNDNTT = T0
AEQ
2
MNDN Time Left (result only for polish standards)
The MNDN Time Left result is calculated as follows:
MNDNTL = MNDNTT − T
AEQ (HAND-ARM VECTOR)
The AEQ result is calculated as follows:
AEQ = RMS 2x + RMS 2y + RMS 2z
Current Exposure
The Current Exposure result is calculated as follows:
CExp = AEQ
T
T0
Daily Exposure
The Daily Exposure result is calculated as follows:
A(8) = AEQ
TE
T0
D-3
SVAN 106 USER MANUAL – Appendix D
D.3 WHOLE-BODY DOSIMETER RESULTS – MAX(RMS), MAX(VDV), EAV TT,
EAV TL, ELV TT, ELV TL, Current Dose, Daily Dose, Current
Exposure, Daily Exposure, Vector
NOTATION
EAV -
ELV -
kx,y,z -
Exposure Action Value – constant value defined by USER or defaultly set for U.K., Italy,
France, Germany according to local standards (in Poland ONDN8h value)
EAVA -
Exposure Action Value expressed in
m
s2
EAVV -
Exposure Action Value expressed in
m
(this unit may be selected in USER option)
1
s .75
Exposure Limit Value – constant value defined by USER or defaultly set for U.K., Italy,
France, Germany according to local standards (in Poland ONDN30 value)
ELVA -
Exposure Limit Value expressed in
ELVV -
Exposure Limit Value expressed in
m
s2
m
s1.75
(this unit may be selected in USER option)
weighting factors for x, y, z axis
MAX(RMS)
The MAX(RMS) result is the highest weighted RMS value taken from three axis
MAX (RMS) = max 1.4RMS ,1.4RMS , RMS
x
y
z
MAX(VDV)
The MAX(VDV) result is the highest weighted VDV value taken from three axis
{
MAX ( VDV ) = max 1.4 VDVx ,1.4 VDVy , VDVz
}
EAV Total Time
The EAV Total Time result is calculated as follows:
EAVTTA = min EAVTTAx , EAVTTAy , EAVTTAz
EAVTTAx ,y,z
EAVAx ,y,z
= T0
RMS
x
,
y
,
z
2
EAVTTV = min EAVTTVx , EAVTTVy , EAVTTVz
EAVTTVx ,y,z
EAVVx ,y,z
= T
VDV
x
,
y
,
z
4
D-4
SVAN 106 USER MANUAL – Appendix D
EAVTT
m
EAVTTA if EAV limit is in s 2
=
EAV if EAV limit is in m
TTV
s 1.75
EAV Time Left
The EAV Time Left result is calculated as follows:
EAVTL = EAVTT − T
ELV Total Time
The EAV Total Time result is calculated as follows:
ELVTTA = min ELVTTAx , ELVTTAy , ELVTTAz
ELVTTAx ,y,z
ELVAx ,y,z
= T0
RMS
x ,y ,z
2
ELVTTV = min ELVTTVx , ELVTTVy , ELVTTVz
ELVTTVx ,y,z
ELVTT
ELVVx ,y,z
= T
VDV
x ,y ,z
4
m
ELVTTA if ELV limit is in s 2
=
ELV if ELV limit is in m
TTV
s1.75
ELV Time Left
The ELV Time Left result is calculated as follows:
ELVTL = ELVTT − T
ONDN Total Time (result only for polish standards)
The ONDN Total Time result is calculated as follows:
ONDN8h
ONDNTT = T0
Vector
2
ONDN Time Left (result only for polish standards)
The ONDN Time Left result is calculated as follows:
ONDNTL = ONDNTT − T
D-5
SVAN 106 USER MANUAL – Appendix D
Current Dose
The Current Dose result is calculated as follows:
CDose = VDV
Daily Dose
The Daily Dose result is calculated as follows:
DDose = VDV 4
TE
T
Current Exposure
The Current Exposure result is calculated as follows:
CExp = RMS
T
T0
Daily Exposure
The Daily Exposure result is calculated as follows:
A(8) = RMS
TE
T0
Vector
The Vector result is calculated as follows:
Vector = (k x RMSx ) 2 + (k yRMSy) 2 + k z RMS 2z
Defaultly Vector is calculated as follows:
Vector = (1.4RMSx ) 2 + (1.4RMSy) 2 + RMS 2z
D.4 CALCULATOR RESULTS – A(8), Dose(8)
NOTATION
NFiles –
number of result files
TE(i) –
exposure time for i-file in seconds
T(i) -
measurement time for i-file
Ax,y,z(8) -
results for x, y, z axis
Dosex,y,z(8) - results for x, y, z axis
kx,y,z -
weight factors for x, y, z axis
D-6
SVAN 106 USER MANUAL – Appendix D
Hand-Arm Daily
The Hand – Arm Daily result is calculated as follows:
A(8) =
NFiles
TE (i)
∑ 28800 VEC
HA
2
(i)
i =1
,
2
2
where VEC HA (i) = AEQ = RMS 2
x + RMS y + RMS z
Whole-Body Vibration Daily
The Whole-Body Vibration Daily results are calculated as follows:
A x ,y,z (8) =
NFiles
TE (i)
∑ 28800 k
i=1
2
x, y,z
RMS 2x ,y,z
{
}
A(8) = MAX A x (8), A y (8), A z (8)
Dose x ,y,z (8) = 4
NFiles
TE (i)
∑ T(i) k
i=1
{
4
x, y, z
VDVx4,y,z
}
Dose(8) = MAX Dose x (8), Dose y (8), Dose z (8)
D-7
SVAN 106 USER MANUAL – Appendix B
B.4.6 Record with the meteo data
Word number
Name / Value
0
1
2
3
4
0xC1nn
Temperature
Pressure
Humidity
AvgWindSpeed
5
6
7..8
9
10
…
Comment
nn= size of records
temperature [*10°C]
pressure [hPa]
humidity [*10%]
2
Average wind speed [*10m/s ]
wind direction for max wind speed [degrees]. 0xFFFF if direction is
WindDirection
unavailable
max wind speed [*10 m/s ]
MaxWindSpeed
(ignored if WindDirection is unavailable)
WindDirTotalPuffs number of total wind puffs in distribution vector of wind direction
RainDetection
Rain detection flag
0xC9nn
nn= size of records
…
…
B.5. Date and time
Following function written in C explains how the date and time are coded:
void ExtractDateTime(int date, int time, int dt[])
{
int sec,year;
sec =
dt[0]
dt[1]
dt[2]
((0xffff&time)<<1); /* time<<1; */
= sec%60; /* sec */
= (sec/60)%60; /* min */
= sec/3600; /* hour */
dt[3] = date&0x1F; /* day */
dt[4] = (date>>5)&0x0F; /* month */
year = (date>>9) & 0x07F;
dt[5] = year+2000; /* year */
}
B-27