1
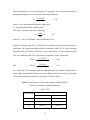
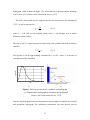
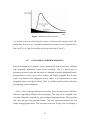
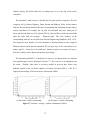
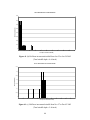
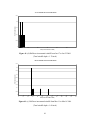
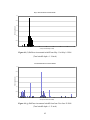
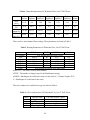
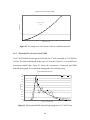
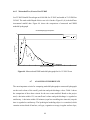
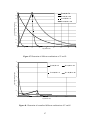
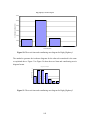
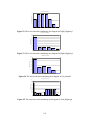
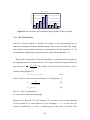
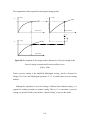
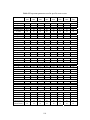
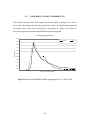
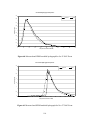
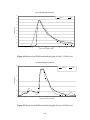
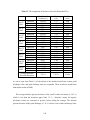
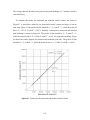
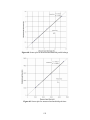
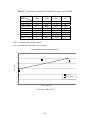
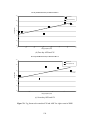
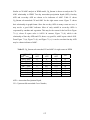
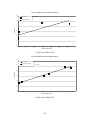
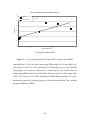
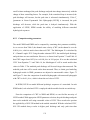
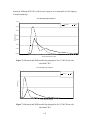
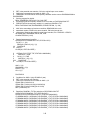
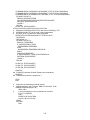
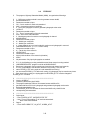
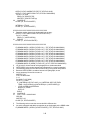
Similar to CN-AMC analysis in WMS model, Up_Stream is chosen to analyze the CNAMC relationship in HWM. Two-day antecedent precipitation depth (APD), four-day
APD and seven-day APD are chosen to be indicators of AMC. Table 15 shows
Up_Stream sub-watershed CN and AMC for the eight storm events. Figure 71 shows
their relationship in graph format. Since the two-day APDs in many events are zero, it
may not be a good AMC indicator. Most of early rainfall in seven-day APDs is
evaporated by sunshine and vegetation. This may be the reason for the bad fit in Figure
71 (c), whose R square value is 0.6829. In contrast, Figure 71 (b), which is the
relationship of four-day APDs and CN, shows very good fit, with R square value 0.9858.
From Figure 71 (a), Figure 71 (b), and Figure 71 (c), it can be seen that four-day APD
may be a better indicator of AMC.
Table 15. Up_Stream sub-watershed CN and AMC for eight events in HWM
APD & CN
Date
Oct 07 2005
Oct 25 2005
Nov 27 2005
Jan 17 2006
Mar 11 2006
May 11 2006
June 26 2006
Sept 01 2006
2-Day
APD
0
0.29
0
0
0.01
0
0.62
0
4-Day
APD
0
1.14
0.08
0.63
0.02
0
1.28
0.75
APD = Antecedent Precipitation Depth;
CN = Upstream Sub-watershed Curve Number;
127
7-Day
APD
0
1.18
0.08
0.91
0.03
0
1.7
2.27
CN
65
98
68
80
66
65
96
85