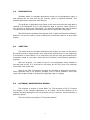
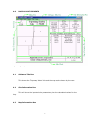
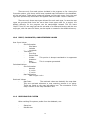
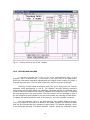
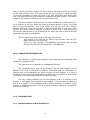
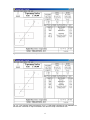
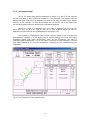
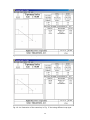
1
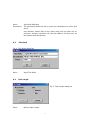
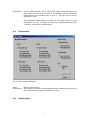
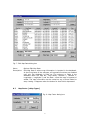
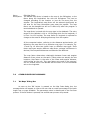
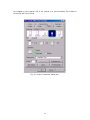
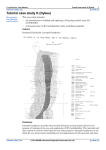
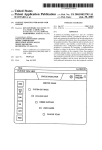
TopoMap Index
(User’s Manual)
Prepared by
Roberto A. Hizon, Jr.
Electronics and Communication Engineer
June 2002
INDEX OF CONTENTS
1.0
2.0
3.0
4.0
5.0
6.0
7.0
8.0
9.0
10.0
11.0
12.0
13.0
14.0
15.0
16.0
17.0
18.0
INTRODUCTION
OBJECTIVE
SOFTWARE/ARCHITECTURAL DESIGN
PAGE LAYOUT ELEMENTS
4.1
Software Title Box
4.2
Site Information Box
4.3
Map Information Box
4.4
Title Block
4.5
Map Orientation Box
MENU BAR
5.1
File
5.2
Scale
5.3
Input
5.4
Options
5.5
Edit
5.6
Help
DIALOG BOXES
6.1
Map Data [Site]
6.2
Map Data [Hop]
6.3
Title Block
6.4
Path Length
6.5
Site Location
6.6
Edit Map Data
6.7
Map Factor [<Map Type>]
OTHER SIGNIFICANT MESSAGES
7.1
‘No Maps’ Dialog Box
7.2
Percentage Bar
STORAGE OF DATA
SCALE AND MAP TYPE OPTIONS
INPUT, CALCULATED, AND RETRIEVED VALUES
RESIDING FILE SYSTEM
FILE NAME EXTENSION
SOFTWARE INSTALLATION
PLOTTING A SITE ON THE MAP
RETRIEVING PROCESS
COMPUTING METHODOLOGY
CASE ANALYSIS
17.1 Map Information Is Not Available (A)
17.2 Map Information Is Not Available (B)
17.3 An Irregular Map
17.4 A Strange Size of a Map
17.5 A Hop Analysis on a Different Map Type
17.6 Not a Hop But Only a Site
PRINTING
1
1.0
INTRODUCTION
TopoMap Index is a software application written to find topographic maps. A
hop analysis can be save just like an ordinary profile in Pathloss software. This
software application works well with Pathloss.
This program is applicable to all places in the world as long as the map data is
inputted in the databank first for that particular area or country. Some country is
very sensitive in giving map information. So, with this software they have a chance
to input the map information themselves and later on delete after the project.
The field that this software was inspired from is radio transmission profession.
However, this can be used by other professional to retrieved maps for a large-scale
project.
2.0
OBJECTIVE
The reason that this software application was written is to ease up the jobs of
RF engineers and to reduce human error when doing manual work. In the experience
of the author on how difficult it is to find maps, plot site on map, and visualize their
orientation based on hop path, these jobs are included in the software application
program.
With this program, it is easier to look for the topographic maps needed for
site and path survey. It is sure that on site there will still be a form of a hardcopy
map rather than a soft copy.
Most of the radio transmission projects are situated in developing countries,
where digitized map is not actually provided. And in actual fieldwork, hard copy
maps are brought instead of analyzing the digitized map on a laptop.
3.0
SOFTWARE/ARCHITECTURAL DESIGN
The software is written in Visual Basic 3.0. The limitation of VB 3.0 hinders
the creation of the software application to its fullest. Some few features of an
ordinary Windows application will not be shown on this. However, the functionality is
definitely natural.
The font used for the display is ‘Times New Roman’.
2
4.0
PAGE LAYOUT ELEMENTS
Fig. 1. Page Layout Elements
4.1
Software Title Box
This shows the ‘Topomap Index’ title and the map scale chosen by the user.
4.2
Site Information Box
This will show the inputted site parameters plus the calculated values for the
hop.
4.3
Map Information Box
3
Inside this box will list down all the necessary maps where a hop will pass
through. It will indicate a column for map name, map no., and PL (path length). Path
length can be cumulative measurement from site A or a measured distance for each
map.
4.4
Title Block
Title block just shows additional information on the page layout. This is
almost similar to the title block of Pathloss. The initials will always be converted to
uppercase characters.
4.5
Map Orientation Box
This will draw the orientation of the maps after they had been retrieved from
the databank. Each map will be labeled by a number, which is related and listed on
the map information box.
5.0
MENU BAR
5.1 File
New
Open
Save
Save As
Print
Exit
5.2 Scale
1:5,000
<Type A>
<Type B>
<Type C>
Manages the file. Extension name for a file is .tpo
Printing is preconfigured on A4 paper size using
HP Laserjet printer.
This menu chooses the map scale. Only the map
type in the databank will be shown. A check on
the left-hand side will appear on the submenu
chosen. ‘<>’ means user defined name in the
databank. When a new map type, whether within
or on another scale, is chosen it will not be
shown immediately on the page layout. The
layout should loss its focus first, say by opening a
dialog box, before it will be changed.
File name for databank is ‘Map005a.hzn’.
File name for databank is ‘Map005b.hzn’.
File name for databank is ‘Map005c.hzn’.
4
1:10,000
<Type
<Type
<Type
1:25,000
<Type
<Type
<Type
1:50,000
<Type
<Type
<Type
1:250,000
<Type
<Type
<Type
A>
B>
C>
File name for databank is ‘Map010a.hzn’.
File name for databank is ‘Map010b.hzn’.
File name for databank is ‘Map010c.hzn’.
A>
B>
C>
File name for databank is ‘Map025a.hzn’.
File name for databank is ‘Map025b.hzn’.
File name for databank is ‘Map025c.hzn’.
A>
B>
C>
File name for databank is ‘Map050a.hzn’.
File name for databank is ‘Map050b.hzn’.
File name for databank is ‘Map050c.hzn’.
A>
B>
C>
File name for databank is ‘Map250a.hzn’.
File name for databank is ‘Map250b.hzn’.
File name for databank is ‘Map250c.hzn’.
5.3 Input
Map Data
Site
Hop
Title Block
5.4 Options
Path Length
Site Location
Reverse Data
5.5 Edit
Map Data
Map Factor
This is where the site information is inputted.
This is where site coordinate and site name is
inputted. A check will appear on the left-hand
side if that submenu is chosen.
Entry dialog box for one site, site A.
Entry dialog box for two sites, sites A and B.
Additional information for the page layout. Two
rows are available for user input. Boxes for
initials, date, and file name are also available.
Customizable parameter settings.
This is for map measurement along the path of
the hop.
This feature is for map plotting.
Changes site A to site B and vice versa. Reverse
Data is analogous to Pathloss’s reverse profile.
This is particular for databank management.
An entry dialog box for angular and linear
distance relationship.
5.6 Help
Learning Topomap Index Not provided. This is disabled.
About Topomap Index
6.0
DIALOG BOXES
5
6.1
Map Data [Site]
Fig. 2. Map Data [Site] dialog
box
Menu:
Description:
Input-Map Data-Site
This is where the site coordinate is inputted. The site option only ask
the user to input one coordinate, which is for site A. This is a critical
entry dialog box because a wrong numerical entry will cause program
error. To avoid this, the ‘OK’ button will not enable unless the values
are inputted correctly. And even though all the entry text boxes have
correct input values, the last text box should lose its focus first before
the ‘OK’ button will enable. In case a wrong coordinate value is
inputted, it will be erased as soon as the text box lost its focus. This
rule is global for the program including the Map Data [Hop] dialog box.
In any of the input dialog box, when the value being asked to the user
is not correct, the OK button will not enable.
There are certain rules how to input a coordinate value. For the three
numerical segments, Deg-Min-Sec, a white space will separate these
values. Another space will separate the numerical values from the N-ES-W selection. In case the inputted coordinate is wrong and when the
input text box losses its focus, the value will be erased. N or S must be
placed at the end of the latitude value while W or E must be placed at
the end of the longitude value.
There are many disabled functions when only a site is chosen in the
Input-Map Data menu. The Site selection only means that only the
map for the site will be retrieved.
6.2
Map Data [Hop]
Fig. 3. Map Data
[Hop] dialog box
6
Menu:
Description:
Input-Map Data-Hop
The hop option allows the user to input two coordinates, for site A and
site B.
Hop selection means that all the maps along the hop path will be
retrieved. Ancillary calculation will also be made for the hop such as
the distance and the azimuth.
6.3
Title Block
Fig. 4. Title Block dialog box
Menu:
6.4
Input-Title Block
Path Length
Fig. 5. Path Length dialog box
Menu:
Options-Path Length
7
Description:
On the ‘Measurement’ frame, ‘Each Map’ means measurement of the
path length for each map on the list. ‘Cumulative’ means cumulative
measurement from distance zero at site A. The unit can be set to
kilometer or mile.
The calculated measurement is shown on the third column of map
information box. Fig. 11 shows an ‘Each Map’ measurement while Fig.
1 shows a ‘Cumulative’ measurement.
6.5
Site Location
Fig. 6. Site Location dialog box
Menu:
Description:
6.6
Options-Site Location
Site Location is where to set parameters when plotting the site into the
map. The unit can be set into kilometer or mile.
Edit Map Data
8
Fig. 7. Edit Map Data dialog box
Menu:
Description:
6.7
Options-Edit Map Data
Edit-Map Data is where map information is inputted in the databank.
At the first glance of the software, all important functions are disabled
until only the databank is filled up. The columns or fields in the
databank table are Map No., Map Name, Latitude 1, Latitude 2,
Longitude 1, Longitude 2, and the Date - when the map is inputted or
edited. The map information can be sorted on any of these fields for
easy viewing. It happens when the button for that field is depressed.
Map Factor [<Map Type>]
Fig. 8. Map Factor dialog box.
9
Menu:
Description:
Edit-Map Factor
The default map factor is based on the map in the Philippines, or the
factor along the longitudinal line with the Philippines. This can be
changed according to the location or how far the area from the
equator. The longitudinal map factor will be reduced significantly as
the area for the map information goes away the equator. The map
factor can be changed but will be in effect only after the program is
terminated and re-opened.
The map factor is stored with the map type in the databank. The entry
range for the latitude is 100 to 120 km/deg while for the longitude, it
is from 0 to 120 km/deg. The map factor for longitude is expected to
change as the area for analysis goes away from the equator.
All the computed values, referring to the distances and azimuths, will
defend on the map factor for a particular map type. For example, Fig.
17 and Fig. 18 show two similar hops on different map types. Since
these map types acquire different map factor, perhaps a difference in
decimal, the computed distances and azimuths are different.
The map factor determines relationship between linear and angular
distance of two points on the earth. These points are actually the site
locations. Map factor is the ratio of the linear and angular distance,
with km/deg as the unit. Two map factors are used in the program,
one for vertical axis or the latitude and the other is for the horizontal
axis or the longitude.
7.0
OTHER SIGNIFICANT MESSAGES
7.1
‘No Maps’ Dialog Box
As soon as the ‘OK’ button is pressed on the Map Data dialog box, the
message below will appear to inform the user that a certain percentage of the path
length has no maps available. The percentage value is determined in the first scan
process. If the OK button is pressed, the second scan process will proceed.
10
Fig. 9. ‘No Maps’ dialog box.
7.2
Percentage Bar
These days, this portion is called the ‘flooding’. It is unfortunate that ‘flooding’
is not a feature of VB 3.0. The percentage bar is used instead. Scanning process will
take a long time to finish, percentage bar will inform the user how much percentage
is done on the scanning process. Percentage bar will also appear when sorting map
data on the ‘Edit Map Data’ dialog box.
The percentage bar reminds the user that the computer, because of the span
of time to scan, did not hang.
Fig. 10. Percentage Bar
8.0
STORAGE OF DATA
The storage of information is basically a file system and not a database
system. A file is created whenever new information needs to be stored. These can be
the parameter setup of the application, or the map databank.
On parameter setup, when the program is closed and reopened, this will be
the last value that had been inputted.
9.0
SCALE AND MAP TYPE OPTIONS
11
There are only five scale options included in the program so far. Among the
five scale options, only those, which have inputted map information in the databank,
will be set active. These active scales will appear on the scale menu. Only the map
type with inputted map information will appear under the Scale-<scale> submenu.
There are only three map types allowed for each scale type. In case the map
types are grouped and there are more than three types used for a project, the
default directory for the program can be manipulated instead. The file name
‘Map????.hzn’ for one map type can be set aside on a different directory and the new
map type, with the same file name, can be copied or created in the default directory.
10.0
INPUT, CALCULATED, AND RETRIEVED VALUES
User Input Values:
Site Information
Site Name
Latitude
Longitude
Title Block
First Row
Second Row
Initials This portion is always translated to its uppercase
character.
Date This is computer generated.
File Name
Calculated Values:
Site Information
Azimuth
X,<unit>
Y,<unit>
Map Information
Path Length <unit>
Retrieved Values:
Map Data The retrieved values are basically the map data.
They are retrieved whenever a map scanning process is on going.
These are listed on the map information box. The orientation of the
map is shown on the map orientation box.
11.0
RESIDING FILE SYSTEM
Other residing file systems, aside from the databank, are:
-
Setup.hzn
Miscella.hzn
12
-
Titleblo.hzn
Direct.hzn
Mapfact.hzn
Mapfact1.hzn
Addmenu.hzn
These files will store current information for the program when it is
terminated.
12.0
FILE NAME EXTENSION
.tpo (dot tpo) .hzn (dot hzn) -
13.0
This is the file extension of the particular hop information, the
user file.
This is the file extension of all the files created to store
parameter settings and map databank.
SOFTWARE INSTALLATION
The
topo.exe
should
be
copied
to
a
default
directory
C:/Windows/Hizon/Topomap. All the file systems will be created on this directory. It
is important to create this directory before running the program to prevent an error.
It is recommended to copy three system files under the C:/Windows/System
directory. These are the ‘Grid.vbx’, ‘Threed.vbx’ and the ‘Vbrun300.dll’. These three
files are needed to run the program but do not exist in today’s computer.
14.0
PLOTTING A SITE ON THE MAP
This is made easier by the X and Y values appearing in the site information
box for both sites A and B. Distance from the map boundary will be calculated to
determine the X and the Y axes from it. The measurement can be set from any of
the left or right boundary for the X axis and top or bottom boundary for the Y axis.
This can be done on the ‘Site Location’ dialog box.
13
Fig. 11. Plotting a Site by the X and Y Values.
15.0
RETRIEVING PROCESS
A retrieving process for a hop is the most comprehensive part of this
program. And it is believe that it is the heart or the main part of this application.
When site information had been inputted and the program starts looking for maps, it
scanned the path twice. The first scan is fast scan and the second is thorough.
Scanning process starts at distance zero from site A and jumps into interval
distances value approaching to site B. The distance intervals actually represent
points along the hop path which also represent coordinate values. A coordinate value
is test if within the scanned map. When it happens to be within that map, it retrieves
the map and goes on the next interval. The next interval will be calculated so that it
will be outside that map boundary. And this would make the scanning process faster.
It repeats the scanning process until all the maps for the hops had been retrieved.
The first scanning, which is the fast scanning, has greater distance interval.
The main purpose of this scan is to detect all the maps, compute for maximum space
that can be occupied and set a temporary space factor. The second scanning, which
is the thorough scanning, has lesser distance interval. Using the temporary space
14
factor, it rescan the maps, compute for theirs sizes so that they would fit just enough
for the map orientation box. As the second scanning is in process, it draws the maps
in the map orientation box and lists them in the map information box at the same
time. The maps drawn are just connecting rectangles with label inside it. This label is
related to the map item number in the map information box.
There are instances that there are no maps available on a certain portion or
on its entirety of the hop. When the scanning process detects no map, it will take
time to finish the scanning. That is the reason why the first scan has a greater
distance interval to hasten the process in case there would be no map seen. After
the first scan and it sees no map for a portion or entire hop, it asks the user to
continue the second scan or not. A dialog box will inform the user on how much path
percentage the map is not available.
The two reasons why there may be no maps scanned are:
That portion of the hop has no official map provided. This can be a
water structure such as the sea.
There is no map inputted in the databank. Remember that the maps
that will be retrieved must reside first in the databank.
16.0
COMPUTING METHODOLOGY
The calculation is made purely based on a flat earth and not considering earth
curvature or magnetic north.
The main formula in calculation is Pythagorean theorem.
The calculated values such as the azimuth and the path distance will be
different from what is computed in Pathloss. Remember that the computation in
Pathloss took into consideration the earth curvature. On this program, it is purely a
flat earth or two-dimensional mathematical methodology. This method is much closer
in principle on the actual measurement on hardcopy maps.
Any hop crossing between the two hemispheres, that is a crossing on the
equator, is anticipated and corrected on the program. The hop crossing between E
and W at 0 degree is also anticipated and corrected. However, a limitation of the
program is evident when there is a hop crossing between E and W at 180 degrees.
This is not corrected.
17.0
CASE ANALYSIS
17.1
Map Information Is Not Available (A)
15
This scenario happens when a hop is passing an area without any available
maps. The figure shows that somewhere in the middle of the path, maps are not
provided. In reality, this area may be water structure such as sea. Please note of
item no.2 on the map list. Although there is no map, the distance is still calculated.
This feature will reduce human error when actual map profiling is on the job.
Fig. 12. An illustration when a map information is not available.
17.2
Map Information Is Not Available (B)
This is similar to part A. However, the map may have been unavailable in the
databank because it is not inputted. Figures 13 and 14 show before and after the
map is put in placed in the databank.
16
Fig. 13. An illustration when map information is not available.
Fig. 14. The missing map information in Fig. 13 has been inputted in the databank to
correct the contents of map orientation box and the map information box.
17
17.3
An Irregular Map
In Fig. 15, please note that the distances for items 3, 4, and 5 on the map list
are still provided. A label inside map number 4 is not provided. The program will not
display the label when the map appears too small in the map orientation box. Please
see Fig. 16 for example. In case all the labels are not shown, site A and site B can
still be easily determined by observing the calculated azimuth.
Items no. 4 and 6 is, actually, only one map. A hardcopy of this map will
show that item no. 4 is an inset of item no. 6. This program helps the user to
determine if that inset will be a passageway of the hop or not.
The creation of topographic map for each country seems to be in perfect tile
arrangement. However, it is not always true in certain areas of the world with many
dispersed islands and islets. Archipelago, such as the Philippines, will have a
scattered map arrangement. This is not really a problem for this program. It inputs
map data depending on its map boundaries, consisting of two latitudes and two
longitudes.
Fig. 15. An illustration of an irregular map.
18
17.4
A Strange Size of a Map
Since the databank is a user-input data storage, entering values are prone to
human error. During the retrieving process and what appears in the map orientation
box is a strange map size, the coordinate boundary of this map may have been
inputted wrongly. This can be corrected in the Edit Map Data dialog box. After the
map has been corrected it will be the same as Fig. 14.
Fig. 16. An illustration of wrongly inputted map data.
17.5
A Hop Analysis on a Different Map Type
Sometimes, military topographic maps are provided in different versions for
particular area. The user can still obtain the necessary maps for a hop with different
map types. The figures show two map types in the same scale.
It is also possible to obtain necessary maps in different scales, as long as they
are residing in the same area.
19
Fig. 17. An illustration hop analysis.
Fig. 18. An illustration of the same hop in Fig. 17 but using different map type.
20
17.6
Not a Hop But Only a Site
When the user intends to look only for the map of a particular site, he can do
this by choosing the ‘Site’ entry dialog box under the Input-Map Data menu. When
the user wants to obtain the site from a hop file, he can do this by loading the hop
file and choosing the ‘Map Data [Site]’ dialog box. Site A will be captured on the
dialog box. In any case the user wants to save site B, he can do this by reversing the
data and choosing the ‘Map Data [Site]’ dialog box.
Fig. 19. An illustration of site analysis.
18.0
PRINTING
The printing is set based on a HP Laserjet printer. The property setting of the
active printer should be set to landscape and A4 size paper. The program itself does
not have any print preview. The main page is the actual printing layout.
When printing on a different type of printer, the page layout elements will still
be printed but will be disoriented. When the print menu is chosen without any printer
connected to the network or to the computer, an error message will appear. This is
21
not trapped by the program and it will caused it to be terminated. The loaded or
current file will not be saved.
Fig. 20. Printer ‘Properties’ dialog box.
22