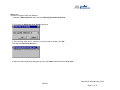
1
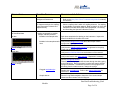
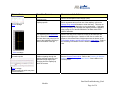
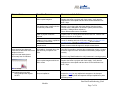
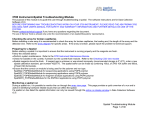
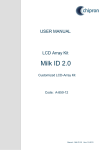
ABI PRISM 3700 Instrument -Hardware-Raw Data Troubleshooting Module This module is intended to troubleshoot raw data that are displaying anomalies in the electropherogram display in Data Collection Software V2.0 or the raw data profile in the analysis software. BEFORE PERFORMING ANY TROUBLESHOOTING WORK ON YOUR 3700 INSTRUMENT, PLEASE READ THE ABI PRISM® 3700 DNA ANALYZER USER'S MANUAL FOR SAFETY AND WARRANTY INFORMATION AND FURTHER DETAILS ON USE OF THE SYSTEM. Please contact technical support if you have any questions. Text in blue indicates a link to another portion of the document. Observations Possible Causes Recommended Actions Two Lines per peak The preferences to display the confidence bands were turned on Change the preferences to deselect the display confidence bands. Click to enlarge or view more examples Pull Up and/or Pull Down Peaks Incorrect spectral is selected Rerun the samples verifying that the correct spectral dye set for your chemistry is being used. Optics have been realigned or replaced Rerun the spectral calibration. A spectral will need to be run for the following changes: ♦Changes to the optics. ♦A different polymer type is being used. ♦New dyes are being used on the system. For example in sequencing moving from BigDye V1.1 to BigDye V3.1 or in fragment analysis changing DS-30 to DS-33. Different polymer type is being used. Switched to POP5 or POP6 Click to enlarge RawDataTroubleshooting_Final Module Page 1 of 36 Observations No Data/Weak data No data Possible Causes Recommended Actions Background fluorescence Refer to the Array View Colors Troubleshooting Module to identify fluorescence. For fragment analysis, the capillary that is borrowed is further than 5 capillaries away. Select a capillary that is within a 5 capillary distance. If a capillary is unavailable, run another spectral. Refer to page 4-41 of the ABI PRISM® 3700 DNA ANALYZER USER'S MANUAL, “Reviewing and Overriding the Spectral Calibration Profiles.” If results are sporadic or random: Sample Transfer problems Bubbles in the sample wells Bubbles in the sample transfer lines Spin down samples before placing on the instrument. Inspect the tubes for bubbles in the bottom of the well. Verify that the fittings on the ports above the sample transfer syringes are finger tight. Verify that the sample transfer syringes are tightened to the pump. Finger tight should be sufficient. Click to enlarge Weak data Verify that the fluid line sinkers are at the bottom of the reservoir. Verify water levels in the water reservoir. Replenish if necessary. Run the Change tips wizard. This will prime the syringes and flush water through the tubing going to the loading tips. During the wizard, monitor both sample transfer syringes for bubbles. If bubbles are present in the syringe but not the tubing from the water reservoir, change the syringe. Click to enlarge Clogged autoloader tips Replace the autoloader tips. Refer to the change tips wizard for instructions. Sample Issues Run the Long Read standard to determine if the issues sample related and then contact Technical Support. RawDataTroubleshooting_Final Module Page 2 of 36 Observations Possible Causes If results are capillary specific Capillaries are clogged Run a regenerate array to flush out of the capillary, refer to the Change Array wizard and select to clean the array. This may not always be successful. If the capillary continues to fail, one can block the capillary within the software, refer to page 4-12 of the ABI PRISM® 3700 DNA ANALYZER USER'S MANUAL, “manually overriding the capillary state.” Or replace the array Capillaries are broken Replace the array. Capillaries are not seated properly Verify that the array loading-end header is seated correctly, not under tension, and the capillary tips are positioned in their injection wells. Inaccurate spatial calibration Run another spatial calibration. If results are across the entire array Sample Transfer pumps may not be functioning Spikes or Bright Events Recommended Actions Refer to the Verifying Syringe Pumps Module for more details. Electrophoresis issues Refer to the Electrophoresis Module for more details. If results are have a pattern Refer to the Missing Lanes Module to for more details. A leak in the system allowing particulates to enter the system. Inspect polymer lines for any source of bubbles or particles, correct any leaks. Replace the inline filter Replace polymer with a fresh bottle Perform a regenerate array Bubbles in the cuvette or the array Run the Cuvette Flush module. Refer to the Checking for Bubbles Module and the Checking for Leaks Module if the bubbles in the cuvette persist. RawDataTroubleshooting_Final Module Page 3 of 36 Observations Click to enlarge Possible Causes Recommended Actions Electrical noise Use an Uninterruptible Power Supply (UPS). Capillary specific Run a regenerate array to flush out of the capillary, refer to the Change Array wizard and select to clean the array. This may not always be successful depending on the contaminant. If the spike does not go away, one can block the capillary within the software, refer to page 4-12 of the ABI PRISM® 3700 DNA ANALYZER USER'S MANUAL. Over tightening the thumbscrews on the detection end of the array. The laser beam may simply be too close to the capillaries resulting in direct illlumination of the tips Remove the array and re-install such that the thumbscrews are tightened until finger tight. Check the CCD View to confirm the presence of horizontal rows of bright spots near the bottom of the CCD display window, typically referred to as “picket fence.” Refer to the Checking CCD Module for more details on checking the CCD view. Bubbles migrating through the capillary degrade resolution and generate a bright signal upon emerging from the capillary tip within the cuvette. Run the Cuvette Flush module. Refer to the Checking for Bubbles Module and the Checking for Leaks Module if the bubbles in the cuvette persist. Click to enlarge Anomalous peaks Click to enlarge Data preceding the spike may have lowered resolution RawDataTroubleshooting_Final Module Page 4 of 36 Observations Possible Causes Recommended Actions Spikes underneath the baseline Spatial calibration may have shifted Run another spatial calibration and run Long Read Standard sample. Fluid other than polymer is mixing in the cuvette resulting in refractive index changes and deflection of the laser beam Avoid mixing polymer from different bottles. Run the change polymer wizard for a different lot if the lot numbers are different. Click to enlarge Jagged Peaks Install a new inline polymer filter and run the Cuvette Flush module to thoroughly flush cuvette Click to enlarge Symptoms are more evident for longer fragments Dark lines seen across array view Inspect sheath-flow syringe for signs of fluid mixing during filling Microbial contamination of water and/or buffer reservoirs Rinse the water and buffer reservoirs with either 1) hot water or 2) a 1:3 dilution of household bleach in water followed by a thorough rinsing with deionized water Click to enlarge Elevated/Separation of the Baseline Background Fluorescence Refer to the Array View Troubleshooting Module for more information. RawDataTroubleshooting_Final Module Page 5 of 36 Observations Possible Causes Contaminant present but electrophoreses out before data is collected Click to enlarge G or C dye breakdown Recommended Actions There may be a contaminant in the system which appears early in the run, before the samples. The software incorporates this contaminant as part of the background level. However, the contaminant then electrophoreses out of the system before the samples appear, therefore the amount of background changes. It may not affect the analyzed data depending on the fluorescent intensity of the contaminant. Refer to the Instrument Maintenance Module. Chemical breakdown of BigDye™ Terminator G-dye or C-dye Minimize exposure to air for samples re-suspended in HiDi Formamide by covering the samples with the recommended foil or a heat seal film and use the robot piercing. Formamide absorbs water in air undergoing hydrolysis to generate Formic Acid and Ammonia. One of these is partially responsible for the degradation of the extension fragments. Excessive sample has been electrokinetically injected into capillary The recommended injection solution is HiDi Formamide because it is less prone to evaporation, provides denaturing capabilities and yields the most consistent results. However, water can also be used for resuspension of samples but due to extremely efficient injection it generates the most signal but can also lead to excessive sample being injected. If water is used it may be necessary to increase the resuspension volume. Click to enlarge Peaks appear as doublets or have bulges or small adjacent extra peaks Run the Long Read Standard sample using HiDi Formamide to eliminate instrument issues. Click to enlarge Gradual loss of resolution Changes in the state of the capillary walls can lead to degradation of performance. Run a regenerate array to flush out the capillary every 80-100 runs, if maintained properly, the array should provide 300 runs. If the regenerate array procedure does not work, replace the capillary array. RawDataTroubleshooting_Final Module Page 6 of 36 Observations Some samples have data start points that are later than most of the samples of the run. Data in the late-starting lanes suffers early loss of resolution Possible Causes Recommended Actions Old or expired reagents Replace the buffer or polymer with fresh supply. Verify that the reagents have not expired and have been on the instrument less than 7 days. Poor quality water in buffer solution or incorrectly made buffer Remake 1X running buffer with fresh distilled, deionized water. Filtered water is adequate if the filtration system produces water purified to 18 Mega Ohms resistance. Use a different water source if available. Buffer or polymer levels are depleted. Prepare fresh 1X running buffer and fill the reservoir. Place a new bottle of polymer on the system. Bubbles in the cuvette or capillaries are blocking current flow Check for bubbles within the CCD view, refer to Checking the CCD window Module. Run the cuvetteflush.mod service module. Sample issues Please contact technical support for sample related issues. “Overloading” of sample due to the high efficiency of injection from water. Use HiDi Formamide or increase the resuspension volume. Contact technical support for more information on decreasing sample signal intensity. Run the Long Read Standard to verify instrument is running properly. Old or expired reagents which can affect current Replace the buffer or polymer with fresh supply. Verify that the reagents have not expired and have been on the instrument less than 7 days. Clumped capillaries Inspect the array for any capillaries that appear to be clumped together. Carefully clean and separate clumped capillaries in place with damp tissue. Click to enlarge Low read length on one side Failing samples with signal > 50 RFU RawDataTroubleshooting_Final Module Page 7 of 36 Observations Failing samples with signal <50 RFU Possible Causes Recommended Actions Sample issues Run the long read standard to verify the instrument is running properly, if so please contact technical support for sample related issues. Broken capillaries Inspect the capillary array for broken capillaries; replace defective arrays. Improperly installed array load header Confirm that the capillary array load header is properly seated and that all capillaries are in their proper wells. Non-optimal cuvette temperature Choose the cuvette temperature with the most uniform signal strengths across the array for all subsequent run. If problem persists, please contact technical support. Contacting Technical Support By phone: By email: 1-800-831-6844, option 5 [email protected] RawDataTroubleshooting_Final Module Page 8 of 36 Restarting the 3700 DNA Analyzer IMPORTANT To prevent firmware and software memory problems, we recommend that you restart the instrument and the software once a week. To shut down and restart the instrument: Step 1: The instrument should not be running or extracting data. Step 2: Close the 3700 Data Collection software by selecting Shutdown from the File menu. Note You cannot use the Close button to exit the software. Step 3: Close the OrbixWeb Daemon software by right-clicking on its button in the taskbar and selecting Close from the pop-up menu. If you get a run-time message, click OK to close the message. IMPORTANT Do not shut down the OrbixWeb™ Daemon until after you have shut down the Data Collection program. Step 4: a. Turn off the instrument using the On/Off button. b. Wait 30 seconds. c. Turn on the instrument. Step 5: When the green status light is steady, wait 1 minute. Step 6: Restart the 3700 Data Collection software. RawDataTroubleshooting_Final Module Page 9 of 36 How is the array view accessed in Data Collection V2.0? During a run Note Always exit the Array View when you are finished viewing. Do not leave the window open for extended periods during a run as this may cause unrecoverable screen update problems. 1) Select the Run Status tab > select Array View. Below is a normal view of a run. RawDataTroubleshooting_Final Module Page 10 of 36 After a run Accesses information within the database 1) Select the Data Acquisition menu and select Display Reduced Data for Run. 2) This opens the Select the run to display dialog box. 3) From the drop-down list box, select the run that you want to display. Click OK. This opens the Retrieving block box. 4) When the retrieving window disappears go the to run status tab and select the array view. RawDataTroubleshooting_Final Module Page 11 of 36 Electropherogram display RawDataTroubleshooting_Final Module Page 12 of 36 What is the electropherogram display? An electropherogram is a graph of relative dye concentration against time, plotted for each dye. The electropherogram display is plotted using Intensity vs. Time. The plot also appears in the capillary view tab but has been rotated 90 degrees, this shows capillary number vs. run time. This view provides a quick view of capillary specific issues. To access this view select the Run Status tab > select the Capillary View tab RawDataTroubleshooting_Final Module Page 13 of 36 Normal Data Below is how normal raw data should look and a general overview of what the plot displays. Example 1: Data from an empty well Notice the baselines for all colors are close together in the blank injection. Samples typically will not show such a baseline. ♦The Y axis represents the intensity. This scale will vary depending on sample and may be misleading if any offscale data exists, as the sample may appear weak so it is important to note the scale of “good” data. In this example the scale is 0 to 100. ♦The X axis represents the time in minutes. Note that the peak morphology may differ depending on the part of the run that is being viewed. Example 2: Long read standard results For high quality samples the baseline can range from 0-200. This sample is from a long read standard. RawDataTroubleshooting_Final Module Page 14 of 36 Dye sets Filter Set E H D D F G5 E5 Dye Set DS-01 DS-30 DS-31 DS-32 DS-33 DS-02 Dyes or kit BigDye™ Terminator V1.1 BigDye™ Terminator v3.1 6-FAM, HEX, NED and ROX 6-FAM, VIC, NED and ROX 5-FAM, JOE, NED and ROX 6-FAM, VIC, NED, PET and LIZ dR110, dR6G, dTAMRA, dROX and LIZ RawDataTroubleshooting_Final Module Page 15 of 36 Two Lines per peak Changing the preferences 1. In the Data Collection V2.0 Software select the Edit menu > select Preferences > select Run Status tab in the Setting Preferences window. 2. In the Data Acquisition Option, deselect the Display Confidence Bands The Display Confidence Bands allows for the evaluation of the quality of the spectral. The confidence bands provide a measure of the statistical confidence with which the electropherogram data is known. A small confidence interval indicates a good spectral calibration for that capillary. A large confidence interval indicates a potential problem with the spectral data. For more details on this please refer to the ABI PRISM® 3700 DNA ANALYZER USER'S MANUAL. RawDataTroubleshooting_Final Module Page 16 of 36 Examples of two lines per peak Example 1 Example 2 Example 3 Example 1 shows a good quality spectral. Example 2 shows the optimal spectral quality as the peaks appear to be a single peak. Note that this sample is the Long Read Standard run immediately after the spectral calibration and that the spectral file is not borrowed from another capillary. Example 3 shows a questionable spectral applied to a long read standard. Note the separation of the peaks and also the pull up and pull down of the dyes under the main peak. The spectral should be re-run. RawDataTroubleshooting_Final Module Page 17 of 36 Pull Up and/or Pull Down Peaks This exhibits both pull up and pull down in the baseline. Pull down in green can be seen under the yellow and blue peaks. Pull up in red can be seen under the yellow peaks ♦If there are consistent patterns in the colors that are pulled up or pulled down for example, green always below blue, this can be attributed to an improper spectral being applied to the sample. The function of the spectral is to subtract any overlap between the dyes. ♦If the pull up and pull down does not exhibit a consistent pattern then it may be sample related. RawDataTroubleshooting_Final Module Page 18 of 36 Weak Baseline or Flat Baseline Sequencing standards typically give peaks above 800. Examples: No sample injection The scale is only +/- 100 and the baseline remains near 0. Weak injection The scale is 0-200 but the peak heights are at 125 and below. RawDataTroubleshooting_Final Module Page 19 of 36 Spikes or Bright Events The presence of contaminants or bubbles in the system can cause a brief intense signal when hit by the laser beam. Spikes in the raw data can also be due to voltage spikes from either 1)other instruments on a non-dedicated line or 2) from a non-UPS surge-protected circuit. The spike can be in all four colors or a specific color depending on the cause and contaminant. The intensity of the spike is near 15,000. The sample is a long read standard which has an intensity of 800-1200 but due to the intensity of the spike the sample appears to be weak. It is important to note the scale of the intensity vs. time graph. Also, note that the spike generates a large negative peak, due to the intensity of the spike the spectral can not adequately compensate for the amount of signal observed. It is common for spikes to also exhibit negative peaks. RawDataTroubleshooting_Final Module Page 20 of 36 The array view sub page. A bright event occurring in one capillary can affect neighboring capillaries. The intensity of the spike will be much less than the capillary of origin. RawDataTroubleshooting_Final Module Page 21 of 36 Anomalous Peaks RawDataTroubleshooting_Final Module Page 22 of 36 Spikes underneath the baseline RawDataTroubleshooting_Final Module Page 23 of 36 Jagged Peaks/Striations Elevated/Separation of the Baseline RawDataTroubleshooting_Final Module Page 24 of 36 Picket Fence The picket fence is seen only on the right side and is minimal. No action will need to be performed The picket fence observed to the left appears across the entire array. If data is affected, it may be necessary to adjust the array at the detection end, tightening the thumbscrews until finger tight. If this does not resolve the issue, replace the array. RawDataTroubleshooting_Final Module Page 25 of 36 G or C Breakdown Formamide absorbs water in air undergoing hydrolysis to generate Formic Acid and Ammonia. One of these is responsible for the degradation of the dyes. To prevent the occurrence of dye breakdown it is recommended to run the samples immediately after resuspension or to store the samples seal the samples to prevent exposure to air. G breakdown with BigDye™ Terminator V1.0. Shouldering of C peaks due to dye breakdown in BigDye™ Terminator V3.1 RawDataTroubleshooting_Final Module Page 26 of 36 Double Peaks RawDataTroubleshooting_Final Module Page 27 of 36 Late Start RawDataTroubleshooting_Final Module Page 28 of 36 Sample Transfer syringe and pump The red arrows identify areas of possible leaks. From water reservoir to syringe From syringe to robot tip From water reservoir to syringe From syringe to robot tip Autoloader tips Tips should be tightened until finger tight. RawDataTroubleshooting_Final Module Page 29 of 36 Array Diagram Loading end of array Broken capillaries along the length of the array can be problematic if the array is not changed. Polymer will still flow through the capillary causing buildup of polymer in the area and affecting other capillaries. Detection end of array Check the area for any polymer leaks, if present remove the array and clean the area of polymer. Clean with a lint free tissue moistened with DI water. See below to check the o-ring. Thumbscrews: These should be tightened until finger tight RawDataTroubleshooting_Final Module Page 30 of 36 Load Bar Load bar Verify that the capillaries are sitting in the wells of the load bar and that they are covered with water or buffer. Inline Filter Dried polymer will appear in these areas. Inline filter RawDataTroubleshooting_Final Module Page 31 of 36 Reservoirs and Fluid Line Sinkers The Buffer and Water reservoirs should have enough fluids for the scheduled runs. It is recommended to check the reservoirs daily. Also, verify that the fluid line sinkers are at the bottom of the reservoirs and that the lines are submerged under the fluid. Fluid line sinkers Running the wizards Step 1: Select Instrument > Select Wizards > Select the appropriate wizard. RawDataTroubleshooting_Final Module Page 32 of 36 Running service modules within Data Collection V2.0 Step 1: Go to the Instrument menu > Select Utilities > Select Run Service Module > Step 2:Click the Select Module button RawDataTroubleshooting_Final Module Page 33 of 36 The service module utility should automatically search the Service Modules Folder, if not the folder can be found in the D://AppliedBio/Support Files/Data Collection Support Files/ Service Modules Double click on the module, in this example CuvetteFlush.mod. RawDataTroubleshooting_Final Module Page 34 of 36 After selecting run method, the steps of the service module will be listed. The module selected should be listed. Select Run Method. RawDataTroubleshooting_Final Module Page 35 of 36 When this window appears the module has completed, if there is an error during the module, please contact technical support. RawDataTroubleshooting_Final Module Page 36 of 36