1
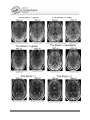
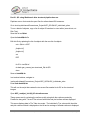
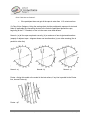
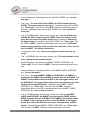
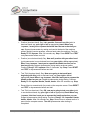
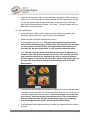
The first scene (sulc on left+right [subject
id] inflated (plus areal distortion, myelin) +
Conte69 inflated) is used to check the
quality of Areal Distortion and Myelin
Maps. The four tabs involved in this
scene are set in Tile Tabs view.
The top row shows the left and right
individual inflated surfaces with the Areal
Distortion maps displayed. The Areal
Distortion map is showing the differences
HCP_<subject_id>.164k_fs_LR.scene, Scene 1
in curvature between the individual and
the atlas. The hot colors (red-yellow)
represent areas where the individual’s surface is more expanded than the atlas while the cool
colors (blue-green) represent areas where the individual’s surface is more compressed than the
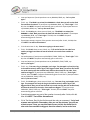
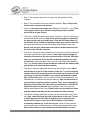
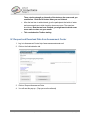
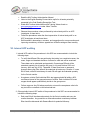
atlas. To see the range of colors, click the Settings Color Bar button in the Overlay Toolbox.
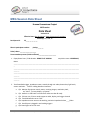
Look for any significant (extreme color, e.g. yellow or green) markings. It is rare to have any
notes regarding Areal Distortion but if so, these notes go in the Overall_QC_<release>
spreadsheet also. Put a checkmark in the Areal Distortion columns showing it has been
checked and add any notes to the Comments column with the label “A.D-lh: or –rh:”
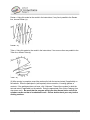
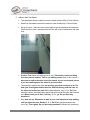
The bottom row shows the left and right Conte69 (atlas) inflated surfaces with the individual’s
Myelin Map displayed. Make sure the third (or fourth, depending on which hemisphere you are
working on) tab is the active tab so the Overlay Toolbox is accurate for this step. For the left
hemisphere, turn the second layer (individual myelin map) on and off to switch between the
individual and the atlas myelin maps (third layer), checking for accuracy.
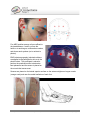
Use MT+, central sulcus, posterior insula and calcarine sulcus areas as the main regions to look
for any major shifts or abnormalities of myelination. In the Overall_QC_<release> spreadsheet,
place a checkmark in the Myelin Map columns and make note of any major discrepancies in the
Comments columns with the label of “M-lh: or –rh:”
(A red/orange hotspot in the mid/anterior-insula area is common and not worth noting.)
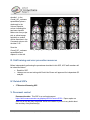
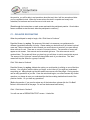
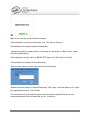
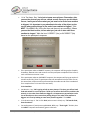
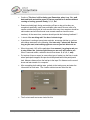
The second scene ([subject id] montage volume distortion (NonlinearRegJacobians)) is used to
review volume distortion. The montage of volume slices is showing the entire brain, anterior to
posterior, in Coronal view in tab 1 and dorsal to ventral in Axial view in tab 2. This shows the
atlas volume with the individual midthickness surface outline displayed in black. The coloration
seen is the NonRegJacobians. These color splotches are indicating differences between the
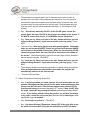
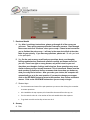
individual volume and the averaged atlas volume. In the Overlay Toolbox, uncheck the
Jacobians layer, layer 1, to do a quick check that the individual surface outline falls within the
boundaries of the atlas volume, making note if any areas are being pulled in a way they
500 Subjects + MEG2 Reference Manual – Appendix IV | WU-Minn Consortium of the NIH Human Connectome Project Page 24