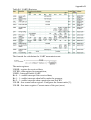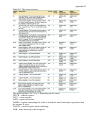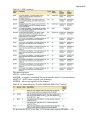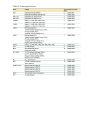
1
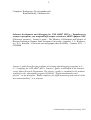
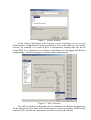
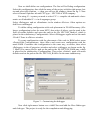
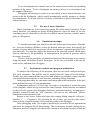
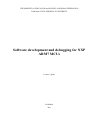
THE MINISTRY of EDUCATION and SCIENCE of RUSSIAN FEDERATION
SAMARA STATE AEROSPACE UNIVERSITY
Software development and debugging for NXP
ARM7 MCUs
Learner’s guide
SAMARA
2011
2
Compilers: Kudryavtsev Ilya Alexandrovich,
Kornilin Dmitry Vladimirovich
Software development and debugging for NXP ARM7 MCUs = Разработка и
отладка программ для микроконтроллеров семейства ARM7 фирмы NXP
[Electronic resource] : Learner’s guide / The Ministry of Education and Science of
Russian Federation, Samara State Aerospace University; compilers I. A. Kudryavtsev, D. V. Kornilin. - Electronic text and graphic data (0,44 Mb). - Samara, 2011. - 1
CD-ROM.
Learner’s guide describes the problems of creating and debugging programs in C /
C++ language for NXP ARM7 MCUs. Learner’s guide is developed in the Interuniversity Space Research Department. The learner’s guide is intended for the students,
studying on the educational program 010900.68 “Applied mathematics and
physics”, on the discipline “Radio complexes for flight monitoring and control of the
micro/nanosatellites” in A semester.
© Samara State Aerospace University, 2011
3
CONTENTS
INTRODUCTION……………………………………………………………….4
1 PROJECT CREATION.......................................................................................................4
2 COMPILATION AND DEBUGGING...................................................................................7
2.1 Project compilation......................................................................................................................................................7
2.2 Debug modes................................................................................................................................................................7
2.3 Viewing and modifying registers and memory variables.........................................................................................7
2.4 Using breakpoints.........................................................................................................................................................7
2.5 The use of macro functions.........................................................................................................................................8
2.6 Emulation interrupts...................................................................................................................................................8
2.7 Performance analysis and program optimization ...................................................................................................8
3 BIBLIOGRAPHY...............................................................................................................10
INTRODUCTION
This lab is devoted to the studying of the programming features for 32 - bit
ARM7TDMI microcontrollers in IAR EMBEDDED WORKBENCH IDE (Integrated
Development Environment), developed by IAR SYSTEMS. These MCUs are highperformance devices, having Von Neumann's architecture with a rich set of peripherals.
Microcontrollers have sufficient capacity (up to 512 KB) of FLASH-on-chip
memory, which encourage us to write programs in high level languages, and have
quick access module, which increases the performance when running the program
directly from the FLASH-memory.
Debugging programs with IAR Embedded Workbench in simulation mode, one
can use a macro language, expanding the debugger’s possibilities. This feature can
compensate the lack of direct support for peripheral devices.
Code size and performance are equally important, when creating software for
the real-time systems with high-level languages, like C or C++. To use IAR EMBEDDED WORKBENCH IDE in a full power developers have to know main compiler
settings to optimize the program code size or speed. It is possible also to carry out an
analysis of performance optimization with built-in tools, like Profiler (Profiling) and
the code analyzer (Code Coverage). Studying this issue has three objectives: the getting the experience of working with the IAR, using C/C++ programming and to
studying the characteristics of ARM7 microcontrollers.
This guide allows students to conceive the basics of C programming for ARM7
microcontrollers with the help of IAR Embedded Workbench. This guide either do
not include full description of ARM7TDMI core’s features or user’s manual for IAR
Embedded Workbench. Included are only brief comments, necessary for the understanding of code examples, the appendix contains some details of technical documentation for ARM7 microcontrollers.
1 Project creation
Software development will be performed, using environment IAR EMBEDDED WORKBENCH IDE, created by IAR SYSTEMS.
First of all you need to create a directory with a project, containing all necessary source files, auxiliary and output files. To create new project you can use menu
«Project/Create New Project». After that (fig. 1) the program offers some types of the
projects. Choose «Empty project» option, then in the following window you should
enter the path to your directory and project’s name. After this stage you can add or remove any sources at any time.
To save the time, we shall use prepared set of files, which you can find in the
directory, named «Samples» (Instructor will tell you exact path). We shall copy necessary files from this directory and put them into our project, when needed.
ATTENTION ! DO NOT REMOVE, ADD OR MODIFY ANY FILES IN
«Samples» DIRECTORY. YOU MAY PERFORM ALL MODIFICATIONS
ONLY IN YOUR OWN DIRECTORY.
To begin your work with the first project, copy from «Samples» subdirectory
Configurations and files Main.cpp, lcd.cpp.
Figure 1 – Project creation
In the window Workspace in the left part of your workspace you can see two
default project configurations: Debug and Release. We can also add our own configurations, for example, it is useful to have a configuration, loading code into the internal RAM. It is essential to use Debug configuration for debugging and Release
configuration – for the final project with necessary optimizations.
Figure 2 – MCU selection
We shall use Debug configuration for the simulation and Release configuration
for the placement of the code in the Flash memory of microcontroller. RAM configuration will be used for the experiments with the code, placed in RAM.
Now we shall define our configurations. The first will be Debug configuration.
Select this configuration, then click the name of the project with the right mouse button and select tab «Options…», then you will see the window, shown on fig. 2. Now
select «General Options» tab and CPU type – LPC2148 of NXP company.
For using С++ syntax you need to select С/С++ compiler tab and mark «Automatic» or «Embedded C++» in «Language» group.
Select «Debugger» and set «Simulator» in the window «Driver». Other options we
shall leave unchanged.
To define debug configuration with code placement in FLASH memory («Release» configuration) select the same MCU, then select «Linker», put the mark in the
field «Override default» and enter the path to the file LPC2148_flash.icf, which is
placed in the subdirectory Configurations. Select «Debugger» again and set the mark
J-Link/J-Trace in «Driver» window.
To create configuration with the placement of the code in RAM select menu
«Project\Edit Configurations», then «New» and create new configuration with the
name RAM. Customize this configuration in the same way, as earlier, then select
«Debugger» in the «Categories» window and select a debugger, as shown on the fig.
3. Mark «Use macro file(s)» and set the path to the file LPC2148_RAM.mac, which
is placed in the subdirectory Configurations. Then select «Linker», mark «Override
default» and set the path to the file LPC2148_RAM.icf in the same subdirectory.
Figure 3 – Customizing the debugger
Now click right mouse button over «Add Files» and add the files «Main.cpp»
and «lcd.cpp». The project is ready for the compilation and debugging.
2 Compilation and debugging
2.1
Project compilation
To translate and link the object file you can use PROJECT menu and activate
MAKE or COMPILE tab. After the completion of the process, the program opens
MESSAGES window, if errors or warnings are present.
2.2
Debug modes
Select Debug configuration, which is intended for the simulation purposes. To
start debugger select «Download and Debug» in PROJECT menu, then debugger will
start automatically, and a cursor will be placed on the «main» function.
Debugger allows executing the program step-by-step, using F10/F11 or a pictogram in the toolbox panel. Pressing F10 you make the debugger to execute one instruction in one step. If it is a subroutine call, it would be executed as one instruction.
Using F11 you can merge in the subroutine and execute it as a separate program. You
can also start the program in automatic mode with preliminary setting of breakpoints
(see details below).
In addition, you can execute the program with a delay (AUTOSTEP), in which
commands are executed with adjustable delay. Also, you can use mode with a stop at
the cursor position, performing before the release of the subroutine.
2.3
Viewing and modifying registers and memory variables
To modify the register you should open the window «Register» (Register tab
menu View). To modify the registry you can type the value directly in the box and
press ENTER.
It is useful to view and modify variables window «Watch». Using a right-click in
this box, you can add (ADD), remove (REMOVE) or change the display format of
the variable. In the «Quick watch» window you can also see the value of variables
whose values are not necessarily inspected all the time. If necessary, you can transfer
temporary variable in a permanent window WATCH. You should add symbol "#" to
the first character of the name of registers, for example, to display the content of the
IO0DIR, enter #IO0DIR.
To view and modify memory locations you can use MEMORY tab. This opens a
dialog box where you can view and modify the desired cell. For your convenience,
you can display a separate area of memory related to the RAM, FLASH, etc. With
this window you can also set the breakpoint on access to individual memory cells or
the entire range.
2.4
Using breakpoints
Used programming environment suggests the possibility of using three types of
breakpoints: in particular instruction code, to access a memory location and the point
of interruption instead of stopping the execution of the program (Immediate).
To edit a breakpoint, you can use the tab «Edit breakpoints», which opens a
special dialog box.
To set a breakpoint user manual can use the context menu in the corresponding
position of the cursor. To set a breakpoint on memory access it is convenient to use
the window «Memory».
Debugging the interrupt’s routine it is convenient to use a macro function, connected with the breakpoint, which would automatically modify memory or display
any information. To do this edit box «Action», which have to specify the name of the
macro functions.
2.5
The use of macro functions
Macro functions are to be created in separate files with «mac» extension. To use
macro function, you should use menu «Debug/Macros», enter the name of the file,
containing macros, then add it to the list of available macro functions («Add») and register it («Register»).
2.6
Emulation interrupts
To emulate interrupts you should use the tab «Interrupts» from menu «Simulator». Activate checkbox «Enable», select the desired interrupt vector, then specify the
number of cycles until first occurrence («First Activation»), repetition period of «Repeat interval». You can also define the duration of the interrupt request «Hold time»
(specify «Infinite»), the probability of interruption in the period in percents and its
deviation, if needed.
There is also the possibility of manual activation of the interrupt at any time by
using the menu «Simulator/Forced Interrupts». In the list you should select the desired vector, and then click «Trigger».
2.7
Performance analysis and program optimization
To analyze the efficiency of the program, there are two tools: analyzer and profiler code execution. The profiler can be started from the menu «View/Profiling».
Profiler provides numerical data (in cycles) and relative (in percents) of pure run-time
of selected functions and the overall run-time, including library functions.
Analyzing these data, we can make conclusions about the bottlenecks in the program and find the ways of code optimization.
Performance analyzer («View/Code Coverage») is intended to search the parts
of the program, which are not executed for some reasons. Such functions are marked
by the red color, green color designates functions, performed entirely, red and green partially executed. Inside the "red" functions, you can see the individual "yellow"
transitions to non-executed code.
Return to the Source Editor and open the settings dialog compiler («Project /
Options / C + + Compiler»). By selecting the tab «Code», you can do some experiment with the compiler settings, observing the results in the debugger.
After debugging code, you ought to perform the procedure of the optimization
and check the program for its functionality. This is necessary because during the optimization process, compiler can discard the execution of certain functions which ap-
pears to be unnecessary (from compiler’s point of view), for example, repeated
switching the direction of the port from input to output.
Make some experiments with the profiler and analyzer, changing the way of
code optimization and the frequency of the generated interrupts.
3 Bibliography
1.
2.
3.
Trevor Martin The insider’s guide to the Philips ARM7 – BASED MICROCONTROLLERS. An engineer’s introduction to the LPC 2000 Series.
UM10139 Volume 1: LPC214X User Manual Rev.01 – 15 August 2005.
ARM7 TDMI Rev.3 Technical Reference Manual
Appendix A
Table A.1 IO ports control registers
Name
IOXPIN
description
Designed to read the state of pin
access
R/W
State after reset
-
IOXSET
Recording 1 set high logic level at pin
R/W
0x00000000
IOXCLR
Recording 1 set low logic level at pin
R/W
0x00000000
IOXDIR
The direction of transmission. Recording 1 configures the output mode to output
R/W
0x00000000
Appendix B
Table B.1 UART0 Registers
The formula for calculating the UART transmission rate
The main registers:
U0RSR - register the received data;
U0THR - data register for transmission;
U0IER - Interrupt Enable UART:
Bit 0 - 1 - enable interrupt if the received data;
Bit 1 - 1 - enable interrupt when buffer under the program;
Bit 2 - 1 - enable interrupt when a particular state line RX
U0LSR - line control status register: Configures the format make [3];
U0LSR - line status register: Current status of the port (error)
Appendix C
Figure C.1 - Formats the transfer module in SPI
Table C.1 SPI module registers
The most important registers are:
S0SPCR - control register, the format detailed in [3];
S0SPSR - status register reflects the current state (error);
S0SPDR - register containing the transmitted and received data;
S0SPCCR-register control the frequency transmit mode MASTER.
Appendix D
Table D.1 The timer registers
The main registers: (X - 0 or 1, depending on the timer)
ThTCR - control register;
TxTC - count register;
TxPR - register prescaler;
TxMR0 - register containing the value at which the match interrupt is generated and
the counter is reset;
TxMCR - control register mode matching;
TxIR - timer interrupt control register.
Appendix E
Table E.1 ADC registers
The main registers:
ADCR - control register;
ADGDR - a register containing the result and the last bit of preparedness;
ADSTAT - ADC status register (all channels);
ADDRX - the result register of the channel.
Table E.2 Format Registry DACR (0xE006C000) DAC control
To activate the DAC to set bits 19:18 in the state register PINSEL1 "10"
Appendix F
Table F.1 interrupt controller registers
The main registers:
VicSoftInt - register bits which correspond to the existing demand at the moment interrupts;
VicSoftIntClear - register reset VicSoftInt;
VicIntEnable - register an individual permit / prohibit interrupt;
VicIntEnClear - register reset VicIntEnable;
VicIntSelect - register selection anchor (IRQ or FIQ) for each interrupt;
VicVectCntl0-15 - slots Registers IRQ (bit resolution and contain a number of slots
for each of the 16 vector interrupt IRQ);
VicVectAddr0-15 - Address registers vectors IRQ;
VicVectDefAddr - address register handler of non-vectored IRQ;
VicVectAddr - register containing the address of the treated IRQ;
VicProtection - register to enable access to the registers of VIC.
Table F.2 Interrupt Sources
Educational edition
Software development and debugging for NXP ARM7 MCUs
Learner’s guide.
Compilers: Ilya Kudryavtsev, Dmitry Kornilin
Samara State Aerospace University (SSAU)