1
5.1.7.2
Special display modes
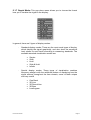
Please note that for all these display modes (with the
exception of the One-Band mode), you can select the colors
of the displayed signal. We have set, by default, a red color
for the high frequencies, and a blue color for the lower ones,
grading the colors of intermediate frequencies. However, you
may modify these colors by clicking on a small button at the
lower left and right corners of the display, next to the
frequency values.
5.1.7.2.1
One Band
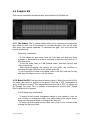
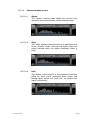
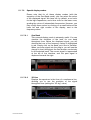
This unusual display mode is extremely useful. You can
visualize the evolution of the level for one band
throughout time. Below the displayed signal, you will
observe that one of the frequency values is highlighted
in red. Simply click on the band you’d like to visualize.
When you enter signal into the plug-in, you will see the
change in level throughout the time domain, exclusively
for the selected band. The current signal is represented
at the left of the interface, and the past signal is
displaced towards the right.
5.1.7.2.2
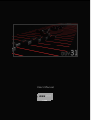
3D Line
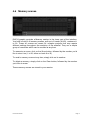
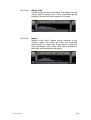
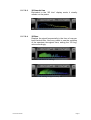
Displays the spectrum in the form of a continuous line,
allowing you to see the evolution of the signal
throughout time (setting the “3D lag” value).
DUY31 User Manual
Page 26