1
TechnologSoft
69
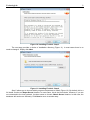
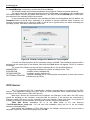
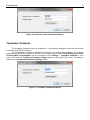
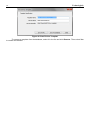
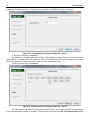
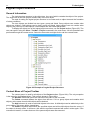
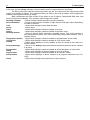
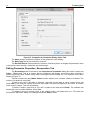
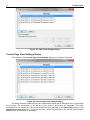
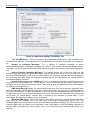
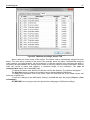
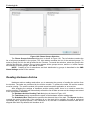
Figure 82. Graph View Settings Dialog
To attach a channel to the axis, open the dropdown list in the Axis column and select the desired
axis. The dropdown list is opened by the
button. The list of axes is edited in the Graph Settings
dialog box (please refer to the Types of Data View section of the manual and Figure 85).
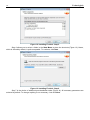
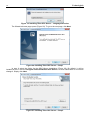
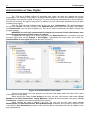
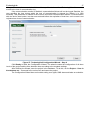
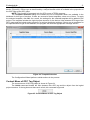
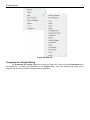
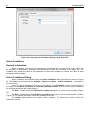
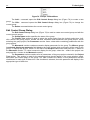
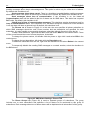
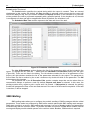
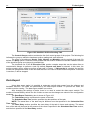
Figure 83. Dropdown Color Panel
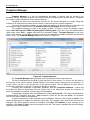
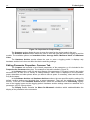
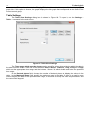
Table View Settings Dialog
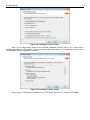
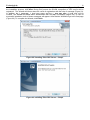
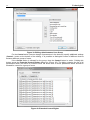
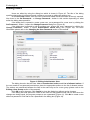
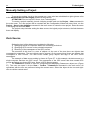
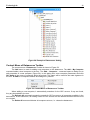
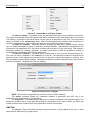
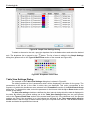
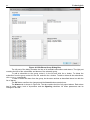
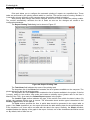
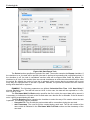
The example of the Table View Settings dialog box is shown in Figure 83.
The dialog contains a list of parameters which will be displayed in the table for the group. The
parameters in the list are in the order in which they are displayed. This order corresponds to the
sequence in which the checkboxes were selected in the Parameters section of the Edit Control Group
dialog box. To change this order, select the parameter in the list and click the Up or Down button at the
bottom of the dialog.
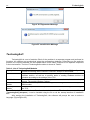
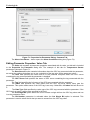
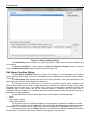
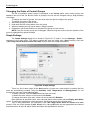
The Use own settings checkbox redefines the time interval during which the data is displayed in
the table. By default, the general settings set in the Table View Settings dialog box are used (please
refer to the Types of Data View section of the manual and Figure 86). If the checkbox is off, the general
settings are used. If the checkbox is on, the buttons are activated in the Time range which must be
shown section. With the help of these buttons specify the required time interval. The *2 and /2 buttons
double and halve the specified time interval.