1
TEST EQUIPMENT PLUS
Signal Hound USB-SA44
User Manual and
Programming Guide
TEST EQUIPMENT PLUS
Signal Hound USB-SA44 User Manual and
Programming Guide
2010, Test Equipment Plus
35707 NE 86th Ave
Phone (360) 263-5006 • Fax (360) 263-5007
Version 1.43B
Table of Contents
1
PREPARING FOR USE ............................. 1
3.2
Viewing Modulation........................................12
3.2.1
Capturing Pulses .......................................12
1.1
Initial Inspection ............................................... 1
3.3
Measuring Harmonics ....................................13
1.2
Software Installation ........................................ 2
1.2.1
System Requirements................................. 2
1.2.2
Install the Signal Hound Software............. 2
3.4
Measuring Phase Noise...................................13
1.3
Running the software for the first time ......... 2
2
GETTING STARTED.................................. 3
2.1
The Graticule ..................................................... 3
2.2
The Control Panel............................................. 4
2.2.1
FREQUENCY CONTROLS ..................... 5
2.2.2
SPAN CONTROLS.................................... 5
2.2.3
AMPLITUDE CONTROLS ...................... 5
2.2.4
MARKER CONTROLS ............................ 5
2.2.5
TRACE CONTROLS................................. 6
2.2.6
TRIGGER AND SWEEP CONTROLS ... 6
2.2.7
ADDITIONAL CONTROLS .................... 6
2.3
The Menu ........................................................... 6
2.3.1
FILE............................................................. 6
2.3.2
EDIT............................................................ 7
2.3.3
SETTINGS.................................................. 7
2.3.4
UTILITIES.................................................. 7
2.3.5
TRACE........................................................ 8
2.3.6
AUDIO ........................................................ 8
2.3.7
ADVANCED .............................................. 8
2.3.8
HELP ........................................................... 8
2.4
The Status Bar ................................................... 9
2.5
The Signal Hound Front & Rear Panels ....... 9
3
TAKING MEASUREMENTS .................... 10
3.1
Measuring Frequency and Amplitude......... 10
3.1.1
Using the Marker ...................................... 10
3.1.2
Using the Counter..................................... 11
3.1.3
Example: Identify a Signal’s Frequency
and Amplitude ........................................................... 11
3.1.4
Using the DELTA Marker ....................... 12
3.1.5
Measuring Low Level Signals................. 12
3.5
Using the Measuring Receiver Utility ..........14
3.5.1
Audio Analysis Controls ..........................14
3.5.2
The Analyzer Data Window.....................15
3.6
Limitations of the Signal Hound ...................16
3.6.1
RBW Limitations ......................................16
3.6.2
IF Feed-Through .......................................16
3.6.3
Sweep Time...............................................16
4
4.1.1
4.1.2
4.1.3
4.1.4
4.1.5
4.1.6
4.1.7
ADDITIONAL FEATURES ....................... 17
Save / Recall State ....................................17
Printing ......................................................17
Listening to Demodulated Audio.............18
Automation over TCP/IP ..........................18
Using an External Timebase ....................19
Using an External Trigger ........................19
Using Sync Out .........................................20
5
THEORY OF OPERATION ...................... 21
5.1.1
The Three Span Ranges............................21
5.1.2
Reducing Spurious and Residual
Responses...................................................................22
5.1.3
IF-to-Bits Receiver....................................22
5.1.4
IF and RBW Selection ..............................22
6
TROUBLESHOOTING ............................. 24
7
CALIBRATION AND ADJUSTMENT...... 26
7.1
Equipment Required.......................................26
7.2
Setup Block Diagram ......................................26
8
SPECIFICATIONS.................................... 27
8.1
Frequency .........................................................27
8.2
Amplitude (RBW ≤200KHz) ......................... 27
8.3
Sweep ................................................................ 28
8.4
Measuring Receiver ........................................ 28
8.5
Inputs and Outputs......................................... 28
8.6
Calibration ....................................................... 28
8.7
Adjustments ..................................................... 28
8.8
Optional Accessories....................................... 28
9
REVISION HISTORY ............................... 29
10
WARRANTY AND DISCLAIMER ............ 30
10.1.1
Warranty ............................................... 30
10.1.2
Warranty Service .................................. 30
10.1.3
Limitation of Warranty ........................ 30
10.1.4
Exclusive Remedies ............................. 31
10.1.5
Certification .......................................... 31
10.1.6
Credit Notice......................................... 31
P R E P A R I N G
F O R
U S E
Chapter
1
1 Preparing For Use
Unpacking your Signal Hound and Installing Software
T
he The Signal Hound USB-SA44 is a USB-based 1 Hz to 4.4 GHz economy
spectrum analyzer and measuring receiver. Using recent innovations in RF
technology, the Signal Hound has the sensitivity, accuracy and dynamic range
you’d expect in a unit many times its cost. The Signal Hound is powered from
the USB cable, eliminating the need for a separate power supply. Measuring less than 8
inches long and weighing only ten ounces, the Signal Hound can be used virtually
anywhere!
1.1 Initial Inspection
Check your package for shipping damage before opening. Your box should contain a
USB cable, a CD-ROM, and a Signal Hound USB-SA44.
1
P R E P A R I N G
F O R
U S E
1.2 Software Installation
The Signal Hound is operated from a Windows® based PC using our application
software.
1.2.1
System Requirements
The Signal Hound software and drivers are compatible with Windows® operating
systems. You must have at least 50 MB of free disk space, 128 MB of RAM, USB 2.0
and a 500 MHz processor.
1.2.2
Install the Signal Hound Software
Run setup.msi from the CD by double-clicking the file. Follow the directions on the
screen. The Signal Hound software is now installed and ready to use. USB drivers will
be installed as well. You must reboot before the Signal Hound will operate correctly.
1.3 Running the software for the first time
1. Using the included USB cable, connect the Signal Hound to any available
USB 2.0 port. Wait while Windows installs the necessary device drivers.
This takes several seconds. Once you see “The hardware is ready to use”,
continue.
2. Launch the Signal Hound application from the Start Menu or desktop.
The first time the software runs, calibration data is transferred from the
Signal Hound to the computer. This takes about 10 seconds.
3. You may begin using the Signal
The Signal Hound’s RF
input is DC-coupled.
Hound Spectrum Analyzer now. If you
Always use a DC block
wish to optionally verify basic
when your signal has AC
and DC combined.
functionality, proceed with the next steps.
4. Connect the “SELF TEST” BNC
output to the RF IN SMA input using a BNC cable and BNC-to-SMA
adapter.
5. From the GUI, select Utilities
SELF TEST.
6. Observe that all self tests pass. If not, see the Troubleshooting section.
2
G E T T I N G
S T A R T E D
Chapter
2
2 Getting Started
Learn about the basic functions and features of your Signal
Hound Spectrum Analyzer and Measuring Receiver
T
The Signal Hound Graphical User Interface, or GUI, is used to communicate
with the Signal Hound, sending commands and receiving data over USB. The
user sends commands using the Control Panel and Menu. The data is
returned over USB and displayed in the Graticule as a Trace. For specific
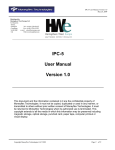
measurements, the Marker and Status Bar may be used as well. See Figure 1 for the
locations of these items.
Figure 1 – The Signal Hound Graphical User Interface (GUI)
2.1 The Graticule
The Graticule contains ten vertical and ten horizontal divisions to display trace data.
The trace data is the processed and formatted data from the Signal Hound, displayed in
the graticule. Above and below the Graticule, you will find indicators regarding
settings and markers. The indicators include:
3
G E T T I N G
S T A R T E D
⇒ REF: Reference level, top left. The reference level is the signal amplitude for the
top Graticule line.
⇒ Hourglass activity indicator: top right. The upper right corner of the Display
Window contains an activity indicator, rotating while data is being collected and
processed.
⇒ DB/div: Amplitude scale, near top left, in dB per division of the Display Window.
In Linear scale, this will be mV/div.
⇒ ATTEN: Attenuator setting, top center. The internal electronic attenuator may
be set to 0, 5, 10, or 15 dB.
⇒ INT / EXT REF: Top right. Indicates whether internal or external reference is
selected.
⇒ START, CENTER, STOP: Bottom left, center and right of Display Window.
Start, center, and stop frequencies, representing the frequency of the left, center,
and right Graticule lines, respectively.
⇒ RBW: Calculated RBW, based on FFT size and
sample rate
Markers may be placed
anywhere on the trace by
left-clicking inside the
graticule at the desired
location.
⇒ SPAN: Difference between start and stop frequencies.
⇒ SWP: In zero-span, this is the exact sweep time from left to right. In all other
spans this is time elapsed during the last sweep.
⇒ MARKER DATA will appear along the bottom of the graticule.
⇒ Annunciators: In the top left corner of the graticule, you may see some letters.
These will notify you when readings are uncalibrated or a special setting exists such
as image rejection off. See the HELP menu for additional information.
2.2 The Control Panel
The control panel is the section on the right-hand side of the Graphical User Interface,
or GUI. It has buttons for the most common user commands. Frequency, span,
reference level, sweep and marker commands are available here.
Try this: Click CENTER FREQ, then using the mouse, click the
buttons 1, 2, 3, MHz. You should see your center frequency change to
123 MHz. Now click SET SPAN, 5, 0, KHz. Watch as start and stop
frequencies and span are updated in the lower section of the graticule.
4
G E T T I N G
2.2.1
S T A R T E D
FREQUENCY CONTROLS
⇒ CENTER FREQ sets the center frequency of the sweep. When clicked, a
popup will open, allowing you to enter the frequency using the mouse or
keyboard.
⇒ The + and – keys will change the center frequency by a preset amount, CF
Step Size under the Settings menu.
⇒ START and STOP set the sweep’s start and stop frequencies, respectively.
2.2.2
SPAN CONTROLS
⇒ SET SPAN sets the span of the sweep, the difference between start and
stop frequencies. The center frequency is held constant.
⇒ The + and – keys will step through the default spans from 100 Hz to 2
GHz, in a 1,2,5 pattern.
⇒ ZERO SPAN changes the x-axis on the graticule to time instead of
frequency. The y-axis may be demodulated amplitude or frequency. When
this button is clicked, a popup will open, allowing the user to select
amplitude (AM) or frequency (FM) for the y-axis.
⇒ FULL SPAN sets the span to its maximum.
2.2.3
AMPLITUDE CONTROLS
⇒ REFERENCE LEVEL sets the power level for the top graticule line.
⇒ The + and – keys will change the reference level by a preset amount, Ref
Lvl Step under the Settings menu.
⇒ ATTEN sets the internal electronic attenuator to 0, 5, 10, or 15 dB.
⇒ dB/div sets the scale for the y-axis. It may be set to any positive value.
o 10 dB /div is default, giving a full scale range of 100 dB.
⇒ LIN sets the amplitude scale to linear units, instead of logarithmic.
2.2.4
MARKER CONTROLS
⇒ PEAK moves the marker to the highest
amplitude signal on the graticule.
⇒ NORMAL places a marker at the center
frequency of the graticule
⇒ DELTA changes marker 2 to a relative marker.
5
The marker sequence of
OFF, PEAK, DELTA
is good for reliable dBc
measurements.
G E T T I N G
S T A R T E D
⇒ OFF turns all markers off and back to default settings
⇒ MKR
CF sets CENTER FREQUENCY to the current marker position.
⇒ MKR
REF LVL sets the REFERENCE LEVEL to the current marker
position.
2.2.5
TRACE CONTROLS
⇒ NORMAL: The entire trace is updated each sweep
⇒ MAX HOLD: The highest amplitude for each frequency point is displayed.
Each sweep, only frequency points with higher amplitudes are updated.
2.2.6
TRIGGER AND SWEEP CONTROLS
⇒ CONTINUOUS: A new sweep begins as soon as the last sweep is
completed.
⇒ SINGLE: A single sweep is run, then the Signal Hound remains inactive.
⇒ FREE RUN: In Zero Span mode, a sweep begins immediately
⇒ VIDEO: In Zero Span mode, the Signal Hound waits for a minimum signal
amplitude before sweeping. When clicked, a popup opens where the user
sets the minimum signal amplitude. This is useful for measuring pulses as
short as 10 microseconds.
2.2.7
ADDITIONAL CONTROLS
⇒ MEAS RCVR opens the Measuring Receiver utility. See Section 3.5
⇒ 3 dB points positions markers at points 3 dB from the peak
⇒ PRESET restores the Signal Hound software and hardware to its initial
power-on state.
2.3 The Menu
2.3.1
FILE
⇒ Recall State: This loads a previously saved instrument state, including
trace data. It can be used to recall an instrument setup or view saved
trace data. States are saved as standard Windows ® files with the .tsa
extension
⇒ Save State: This saves an instrument state, including controls and trace
data.
⇒ SaveAs… Same as above, with a different filename
6
G E T T I N G
S T A R T E D
⇒ Print… Used to print the Graticule, trace data and settings. The title is
printed as well. Free PDF print utilities, such as PDF995 and
PrimoPDF®, are available to "print to" and save a PDF file.
2.3.2
EDIT
⇒ Set Title: Enter an optional title. This will appear across the top of
printouts.
2.3.3
SETTINGS
⇒ CF Step Size: Enter Center Frequency Step Size here. This controls
⇒
⇒
⇒
⇒
⇒
⇒
⇒
⇒
⇒
⇒
⇒
2.3.4
the frequency step when the Center Freq + / - keys are used.
Ref Lvl Step: Enter Reference Level Step Size here. This controls the
reference level step when the REFERENCE LEVEL + / - keys are
used.
Span / RBW: For spans of 200 KHz or less, this will control the
digital resolution bandwidth selection (RBW), controlling the shape of
the signal response curve. The RBW is selected by the software, and
will be close to this fraction of the span. 80 is default. A lower
number gives a more rounded curve.
Sweep time: For zero span sweeps, Sweep Time controls the x-axis.
For non-zero spans, the software digitally processes several signals to
produce a single sweep, so sweep time is selected for you. Non-zero
sweep times listed are approximate and may be inaccurate.
Signal Track: Turn this feature on to keep a signal with frequency drift
in the center of the Graticule.
Video Averaging: This will smooth out noise for low level signals by
averaging several sweeps together. Average 1, 10 or 100 sweeps.
Image Suppression: On by default. The software suppresses image
responses by sweeping the LO above and below the RF frequency and
masking the responses together. If your signal is transient, you may
wish to turn off image suppression to avoid having valid responses
discarded as possible image responses. For ultra-fast updates and no
processing except the minimum FFT on the smallest possible capture,
turn off image suppression and select RealTime.
Sync/Trig: The Signal Hound can be configured to trigger a sweep
from an external input, or to output a logic high when a sweep begins.
See “Sync/Trigger Options” for more information.
Color Scheme: Choose between two color schemes.
Counter: Turns the RF counter on or off
Set Marker Freq: Positions the marker at a specific frequency.
Downconverter Offset: Adds a frequency offset to display
UTILITIES
⇒ Measuring Receiver: This invokes the Measuring Receiver software.
See the “Measuring Receiver” section of the manual for details
7
G E T T I N G
S T A R T E D
⇒ Harmonics Plot: This plots the fundamental and up to 9 overtones on
a single plot by taking the current center frequency and span, capturing
and plotting the center of the trace, then moving up to the next
overtone.
⇒ Phase Noise Plot: This utility takes about 1 minute to run. It will
sweep several times, then combine the sweeps into a phase noise plot.
The data is approximate and is limited by the phase noise of the Signal
Hound itself. For best close-in phase noise, use an external 10 MHz
reference with > 10 dBm power level.
⇒ Self Test: To use the self test, connect the SELF TEST to the RF IN.
This checks the attenuator, mixers, broadband power detector, RF and
IF signal paths, and I/Q demodulator.
2.3.5
TRACE
⇒ Trace AB: Stores trace A (the main trace displayed) into trace B. It
does not alter the visibility of trace B.
⇒ View Trace B: Displays or hides trace B.
⇒ Limit Lines: Displays or hides a lower limit line and an upper limit line.
2.3.6
AUDIO
⇒ Listen: For AM / FM demodulation, processes incoming RF into
audio, which plays continuously through the computer speakers. For
best sensitivity, set the attenuator to 0 dB and reference level to –40
dBm before turning on the audio. Options include AM/FM
demodulation, bandwidth selection, FM de-emphasis.
2.3.7
ADVANCED
⇒ Enable Automation: The Signal Hound may be automated through
TCP/IP, locally or over a network. See separate section in this manual
for more information.
⇒ Calibration: See Chapter 7
⇒ Recalibrate TCXO: If you can generate a 1 GHz signal accurate to 1
part per billion, you may recalibrate the TCXO offset to provide more
accurate frequency readings.
2.3.8
HELP
⇒ About Signal Hound: Look here for hardware, software, and firmware
versions.
⇒ Annunciator Help: Explains the meaning of various annunciators
which appear in the top left graticule.
⇒ User Manual: Opens this manual.
⇒ SignalHound.com: Takes you to the website.
8
G E T T I N G
S T A R T E D
2.4 The Status Bar
When the mouse pointer enters the graticule area, the Status Bar automatically
displays the frequency (or time) of the mouse’s x-coordinate, and the signal level of the
trace at that frequency (or time). This can be used to check a signal level without
moving the markers. It can also be used to help you more accurately place markers.
position on the graticule.
2.5 The Signal Hound Front & Rear Panels
The front panel includes a 50Ω SMA RF
input. Do not exceed +20 dBm or damage
may occur. A READY / BUSY LED flashes
orange each time a command from the
computer is processed.
The rear panel has three connectors:
1) 10 MHz Reference input, automatically
detected after each sweep completes. Use a
clean 10 MHz reference with >0 dBm level.
+13 dBm is recommended.
2) A USB type B connector. Connect to
your PC using the included USB cable.
3) A multi-purpose BNC connector. This may be used as a TTL/CMOS trigger input,
a Self Test Signal output, or a CMOS Sync Output. The Signal Hound software
controls the function of this BNC. It defaults to unused / no output.
9
T A K I N G
M E A S U R E M E N T S
Chapter
3
3 Taking Measurements
Learn how to take amplitude, frequency, and modulation
measurements with the Signal Hound
T
he Signal Hound is capable of making a wide range of measurements. The
internal I/Q demodulator captures up to 2 Megabytes of information each
second, with a hardware-limited bandwidth of 240 KHz. The trace is actually
a combination of several sweeps, mathematically combined to reject image
and spurious responses. When taking measurements of highly modulated signals
which exceed this 240 KHz bandwidth, or any combination of signals with a
bandwidth of >240 KHz, great care must be taken, as the I/Q demodulator will reject
out-of-band responses. In other rare instances, multiple CW input frequencies that are
not harmonically related can mix to produce spurious responses. For these reasons,
the Signal Hound is not recommended for taking measurements of signals with
a bandwidth of greater than 240 KHz.
For signals within the 240 KHz bandwidth limit, a high degree of accuracy and
sensitivity are available. The I/Q demodulator has dual 24-bit DACs, yielding a very
high internal resolution.
3.1 Measuring Frequency and Amplitude
3.1.1
Using the Marker
The Signal Hound has several tools for identifying a signal’s frequency and amplitude.
The easiest to use is the Marker. To activate the marker and place it at the peak
frequency, locate the Marker PEAK button on the Control Panel. The frequency and
amplitude readout of the marker is located below the graticule. The marker’s accuracy
is dependent on the SPAN. Narrower spans have higher marker accuracy. The
amplitude accuracy is NOT dependent on the vertical dB/div, since the I/Q
data is linear in voltage and has much higher resolution than is displayed.
To measure a signal that is not the peak, you may simply move the mouse over the
desired signal and left-click to place a marker. The frequency and amplitude are read as
before.
10
T A K I N G
3.1.2
M E A S U R E M E N T S
Using the Counter
For spans of 200 KHz or less, and signals at least ~30 dB off the noise floor, a highresolution counter is available. The accuracy of the counter depends on span, signal
level and timebase, but is typically accurate to 0.1 Hz with an external 10 MHz
timebase.
3.1.3
Example: Identify a Signal’s Frequency and Amplitude
TRY THIS EXAMPLE: To find a signal within a certain frequency
range (e.g. 200 MHz to 2.5 GHz) and measure its exact frequency, a
simple procedure would be:
1. Set START FREQ to the lowest possible frequency (e.g. 200 MHz)
2. Set STOP FREQ to the highest possible frequency (e.g. 2.5 GHz)
3. Set REFERENCE LEVEL to the highest signal level you expect (e.g. 0
dBm)
4. Click SINGLE sweep, and wait for the sweep to complete.
5. If a signal is identified, click PEAK, MKR
CF to move the signal to the
center of the graticule.
6. Under the Sweep Controls section, click the
minus – button to decrease span, until your
span is 50 MHz.
For faster sweeps, avoid
having a START FREQ
below 150 MHz.
7. Click CONTINUOUS sweep, then under the Menu select Settings->Signal
Track->ON
8. Under the Sweep Controls section, click the – button until your span is 50
KHz.
9. Select Settings->Counter to activate the frequency counter.
10. Record the frequency counter output, found above the graticule, center top.
Record the amplitude of the marker, in dBm.
Notice the change in sweep appearance from wide spans (greater than 200 MHz), to
mid-range spans (greater than 200 KHz), to narrow spans (200 KHz or less). This is
due to the software internally changing modes of operation. For the wide spans, a
power meter with a 5 MHz bandwidth is used to quickly identify signals. For narrower
spans, the power meter is turned off and I/Q data is used to give a more accurate
11
T A K I N G
M E A S U R E M E N T S
reading of both amplitude and frequency. Below 200 KHz span, the Spectrum
analyzer changes from a stepped LO frequency to a fixed LO frequency.
3.1.4
Using the DELTA Marker
To measure a difference or change in frequency and / or amplitude, use the
DELTA marker.
1. Turn the markers off if they are currently on. Adjust the settings until your
desired signal is displayed, with a span narrow enough for your required
accuracy. A 5 to 50 KHz span is ideal for many measurements.
2. Place your first marker using the mouse (left-click) or the PEAK button.
3. Press the DELTA button. This freezes the location of the first marker and
activates a second marker.
4. Change the signal’s amplitude or place your second marker using the mouse.
5. The difference between the two markers is displayed below the graticule.
3.1.5
Measuring Low Level Signals
To measure low-level signals, there are a few tricks to getting accurate readings. First
of all, set the internal electronic attenuator to 0 dB (click the ATTEN button). Then,
set your reference level to -50 dBm or lower. This internally selects the highest
sensitivity settings. Using an external timebase and narrow span (1 KHz or less)
should give you better results.
3.2 Viewing Modulation
A signal’s modulation envelope may be viewed or measured using ZERO SPAN. To
use zero span, your center frequency should be equal to your carrier frequency.
Click the ZERO SPAN button. Select AM to select the amplitude vs. time graph, or
select FM to change the graph to instantaneous frequency vs. time. This tool allows
you to view demodulated data. Adjust sweep time for best view.
You may use the markers as above to take basic measurements. SINGLE sweep will
make these measurements much easier to make.
3.2.1
Capturing Pulses
To capture a pulse, click ZERO SPAN as before, then click VIDEO trigger. You
must supply the minimum amplitude to trigger the sweep. The sweep will not begin
until the input signal reaches this power threshold, after which the sweep will begin
immediately.
12
T A K I N G
M E A S U R E M E N T S
3.3 Measuring Harmonics
A harmonics utility is included for one-click measurements of harmonics. To use this
utility, you must span down to 100 KHz or less (narrower spans will give a lower noise
floor), center the signal on the graticule, then select Utilities
Harmonics Plot from
the Menu.
When the sweep completes, you will see the relative amplitude of the fundamental and
harmonics up to the tenth. A popup will appear asking if you want to sweep
harmonics again. To measure the amplitudes of the harmonics, simply move this
popup out of your way until you have recorded the desired amplitudes. This utility is
for amplitude measurements only. The frequencies are assumed to be integer
multiples of the fundamental. When your measurements are complete, select Yes or
No on the popup. If the popup gets hidden behind the GUI, it will be available on the
Windows® taskbar.
3.4 Measuring Phase Noise
A phase noise utility is available to quickly plot SSB phase noise from 1 Hz to 1 MHz.
For best results, it is recommended to use this utility with a high quality OCXO
external timebase of +13 dBm input.
To use the utility, center your CW signal on the graticule with a span of 1 KHz or less.
If the frequency is known and timebases are locked, simply enter the frequency as the
CENTER FREQ. Then select Utilities
Phase Noise Plot.
You will be asked if the signal is exactly centered. If you are using an external timebase
and you entered the exact frequency, select YES. Otherwise select NO and the
software will automatically center
it for you.
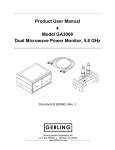
The automated phase noise
measurement takes about a
minute. Let it finish before doing
anything else with the software.
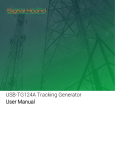
Once the measurement finishes,
you will see a plot similar to the
figure, right.
The Signal Hound’s internal
Figure 2: Phase Noise Plot
TCXO timebase contributes
more phase noise to these
measurements than an external OCXO 10MHz timebase. Please review the Signal
Hound’s specifications for phase noise. If the signal you’re measuring has considerably
more phase noise than the Signal Hound, you should be able to get meaningful results
using the internal TCXO timebase. Otherwise, an external OCXO timebase will be
needed to make a useful measurement.
13
T A K I N G
M E A S U R E M E N T S
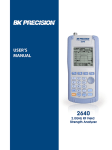
3.5 Using the Measuring Receiver Utility
The measuring receiver utility takes measurements of AM and FM modulation and
relative signal level measurements. If you are familiar with other measuring receivers,
some of this information will be redundant. In
addition to modulation measurements, the measuring
receiver also accurately measures relative power.
To use this, center the signal on the graticule in the
spectrum analyzer with a span of 200 KHz or less,
then select Utilities->MEAS RCVR from the
menu. Note: The carrier frequency for modulation
measurements will be set to the CENTER FREQ
from the spectrum analyzer.
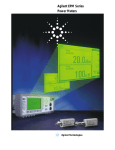
Enter the desired IF and audio settings, then click
START to begin analysis.
3.5.1
Audio Analysis Controls
⇒ IF Bandwidth: keep this at least 2.4x
your peak FM modulation.
Any
modulation outside this bandwidth will
be rejected.
Figure 3: Measuring Receiver
⇒ Audio Low Pass: This selects a digital low pass filter (windowed sinc) for
the demodulated audio, to reject high frequency audio noise. The filter
rejects audio modulation above the selected cutoff frequency, Fc.
⇒ Audio Band Pass: Narrow band audio filter (~160 Hz BW) to select a
single modulation frequency and reject all others.
⇒ The Synchronous / Average Level Detector is used to select between
two relative amplitude measurement modes.
o There are two gain ranges for RF level. If your amplitude
readings must span both ranges, you must take a stable power
level reading in the overlapping region (–45 to –65 dBm) to
properly calculate relative power. When the RF level is in this
overlapping area, the “CAL RANGE” button will appear.
Click it once to generate a correction for spanning the two
gains. Once this correction value is calculated, an asterisk will
appear by “Relative Power” indicating you are in the highsensitivity range. You can now step power across the full
14
T A K I N G
M E A S U R E M E N T S
dynamic range. Auto-ranging will occur automatically. There
is no limit to the step size.
o
Checking the Synchronous / Average Level Detector box
will zero the relative power reading and enable the
synchronous detector. Use this to measure a clean, phaselocked RF CW signal over a 140 dB dynamic range. Use a
common external 10 MHz reference.
o Un-checking this box will zero the relative power reading and
enable the average detector. Use this to measure a noisy,
modulated, or drifting signal over a 90-100 dB dynamic range.
⇒ Show FM: Check this box to view FM modulation measurements.
⇒ Show AM: Check this box to view AM modulation measurements.
3.5.2
The Analyzer Data Window
⇒ RF COUNTER displays the carrier frequency. It has a 1/100 Hz resolution, but
its accuracy may be lower than this at high frequencies or IF bandwidths.
⇒ FM Modulation Readings are readings taken on the FM modulation after IF and
audio filtering. The units for all FM readings are Hz.
o RMS: This is the root mean square of the FM modulation, sometimes
referred to as the average FM deviation.
o RMS
: With single tone modulation, this is equal to the FM Peak+
or Peak- with noise spikes smoothed.
o PEAK+: This is the highest instantaneous frequency above the carrier
o PEAK-: This is the highest instantaneous frequency below the carrier
o Audio Freq: This is the count of the demodulated audio frequency
⇒ Relative Power is the change in power reported from the Synchronous / Average
power detector. The reference power level (0 dBc) is set to the power when the
START button was first pressed. It may be reset to 0 dBc by checking or unchecking the Synchronous Level Detector box.
o Averaged is the average of the last ten relative power readings
⇒ AM Modulation readings are taken on the AM modulation envelope after IF and
audio filtering. The units for all AM readings are percent.
15
T A K I N G
M E A S U R E M E N T S
3.6 Limitations of the Signal Hound
3.6.1
RBW Limitations
Although a resolution bandwidth (RBW) of 0.1 Hz is available for very narrow spans,
be aware of the limitations. The internal timebase has phase noise, limiting the
usefulness of narrow RBWs. For best results, ensure that your CENTER FREQ in
GHz is less than your RBW in Hz when using the internal timebase.
The Signal Hound mostly uses digital RBWs. There are 16 IF bit rates that combine
with 16 FFT sizes to produce hundreds of possible RBWs. The closest RBW to your
desired Span/RBW ratio is automatically selected.
3.6.2
IF Feed-Through
A 10.7 MHz intermediate frequency (IF) is used throughout the box. An RF input
signal from 10.5 to 10.9 MHz may generate spurious responses for a variety of
CENTER FREQ and SPAN settings.
If you want to analyze a 10.7 MHz signal, you must use a span of 200 KHz or less and
CENTER FREQ of 150 MHz or less to avoid spurious responses. The harmonics
utility will work fine as well. Two separate intermediate frequencies, 2.92 MHz and
10.7 MHz, combine to reject IF leakage in narrow spans.
3.6.3
Sweep Time
Sweep Time varies based on system settings. Except for zero span sweeps, the user
does not get to specify sweep time.
The longest sweeps are full span from 0 Hz to 4.4 GHz, and extremely narrow sweeps
of 100 Hz or less. These can take several seconds to complete. The shortest sweeps
are spans of 50-200 KHz, RealTime ON, Image Suppression OFF. These can be as
short as 50 msec.
There is a break just above a 200 MHz span, where the 5 MHz RBW kicks in and
sweeps suddenly become faster and less accurate.
16
A D D I T I O N A L
F E A T U R E S
Chapter
4
4 Additional Features
Learn about save/recall state, Automation, Live Audio
Streaming and Printing
T
he Signal Hound leverages the power and flexibility of your Windows® PC,
making printing and automation easy and straightforward. Saving and
recalling instrument states are now as simple as saving and opening files, with
virtually no limit to the number of instrument states saved. Each instrument
state saves into approximately 10 KB on your hard drive, making it possible to save
millions of captures. Since most Windows® PCs come with speakers as well,
demodulated audio can even be played in real-time through the computer speakers!
4.1.1
Save / Recall State
To save an instrument state, including trace data, attenuator settings, frequency settings
and more, select File
Save State from the menu. A standard File Dialog box will
open, prompting you to supply a filename. This may be any legal file name, and may
be stored to any File Folder under Windows®. However, for simplicity, it is often best
to save states in the default folder.
You may use Save State to capture and store trace data into a small, compact file to be
printed later. Another use is to quickly and easily load a configuration for an
automated process.
To recall a previously saved state, select File
Recall State from the menu. A
standard File Dialog box will open, prompting you to select a file. Once you select a
file, it will be instantly displayed on the Graphical User Interface (GUI).
4.1.2
Printing
Printing is handled through the default Windows® print and print preview dialog
boxes, accessed by selecting File
Print… It is similar to printing from an Office
application. Print to any installed printer. Everything on the GUI above and below
the graticule is printed. An optional title, set by selecting Edit
Set Title, is printed
along the top.
17
A D D I T I O N A L
4.1.3
F E A T U R E S
Listening to Demodulated Audio
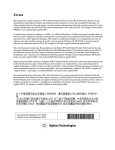
When you identify a modulated signal and wish to listen
to the modulation, you may position your marker on
the signal in question and select Audio->Listen. If
you do not place a marker, the CENTER FREQ will
be used. This frequency will be pre-loaded into the
dialog box on the left. Additional demodulation
options will be preloaded with the last values used or
default settings.
⇒ Modulation may be set to AM or FM.
⇒ IF Bandwidth may be set to 30 KHz for signals
Figure 4: Audio
Listen
with less modulation, or 120 KHz, which is better
for a typical FM broadcast.
⇒ De-emphasis is a digital single pole low-pass filter, used to remove the high-
frequency emphasis used in many FM broadcasts or to filter out noise.
⇒ Start begins playing audio. You may notice a couple of pops in the first second or
two, as the data is synchronized with the audio. The button’s label will change
from start to playing when audio begins. If you make a change to frequency,
bandwidth, or de-emphasis, the label will change to APPLY, indicating you must
click it to apply the new settings. Audio will be paused for a fraction of a second
while the new settings are applied
⇒ STOP halts the audio playback.
4.1.4
Automation over TCP/IP
The Signal Hound has some basic automation capabilities over TCP. This enables you
to change settings, read markers and capture traces to use in your own software. A
LabView® 8.0 example client is provided for reference.
To enable automation, click Advanced
Enable Automation on the Graphical User
Interface (GUI), and enter your desired IP address and port settings. The Signal
Hound software is the TCP Server. Your software will connect as the TCP
Client. Use “127.0.0.1” for the address if the automation client is running on the same
computer as the Signal Hound. This is the same as localhost.
Separate TCP ports for commands and data are required.
Once enabled, the Signal Hound software acts as a TCP server, and will accept one
and only one connection from a client. Once connected, the Signal Hound will receive
and process commands, sending data as requested.
18
A D D I T I O N A L
F E A T U R E S
Commands have a structure similar to SCPI. Data returns as a floating-point value
followed by a <CR><LF> (carriage return line feed) pair. Commands are not case
sensitive. Lower case letters shown are optional. Commands are sent on the
COMMAND port. Data is returned on the DATA port. Commands are terminated
with a semicolon and/or <CR><LF>.
Table 1: Automation Commands
Command
MARKer:FREQ ?;
MARKer:AMPL ?;
TRACe:DATA ?;
FREQ:CENT 1.0e9;
FREQ:STARt 9.9e8;
FREQ:STOP 1.1e9;
FREQ:SPAN 500;
MARK:PEAK;
MARK:NORM;
AMPL:RLEV –10.0;
TRIG:SING;
TRIG:CONT;
RECAll MyFile.tsa
SAVE MyFile.tsa
4.1.5
Action
Returns the frequency, in Hz, of the marker on the DATA port
Returns the amplitude, in dBm or mV, of the marker, on the DATA port
Returns the 641-point trace data. Each point is on a separate line.
Moves CENTER FREQUENCY to value listed, in Hz. Example shown is
1 GHz.
Moves START FREQUENCY to value listed, in Hz. Example shown is
990 MHz.
Moves STOP FREQUENCY to value listed, in Hz. Example shown is 1.1
GHz.
Adjusts SPAN to value listed, holding CENTER FREQUENCY constant
if possible. SPAN in Hz. Example shown is 500 Hz.
Moves marker 1 to the point of highest amplitude.
Moves marker 1 to the center frequency.
Moves the reference level to value listed, in dBm or mV.
Example shown is –10 dBm.
Trigger a single sweep.
Begin continuous sweeping.
Recall a previously saved instrument state. Example recalls filename
“MyFile.tsa”
Save instrument state and trace data. Example saves filename “MyFile.tsa”
Using an External Timebase
An external 10 MHz timebase my be used to improve the accuracy of frequency and
phase noise measurements. The level of the external timebase must be > 0 dBm.
+13 dBm is recommended. To use, simply connect the timebase to the Ext Ref In
after connecting the USB. It is best not to apply external timebase until the device is
powered on and the LED is green. Click “Single Sweep” from the GUI. The external
timebase will be selected automatically after your sweep completes.
4.1.6
Using an External Trigger
A TTL/CMOS trigger may be used to initiate a sweep at a specific time. The trigger
must be a 3.3V or 5V TTL/CMOS. To activate, select
Settings
SYNC/TRIG
TRIG IN. The selected sweep will wait for a trigger, then
begin within 10 microseconds of the trigger’s rising edge. When using an external
trigger, remember that image rejection happens in a separate sweep, after the first
19
A D D I T I O N A L
F E A T U R E S
sweep is triggered. If you are trying to capture an event, you may wish to turn off
image rejection, turn on realtime, and use spans of 200 KHz or below.
4.1.7
Using Sync Out
A 3.3V CMOS output may be used to trigger external equipment. The Sync Out goes
high as each sweep begins and remains high until the sweep is complete. . To activate,
select Settings
SYNC/TRIG
SYNC OUT. There is a 220 ohm internal
impedance for this output.
20
T H E O R Y
O F
O P E R A T I O N
Chapter
5
5 Theory of Operation
Learn about the internal blocks that make up the Signal Hound
T
he Signal Hound is built around a narrow-band IF-to-bits receiver with a
maximum bandwidth of 240 KHz. It receives up to 2 Megabytes of I/Q data
each second, which it processes into a trace. To bring you a low cost,
compact spectrum analyzer, we used recently developed high-level RF
integrated circuits. The block diagram, below, illustrates the major elements of the
design. Image rejection is accomplished by mixing high side and low side (sometimes
with separate IF frequencies), then masking together the results.
Figure 5: Simplified Block Diagram
5.1.1
The Three Span Ranges
⇒ Below 200 KHz span: the Signal Hound operates by mixing two fixed LO
frequencies (typically one above the RF frequency and one below). These are
masked together to produce the displayed trace. LO and IF frequencies are
selected automatically to best cancel image and spurious responses.
⇒ Up to 200 MHz span: the Signal Hound operates by rapidly sweeping LO
frequencies in 200 KHz steps, covering above and below the center frequency.
These are processed with small FFTs and masked together to reject image
responses and produce the displayed trace.
21
T H E O R Y
O F
O P E R A T I O N
o For RF frequencies below 25 MHz, image rejection requires additional
steps and the trace will be slower.
⇒ Greater than 200 MHz span: the Signal Hound operates by rapidly sweeping LO
frequencies in 3 MHz steps, reading power using the 5 MHz RBW Log Power
Meter. The LO is stepped to cover above and below each frequency. The
amplitude accuracy and frequency accuracy are lower and the image / spurious
suppression is reduced in this mode.
o For RF frequencies below 150 MHz, this mode produces too many
spurs. The above, slower method, is used for these frequencies.
o Certain RF frequencies may produce small spurious responses. To
verify a displayed signal, center it and step the span down. If it
disappears, it was likely a mixing artifact.
5.1.2
Reducing Spurious and Residual Responses
Certain RF frequencies may produce small spurious and/or residual responses. To
verify a displayed signal, center it and step the
Measurement tip: Linearity
span down to 10 KHz or less. If it disappears, it
of a mixer improves at lower
signal levels. For accurate
was likely a mixing artifact or a harmonic from a
harmonics measurements, you
system clock.
To avoid known residual
should have less than –25 dBm
into the mixer!
responses at multiples of the primary system
clocks, a secondary clock frequency is selected
for spans 100 KHz or below.
The mixers can typically operate with up to +0 dBm input, but keeping the input level
–25 dBm or lower will greatly improve linearity.
5.1.3
IF-to-Bits Receiver
The IF-to-bits receiver has three gain ranges and 16 selectable bit rates. The gain range
will be automatically selected based on attenuator settings and reference level to avoid
IF ADC compression, which will greatly distort the data. The software should warn
you if compression is occurring. If this happens, change reference level, attenuator,
and/or input level settings.
5.1.4
IF and RBW Selection
The I/Q data comes in over USB and is processed using an FFT with a Flat Top
window. The software controls the 16 bit rates and the size of the FFT to establish a
suitable resolution bandwidth (RBW) based on the span and selected Span/RBW ratio
available in the SETTINGS menu.
The resolution bandwidths are not the traditional analog 1,3,10 KHz filters. The
bandwidths are a function of the size of the FFT (which is a power of 2) and the IF bit
rate divisor (1 to 16). While this produces a large number of possible RBWs, they do
not fall in a 1-3-10 pattern.
22
T H E O R Y
O F
O P E R A T I O N
The RBW listed on the GUI is calculated from the bit rate divisor and FFT size. This
number is the approximate RBW and is listed in the lower left region of the GUI. For
wide spans, an additional RBW of 5 MHz is used. This is a typical value. There is no
specification for this RBW, but it is typically within 20%.
23
T R O U B L E S H O O T I N G
Chapter
6
6 Troubleshooting
If you experience a problem with your Signal Hound, please try these troubleshooting
techniques before contacting us:
1) Your Signal Hound Is Not Sweeping Properly
⇒ Try this first: Close the Signal Hound software. Unplug the USB cable and
any external 10 MHz or trigger cables from the Signal Hound and wait 15-30
seconds. Plug the USB cable back in. Check that both ends of the USB cable
are firmly seated and the Signal Hound LED is green. Launch the Signal
Hound Software. Try your sweep again.
⇒ Still not working? Unplug the USB cable from the Signal Hound. Disconnect
all USB devices from your PC. Reboot your PC. Wait until the PC has
completed rebooting. Plug in the Signal Hound’s USB. Launch the Signal
Hound Software. Try your sweep again.
⇒ Still not working? Contact technical support at http://www.signalhound.com
2) Your Signal Hound LED is off
⇒ Make sure the USB cable is connected at both ends, your PC is on and the
USB drivers are installed properly.
⇒ Is your PC or laptop configured in low power mode? The Signal Hound is
a high-powered USB device and may be shut down in some powersaving configurations.
3) Your Signal Hound doesn’t find a signal
⇒ Is it a swept or transient signal, a pulse or a rapidly modulated signal? If so,
and you know the frequency of the signal, set up for a 200 KHz span or less,
then select Settings
Image Suppression
OFF and Settings
Image
Suppression
Realtime. This disables the image rejection algorithm which
will reject data if it has moved or disappeared when the image is checked (it
also allows the image frequency through, which is 21.4 MHz above the
24
T R O U B L E S H O O T I N G
CENTER FREQ). It also and maximizes the update rate. You may also try
MAX HOLD to capture transient signals.
4) Your phase noise seems too high
You may consider using a low phase noise external reference or contacting us
about lower phase noise options. Be aware that the Signal Hound phase noise is
noticably higher than a YIG-based spectrum analyzer.
5) You receive a specific error code
Error 1: Your Signal hound was not found on a USB port. Plug in your Signal
Hound if it isn’t already. If it is already plugged in, unplug it, reboot, re-install the
USB driver, and/or try a different USB port.
Error 2-6: A USB communications error occurred. If multiple errors occur, close
out of the software, unplug the Signal Hound, wait 20 seconds, plug it back in and
try again. If you get a recurring error, please make a note of the error number, and
e-mail or call tech support.
6) General Advice to avoid problems
⇒ Unplug your Signal Hound from the USB port when not in use, or before
shutting down your computer.
⇒ Do not connect your Signal Hound’s USB port until your computer has
completed its bootup sequence. If you do, it may need to be unplugged for 20
seconds then plugged back in before operating properly.
25
C A L I B R A T I O N
A N D
A D J U S T M E N T
Chapter
7
7 Calibration and Adjustment
To perform a calibration or adjustment, connect the equipment as shown in section
7.2. Allow 30 minutes warm-up time. Launch the Signal Hound software. Select
Advanced
Calibration or Advanced
Adjustments
DO ALL ADJUSTMENTS.
Follow the directions on the screen. Adjustments are NOT available to general users.
7.1 Equipment Required
⇒ HP/Agilent 8340A/B or compatible synthesized generator
⇒ EPM442A Power Meter, GPIB Address 13
o E9304A power sensor on channel A
o 8481A power sensor on channel B
⇒ DC block, similar to 10240B
⇒ 10 MHz External Reference for Signal Hound and synthesized generator, ±0.01
ppm or better
⇒ 6 dB wideband power splitter, 11667B or similar
⇒ 3 dB fixed attenuator, 8493C or similar
⇒ National Instruments PCI-GPIB card or 100% compatible
7.2 Setup Block Diagram
EPM-442A
Splitter
Signal
Hound
DC Block
8481A
10 MHz EXT REF
>+5 dBm
3 dB
8340A/B
GPIB 20
26
S P E C I F I C A T I O N S
Chapter
8
8 Specifications
Unless otherwise stated, specifications are valid for an ambient temperature range of
20-25°C after a ten-minute warm-up. Specifications are listed may be used as typical
operating specifications over the full operating temperature.
8.1 Frequency
Frequency Range: 1Hz to 4.4GHz
Span Modes: (Center Frequency + Span) or (Start + Stop Frequencies)
Maximum Span: 4.4GHz
Minimum Span: 10Hz or Zero Span
Internal Frequency Reference Accuracy: ±1 ppm
For greater frequency accuracy connect to external 10MHz timebase (0 to 20dBm)
Frequency Readout Accuracy: 0.2% Span + 10% RBW
Marker Accuracy: 0.2% Span + 10% RBW
Counter Accuracy: 1Hz + timebase error
Resolution Bandwidth: 0.1Hz to 240KHz and 5MHz
Spectral Purity
Residual FM, 3KHz Audio LPF, 15 KHz IF BW: [0.06 Hz + 4 Hz / GHz] typical
RMS FM (e.g. 2 GHz RF would have 8.06 Hz RMS FM). Increasing IF BW increases
residual FM.
8.2 Amplitude (RBW ≤200KHz)
Range: 1dB Gain Compression to Displayed Average Noise Level (DANL)
1dB Gain Compression: (attenuator set to 15dB)
+16dBm Typical, 1Hz to 150MHz
+19dBm Typical, 150MHz to 4.4GHz
Displayed Average Noise Level: (0dB input attenuation, 1Hz RBW):
-123dBm
10Hz
-133dBm
100Hz
-138dBm
1KHz to 10MHz
-148dBm
10MHz to 100MHz
-138dBm
100MHz to 1GHz
-124dBm
1GHz to 4.4GHz
Absolute Accuracy: [+10dBm to {20dB above DANL}] ±1.5dB
Relative Accuracy: (attenuator set to 10dB) [+5dBm to {20dB above DANL}] ±0.25 dB
Maximum Safe Input Level: (attenuator set to 15dB)
Continuous Power +20dBm
DC Volts: ±0.2V
Residual Responses, <-80 dBm Input terminated, <=100 KHz span, attenuator at 0 dB 1
Note 1: Known residual responses at multiples of 10 MHz
27
S P E C I F I C A T I O N S
Spurious Responses, <=100 KHz span, < -80 dBm typical, CW tone input only.
8.3 Sweep
Zero Span Sweep Time 0.1 ms to 10 sec, ± 0.1%
All other sweeps times are estimates reported after sweep completes.
Maximum sample rate: 486K/sec
Sweep Trigger: free run, single, video, external
External Trigger: 3.3V CMOS/TTL input
8.4 Measuring Receiver
FM Accuracy ±1% typical
AM Accuracy ±1% typical
Synchronous Level Detector (15 KHz IF BW, timebases locked)
100 KHz to 1 GHz +0 dBm to –125 dBm after 10 min warmup ±0.25dB
1 GHz to 4.4 GHz +0 dBm to –115 dBm after 10 min warmup ±0.25dB
Average Level Detector, 15 KHz IF BW
100 KHz to 4.4 GHz +0 dBm to –70 dBm after 10 min warmup, ±0.25dB
Maximum IF Bandwidth 240 KHz
Audio Filters:
Low Pass: Digital Windowed Sinc, selectable cutoff
Band Pass: Selectable center frequency, narrow-band recursive, 160 Hz 3 dB bandwidth
Maximum sample rate: 486K/sec
8.5 Inputs and Outputs
1) BNC External Timebase (10 MHz input)
2) BNC Shared
o Self Test Output
o SYNC Out
o Sweep Trigger In
3) SMA RF Input
8.6 Calibration
Load and run packaged calibration software to verify that USB-SA44 is operating within tolerance.
Recommended calibration interval is 1 year.
8.7 Adjustments
Load and run packaged adjustment software to reload calibration constants when USB-SA44 will
not pass calibration.
8.8 Optional Accessories
1)
2)
3)
4)
20dB Fixed Attenuator, Mini Circuits Part # VAT-20+
DC Block, Mini Circuits Part # BLK-89+
SMA(m) to BNC(f) Adapter, Mini Circuits part# SM-BF50+
3GHz RF Probe, p/n P-20A (made by Auburn Technology,
www.auburntec.com)
28
R E V I S I O N
H I S T O R Y
Chapter
9
9 Revision History
Software Version 1.40 – Fixed crashes due to memory leak on spans 500KHz
– 200 MHz. Enabled two Signal Hounds to be used simultaneously. Fixed
bug where other FTDI-based USB devices would cause Signal Hound
software to not operate.
Software Version 1.41—Added downconverter frequency offset
Software Version 1.42—Added compatibility with older device naming
convention.
Software Version 1.43—Fixed Self Test glitches
29
W A R R A N T Y
A N D
D I S C L A I M E R
Chapter
10
10 Warranty and Disclaimer
©Copyright 2010
Test Equipment Plus
All rights reserved
Reproduction, adaptation, or translation without prior written permission is prohibited,
except as allowed under the copyright laws.
10.1.1 Warranty
The information contained in this manual is subject to change without notice. Test
Equipment Plus makes no warranty of any kind with regard to this material, including,
but not limited to, the implied warranties or merchantability and fitness for a particular
purpose.
Test Equipment Plus shall not be liable for errors contained herein or for incidental or
consequential damages in connection with the furnishing, performance, or use of this
material. This Test Equipment Plus product has a warranty against defects in material
and workmanship for a period of one year from date of shipment. During the
warranty period, Test Equipment Plus will, at its option, either repair or replace
products that prove to be defective.
10.1.2 Warranty Service
For warranty service or repair, this product must be returned to Test Equipment Plus.
The Buyer shall pay shipping charges to Test Equipment Plus and Test Equipment
Plus shall pay UPS Ground, or equivalent, shipping charges to return the product to
the Buyer. However, the Buyer shall pay all shipping charges, duties, and taxes, to and
from Test Equipment Plus, for products returned from another country.
10.1.3 Limitation of Warranty
The foregoing warranty shall not apply to defects resulting from improper use by the
Buyer, Buyer-supplied software or interfacing, unauthorized modification or misuse,
operation outside of the environmental specifications for the product. No other
warranty is expressed or implied. Test Equipment Plus specifically disclaims the
implied warranties or merchantability and fitness for a particular purpose.
30
10.1.4 Exclusive Remedies
The remedies provided herein are the Buyer’s sole and exclusive remedies. Test
Equipment Plus shall not be liable for any direct, indirect, special, incidental, or
consequential damages, whether based on contract, tort, or any other legal theory.
10.1.5 Certification
Test Equipment Plus certifies that, at the time of shipment, this product conformed to
its published specifications.
10.1.6 Credit Notice
Windows is a registered trademark of Microsoft Corporation in the United States and other
countries.
PrimoPDF is a registered trademark of Nitro PDF, Inc.
31