1
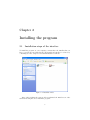
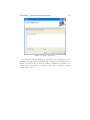
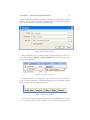
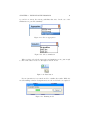
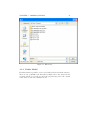
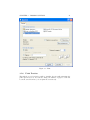
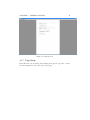
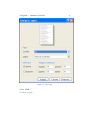
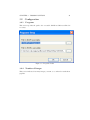
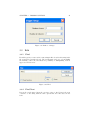
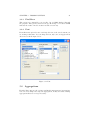
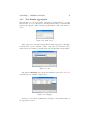
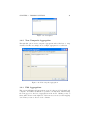
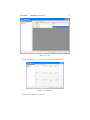
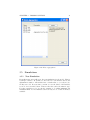
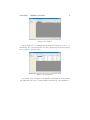
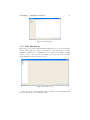
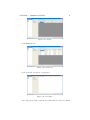
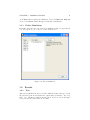
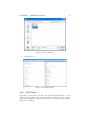
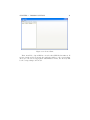
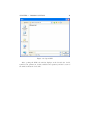
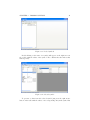
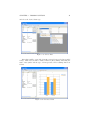
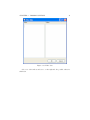
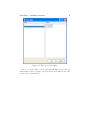
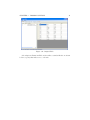
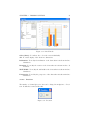
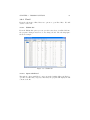
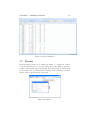
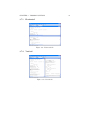
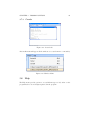
CHAPTER 3. PROGRAM OPTIONS
58
You can round from 0 to 6 digits or specify that you do not want rounding
choosing "MAX".
3.6.2.7
Save Template and Update Charts
After creating all the charts you need, you can save them as a template by
choosing File ! Save Template. This allows you to save all the generated charts
as images in the directory of the current simulation, and they can be seen in the
3.6.3.1Edit Listing section. It also saves the displayed tables. If there is a stored
template for a particular GDX, the next time you open the same GDX from a
different simulation, the application will load the same tables and generate the
same charts using data from the selected GDX.
Once created a template, as stated above, the charts will be updated from
the current simulation, but also you can create the same charts for the rest of
simulations with the option File ! Update All Charts. You can choose all the
generated templates (one for GDX) or select a specific one. As in the previous
case, the images can be viewed in Edit Listing.
The generated templates can be deleted from File ! Delete Template. You
can delete all at once or select one in particular.
3.6.3
Listings
Here’s the tool that provides Gsi to work with graphics. Usually the graphics
come as output from the implementation of the various models included in the
program. From here we operate with them in various ways.
3.6.3.1
Edit Listing
Clicking in Edit Listing appears to us a new window where we see at bottom
left of the images generated by the model in different executions. To the right
is a matrix where to place the images. In the case of the figure is two rows
and two columns, but can be changed at will using the dedicated controls for it.
At the top left are two more buttons: Search, which is responsible for tracing
images on another directory you want, and Open that is responsible for opening
images previously stored listings.
Figure 3.53: Start screen