1
22
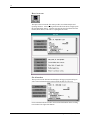
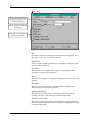
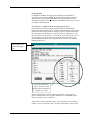
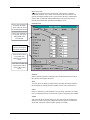
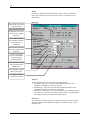
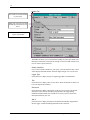
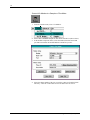
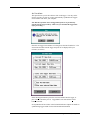
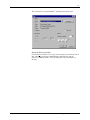
Misc. Tab
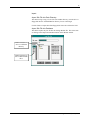
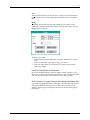
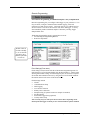
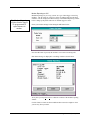
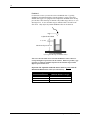
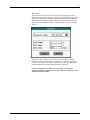
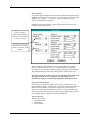
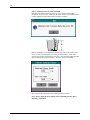
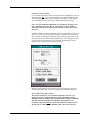
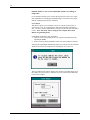
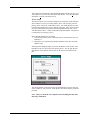
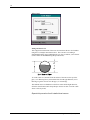
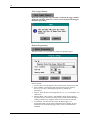
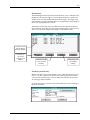
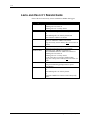
Use the site description from
the logger or type your own
title for the graph here.
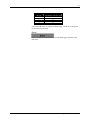
Choose original or edited data
for the graph.
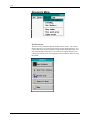
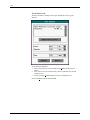
Items with an X will appear on
the graph if applicable.
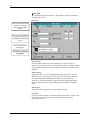
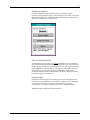
Title
By default, InSight will use the logger site description for the graph title. You
may, however, type your own title in the title box.
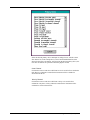
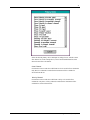
Data Source
Choose to display original or edited data for your graph by selecting the proper
choice from the pull down list
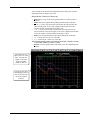
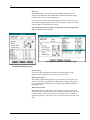
Grid Lines
When selected, vertical and horizontal grid lines will be displayed. When
deselected, no grid lines will be displayed.
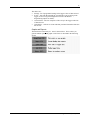
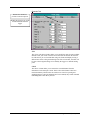
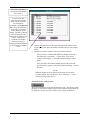
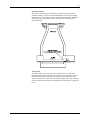
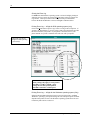
Site id
When selected, the logger’s site id number will displayed to the lower left of the
graph title.
File Name
When selected, the name of the site or database file being graphed will be
displayed to the lower right of the graph title.
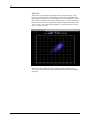
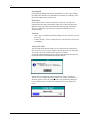
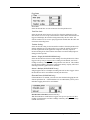
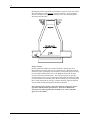
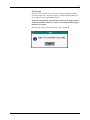
Samples (successful)
When selected, successful samples will be displayed as short lines on the
secondary axis of the graph if the logger recorded a sample history.
Samples (unsuccessful)
When selected, unsuccessful samples will be displayed as slightly longer lines
than the successful samples lines on the secondary axis of the graph if the logger
recorded a sample history.
AS041 Rev. 10-1-99
InSight Data Analysis Software