1
Agilent
Feature Extraction 12.0
Reference Guide
For Research Use Only. Not for use in diagnostic
procedures.
Agilent Technologies
Notices
© Agilent Technologies, Inc. 2015
Warranty
No part of this manual may be reproduced in
any form or by any means (including electronic storage and retrieval or translation
into a foreign language) without prior agreement and written consent from Agilent
Technologies, Inc. as governed by United
States and international copyright laws.
The material contained in this document is provided “as is,” and is subject to being changed, without notice,
in future editions. Further, to the maximum extent permitted by applicable
law, Agilent disclaims all warranties,
either express or implied, with regard
to this manual and any information
contained herein, including but not
limited to the implied warranties of
merchantability and fitness for a particular purpose. Agilent shall not be
liable for errors or for incidental or
consequential damages in connection with the furnishing, use, or performance of this document or of any
information contained herein. Should
Agilent and the user have a separate
written agreement with warranty
terms covering the material in this
document that conflict with these
terms, the warranty terms in the separate agreement shall control.
Edition
G4460-90052
Revision A2, August 2015
Printed in USA
Agilent Technologies, Inc.
5301 Stevens Creek Blvd.
Santa Clara, CA 95051
Agilent Recognized
Trademarks
Microsoft® is a U.S. registered trademark
of Microsoft Corporation.
Windows NT® is a U.S. registered trademark of Microsoft Corporation.
Windows® and MS Windows® are U.S.
registered trademarks of Microsoft Corporation.
Patents
Portions of this product may be covered
under US patent 6571005 licensed from the
Regents of the University of California.
2
Technology Licenses
The hardware and/or software described in
this document are furnished under a license
and may be used or copied only in accordance with the terms of such license.
Restricted Rights Legend
U.S. Government Restricted Rights. Software and technical data rights granted to
the federal government include only those
rights customarily provided to end user customers. Agilent provides this customary
commercial license in Software and technical data pursuant to FAR 12.211 (Technical
Data) and 12.212 (Computer Software) and,
for the Department of Defense, DFARS
252.227-7015 (Technical Data - Commercial
Items) and DFARS 227.7202-3 (Rights in
Commercial Computer Software or Computer Software Documentation).
Safety Notices
CAUTION
A CAUTION notice denotes a hazard. It calls attention to an operating procedure, practice, or the like
that, if not correctly performed or
adhered to, could result in damage
to the product or loss of important
data. Do not proceed beyond a
CAUTION notice until the indicated
conditions are fully understood and
met.
WAR NING
A WARNING notice denotes a
hazard. It calls attention to an
operating procedure, practice, or
the like that, if not correctly performed or adhered to, could result
in personal injury or death. Do not
proceed beyond a WARNING
notice until the indicated conditions are fully understood and
met.
Feature Extraction Reference Guide
In This Guide…
This Reference Guide contains tables that list default
parameter values and results for Feature Extraction
analyses, and explanations of how Feature Extraction uses
its algorithms to calculate results.
1
Protocol Default Settings
This chapter includes tables that list the default parameter
values found in the protocols shipped with the software
(Agilent 2-color gene expression (GE), 1-color GE, CGH,
ChIP, miRNA and non-Agilent protocols).
2
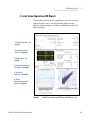
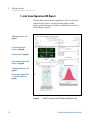
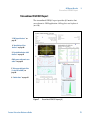
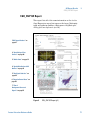
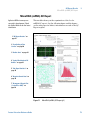
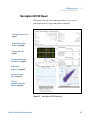
QC Report Results
Learn how to read and interpret the QC Reports.
3
Text File Parameters and Results
This chapter contains a listing of parameters and results
within the text file produced after Feature Extraction.
4
XML (MAGE-ML) Results
Refer to this chapter to find the results contained in the
MAGE-ML files generated after Feature Extraction.
5
How Algorithms Calculate Results
Learn how Feature Extraction algorithms calculate the
results that help you interpret your gene expression (2-color
and 1-color), CGH, ChIP and miRNA experiments.
6
Command Line Feature Extraction
This chapter contains the commands and arguments to
integrate Feature Extraction into a completely automated
workflow.
Feature Extraction Reference Guide
3
Acknowledgments
Apache acknowledgment
Part of this software is based on the Xerces XML parser,
Copyright (c) 1999-2000 The Apache Software Foundation.
All Rights Reserved (www.apache.org).
JPEG acknowledgment
This software is based in part on the work of the
Independent JPEG Group. Copyright (c) 1991-1998, Thomas
G. Lane. All Rights Reserved.
Loess/Netlib acknowledgment
Part of this software is based on a Loess/Lowess algorithm
and implementation. The authors of Loess/Lowess are
Cleveland, Grosse and Shyu. Copyright (c) 1989, 1992 by
AT&T. Permission to use, copy, modify and distribute this
software for any purpose without fee is hereby granted,
provided that this entire notice in included in all copies of
any software which is or includes a copy or modification of
this software and in all copies of the supporting
documentation for such software.
THIS SOFTWARE IS BEING PROVIDED “AS IS”, WITHOUT
ANY EXPRESS OR IMPLIED WARRANTY. NEITHER THE
AUTHORS NOR AT&T MAKE ANY REPRESENTATION OR
WARRANTY OF ANY KIND CONCERNING THE
MERCHANTABILITY OF THIS SOFTWARE OR ITS FITNESS
FOR ANY PARTICULAR PURPOSE.
Stanford University School of Medicine acknowledgment
Non-Agilent microarray image courtesy of Dr. Roger Wagner,
Division of Cardiovascular Medicine, Stanford University
School of Medicine
Ultimate Grid acknowledgment
This software contains material that is Copyright (c)
1994-1999 DUNDAS SOFTWARE LTD., All Rights Reserved.
4
Feature Extraction Reference Guide
LibTiff acknowledgement
Part of this software is based upon LibTIFF version 3.8.0.
Copyright (c) 1988-1997 Sam Leffler
Copyright (c) 1991-1997 Silicon Graphics, Inc.
Permission to use, copy, modify, distribute, and sell this
software and its documentation for any purpose is hereby
granted without fee, provided that (i) the above copyright
notices and this permission notice appear in all copies of
the software and related documentation, and (ii) the names
of Sam Leffler and Silicon Graphics may not be used in any
advertising or publicity relating to the software without the
specific, prior written permission of Sam Leffler and Silicon
Graphics.
THE SOFTWARE IS PROVIDED “AS-IS” AND WITHOUT
WARRANTY OF ANY KIND, EXPRESS, IMPLIED OR
OTHERWISE, INCLUDING WITHOUT LIMITATION, ANY
WARRANTY OF MERCHANTABILITY OR FITNESS FOR A
PARTICULAR PURPOSE.
IN NO EVENT SHALL SAM LEFFLER OR SILICON
GRAPHICS BE LIABLE FOR ANY SPECIAL, INCIDENTAL,
INDIRECT OR CONSEQUENTIAL DAMAGES OF ANY KIND,
OR ANY DAMAGES WHATSOEVER RESULTING FROM LOSS
OF USE, DATA OR PROFITS, WHETHER OR NOT ADVISED
OF THE POSSIBILITY OF DAMAGE, AND ON ANY THEORY
OF LIABILITY, ARISING OUT OF OR IN CONNECTION WITH
THE USE OR PERFORMANCE OF THIS SOFTWARE.
Feature Extraction Reference Guide
5
6
Feature Extraction Reference Guide
Content
1
Default Protocol Settings
13
Default Protocol Settings—an Introduction 14
Differences between CGH and gene expression microarrays
Hidden Settings 15
Tables of Default Protocol Settings
CGH_1200_Jun14 16
ChIP_1200_Jun14 23
GE1_1200_Jun14 30
GE2_1200_Jun14 36
GE2-NonAT_1100_Jul11 43
miRNA_1200_Jun14 48
16
Differences in Protocol Settings Based on Each Step 55
Place Grid 56
Optimize Grid fit 57
Find spots 58
Flag outliers 59
Compute Bkgd, Bias and Error 61
Correct Dye Biases 64
Compute ratios, calculate metrics, and generate results
2
QC Report Results
15
65
67
QC Reports 68
2-color Gene Expression QC Report 69
1-color Gene Expression QC Report 72
Streamlined CGH QC Report 75
CGH_ChIP QC Report 77
MicroRNA (miRNA) QC Report 79
Non-Agilent GE2 QC Report 81
QC reports with metric sets added 83
Feature Extraction Reference Guide
7
Contents
QC Report Headers 87
2-color Gene Expression QC Report 87
1-color Gene Expression QC Report 88
Streamlined CGH QC Report 88
CGH_ChIP QC Report 88
MicroRNA (miRNA) QC Report 89
Non-Agilent 2-color gene expression QC Report
89
Feature Statistics 90
Spot finding of Four Corners 90
Outlier Stats 91
Spatial Distribution of All Outliers 91
Net Signal Statistics 93
Negative Control Stats 94
Plot of Background-Corrected Signals 95
Histogram of Signals Plot (1-color GE or CGH) 96
Local Background Inliers 97
Foreground Surface Fit 97
Multiplicative Surface Fit 99
Spatial Distribution of Significantly Up-Regulated and Down-Regulated
Features (Positive and Negative Log Ratios) 100
Plot of LogRatio vs. Log ProcessedSignal 101
Spatial Distribution of Median Signals for each Row and Column 102
Histogram of LogRatio plot 103
Inter-Feature Statistics 104
Reproducibility Statistics (%CV Replicated Probes) 104
Microarray Uniformity (2-color only) 106
Sensitivity 107
Reproducibility Plots
108
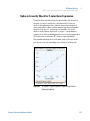
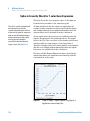
Spike-in Signal Statistics 111
Spike-in Linearity Check for 2-color Gene Expression 113
Spike-in Linearity Check for 1-color Gene Expression 114
QC Report Results in the FEPARAMS and Stats Tables
8
121
Feature Extraction Reference Guide
Contents
QC Metric Set Results 122
CGH_QCMT_Jun14 122
ChIP_QCMT_Jun14 123
GE1_QCMT_Jun14 123
GE2_QCMT_Jun14 124
miRNA_QCMT_Jun14 124
Metric Evaluation Logic 125
3
Text File Parameters and Results
127
Parameters/options (FEPARAMS) 129
FULL FEPARAMS Table 129
COMPACT FEPARAMS Table 150
QC FEPARAMS Table 153
MINIMAL FEPARAMS Table 156
Statistical results (STATS) 159
STATS Table (ALL text output types)
Feature results (FEATURES) 178
FULL Features Table 178
COMPACT Features Table 189
QC Features Table 194
MINIMAL Features Table 200
Other text result file annotations
4
MAGE-ML (XML) File Results
159
204
205
How Agilent output file formats are used by databases
MAGE-ML results 207
Differences between MAGE-ML and text result files
Full and Compact Output Packages 207
Tables for Full Output Package 208
Table for Compact Output Package 216
Helpful hints for transferring Agilent output files
Feature Extraction Reference Guide
206
207
220
9
Contents
XML output
TIFF Results
5
220
222
How Algorithms Calculate Results
223
Overview of Feature Extraction algorithms 224
Algorithms and functions they perform 224
Algorithms and results they produce 230
XDR Extraction Process 234
What is XDR scanning? 234
XDR Feature Extraction process 234
How the XDR algorithm works 236
Troubleshooting the XDR extraction 237
How each algorithm calculates a result 238
Place Grid 238
Optimize Grid Fit 241
Find Spots 241
Flag Outliers 248
Compute Bkgd, Bias and Error 254
Correct Dye Biases 274
Compute Ratios 278
Calculate Metrics 280
MicroRNA Analysis 283
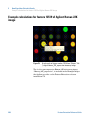
Example calculations for feature 12519 of Agilent Human 22K image
Data from the FEPARAMS table 291
Data from the STATS Table 291
Data from the FEATURES Table 291
6
Command Line Feature Extraction
290
297
Commands 299
Command line syntax 299
Commands and arguments 300
10
Feature Extraction Reference Guide
Contents
Return Codes
Extraction Input
305
307
Extraction Results 312
Status information 312
Examples of status information 313
Error codes from XML file 315
Warning codes from XML file 319
Index
325
Feature Extraction Reference Guide
11
Contents
12
Feature Extraction Reference Guide
Agilent Feature Extraction 12.0
Reference Guide
1
Default Protocol Settings
Default Protocol Settings—an Introduction 14
Tables of Default Protocol Settings 16
Differences in Protocol Settings Based on Each Step 55
See the Feature Extraction 12.0
User Guide to learn the purpose of
all the parameters and settings and
how to modify them.
When a protocol is assigned to an extraction set, the
software loads a set of protocol parameter values and
settings that affect the process and results for Feature
Extraction.
Agilent protocols are meant for use
with Agilent microarrays scanned
with an Agilent scanner. They are
intended for use with arrays that
use Agilent default lab procedures
(label, hybridization, wash, and
scanning methods). The
non-Agilent protocol is meant for
use with non-Agilent microarrays
that are scanned with an Agilent
scanner.
Parameter values in the protocol depend on the microarray
type and your experiment. The following pages list the
default settings for each of the protocol templates shipped or
downloaded with the software. Each protocol template
represents a different microarray type. You can display these
settings and values when you open the Protocol Editor for
each of the protocol templates.
Agilent Technologies
13
1
Default Protocol Settings
Default Protocol Settings—an Introduction
Default Protocol Settings—an Introduction
To learn more about changing the
default values for the protocols,
see the Feature Extraction 12.0
User Guide.
This chapter presents tables for display of the default
settings for each protocol. Parameter values depend on:
• microarray type
• lab protocol
• formats
• scanner used
To learn about the naming of the
protocol templates, see the Feature
Extraction 12.0 User Guide.
Listed in the following table are the names of the
nonremovable protocols and where you can find the tables
that list their default values.
Agilent provides new and updated
protocols on the eArray Web site. If
you set up an eArray login in
Feature Extraction, the software
can automatically download and
install protocol updates from
eArray. See the Feature Extraction
12.0 User Guide for more details.
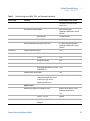
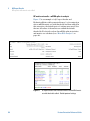
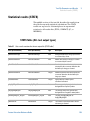
Table 1
14
Location of protocol template default settings
Protocol Template name
Location in chapter
CGH_1200_Jun14
page 16
ChIP_1200_Jun14
page 23
GE1_1200_Jun14
page 30
GE2_1200_Jun14
page 36
GE2-NonAT_1100_Jul11
page 43
miRNA_1200_Jun14
page 48
Feature Extraction Reference Guide
Default Protocol Settings
Differences between CGH and gene expression microarrays
1
Differences between CGH and gene expression microarrays
To see the differences in some
default settings between protocols,
go to “GE2_1200_Jun14” on
page 36.
CGH microarrays possess a different negative control
sequence scheme than the gene expression microarrays. The
gene expression microarrays have many replicate negative
control features using only one sequence. The CGH
microarrays have many sequences of negative controls that
span the range of sequence variability seen in the biological
probes used on the microarrays. This difference in the
control grid (especially the multiple sequences used for
negative controls) leads to a difference in protocol settings.
Hidden Settings
To create a protocol for a specific type of microarray, you
are required to use an Agilent-created protocol or
user-created protocol for the same type of microarray.
CA U T I O N
Protocol templates provide both visible and hidden settings whose
values are specific to the type or format of microarrays. Although you
can change the visible settings so that any two protocols of different
type appear identical, you cannot change the hidden settings that
distinguish these protocols from one another.
The “Tables of Default Protocol Settings” show only the
default visible parameter values for the steps of the protocol.
You can see the hidden parameters in the FE PARAMS table.
See “Parameters/options (FEPARAMS)” on page 129. Many of
these hidden parameters are image-processing ones that are
chosen using the “Automatically Determine” function.
Feature Extraction Reference Guide
15
1
Default Protocol Settings
Tables of Default Protocol Settings
Tables of Default Protocol Settings
CA U T I O N
These protocol settings may not be optimum for non-Agilent
microarrays or Agilent microarrays processed with non-Agilent
procedures. You determine the settings and values that are optimum
for your system.
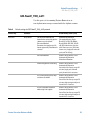
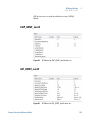
CGH_1200_Jun14
This protocol is a CGH protocol for use with the
Oligonucleotide Array-Based CGH for Genomic DNA
Analysis (Enzymatic User Manual version 6.1 or higher, ULS
User Manual version 3.1 or higher).
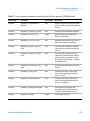
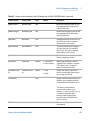
Table 2
Default settings for CGH_1200_Jun14 protocol
Protocol step
Parameter
Place Grid
Array Format
Default Setting/Value (v12.0)
For any format automatically
determined or selected by you, the
software uses the default
Placement Method.
Parameters that apply to specific
formats appear only if that format is
selected.
Placement Method
Automatically Determine
[Recognized formats: Single
Density (11k, 22k), 25k, Double
Density (44k), 95k, 185k, 185k 10
uM, 65-micron feature size (also
with 10-micron scans), 30-micron
feature size single pack and multi
pack, and Third Party]
Hidden if Array Format is set to
Automatically Determine.
Allow Some Distortion (All formats)
Enable Background Peak Shifting
Hidden if Array Format is set to
Automatically Determine.
Set to False for all arrays except 30
microns single pack and multi pack,
for which it is set to True.
16
Feature Extraction Reference Guide
Default Protocol Settings
CGH_1200_Jun14
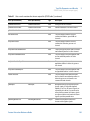
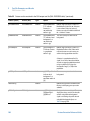
Table 2
1
Default settings for CGH_1200_Jun14 protocol (continued)
Protocol step
Parameter
Default Setting/Value (v12.0)
Use central part of pack for slope
and skew calculation?
Hidden if Array Format is set to
Automatically Determine.
Set to False for all arrays except 30
microns single pack and multi pack,
for which it is set to True.
Use the correlation method to
obtain origin X of subgrids
Hidden if Array Format is set to
Automatically Determine.
Set to False for all arrays except 30
microns single pack and multi pack,
for which it is set to True.
Optimize Grid Fit
Grid Format
The parameters and values for
optimizing the grid differ depending
on the format.
Automatically Determine
Iteratively Adjust Corners?
Hidden if Array Format is set to
Automatically Determine.
[Recognized formats: 65-micron
feature size, 30-micron feature size,
and Third Party]
True (All Formats, except Third
Party)
False (Third Party)
Adjustment Threshold
Hidden if Array Format is set to
Automatically Determine.
0.300 (All Formats, except Third
Party)
Maximum Number of Iterations
Hidden if Array Format is set to
Automatically Determine.
5 (All Formats, except Third Party)
Found Spot Threshold
Hidden if Array Format is set to
Automatically Determine.
0.200 (All Formats, except Third
Party)
Number of Corner Feature Side
Dimension?
Hidden if Array Format is set to
Automatically Determine.
20 (All Formats, except Third Party)
Feature Extraction Reference Guide
17
1
Default Protocol Settings
CGH_1200_Jun14
Table 2
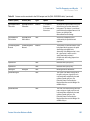
Default settings for CGH_1200_Jun14 protocol (continued)
Protocol step
Parameter
Find Spots
Spot Format
Default Setting/Value (v12.0)
Depending on the format selected
by the software or by you, the
default settings for this step
change. See the following rows for
the default values for finding spots.
Automatically Determine
Use the Nominal Diameter from the
Grid Template
Hidden if Array Format is set to
Automatically Determine.
[Recognized formats: Single
Density (11k, 22k), 25k, Double
Density (44k), 95k, 185k, 185k 10
uM, 244k 10uM, 65-micron feature
size, 30-micron feature size, and
Third Party]
True (All Formats)
Spot Deviation Limit
Hidden if Array Format is set to
Automatically Determine.
8.0 for all formats except for third
party, for which it is set to 1.5
Calculation of Spot Statistics
Method
Hidden if Array Format is set to
Automatically Determine.
Use Cookie (All Formats)
Cookie Percentage
Hidden if Array Format is set to
Automatically Determine.
0.650 (Single Density, 25k)
0.561 (Double Density, 95k)
0.700 (185k, 185k 10 uM, 244k 10
uM, 65-micron feature size)
0.750 (30-micron feature size)
Exclusion Zone Percentage
Hidden if Array Format is set to
Automatically Determine.
1.200 (All Formats except 30-micron
feature size)
1.300 (30-micron feature size)
Auto Estimate the Local Radius
Hidden if Array Format is set to
Automatically Determine.
True (Single Density, Double
Density, 25k, 95k)
18
Feature Extraction Reference Guide
Default Protocol Settings
CGH_1200_Jun14
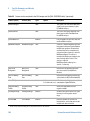
Table 2
1
Default settings for CGH_1200_Jun14 protocol (continued)
Protocol step
Parameter
Default Setting/Value (v12.0)
False (185k, 185k 10uM, 65-micron
feature size, 30-micron feature size,
244k 10uM)
LocalBGRadius
Hidden if Array Format is set to
Automatically Determine.
100 (when False for 185k, 185k
10uM, 65-micron feature size, 244k
10 uM)
150 (when False for 30-micron
feature size)
Pixel Outlier Rejection Method
Flag Outliers
Inter Quartile Region
(Automatically Determine and All
Formats)
RejectIQRFeat
1.42 (All Formats)
RejectIQRBG
1.42 (All Formats)
Statistical Method for Spot Values from Pixels
Use Mean/Standard Deviation
(Automatically Determine and All
Formats)
Compute Population Outliers
True
Minimum Population
10
IQRatio
1.42
Background IQRatio
1.42
Use Qtest for Small Populations?
True
Report Population Outliers as Failed
in MAGEML file
False
Compute Non Uniform Outliers
True
Scanner
Automatically Determine
Feature Extraction Reference Guide
The values for the parameters
change depending on the scanner
used for the image. See the
following for differences.
19
1
Default Protocol Settings
CGH_1200_Jun14
Table 2
Default settings for CGH_1200_Jun14 protocol (continued)
Protocol step
Parameter
Default Setting/Value (v12.0)
Agilent scanner
Automatically Compute OL Polynomial Terms
Hidden if Array Format is set to
Automatically Determine.
True
Compute Bkgd, Bias and
Error
Feature – (%CV)^2
0.04000
Red Poissonian Noise Term
Multiplier
5
Red Signal Constant Term
Multiplier
1
Green Poissonian Noise Term
Multiplier
5
Green Signal Constant Term
Multiplier
1
Background – (%CV)^2
0.09000
Red Poissonian Noise Term
Multiplier
3
Red Background Constant Term
Multiplier
1
Green Poissonian Noise Term
Multiplier
3
Green Background Constant Term
Multiplier
1
Background Subtraction Method
No Background Subtraction
Significance (for IsPosAndSignif and IsWellAboveBG)
Use Error Model for Significance
2-sided t-test of feature vs.
background max p-value
0.01
WellAboveMulti
13
Signal Correction—Calculate Surface Fit (required for
Spatial Detrend)
20
True
Feature Extraction Reference Guide
Default Protocol Settings
CGH_1200_Jun14
Table 2
1
Default settings for CGH_1200_Jun14 protocol (continued)
Protocol step
Correct Dye Biases
Parameter
Default Setting/Value (v12.0)
Feature Set for Surface Fit
OnlyNegativeControlFeatures
Perform Filtering for Surface Fit
False
Perform Spatial Detrending
True
Signal Correction—Adjust Background Globally
False
Signal Correction—Perform Multiplicative Detrending
True
Detrend on Replicates Only
False
Filter Low signal probes from Fit?
True
Neg. Ctrl. Threshold Mult. Detrend
Factor
3
Perform Filtering for Fit
Use Window Average
Use polynomial data fit instead of
LOESS?
True
Polynomial Multiplicative
DetrendDegree
4
Robust Neg Ctrl Stats?
True
Choose universal error, or most conservative
Most Conservative
MultErrorGreen
0.1000
MultErrorRed
0.1000
Auto Estimate Add Error Red
True
Auto Estimate Add Error Green
True
Use Surrogates
True
Use Dye Norm List
Automatically Determine
Dye Normalization Probe Selection Method
Use Rank Consistent Probes
Feature Extraction Reference Guide
Rank Tolerance
0.050
Variable Rank Tolerance
False
21
1
Default Protocol Settings
CGH_1200_Jun14
Table 2
Default settings for CGH_1200_Jun14 protocol (continued)
Protocol step
Parameter
Default Setting/Value (v12.0)
Omit Background Population Outliers
False
Allow Positive and Negative Controls
False
Signal Characteristics
OnlyPositiveAndSignificantSignals
Normalization Correction Method
Linear
Max Number Ranked Probes
-1
Compute Ratios
Peg Log Ratio Value
4.00
Calculate Metrics
Spikein Target Used
False
Min Population for Replicate Stats?
3
Grid Test Format
Automatically Determine
Recognized formats: 60 micron and
30 micron feature size, third party
Generate Results
22
PValue for Differential Expression
0.010000
Percentile Value
75.00
Type of QC Report
Streamlined CGH
Generate Single Text File
True
JPEG Down Sample Factor
4
Feature Extraction Reference Guide
Default Protocol Settings
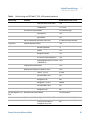
ChIP_1200_Jun14
1
ChIP_1200_Jun14
This protocol is a ChIP protocol for use with Agilent
Mammalian ChIP-on-Chip and DNA methylation applications.
Table 3
Default settings for ChIP_1200_Jun14 protocol
Protocol step
Parameter
Place Grid
Array Format
Default Setting/Value (v12.0)
For any format automatically
determined or selected by you, the
software uses the default
Placement Method.
Parameters that apply to specific
formats appear only if that format is
selected.
Placement Method
Automatically Determine
[Recognized formats: Single
Density (11k, 22k), 25k, Double
Density (44k), 95k, 185k, 185k 10
uM, 65-micron feature size (also
with 10-micron scans), 30-micron
feature size (single pack and multi
pack) and Third Party]
Hidden if Array Format is set to
Automatically Determine.
Allow Some Distortion (All formats)
Enable Background Peak Shifting
Hidden if Array Format is set to
Automatically Determine.
Set to false for all arrays except 30
microns (single pack and multi
pack), for which it is set to true.
Use central part of pack for slope
and skew calculation?
Hidden if Array Format is set to
Automatically Determine.
Set to False for all arrays except 30
microns single pack and multi pack,
for which it is set to True.
Use the correlation method to
obtain origin X of subgrids
Hidden if Array Format is set to
Automatically Determine.
Set to False for all arrays except 30
microns single pack and multi pack,
for which it is set to True.
Optimize Grid Fit
Grid Format
Feature Extraction Reference Guide
The parameters and values for
optimizing the grid differ depending
on the format.
Automatically Determine
[Recognized formats: 65-micron
feature size, 30-micron feature size,
and Third Party]
23
1
Default Protocol Settings
ChIP_1200_Jun14
Table 3
Default settings for ChIP_1200_Jun14 protocol (continued)
Protocol step
Parameter
Default Setting/Value (v12.0)
Iteratively Adjust Corners?
Hidden if Array Format is set to
Automatically Determine.
True (All Formats, except Third
Party)
False (Third Party)
Adjustment Threshold
Hidden if Array Format is set to
Automatically Determine.
0.300(All Formats, except Third
Party)
Maximum Number of Iterations
Hidden if Array Format is set to
Automatically Determine.
5 (All Formats, except Third Party)
Found Spot Threshold
Hidden if Array Format is set to
Automatically Determine.
0.200 (All Formats, except Third
Party)
Number of Corner Feature Side
Dimension?
Hidden if Array Format is set to
Automatically Determine.
20 (All Formats, except Third Party)
Find Spots
Spot Format
Depending on the format selected
by the software or by you, the
default settings for this step
change. See the following rows for
the default values for finding spots.
Automatically Determine
Use the Nominal Diameter from the
Grid Template
Hidden if Array Format is set to
Automatically Determine.
[Recognized formats: same as
those listed above except 244k
10uM replaces 65-micron feature
size 10-micron scans]
True (All Formats)
Spot Deviation Limit
Hidden if Array Format is set to
Automatically Determine.
8.0 for all formats except for third
party, for which it is set to 1.5
24
Feature Extraction Reference Guide
Default Protocol Settings
ChIP_1200_Jun14
Table 3
1
Default settings for ChIP_1200_Jun14 protocol (continued)
Protocol step
Parameter
Default Setting/Value (v12.0)
Calculation of Spot Statistics
Method
Hidden if Array Format is set to
Automatically Determine.
Use Cookie (All Formats)
Cookie Percentage
Hidden if Array Format is set to
Automatically Determine.
0.650 (Single Density, 25k)
0.561 (Double Density, 95k)
0.700 (185k, 185k 10 uM, 244k 10
uM, 65-micron feature size)
0.750 (30-micron feature size)
Exclusion Zone Percentage
Hidden if Array Format is set to
Automatically Determine.
1.200 (All Formats except 30-micron
feature size)
1.300 (30-micron feature size)
Auto Estimate the Local Radius
Hidden if Array Format is set to
Automatically Determine.
True (Single Density, Double
Density, 25k, 95k)
False (185k, 185k 10uM, 65-micron
feature size, 30-micron feature size,
244k 10uM)
LocalBGRadius
Hidden if Array Format is set to
Automatically Determine.
100 (when False for 185k, 185k
10uM, 65-micron feature size, 244k
10 uM)
150 (when False for 30-micron
feature size)
Pixel Outlier Rejection Method
Feature Extraction Reference Guide
Inter Quartile Region
(Automatically Determine and All
Formats)
25
1
Default Protocol Settings
ChIP_1200_Jun14
Table 3
Default settings for ChIP_1200_Jun14 protocol (continued)
Protocol step
Flag Outliers
Parameter
Default Setting/Value (v12.0)
RejectIQRFeat
1.42 (All Formats)
RejectIQRBG
1.42 (All Formats)
Statistical Method for Spot Values from Pixels
Use Mean/Standard Deviation
(Automatically Determine and All
Formats)
Compute Population Outliers
True
Minimum Population
8
IQRatio
1.42
Background IQRatio
1.42
Use Qtest for Small Populations?
True
Report Population Outliers as Failed
in MAGEML file
False
Compute Non Uniform Outliers
True
Scanner
Automatically Determine
The values for the parameters
change depending on the scanner
used for the image. See the
following for differences.
Agilent scanner
Automatically Compute OL Polynomial Terms
Hidden if Array Format is set to
Automatically Determine.
True
26
Feature – (%CV)^2
0.04000
Red Poissonian Noise Term
Multiplier
5
Red Signal Constant Term
Multiplier
1
Green Poissonian Noise Term
Multiplier
5
Green Signal Constant Term
Multiplier
1
Feature Extraction Reference Guide
Default Protocol Settings
ChIP_1200_Jun14
Table 3
1
Default settings for ChIP_1200_Jun14 protocol (continued)
Protocol step
Compute Bkgd, Bias and
Error
Parameter
Default Setting/Value (v12.0)
Background – (%CV)^2
0.09000
Red Poissonian Noise Term
Multiplier
3
Red Background Constant Term
Multiplier
1
Green Poissonian Noise Term
Multiplier
3
Green Background Constant Term
Multiplier
1
Background Subtraction Method
No Background Subtraction
Significance (for IsPosAndSignif and IsWellAboveBG)
Use Error Model for Significance
2-sided t-test of feature vs.
background max p-value
0.01
WellAboveMulti
13
Signal Correction—Calculate Surface Fit (required for
Spatial Detrend)
True
Feature Set for Surface Fit
OnlyNegativeControlFeatures
Perform Filtering for Surface Fit
False
Perform Spatial Detrending
True
Signal Correction—Adjust Background Globally
False
Signal Correction—Perform Multiplicative Detrending
True
Feature Extraction Reference Guide
Detrend on Replicates Only
False
Filter Low signal probes from Fit?
True
Neg. Ctrl. Threshold Mult. Detrend
Factor
3
Perform Filtering for Fit
Use Window Average
Use polynomial data fit instead of
LOESS?
True
27
1
Default Protocol Settings
ChIP_1200_Jun14
Table 3
Default settings for ChIP_1200_Jun14 protocol (continued)
Protocol step
Parameter
Default Setting/Value (v12.0)
Polynomial Multiplicative
DetrendDegree
Correct Dye Biases
4
Robust Neg Ctrl Stats?
True
Choose universal error, or most conservative
Most Conservative
MultErrorGreen
0.1000
MultErrorRed
0.1000
Auto Estimate Add Error Red
True
Auto Estimate Add Error Green
True
Use Surrogates
True
Use Dye Norm List
Automatically Determine
Dye Normalization Probe Selection Method
Use Rank Consistent Probes
Rank Tolerance
0.050
Variable Rank Tolerance
False
Omit Background Population Outliers
False
Allow Positive and Negative Controls
False
Signal Characteristics
OnlyPositiveAndSignificantSignals
Normalization Correction Method
Linear
Max Number Ranked Probes
-1
Compute Ratios
Peg Log Ratio Value
4.00
Calculate Metrics
Spikein Target Used
False
Min Population for Replicate Stats?
3
Grid Test Format
Automatically Determine
Recognized formats: 60 micron and
30 micron feature size, third party
PValue for Differential Expression
28
0.010000
Feature Extraction Reference Guide
Default Protocol Settings
ChIP_1200_Jun14
Table 3
1
Default settings for ChIP_1200_Jun14 protocol (continued)
Protocol step
Generate Results
Parameter
Default Setting/Value (v12.0)
Percentile Value
75.00
Type of QC Report
CGH_ChIP
Generate Single Text File
True
JPEG Down Sample Factor
4
Feature Extraction Reference Guide
29
1
Default Protocol Settings
GE1_1200_Jun14
GE1_1200_Jun14
This protocol is a 1-color gene expression protocol for use
with the One-Color Microarray-Based Gene Expression
Analysis (Quick Amp Labeling) (lab protocol v5.7 or higher,
publication number G4140-90040 or G4140-90041 for Tecan
HS Pro Hybridization).
Table 4
Default settings for GE1_1200_Jun14 protocol
Protocol step
Parameter
Place Grid
Array Format
Default Setting/Value (v12.0)
For any format automatically
determined or selected by you, the
software uses the default
Placement Method.
Parameters that apply to specific
formats appear only if that format is
selected.
Placement Method
Automatically Determine
[Recognized formats: Single
Density (11k, 22k), 25k, Double
Density (44k), 95k, 185k, 185k 10
uM, 65-micron feature size (also
with 10-micron scans), 30-micron
feature size (single pack and multi
pack) and Third Party]
Hidden if Array Format is set to
Automatically Determine.
Allow Some Distortion (All formats)
Enable Background Peak Shifting
Hidden if Array Format is set to
Automatically Determine.
Set to false for all arrays except 30
microns (single pack and multi
pack), for which it is set to true.
Use central part of pack for slope
and skew calculation?
Hidden if Array Format is set to
Automatically Determine.
Set to False for all arrays except 30
microns single pack and multi pack,
for which it is set to True.
Use the correlation method to
obtain origin X of subgrids
Hidden if Array Format is set to
Automatically Determine.
Set to False for all arrays except 30
microns single pack and multi pack,
for which it is set to True.
30
Feature Extraction Reference Guide
Default Protocol Settings
GE1_1200_Jun14
Table 4
1
Default settings for GE1_1200_Jun14 protocol (continued)
Protocol step
Parameter
Optimize Grid Fit
Grid Format
Default Setting/Value (v12.0)
The parameters and values for
optimizing the grid differ depending
on the format,
Automatically Determine
Iteratively Adjust Corners?
Hidden if Array Format is set to
Automatically Determine.
[Recognized formats: 65-micron
feature size, 30-micron feature size,
and Third Party]
True (All Formats, except Third
Party)
False (Third Party)
Adjustment Threshold
Hidden if Array Format is set to
Automatically Determine.
0.300(All Formats, except Third
Party)
Maximum Number of Iterations
Hidden if Array Format is set to
Automatically Determine.
5 (All Formats, except Third Party)
Found Spot Threshold
Hidden if Array Format is set to
Automatically Determine.
0.200 (All Formats, except Third
Party)
Number of Corner Feature Side
Dimension?
Hidden if Array Format is set to
Automatically Determine.
20 (All Formats, except Third Party)
Find Spots
Spot Format
Depending on the format selected
by the software or by you, the
default settings for this step
change. See the following rows for
the default values for finding spots.
Automatically Determine
Use the Nominal Diameter from the
Grid Template
Hidden if Array Format is set to
Automatically Determine.
[Recognized formats: same as
those listed above except 244k
10uM replaces 65-micron feature
size 10-micron scans]
True (All Formats)
Feature Extraction Reference Guide
31
1
Default Protocol Settings
GE1_1200_Jun14
Table 4
Default settings for GE1_1200_Jun14 protocol (continued)
Protocol step
Parameter
Default Setting/Value (v12.0)
Spot Deviation Limit
Hidden if Array Format is set to
Automatically Determine.
8.0 for all formats except for third
party, for which it is set to 1.5
Calculation of Spot Statistics
Method
Hidden if Array Format is set to
Automatically Determine.
Use Cookie (All Formats)
Cookie Percentage
Hidden if Array Format is set to
Automatically Determine.
0.650 (Single Density, 25k)
0.561 (Double Density, 95k)
0.700 (185k, 185k 10 uM, 244k 10
uM, 65-micron feature size)
0.750 (30-micron feature size)
Exclusion Zone Percentage
Hidden if Array Format is set to
Automatically Determine.
1.200 (All Formats except 30-micron
feature size)
1.300 (30-micron feature size)
Auto Estimate the Local Radius
Hidden if Array Format is set to
Automatically Determine.
True (Single Density, Double
Density, 25k, 95k)
False (185k, 185k 10uM, 65-micron
feature size, 30-micron feature size,
244k 10uM)
LocalBGRadius
Hidden if Array Format is set to
Automatically Determine.
100 (when False for 185k, 185k
10uM, 65-micron feature size, 244k
10 uM)
32
Feature Extraction Reference Guide
Default Protocol Settings
GE1_1200_Jun14
Table 4
1
Default settings for GE1_1200_Jun14 protocol (continued)
Protocol step
Parameter
Default Setting/Value (v12.0)
150 (when False for 30-micron
feature size)
Pixel Outlier Rejection Method
Flag Outliers
Inter Quartile Region
(Automatically Determine and All
Formats)
RejectIQRFeat
1.42 (All Formats)
RejectIQRBG
1.42 (All Formats)
Statistical Method for Spot Values from Pixels
Use Mean/Standard Deviation
(Automatically Determine and All
Formats)
Compute Population Outliers
True
Minimum Population
10
IQRatio
1.42
Background IQRatio
1.42
Use Qtest for Small Populations?
True
Report Population Outliers as Failed
in MAGEML file
False
Compute Non Uniform Outliers
True
Scanner
Automatically Determine
The values for the parameters
change depending on the scanner
used for the image. See the
following for differences.
Agilent scanner
Automatically Compute OL Polynomial Terms
Hidden if Array Format is set to
Automatically Determine.
True
Feature Extraction Reference Guide
Feature – (%CV)^2
0.04000
Green Poissonian Noise Term
Multiplier
20
33
1
Default Protocol Settings
GE1_1200_Jun14
Table 4
Default settings for GE1_1200_Jun14 protocol (continued)
Protocol step
Compute Bkgd, Bias and
Error
Parameter
Default Setting/Value (v12.0)
Green Signal Constant Term
Multiplier
1
Background – (%CV)^2
0.09000
Green Poissonian Noise Term
Multiplier
3
Green Background Constant Term
Multiplier
1
Background Subtraction Method
No Background Subtraction
Significance (for IsPosAndSignif and IsWellAboveBG)
Use Error Model for Significance
2-sided t-test of feature vs.
background max p-value
0.01
WellAboveMulti
13
Signal Correction—Calculate Surface Fit (required for
Spatial Detrend)
34
True
Feature Set for Surface Fit
FeaturesInNegativeControlRange
Perform Filtering for Surface Fit
True
Perform Spatial Detrending
True
Signal Correction—Adjust Background Globally
False
Signal Correction—Perform Multiplicative Detrending
True
Detrend on Replicates Only
True
Filter Low signal probes from Fit?
True
Neg. Ctrl. Threshold Mult. Detrend
Factor
5
Perform Filtering for Fit
Use Window Average
Use polynomial data fit instead of
LOESS?
True
Polynomial Multiplicative
DetrendDegree
4
Feature Extraction Reference Guide
Default Protocol Settings
GE1_1200_Jun14
Table 4
1
Default settings for GE1_1200_Jun14 protocol (continued)
Protocol step
Calculate Metrics
Parameter
Default Setting/Value (v12.0)
Robust Neg Ctrl Stats?
False
Choose universal error, or most conservative
Most Conservative
MultErrorGreen
0.1000
Auto Estimate Add Error Green
True
Use Surrogates
True
Spikein Target Used
True
Min Population for Replicate Stats?
5
Grid Test Format
Automatically Determine
Recognized formats: 60 micron and
30 micron feature size, third party
Generate Results
PValue for Differential Expression
0.010000
Percentile Value
75.00
Type of QC Report
Gene Expression
Generate Single Text File
True
JPEG Down Sample Factor
4
Feature Extraction Reference Guide
35
1
Default Protocol Settings
GE2_1200_Jun14
GE2_1200_Jun14
This is a 2-color gene expression protocol for use with the
Two-color Microarray-Based Gene Expression Analysis
(Quick Amp Labeling) (lab protocol v5.7 or higher,
publication number G4140-90050 or G4140-90051 for Tecan
HS Pro Hybridization).
Table 5
Default settings for GE2_1200_Jun14 protocol
Protocol step
Parameter
Place Grid
Array Format
Default Setting/Value (v12.0)
For any format automatically
determined or selected by you, the
software uses the default
Placement Method.
Parameters that apply to specific
formats appear only if that format is
selected.
Placement Method
Automatically Determine
[Recognized formats: Single
Density (11k, 22k), 25k, Double
Density (44k), 95k, 185k, 185k 10
uM, 65-micron feature size (also
with 10-micron scans), 30-micron
feature size (single pack and multi
pack) and Third Party]
Hidden if Array Format is set to
Automatically Determine.
Allow Some Distortion (All formats)
Enable Background Peak Shifting
Hidden if Array Format is set to
Automatically Determine.
Set to false for all arrays except 30
microns (single pack and multi
pack), for which it is set to true.
Use central part of pack for slope
and skew calculation?
Hidden if Array Format is set to
Automatically Determine.
Set to False for all arrays except 30
microns single pack and multi pack,
for which it is set to True.
Use the correlation method to
obtain origin X of subgrids
Hidden if Array Format is set to
Automatically Determine.
Set to False for all arrays except 30
microns single pack and multi pack,
for which it is set to True.
36
Feature Extraction Reference Guide
Default Protocol Settings
GE2_1200_Jun14
Table 5
1
Default settings for GE2_1200_Jun14 protocol (continued)
Protocol step
Parameter
Optimize Grid Fit
Grid Format
Default Setting/Value (v12.0)
The parameters and values for
optimizing the grid differ depending
on the format.
Automatically Determine
Iteratively Adjust Corners?
Hidden if Array Format is set to
Automatically Determine.
[Recognized formats: 65-micron
feature size, 30-micron feature size,
and Third Party]
True (All Formats, except Third
Party)
False (Third Party)
Adjustment Threshold
Hidden if Array Format is set to
Automatically Determine.
0.300 (All Formats, except Third
Party)
Maximum Number of Iterations
Hidden if Array Format is set to
Automatically Determine.
5 (All Formats, except Third Party)
Found Spot Threshold
Hidden if Array Format is set to
Automatically Determine.
0.200 (All Formats, except Third
Party)
Number of Corner Feature Side
Dimension?
Hidden if Array Format is set to
Automatically Determine.
20 (All Formats, except Third Party)
Find Spots
Spot Format
Depending on the format selected
by the software or by you, the
default settings for this step
change. See the following rows for
the default values for finding spots.
Automatically Determine
Use the Nominal Diameter from the
Grid Template
Hidden if Array Format is set to
Automatically Determine.
[Recognized formats: same as
those listed above except 244k
10uM replaces 65-micron feature
size 10-micron scans]
True (All Formats)
Feature Extraction Reference Guide
37
1
Default Protocol Settings
GE2_1200_Jun14
Table 5
Default settings for GE2_1200_Jun14 protocol (continued)
Protocol step
Parameter
Default Setting/Value (v12.0)
Spot Deviation Limit
Hidden if Array Format is set to
Automatically Determine.
8.0 for all formats except for third
party, for which it is set to 1.5
Calculation of Spot Statistics
Method
Hidden if Array Format is set to
Automatically Determine.
Use Cookie (All Formats)
Cookie Percentage
Hidden if Array Format is set to
Automatically Determine.
0.650 (Single Density, 25k)
0.561 (Double Density, 95k)
0.700 (185k, 185k 10 uM, 244k 10
uM, 65-micron feature size)
0.750 (30-micron feature size)
Exclusion Zone Percentage
Hidden if Array Format is set to
Automatically Determine.
1.200 (All Formats except 30-micron
feature size)
1.300 (30-micron feature size)
Auto Estimate the Local Radius
Hidden if Array Format is set to
Automatically Determine.
True (Single Density, Double
Density, 25k, 95k)
False (185k, 185k 10uM, 65-micron
feature size, 30-micron feature size,
244k 10uM)
LocalBGRadius
Hidden if Array Format is set to
Automatically Determine.
100 (when False for 185k, 185k
10uM, 65-micron feature size, 244k
10 uM)
38
Feature Extraction Reference Guide
Default Protocol Settings
GE2_1200_Jun14
Table 5
1
Default settings for GE2_1200_Jun14 protocol (continued)
Protocol step
Parameter
Default Setting/Value (v12.0)
150 (when False for 30-micron
feature size)
Pixel Outlier Rejection Method
Flag Outliers
Inter Quartile Region
(Automatically Determine and All
Formats)
RejectIQRFeat
1.42 (All Formats)
RejectIQRBG
1.42 (All Formats)
Statistical Method for Spot Values from Pixels
Use Mean/Standard Deviation
(Automatically Determine and All
Formats)
Compute Population Outliers
True
Minimum Population
10
IQRatio
1.42
Background IQRatio
1.42
Use Qtest for Small Populations?
True
Report Population Outliers as Failed
in MAGEML file
False
Compute Non Uniform Outliers
True
Scanner
Automatically Determine
The values for the parameters
change depending on the scanner
used for the image. See the
following for differences.
Agilent scanner
Automatically Compute OL Polynomial Terms
Hidden if Array Format is set to
Automatically Determine.
True
Feature Extraction Reference Guide
Feature – (%CV)^2
0.04
Red Poissonian Noise Term
Multiplier
20
39
1
Default Protocol Settings
GE2_1200_Jun14
Table 5
Default settings for GE2_1200_Jun14 protocol (continued)
Protocol step
Compute Bkgd, Bias and
Error
Parameter
Default Setting/Value (v12.0)
Red Signal Constant Term
Multiplier
1
Green Poissonian Noise Term
Multiplier
20
Green Signal Constant Term
Multiplier
1
Background – (%CV)^2
0.09000
Red Poissonian Noise Term
Multiplier
3
Red Background Constant Term
Multiplier
1
Green Poissonian Noise Term
Multiplier
3
Green Background Constant Term
Multiplier
1
Background Subtraction Method
No Background Subtraction
Significance (for IsPosAndSignif and IsWellAboveBG)
Use Error Model for Significance
2-sided t-test of feature vs.
background max p-value
0.01
WellAboveMulti
13
Signal Correction—Calculate Surface Fit (required for
Spatial Detrend)
Feature Set for Surface Fit
FeaturesInNegativeControlRange
Perform Filtering for Surface Fit
True
Perform Spatial Detrending
True
Signal Correction—Adjust Background Globally
False
Signal Correction—Perform Multiplicative Detrending
True
Detrend on Replicates Only
40
True
True
Feature Extraction Reference Guide
Default Protocol Settings
GE2_1200_Jun14
Table 5
1
Default settings for GE2_1200_Jun14 protocol (continued)
Protocol step
Correct Dye Biases
Parameter
Default Setting/Value (v12.0)
Filter Low signal probes from Fit?
True
Neg. Ctrl. Threshold Mult. Detrend
Factor
5
Perform Filtering for Fit
Use Window Average
Robust Neg Ctrl Stats?
False
Choose universal error, or most conservative
Most Conservative
MultErrorGreen
0.1000
MultErrorRed
0.1000
Auto Estimate Add Error Red
True
Auto Estimate Add Error Green
True
Use Surrogates
True
Use Dye Norm List
Automatically Determine
Dye Normalization Probe Selection Method
Use Rank Consistent Probes
Rank Tolerance
0.050
Variable Rank Tolerance
False
Omit Background Population Outliers
False
Allow Positive and Negative Controls
False
Signal Characteristics
OnlyPositiveAndSignificantSignals
Normalization Correction Method
Linear and Lowess
Max Number Ranked Probes
8000
Compute Ratios
Peg Log Ratio Value
4.00
Calculate Metrics
Spikein Target Used
True
Min Population for Replicate Stats?
5
Feature Extraction Reference Guide
41
1
Default Protocol Settings
GE2_1200_Jun14
Table 5
Default settings for GE2_1200_Jun14 protocol (continued)
Protocol step
Parameter
Grid Test Format
Default Setting/Value (v12.0)
Automatically Determine
Recognized formats: 60 micron and
30 micron feature size, third party
Generate Results
42
PValue for Differential Expression
0.010000
Percentile Value
75.00
Type of QC Report
Gene Expression
Generate Single Text File
True
JPEG Down Sample Factor
4
Feature Extraction Reference Guide
Default Protocol Settings
GE2-NonAT_1100_Jul11
1
GE2-NonAT_1100_Jul11
Use this protocol for running Feature Extraction on
non-Agilent microarrays scanned with the Agilent scanner.
Table 6
Default settings for GE2-NonAT_1100_Jul11 protocol
Protocol step
Parameter
Place Grid
Array Format
Default Setting/Value (v12.0)
For any format automatically
determined or selected by you, the
software uses the default
Placement Method.
Parameters that apply to specific
formats appear only if that format is
selected.
Placement Method
Automatically Determine
[Recognized formats: Single
Density (11k, 22k), 25k, Double
Density (44k), 95k, 185k, 185k 10
uM, 65-micron feature size (also
with 10-micron scans), 30-micron
feature size (single pack and multi
pack) and Third Party]
Hidden if Array Format is set to
Automatically Determine.
Allow Some Distortion
Enable Background Peak Shifting
Hidden if Array Format is set to
Automatically Determine.
Set to false for all arrays except 30
microns (single pack and multi
pack), for which it is set to true.
Use central part of pack for slope
and skew calculation?
Hidden if Array Format is set to
Automatically Determine.
Set to False for all arrays except 30
microns single pack and multi pack,
for which it is set to True.
Use the correlation method to
obtain origin X of subgrids
Hidden if Array Format is set to
Automatically Determine.
Set to False for all arrays except 30
microns single pack and multi pack,
for which it is set to True.
Feature Extraction Reference Guide
43
1
Default Protocol Settings
GE2-NonAT_1100_Jul11
Table 6
Default settings for GE2-NonAT_1100_Jul11 protocol (continued)
Protocol step
Parameter
Optimize Grid Fit
Grid Format
Default Setting/Value (v12.0)
The parameters and values for
optimizing the grid differ depending
on the format.
Automatically Determine
Iteratively Adjust Corners?
Hidden if Array Format is set to
Automatically Determine.
[Recognized formats: 65-micron
feature size, 30-micron feature size,
and Third Party]
True (All Formats, except Third
Party)
False (Third Party)
Adjustment Threshold
Hidden if Array Format is set to
Automatically Determine.
0.300 (All Formats, except Third
Party)
Maximum Number of Iterations
Hidden if Array Format is set to
Automatically Determine.
5 (All Formats, except Third Party)
Found Spot Threshold
Hidden if Array Format is set to
Automatically Determine.
0.200 (All Formats, except Third
Party)
Number of Corner Feature Side
Dimension?
Hidden if Array Format is set to
Automatically Determine.
20 (All Formats, except Third Party)
Find Spots
44
Spot Format
Third Party
Use the Nominal Diameter from the
Grid Template
True
Spot Deviation Limit
1.50
Calculation of Spot Statistics
Method
Use Cookie
Cookie Percentage
1.000
Exclusion Zone Percentage
1.200
Feature Extraction Reference Guide
Default Protocol Settings
GE2-NonAT_1100_Jul11
Table 6
1
Default settings for GE2-NonAT_1100_Jul11 protocol (continued)
Protocol step
Parameter
Default Setting/Value (v12.0)
Auto Estimate the Local Radius
True
LocalBGRadius
127, if False
Pixel Outlier Rejection Method
Flag Outliers
Compute Bkgd, Bias and
Error
Inter Quartile Region
RejectIQRFeat
1.42
RejectIQRBG
1.42
Statistical Method for Spot Values from Pixels
Use Mean/Standard Deviation
Compute Population Outliers
True
Minimum Population
15
IQRatio
1.42
Background IQRatio
1.42
Use Qtest for Small Populations?
True
Report Population Outliers as Failed
in MAGEML file
False
Compute Non Uniform Outliers
True
Automatically Compute OL Polynomial Terms
False
Feature – (%CV)^2
0.11000
Poissonian Noise Term
320
Background Term
600
Background – (%CV)^2
0.09000
Poissonian Noise Term
320
Background Term
600
Background Subtraction Method
Local Background
Significance (for IsPosAndSignif and IsWellAboveBG)
Use Pixel Statistics for Significance
2-sided t-test of feature vs.
background max p-value
Feature Extraction Reference Guide
0.01
45
1
Default Protocol Settings
GE2-NonAT_1100_Jul11
Table 6
Default settings for GE2-NonAT_1100_Jul11 protocol (continued)
Protocol step
Parameter
Default Setting/Value (v12.0)
WellAboveMulti
Signal Correction—Calculate Surface Fit (required for
Spatial Detrend)
AllFeatureTypes
Perform Filtering for Surface Fit
True
Perform Spatial Detrending
False
Adjust Background Globally to:
46
True
Feature Set for Surface Fit
Signal Correction—Adjust Background Globally
Correct Dye Biases
2.6
True
0
Robust Neg Ctrl Stats?
False
Choose universal error, or most conservative
Most Conservative
MultErrorGreen
0.0900
MultErrorRed
0.0900
Auto Estimate Add Error Red
False
Additive Error Value Red
30
Auto Estimate Add Error Green
False
Additive Error Value Green
30
Use Surrogates
True
Use Dye Norm List
Automatically Determine
Dye Normalization Probe Selection Method
Use Rank Consistent Probes
Rank Tolerance
0.050
Variable Rank Tolerance
False
Omit Background Population Outliers
False
Allow Positive and Negative Controls
False
Signal Characteristics
OnlyPositiveAndSignificantSignals
Normalization Correction Method
Lowess Only
Feature Extraction Reference Guide
Default Protocol Settings
GE2-NonAT_1100_Jul11
Table 6
1
Default settings for GE2-NonAT_1100_Jul11 protocol (continued)
Protocol step
Parameter
Default Setting/Value (v12.0)
Max Number Ranked Probes
8000
Compute Ratios
Peg Log Ratio Value
4.00
Calculate Metrics
Spikein Target Used
False
Min Population for Replicate Stats?
5
PValue for Differential Expression
0.010000
Percentile Value
75.00
Generate Single Text File
True
JPEG Down Sample Factor
4
Generate Results
Feature Extraction Reference Guide
47
1
Default Protocol Settings
miRNA_1200_Jun14
miRNA_1200_Jun14
This protocol is a miRNA protocol for use with miRNA
Microarray System with miRNA Complete Labeling and
Hyb Kit (lab protocol v2.0 or higher, publication number
G4170-90011).
Table 7
Default settings for miRNA_1200_Jun14 protocol
Protocol step
Parameter
Place Grid
Array Format
Default Setting/Value (v12.0)
For any format automatically
determined or selected by you, the
software uses the default
Placement Method.
Parameters that apply only to
specific formats appear only if that
format is selected.
Placement Method
Automatically Determine
[Recognized formats: Single
Density (11k, 22k), 25k, Double
Density (44k), 95k, 185k, 185k 10
uM, 65-micron feature size (also
with 10-micron scans), 30-micron
feature size (single pack and multi
pack) and Third Party]
Hidden if Array Format is set to
Automatically Determine.
Allow Some Distortion (All formats)
Enable Background Peak Shifting
Hidden if Array Format is set to
Automatically Determine.
Set to false for all arrays except 30
microns (single pack and multi
pack), for which it is set to true.
Use central part of pack for slope
and skew calculation?
Hidden if Array Format is set to
Automatically Determine.
Set to False for all arrays except 30
microns single pack and multi pack,
for which it is set to True.
Use the correlation method to
obtain origin X of subgrids
Hidden if Array Format is set to
Automatically Determine.
Set to False for all arrays except 30
microns single pack and multi pack,
for which it is set to True.
48
Feature Extraction Reference Guide
Default Protocol Settings
miRNA_1200_Jun14
Table 7
1
Default settings for miRNA_1200_Jun14 protocol (continued)
Protocol step
Parameter
Optimize Grid Fit
Grid Format
Default Setting/Value (v12.0)
The parameters and values for
optimizing the grid differ depending
on the format.
Automatically Determine
Iteratively Adjust Corners?
Hidden if Array Format is set to
Automatically Determine.
[Recognized formats: 65-micron
feature size, 30-micron feature size,
and Third Party]
True (All Formats, except Third
Party)
False (Third Party)
Adjustment Threshold
Hidden if Array Format is set to
Automatically Determine.
0.300 (All Formats, except Third
Party)
Maximum Number of Iterations
Hidden if Array Format is set to
Automatically Determine.
5 (All Formats, except Third Party)
Found Spot Threshold
Hidden if Array Format is set to
Automatically Determine.
0.200 (All Formats, except Third
Party)
Number of Corner Feature Side
Dimension?
Hidden if Array Format is set to
Automatically Determine.
20 (All Formats, except Third Party)
Find Spots
Spot Format
Depending on the format selected
by the software or by you, the
default settings for this step
change. See the following rows for
the default values for finding spots.
Automatically Determine
Use the Nominal Diameter from the
Grid Template
Hidden if Array Format is set to
Automatically Determine.
[Recognized formats: same as
those listed above except 244k
10uM replaces 65-micron feature
size 10-micron scans]
True (All Formats)
Feature Extraction Reference Guide
49
1
Default Protocol Settings
miRNA_1200_Jun14
Table 7
Default settings for miRNA_1200_Jun14 protocol (continued)
Protocol step
Parameter
Default Setting/Value (v12.0)
Spot Deviation Limit
Hidden if Array Format is set to
Automatically Determine.
8.0 for all formats except for third
party, for which it is set to 1.5
Calculation of Spot Statistics
Method
Hidden if Array Format is set to
Automatically Determine.
Use Cookie (All Formats)
Cookie Percentage
Hidden if Array Format is set to
Automatically Determine.
0.650 (Single Density, 25k)
0.561 (Double Density, 95k)
0.700 (185k, 185k 10 uM, 244k 10
uM, 65-micron feature size)
0.750 (30-micron feature size)
Exclusion Zone Percentage
Hidden if Array Format is set to
Automatically Determine.
1.200 (All Formats except 30-micron
feature size)
1.300 (30-micron feature size)
Auto Estimate the Local Radius
Hidden if Array Format is set to
Automatically Determine.
True (Single Density, Double
Density, 25k, 95k)
False (185k, 185k 10uM, 65-micron
feature size, 30-micron feature size,
244k 10uM)
LocalBGRadius
Hidden if Array Format is set to
Automatically Determine.
100 (when False for 185k, 185k
10uM, 65-micron feature size, 244k
10 uM)
50
Feature Extraction Reference Guide
Default Protocol Settings
miRNA_1200_Jun14
Table 7
1
Default settings for miRNA_1200_Jun14 protocol (continued)
Protocol step
Parameter
Default Setting/Value (v12.0)
150 (when False for 30-micron
feature size)
Pixel Outlier Rejection Method
Flag Outliers
Inter Quartile Region
(Automatically Determine and All
Formats)
RejectIQRFeat
1.42 (All Formats)
RejectIQRBG
1.42 (All Formats)
Statistical Method for Spot Values from Pixels
Use Mean/Standard Deviation
(Automatically Determine and All
Formats)
Compute Population Outliers
True
Minimum Population
8
IQRatio
1.42
Background IQRatio
5.00
Use Qtest for Small Populations?
True
Report Population Outliers as Failed
in MAGEML file
False
Compute Non Uniform Outliers
True
Scanner
Automatically Determine
The values for the parameters
change depending on the scanner
used for the image. See the
following for differences.
Agilent scanner
Automatically Compute OL Polynomial Terms
Hidden if Array Format is set to
Automatically Determine.
True
Feature Extraction Reference Guide
Feature – (%CV)^2
0.04000
Red Poissonian Noise Term
Multiplier
20
51
1
Default Protocol Settings
miRNA_1200_Jun14
Table 7
Default settings for miRNA_1200_Jun14 protocol (continued)
Protocol step
Compute Bkgd, Bias and
Error
Parameter
Default Setting/Value (v12.0)
Red Signal Constant Term
Multiplier
1
Green Poissonian Noise Term
Multiplier
20
Green Signal Constant Term
Multiplier
1
Background – (%CV)^2
0.09000
Red Poissonian Noise Term
Multiplier
3
Red Background Constant Term
Multiplier
1
Green Poissonian Noise Term
Multiplier
3
Green Background Constant Term
Multiplier
1
Background Subtraction Method
No Background Subtraction
Significance (for IsPosAndSignif and IsWellAboveBG)
Use Error Model for Significance
2-sided t-test of feature vs.
background max p-value
0.01
WellAboveMulti
13
Background Method by Format
Min Feature Threshold for Metrics
2000
Calculate Surface Fit (required for
Spatial Detrend)
True
Feature Set for Surface Fit
FeaturesInNegativeControlRange
Perform Filtering for Surface Fit
True
Perform Spatial Detrending
True
Adjust Background Globally
52
244
False
Feature Extraction Reference Guide
Default Protocol Settings
miRNA_1200_Jun14
Table 7
1
Default settings for miRNA_1200_Jun14 protocol (continued)
Protocol step
microRNA Analysis
Parameter
Default Setting/Value (v12.0)
Perform Multiplicative Detrending
False
Robust Neg Ctrl Stats?
True
Choose universal error, or most conservative
Use Universal Error Model
MultErrorGreen
0.1000
MultErrorRed
0.1000
Auto Estimate Add Error Red
True
Auto Estimate Add Error Green
True
Use Surrogates
False
Output GeneView File
True
Analyze By Effective Feat size
True
Maximum Number of Features
10000
Minimum Number of Ratios
200
Low Signal Percentile
50.00
Is Gene Detected Multiplier
3.0
High Signal Percentile
90.00
Minimum Noise Multiplier
10.00
Throw away ratios greater than
1.50
Is Probe Detected
Multiplier
3.0
Exclude non
detected probes
True
Default Total Gene Signal if all
probes are not detected
0.10
Set the Total Gene Signal to the
Total Gene Error
False
Feature Size Fraction by Array Type
Automatically Determine
Low Density 8-pack OR
Feature Extraction Reference Guide
53
1
Default Protocol Settings
miRNA_1200_Jun14
Table 7
Default settings for miRNA_1200_Jun14 protocol (continued)
Protocol step
Parameter
Default Setting/Value (v12.0)
High-Density 8-pack
Calculate Metrics
Spikein Target Used
True
Min Population for Replicate Stats?
5
Grid Test Format
Automatically Determine
Recognized formats: 60 micron and
30 micron feature size, third party
Generate Results
54
Minimum
percentage of
features needed to
be found
1.99 for 30 micron and 65 micron
feature size
PValue for Differential Expression
0.010000
Percentile Value
75.00
Type of QC Report
miRNA
Generate Single Text File
True
JPEG Down Sample Factor
4
Feature Extraction Reference Guide
Default Protocol Settings
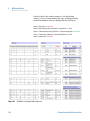
Differences in Protocol Settings Based on Each Step
1
Differences in Protocol Settings Based on Each Step
Some of the default settings are the same for all the
protocols; yet, many are different, depending on the protocol
step.
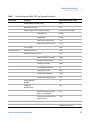
Table 8 shows each protocol step and where you can find
information on the default settings for that step.
Table 8
Feature Extraction Reference Guide
Location of protocol template default settings for each step
Protocol step
Location of default settings
Place Grid
page 56
Optimize Grid Fit
page 57
Find Spots
page 58
Flag Outliers
page 59
Compute Bkgd, Bias and
Error
page 61
Correct Dye Biases
page 64
Compute Ratios
page 65
Calculate Metrics
page 65
Generate Results
page 65
55
1
Default Protocol Settings
Place Grid
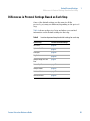
Place Grid
The parameters and values differ depending on the selected
microarray format.
Table 9
Place Grid – Default values in common and differences for grid formats
Parameter
Default values
Formats using Default Value
Array Format
Automatically Determine
Single Density (11k, 22k),
Double Density (44k), 95k,
185k, 65-micron feature size,
30-micron feature size single
pack, 30-micron feature size
multi pack, 185k, 10uM,
65-micron feature size
10-micron scans, 25k, Third
Party
Placement Method
Allow some distortion
All
Enable background peak
shifting?
False
All except 30-micron feature
size single pack and
30-micron feature size multi
pack
Use central part of pack for
slope and skew calculation?
False
All except 30-micron feature
size single pack and
30-micron feature size multi
pack
False
All except 30-micron feature
size single pack and
30-micron feature size multi
pack
Use the correlation method
to obtain origin X of
subgrids
56
Feature Extraction Reference Guide
Default Protocol Settings
Optimize Grid fit
1
Optimize Grid fit
The parameters and values differ depending on the
microarray format.
Table 10
Optimize Grid fit – Default values in common and differences for grid formats
Parameter
Default values
Formats using Default
Value
Iteratively Adjust Corners?
True
65-micron feature size
30-micron feature size
False
Third Party
Adjustment Threshold
0.300 (Not applicable for Third Party) 65-micron feature size
30-micron feature size
Maximum Number of Iterations
5 (Not applicable for Third Party)
Found Spots Threshold
0.200 (Not applicable for Third Party) 65-micron feature size
30-micron feature size
Number of Corner Features Side
Dimension?
20 (Not applicable for Third Party)
Feature Extraction Reference Guide
65-micron feature size
30-micron feature size
65-micron feature size
30-micron feature size
57
1
Default Protocol Settings
Find spots
Find spots
The parameters and values differ depending on the
microarray format.
Table 11
Find spots – Default values in common and differences for spot formats
Parameter
Default values
Formats using Default
Value
Use the Nominal Diameter from the Grid Template
True
All
Spot Deviation Limit
8.0
All except third party,
where it is set to 1.5
Calculation of Spot Statistics Method
Use Cookie
All
0.650
SD, 25k, TP
0.561
DD, 95k
0.700
185k, 185k 10uM,
65-micron feature size
0.750
30-micron feature size
1.200
All
1.300
30-micron feature size
True
All
When False is the default, 100
185k, 185k 10uM,
65-micron feature size
When False is the default, 150
30-micron feature size
Inter Quartile Region
All
RejectIQRFeat
1.42
All
RejectIQRBG
1.42
All
Use Mean/Standard Deviation
All
Cookie Percentage
Exclusion Zone Percentage
Auto Estimate the Local Radius
LocalBGRadius
Pixel Outlier Rejection Method
Statistical Method for Spot Values from Pixels
58
Feature Extraction Reference Guide
Default Protocol Settings
Flag outliers
1
Flag outliers
These parameters and values differ depending on the
scanner used for the image, the microarray type, and the lab
protocol.
Table 12
Flag Outliers – Default values in common and differences for protocols
Parameter
Default values
Protocols using Default Value
Compute Population Outliers
True
All
10
All except GE2-NonAT, ChIP, and
miRNA
15
GE2-NonAT
8
ChIP and miRNA
IQRatio
1.42
All
Background IQRatio
1.42
All except miRNA
5.00
miRNA
Use Qtest for Small Populations?
True
All
Report Population Outliers as
Failed in MAGEML file
False
All
True
All
True
All except GE2-NonAT
Feature – (%CV)^2
0.04000
All except GE2-NonAT
Red Poissonian Noise Term
Multiplier
30
GE2
20
miRNA
5
CGH, ChIP
Red Signal Constant Term
Multiplier
1
All except GE2-NonAT
Green Poissonian Noise Term
Multiplier
20
GE1, GE2, miRNA
Minimum Population
Compute Non Uniform Outliers
Agilent scanner
Automatically Compute OL Polynomial Terms
Feature Extraction Reference Guide
59
1
Default Protocol Settings
Flag outliers
Table 12
Flag Outliers – Default values in common and differences for protocols (continued)
Parameter
Default values
Protocols using Default Value
5
CGH, ChIP
Green Signal Constant Term
Multiplier
1
All except GE2-NonAT
Background – (%CV)^2
0.09000
All except GE2-NonAT
Red Poissonian Noise Term
Multiplier
3
All except GE1, GE2-NonAT
Red Signal Constant Term
Multiplier
1
All except GE1, GE2-NonAT
Green Poissonian Noise Term
Multiplier
3
All except GE2-NonAT
Green Background Constant
Term Multiplier
1
All except GE2-NonAT
False
GE2-NonAT
Automatically Compute OL Polynomial Terms
60
Feature – (%CV)^2
0.11000
Poissonian Noise Term
320 (R, G combined)
Background Term
600 (R, G combined)
Background – (%CV)^2
0.09000
Poissonian Noise Term
320 (R, G combined)
Background Term
600 (R, G combined)
Feature Extraction Reference Guide
Default Protocol Settings
Compute Bkgd, Bias and Error
1
Compute Bkgd, Bias and Error
These parameters and values differ depending on the
microarray type and the lab protocol.
Table 13
Compute Bkgd, Bias and Error – Default values in common and differences for protocols
Parameter
Default values
Protocols using Default
Value
Background Subtraction Method
No Background Subtraction
All except for GE2-NonAT
Local Background
GE2-NonAT
Use Error Model for Significance
All except GE2-NonAT
Significance
Use Pixel Statistics for Significance GE2-NonAT
2-sided t-test of feature vs.
background max p-value
0.01
All
WellAboveMulti
13
All except for GE2-NonAT
2.6
GE2-NonAT
244
miRNA only
Minimum Feature Threshold for
Metrics
2000
miRNA only
Signal Correction—Calculate Surface Fit (required for
Spatial Detrend)
True
All
FeaturesInNegativeControlRange
GE1, GE2, miRNA
AllFeatureTypes
GE2-NonAT
Only NegativeControl
Features
CGH, ChIP
False
CGH, ChIP
True
GE1, GE2, GE2-NonAT,
miRNA
True
All except GE2-NonAT
False
GE2-NonAT
Background Method by Format
Feature Set for Surface Fit
Perform Filtering for Surface Fit
Perform Spatial Detrending
Feature Extraction Reference Guide
61
1
Default Protocol Settings
Compute Bkgd, Bias and Error
Table 13
Compute Bkgd, Bias and Error – Default values in common and differences for protocols (continued)
Parameter
Default values
Protocols using Default
Value
Signal Correction—Adjust Background Globally
False
All except for GE2-NonAT
which is set to True.
Signal Correction—Perform Multiplicative Detrending
True
GE1, GE2, CGH, ChIP
False
miRNA
False
CGH, ChIP
True
GE1, GE2
(not applicable for GE2-NonAT)
Detrend on Replicates Only
Filter Low signal probes from Fit? True
GE1, GE2, CGH, ChIP
Neg. Ctrl. Threshold Mult.
Detrend Factor
3
CGH, ChIP
5
GE1, GE2
Perform Filtering for Fit
Use Window Average
GE1, GE2, CGH, ChIP
Use polynomial data fit instead
of LOESS?
True
GE1, CGH, ChIP
Polynomial Multiplicative
DetrendDegree
4
GE1, CGH, ChIP
False
GE1, GE2, GE2-NonAT
True
CGH, ChIP, miRNA
Most Conservative
All except for miRNA
Use Universal Error Model
miRNA
0.1000
All except for GE2-NonAT
.0900
GE2-NonAT
0.1000
All except GE1 protocol and
GE2-NonAT
.0900
GE2-NonAT
True
All except GE1 protocol and
GE2-NonAT
Robust Neg Ctrl Stats?
Choose universal error, or most conservative
MultErrorGreen
MultErrorRed
Auto Estimate Add Error Red
62
Feature Extraction Reference Guide
Default Protocol Settings
Compute Bkgd, Bias and Error
Table 13
1
Compute Bkgd, Bias and Error – Default values in common and differences for protocols (continued)
Parameter
Auto Estimate Add Error Green
Use Surrogates
Feature Extraction Reference Guide
Default values
Protocols using Default
Value
False (Additive Error Value Red-30)
GE2-NonAT
True
All except for GE2-NonAT
False (Additive Error Value
Green-30)
GE2-NonAT
True
All except for miRNA
False
miRNA
63
1
Default Protocol Settings
Correct Dye Biases
Correct Dye Biases
These parameters and values differ depending on the
microarray type. The GE1 protocol and the miRNA
protocol do not correct for dye biases.
Table 14
Correct Dye Biases – Default values in common and differences for protocols
Parameter
Default values
Protocols using default
values (NA for GE1 and
miRNA protocols)
Use Dye Norm List
Automatically Determine
All
Dye Normalization Probe Selection Method
Use Rank Consistent Probes
All
Rank Tolerance
0.050
All
Variable Rank Tolerance
False
All
Omit Background Population Outliers
False
All
Allow Positive and Negative Controls
False
All
Signal Characteristics
OnlyPositiveAndSignificantSignals
All
Normalization Correction Method
Linear and Lowess
GE2
Linear
CGH, ChIP
Lowess Only
GE2-NonAT
-1
All except for GE2
8000
GE2
Max Number Ranked Probes
64
Feature Extraction Reference Guide
Default Protocol Settings
Compute ratios, calculate metrics, and generate results
1
Compute ratios, calculate metrics, and generate results
Some of these parameters and values are the same for all
the protocols, others vary, and still others do not even use a
protocol step.
Table 15
Values in common and differences in protocols
Protocol step
Parameter
Default Value (v12.0)
Compute Ratios
Peg Log Ratio Value
4.00 (Not applicable for GE1 and
miRNA)
Calculate Metrics
Spikein Target Used?
True (GE1, GE2, miRNA)
False (CGH, ChIP, GE2-NonAT)
Min Population for Replicate Statistics
5 (3 for CGH and ChIP)
Grid Test Format
Automatically Determine (Not
applicable for GE2-NonAT)
PValue for Differential Expression
0.010000 (All)
Percentile Value
75.00 (All)
Generate Results
Type of QC Report
Gene Expression for GE1 or GE2,
Streamlined CGH for CGH,
CGH_ChIP for ChIP, miRNA for
miRNA
Generate Results
Generate Single Text File
True (All)
JPEG Down Sample Factor
4 (All)
Feature Extraction Reference Guide
65
1
66
Default Protocol Settings
Compute ratios, calculate metrics, and generate results
Feature Extraction Reference Guide
Agilent Feature Extraction 12.0
Reference Guide
2
QC Report Results
QC Reports 68
QC Report Headers 87
Feature Statistics 90
Histogram of LogRatio plot 103
QC Report Results in the FEPARAMS and Stats Tables 121
QC Metric Set Results 122
QC reports include statistical results to help you evaluate
the reproducibility and reliability of your single microarray
data. This chapter describes each of five types of QC report
– 2-color Gene Expression, 1-color Gene Expression,
Streamlined CGH, CGH_ChIP, and microRNA (miRNA) – and
how each can help you interpret the performance of your
microarray system. Use plots and statistics from the report
to:
• Set up your own run charts of statistical values versus
time or experiment number to track performance of one
microarray compared to other microarrays
• Monitor upstream lab protocols, such as performance of
your hybridization/washing steps
• Monitor the effect of changing Feature Extraction protocol
parameters on the performance of your data analysis
If you incorporate a set of QC metrics in your extraction,
those results appear on the final page of the QC report as
an Evaluation Table.
Agilent Technologies
67
2
QC Report Results
QC Reports
QC Reports
This section contains example QC Reports, and points out
the different sections that appear on the reports.
N O TE
68
The reports in this section are examples. The actual contents of the
reports vary, depending on the protocol settings and QC metric set used.
Feature Extraction Reference Guide
QC Report Results
2-color Gene Expression QC Report
2
2-color Gene Expression QC Report
This module shows you the organization of the 2-color gene
expression QC report. See the following figure and the
figures on the next pages for links to information on the QC
Report regions.
1
1“QC Report Headers” on
page 87
2 “Spot finding of Four
Corners” on page 90
5
2
3 “Outlier Stats” on
page 91
3
4 “Spatial Distribution of
All Outliers” on page 91
4
6
5 “Net Signal
Statistics” on page 93
6 “Plot of
Background-Corrected
Signals” on page 95
Figure 1
Feature Extraction Reference Guide
2-color Gene Expression QC Report with Spike-ins (p1)
69
2
QC Report Results
2-color Gene Expression QC Report
7 “Negative Control Stats” on
page 94
8 “Spatial Distribution of
Significantly Up-Regulated
and Down-Regulated
Features (Positive and
Negative Log Ratios)” on
page 100
7
8
9
10
11
9 “Local Background
Inliers” on page 97
10 “Foreground Surface
Fit” on page 97
12
11 “Plot of LogRatio vs. Log
ProcessedSignal” on
page 101
13
12 “Reproducibility Statistics
(%CV Replicated Probes)” on
page 104
14
15
13 “Microarray Uniformity
(2-color only)” on page 106
14 “Sensitivity” on page 107
15 “Reproducibility plot for
2-color gene expression
(spike-in probes)” on
Figure 2
70
2-color Gene Expression QC Report with Spike-ins (p2)
Feature Extraction Reference Guide
QC Report Results
2-color Gene Expression QC Report
2
16
16 “2-color gene expression
spike-in signal statistics” on
page 111
17
17 “Spike-in Linearity Check
for 2-color Gene
Expression” on page 113
18 “QC Metric Set
Results” on page 122
18
Figure 3
Feature Extraction Reference Guide
2-color Gene Expression QC Report with Spike-ins (p3)
71
2
QC Report Results
1-color Gene Expression QC Report
1-color Gene Expression QC Report
This module shows you the organization of the 1-color gene
expression QC report. See the following figure and the
figures on the next pages for links to information on each of
the QC Report regions.
1“QC Report Headers” on
page 87
1
2 “Spot finding of Four
Corners” on page 90
2
5
3 “Outlier Stats” on page 91
3
4 “Spatial Distribution of All
Outliers” on page 91
5 “Net Signal Statistics” on
page 93
6 “Histogram of Signals Plot
(1-color GE or CGH)” on
page 96
6
4
Figure 4
72
1-color Gene Expression QC Report with Spike-ins (p1)
Feature Extraction Reference Guide
QC Report Results
1-color Gene Expression QC Report
2
13
7 “Negative Control Stats” on
page 94
8 “Local Background
Inliers” on page 97
7
8
9 “Foreground Surface Fit” on
page 97
9
10“Multiplicative Surface
Fit” on page 99
11 “Reproducibility Statistics
(%CV Replicated Probes)” on
page 104
12 “1-color gene expression
spike-in signal statistics” on
page 112
10
11
12
13 “Spatial Distribution of
Median Signals for each Row
and Column” on page 102
Figure 5
Feature Extraction Reference Guide
1-color Gene Expression QC Report with Spike-ins (p2)
73
2
QC Report Results
1-color Gene Expression QC Report
14 “Reproducibility plot for
1-color gene expression
(spike-in probes)” on
page 109
14
15
15 “Spike-in Linearity Check
for 1-color Gene
Expression” on page 114
16 “QC Metric Set
Results” on page 122
16
17 “Table of Values for
Concentration-Response Plot
(1-color only)” on page 115
17
Figure 6
74
1-color Gene Expression QC Report with Spike-ins (p3)
Feature Extraction Reference Guide
QC Report Results
Streamlined CGH QC Report
2
Streamlined CGH QC Report
The streamlined CGH QC report provides QC metrics that
are relevant to CGH application. All log plots use log base 2
(not 10).
1
1 “QC Report Headers” on
page 87
2 “Spot finding of Four
Corners” on page 90
4
2
3 “Spatial Distribution of All
Outliers” on page 91
3
4“QC reports with metric sets
added” on page 83
5
5 “Histogram of Signals Plot
(1-color GE or CGH)” on
page 96
6
6 “Outlier Stats” on page 91
Figure 7
Feature Extraction Reference Guide
Streamlined CGH QC Report (p1)
75
2
QC Report Results
Streamlined CGH QC Report
7
7“Spatial Distribution of
Significantly Up-Regulated
and Down-Regulated
Features (Positive and
Negative Log Ratios)” on
page 100
8
8 “Plot of
Background-Corrected
Signals” on page 95
Figure 8
76
Streamlined CGH QC Report (p2)
Feature Extraction Reference Guide
QC Report Results
CGH_ChIP QC Report
2
CGH_ChIP QC Report
This report lists all of the same information as the 2-color
Gene Expression report but removes the Array Uniformity
table and spike-ins and has a Histogram of LogRatio plot.
All log plots use log base 2 (not 10).
1“QC Report Headers” on
page 87
2 “Spot finding of Four
Corners” on page 90
1
2
5
3 “Outlier Stats” on page 91
6
4 “Spatial Distribution of All
Outliers” on page 91
5 “Net Signal Statistics” on
page 93
3
4
7
6 “Negative Control Stats” on
page 94
7 “Plot of
Background-Corrected
Signals” on page 95
Figure 9
Feature Extraction Reference Guide
CGH_ChIP QC Report (p1)
77
2
QC Report Results
CGH_ChIP QC Report
11
8
8 “Local Background
Inliers” on page 97
9 “Foreground Surface
Fit” on page 97
10 “Reproducibility Statistics
(%CV Replicated Probes)” on
page 104
11 “Spatial Distribution of
Significantly Up-Regulated
and Down-Regulated
Features (Positive and
Negative Log Ratios)” on
page 100
9
10
13
12
14
12 “QC reports with metric
sets added” on page 83
13 “Plot of LogRatio vs. Log
ProcessedSignal” on
page 101
14 “Histogram of LogRatio
plot” on page 103
Figure 10
78
CGH_ChIP QC Report (p2)
Feature Extraction Reference Guide
QC Report Results
MicroRNA (miRNA) QC Report
2
MicroRNA (miRNA) QC Report
Agilent miRNA microarrays are
currently in development. Check
the Agilent Web site for the latest
information.
This module shows you the organization of the 1-color
miRNA QC report. See the following figure and the figures
on the next pages for links to information on each of the QC
Report regions.
1 “QC Report Headers” on
page 87
1
2 “Spot finding of Four
Corners” on page 90
2
5
3 “Outlier Stats” on page 91
6
4 “Spatial Distribution of All
Outliers” on page 91
3
5 “Net Signal Statistics” on
page 93
4
7
6 “Negative Control Stats” on
page 94
7 “Histogram of Signals Plot
(1-color GE or CGH)” on
page 96
Figure 11
Feature Extraction Reference Guide
MicroRNA (miRNA) QC Report (p1)
79
2
QC Report Results
MicroRNA (miRNA) QC Report
8 “Foreground Surface Fit” on
page 97
8
9 “Reproducibility Statistics
(%CV Replicated Probes)” on
page 104
9
12
10 “Reproducibility plot for
miRNA (non-control
probes)” on page 110
10
11 “QC reports with metric
sets added” on page 83
12 “Spatial Distribution of
Median Signals for each Row
and Column” on page 102
11
Figure 12
80
MicroRNA (miRNA) QC Report (p2)
Feature Extraction Reference Guide
QC Report Results
Non-Agilent GE2 QC Report
2
Non-Agilent GE2 QC Report
This report lists all of the same information as the 2-color
gene expression QC report but with no spike-ins.
1 “QC Report Headers” on
page 87
1
2 “Spot finding of Four
Corners” on page 90
2
5
3 “Outlier Stats” on
page 91
4 “Spatial Distribution of
All Outliers” on page 91
3
5 “Net Signal
Statistics” on page 93
4
6
7
6 “Negative Control
Stats” on page 94
7 “Plot of
Background-Corrected
Signals” on page 95
Figure 13
Feature Extraction Reference Guide
Non-Agilent GE2 QC Report (p1)
81
2
QC Report Results
Non-Agilent GE2 QC Report
12
8
8 “Local Background
Inliers” on page 97
9 “Foreground Surface
Fit” on page 97
10 “Reproducibility Statistics
(%CV Replicated
Probes)” on page 104
11 “Microarray Uniformity
(2-color only)” on page 106
9
13
10
11
12 “Spatial Distribution of
Significantly Up-Regulated
and Down-Regulated
Features (Positive and
Negative Log Ratios)” on
page 100
13 “Plot of LogRatio vs. Log
ProcessedSignal” on
page 101
Figure 14
82
Non-Agilent GE2 QC Report (p2)
Feature Extraction Reference Guide
QC Report Results
QC reports with metric sets added
2
QC reports with metric sets added
When metric sets are associated to the protocols, QC reports
are generated with an additional set of evaluation metrics.
Depending on the microarray types, some QC metric sets
come with thresholds (denoted by QCMT) and some without
thresholds (denoted by QCM).
If thresholds are included in the metric set, the evaluation
tables in the QC report show metrics that are within
threshold ranges or that have exceeded those ranges.
Agilent has determined which of the FE Stats are good
metrics to follow the processing of Agilent arrays. Most of
the metrics chosen are useful to determine if there are
problems in the various laboratory steps (label,
hybridization, wash, scan steps). The new “IsGoodGrid”
metric tracks the automatic grid-finding of Feature
Extraction. By looking at numerous data run on our arrays,
using our wet-lab protocols, Agilent has found thresholds
that indicate if the data is in the expected range (“Good”) or
out of the expected range (“Evaluate”).
For some applications (CGH, miRNA), an extra threshold
level, “Excellent” is provided. More data has been screened
to allow setting the metric thresholds to tighter limits that
indicate excellent processing. For those applications that do
not have a full set of thresholds (for example, ChIP), or no
“Excellent” thresholds (for example, GE1 and GE2), the user
is assured that the data coming from the “Good” grade is
good to use. Excellent thresholds for those applications may
be provided in the future.
Feature Extraction Reference Guide
83
2
QC Report Results
QC reports with metric sets added
QC metric set results--default protocol settings
Figure 15 is an example of part of a QC report — the header
and the Evaluation Metrics table — generated from a 2-color
gene expression extraction whose GE2 metric set with
thresholds had been added. In this extraction, the default
protocol settings were used. Note that all values for the
metrics are within the default threshold ranges.
Figure 15
84
Partial QC Report—Header and Evaluation Metrics with GE2
metric set with thresholds added—Default protocol settings
Feature Extraction Reference Guide
QC Report Results
QC reports with metric sets added
2
QC metric set results—Spatial and Multiplicative Detrending Off
Figure 16 is an example of a QC report header and
Evaluation Metrics table generated from a 2-color gene
expression extraction whose GE2 metric set with thresholds
were added. In this extraction spatial and multiplicative
detrending were turned off. Note that not all values of the
metrics are within the default thresholds.
Figure 16
Feature Extraction Reference Guide
QC Report Header and Evaluation Metrics with GE2 metric
set with thresholds added—Detrending turned off
85
2
QC Report Results
QC reports with metric sets added
QC metric set results—miRNA spike-in analysis
Figure 17 is an example of a QC report header and
Evaluation Metrics table generated from a 1-color extraction
whose miRNA metric set with thresholds had been added. In
this extraction, the default protocol settings were used. Note
that not all values of the metrics are within the default
thresholds. For details on how the miRNA spike-in statistics
and metrics are calculated, see “MicroRNA Analysis” on
page 283.
Figure 17
86
QC Report Header and Evaluation Metrics with miRNA metric
set with thresholds added - Default protocol settings
Feature Extraction Reference Guide
QC Report Results
QC Report Headers
2
QC Report Headers
2-color Gene Expression QC Report
The following Feature Extraction information is found in the
2-color gene expression QC Report header:
Date
Image
Protocol
Date and time that the QC Report was generated
Name of the TIFF file that was extracted
Name of the protocol used for the extraction
User Name
Name of the user who set up the extraction
Grid
Name of the grid template or grid file used
FE Version
Sample (red/green)
DyeNorm List
No of Probes in
DyeNorm List
BG Method
Background
Detrend
Multiplicative
Detrend
Dye Norm
Linear DyeNorm Factor
Additive Error
Feature Extraction Reference Guide
Version of the Feature Extraction software used
Names of Cy5- and Cy3-labeled samples
Name of the dye normalization list
Number of probes in the designated dye normalization probe
list
Type of background subtraction method used
If Spatial Detrend was turned on or off during the
extraction
If Multiplicative Detrend was turned on or off during the
extraction
Type of dye normalization method used
Global dye normalization factor determined for the linear
portion of the correction method.
Additive portion of the error estimated in the Universal or
Most Conservative error model (if AutoEstimateAddError
was selected). Or, the values entered into the protocol, (if
AutoestimateAddError was not selected). Note that the
87
2
QC Report Results
1-color Gene Expression QC Report
additive error that appears in the QC report header is the
Additive Error value selected in the protocol multiplied by
the linear dye norm factor.
Saturation
Value
The signal intensity value above which the signal is
considered saturated. This value only appears if it exceeds
about 65,500. If it appears, this means that this QC report is
from an XDR image file.
1-color Gene Expression QC Report
This report lists all of the same header information as the
2-color gene expression report, except for Dye Norm and
Linear DyeNorm Factor which are removed.
Streamlined CGH QC Report
The streamlined CGH QC report contains the same header
information as the 2-color gene expression QC report, except
for Linear DyeNorm Factor and Additive Error which are
removed. Also, the information from the two fields, “BG
Method” and “Background Detrend”, have been collapsed
into the one field, “BG Method”.
CGH_ChIP QC Report
All header information that appears in the 2-color gene
expression QC report are included in the CGH_ChIP report.
This report lists one additional metric, Derivative of Log
Ratio Spread in the header information.
Derivative of Log
Ratio Spread
88
Measures the standard deviation of the probe-to-probe
difference of the log ratios. This metric is used in CGH
experiments where differences in the log ratios are small on
average. A smaller standard deviation here indicates less
noise in the biological signals.
Feature Extraction Reference Guide
QC Report Results
MicroRNA (miRNA) QC Report
2
MicroRNA (miRNA) QC Report
This header lists the same information as the 1-color gene
expression QC Report header. If the XDR function is turned
on, it also lists Saturation Values exceeding 65,500. Because
the dynamic range of the intensity for all miRNA microarray
spots on a microarray may exceed that of a normal scan
range, the miRNA analysis on some microarrays can benefit
with the XDR function turned on.
Non-Agilent 2-color gene expression QC Report
This header lists the same information as the 2-color gene
expression QC report header.
Feature Extraction Reference Guide
89
2
QC Report Results
Feature Statistics
Feature Statistics
This section provides an explanation for each of the feature
statistics segments of the QC report and how these feature
statistics can help you assess the performance of your
microarray system.
Spot finding of Four Corners
By looking at the features in the four corners of the
microarray, you can decide if the spot centroids have been
located properly. If their locations are off-center in one or
more corners, you may have to run the extraction again with
a new grid.
Figure 18
90
QC Report—Spot Finding for Four Corners
Feature Extraction Reference Guide
QC Report Results
Outlier Stats
2
Outlier Stats
If the QC Report shows a greater than expected number of
nonuniform or population outliers, check your
hybridization/wash step. Also, check the visual results (.shp
file) to see if the spot centroids are off-center. If the grid
was not placed correctly, a new grid is required.
Figure 19
QC Report—Outlier Stats
For 1-color reports, the number of outliers is reported for
the green channel only.
Spatial Distribution of All Outliers
The QC report shows two plots of all the outliers, both
population and nonuniformity outliers, whose positions are
distributed across the microarray. One plot is for the green
channel, and the other, for the red channel. SNP probes are
included.
To distinguish the background population and nonuniform
outliers from one another, look at the color coding at the
bottom of the two plots.
For the 1-color report, only the green plot is shown.
Feature Extraction Reference Guide
91
2
QC Report Results
Spatial Distribution of All Outliers
Figure 20
QC Report—Number and Spatial Distribution of Outliers
The number (and percentage) of features that are feature
nonuniformity outliers in either the green or red channel is
shown under the plot. The 1-color report shows only the
percentage of green feature non-uniformity outliers.
Also, the number (and percentage) of genes that are
nonuniformity outliers in either channel is shown under the
plot. If there were replicate features representing one gene
and at least one feature was not an outlier, no gene outliers
would appear.
92
Feature Extraction Reference Guide
QC Report Results
Net Signal Statistics
2
Net Signal Statistics
Net signal is the mean signal
minus the scanner offset. Net
signal is used so that these
statistics are independent of the
scanner version.
Net signal statistics are an indication of the dynamic range
of the signal on a microarray for both non-control probes
and spike-in probes (not applicable for CGH QC report). The
QC Report uses the range from the first percentile to the
99th percentile as an indicator of dynamic range for that
microarray. NetSignal is also a column in the FeatureData
output.
For example, in Figure 21 for non-control probes, the
dynamic range of the net signal intensity for the red channel
is from 42 to 6803. Half the probes have a net signal
intensity of greater than the median of 97 and half below
the median of 97. The median (or 50th percentile) represents
the middle of the ranked-values of the distribution of
signals.
Another indicator of signal range for the microarray is the
number of features that are saturated in the scanned image
(for example, NumSat).
Figure 21
Feature Extraction Reference Guide
QC Report—Net Signal Statistics
93
2
QC Report Results
Negative Control Stats
Negative Control Stats
The Negative Control Stats table includes the average and
standard deviation of the net signals (mean signal minus
scanner offset) and the background-subtracted signals for
both the red and green channels in the negative controls.
These statistics filter out saturated and feature nonuniform
and population outliers and give a rough estimate of the
background noise on the microarray. SNP probes are not
included in these statistics.
Figure 22
94
QC Report—Negative Control Stats
Feature Extraction Reference Guide
QC Report Results
Plot of Background-Corrected Signals
2
Plot of Background-Corrected Signals
Figure 23 is a plot of the log of the red
background-corrected signal versus the log of the green
background-corrected signal for non-control inlier features.
The linearity or curvature of this plot can indicate the
appropriateness of background method choices. The plot
should be linear.
The intersection of the red vertical and horizontal lines
shows the location of the median signal. The numbers along
the edge of the lines represent the location of the median
signal on the plot.
The values under the plot indicate the number of
non-control features that have a background-corrected signal
less than zero. SNP probes are not included.
Figure 23
Feature Extraction Reference Guide
QC Report—Plot of Background-Corrected Signals
95
2
QC Report Results
Histogram of Signals Plot (1-color GE or CGH)
Histogram of Signals Plot (1-color GE or CGH)
The purpose of this histogram is to show the level of signal
and the shape of the signal distribution. The histogram is a
line plot of the number of points in the intensity bins vs.
the log of the processed signal. SNP probes are not included.
Figure 24
96
1-color QC Report—Histogram of Signals Plot
Feature Extraction Reference Guide
QC Report Results
Local Background Inliers
2
Local Background Inliers
With these numbers, you can see the mean signal
distribution for the local background regions (BGMeanSignal)
after outliers have been removed. This information can help
you detect hybridization/wash artifacts and can be a
component of noise in the low signal range. SNP probes are
included.
Figure 25
QC Report—Local Background Inliers
Foreground Surface Fit
See “Step 13. Perform background
spatial detrending to fit a
surface” on page 256 of this guide
for more information about these
calculations.
Spatial Detrend attempts to account for low signal
background that is present on the feature “foreground” and
varies across the microarray. SNP probes are not included.
• A high RMS_Fit number can indicate gradients in the low
signal range before detrending.
• RMS_Resid indicates residual noise after detrending.
• AvgFit indicates how much signal is in the “foreground”.
A higher AvgFit number indicates that a larger amount of
signal was detected by the detrend algorithm and
removed.
This value may include the scanner offset, unless a
background method has been used before detrending. The
value may not include higher frequency background
signals. These higher frequency background signals are
best removed by using the Local Background Method
before the detrending algorithm.
Feature Extraction Reference Guide
97
2
QC Report Results
Foreground Surface Fit
Figure 26
98
QC Report—Foreground Surface Fit
Feature Extraction Reference Guide
QC Report Results
Multiplicative Surface Fit
2
Multiplicative Surface Fit
See “Step 16. Determine the error
in the signal calculation” on
page 266 of this guide for more
information about these
calculations.
This value is the root mean square (RMS) of the surface fit
for the data. The RMS X 100 is roughly the average %
deviation from “flat” on the microarray. A multiplicative
trend means that there are regions of the microarray that
are brighter or dimmer than other regions. This trend is an
effect that multiplies signals; that is, a brighter signal is
more affected in absolute signal counts than a dimmer
signal. SNP probes are not included in calculation of
multiplicative detrending.
This option is turned on in GE1, GE2, and CGH protocols,
turned off in the miRNA protocol and is not available for
non-Agilent protocols.
If the signal is improved through a multiplicative surface fit,
the RMS_Fit value appears as a fraction, as in the figure
shown.
Figure 27
QC Report—Multiplicative Surface Fit
What if multiplicative detrending does not work?
If the median %CV for the Processed Signal of the
non-control probes is greater than the BGSub Signal median
%CV after multiplicative detrending, Feature Extraction turns
off multiplicative detrending.
If multiplicative detrending did not result in better data, the
QC report shows an RMS_Fit = 0.0.
If there are no stats for non-control probes, Feature
Extraction looks at the spike-in control probes. If the %CVs
for these become worse, Feature Extraction removes
detrending.
Feature Extraction Reference Guide
99
2
QC Report Results
Spatial Distribution of Significantly Up-Regulated and Down-Regulated Features (Positive and Negative
Log Ratios)
If the option “Detrend on Replicates only” is chosen and if
there are not enough replicates for non-control or spike-in
control probes, Feature Extraction turns off multiplicative
detrending.
Spatial Distribution of Significantly Up-Regulated and
Down-Regulated Features (Positive and Negative Log
Ratios)
You can display the distribution of the significantly up- and
down-regulated features on this plot (up–red; down–green).
Figure 28
QC Report—Spatial Distribution of Up- and Down-Regulated
Features
For the CGH QC Report, this plot is referred to as “Spatial
Distribution of the Positive and Negative Log Ratios”.
If the microarray contains greater than 5000 features, the
software randomly selects 5000 data points. These points
include the number of up-regulated features in the same
proportion to the number of down-regulated features as they
are found on the actual microarray.
The threshold that is used to determine significance is set in
the protocol—QCMetrics_differentialExpressionPValue.
These are the same features shown as up- or
down-regulated in Figure 29.
100
Feature Extraction Reference Guide
QC Report Results
Plot of LogRatio vs. Log ProcessedSignal
2
Plot of LogRatio vs. Log ProcessedSignal
This plot shows the log ratios of non-control inliers vs. the
log of their red and green processed signals. The color
coding signifies the degree to which features are significantly
differentially expressed: those that are up-regulated (red),
those that are down-regulated (green) and those that cannot
confidently be said to show gene expression (light yellow).
For the CGH QC Report, these are referred to as “Positive”,
“Negative” log ratios (base 2). The threshold that is used to
determine significance is set in the protocol
(QCMetrics_differentialExpressionPValue).
Features that were used for normalization are indicated in
blue. Significance takes precedence over normalization for
the color coding; that is, features that are both significantly
differentially expressed and used for normalization are
color-coded either red or green. SNP probes are not
included.
LogProcessedSignal in the plot is
[Log(rProcessedSignal x
gProcessedSignal)]/2.
Figure 29
Feature Extraction Reference Guide
QC Report—Plot of Up- and Down-Regulated Features
101
2
QC Report Results
Spatial Distribution of Median Signals for each Row and Column
Spatial Distribution of Median Signals for each Row and
Column
The first of these graphs plots the median Processed Signal
and median BGSub Signal for each row over all columns of a
1-color GE microarray. The second plots the same signals for
each column over all rows of the 1-color GE microarray. The
difference between the Processed Signal and the
BGSubSignal represents the effect of the multiplicative
detrending. The Processed Signal should look flatter.
Higher frequency noise is shown in
these plots so you can distinguish
a low frequency trend outside of
the high frequency noise.
Figure 30
102
1-color QC Report—Median Signal Spatial Distribution
Feature Extraction Reference Guide
QC Report Results
Histogram of LogRatio plot
2
Histogram of LogRatio plot
This is a plot of the log ratio distributions, and displays the
log ratios vs. the number of probes. This plot is included
only in the CGH_ChIP report, which is the default report for
the ChIP_<revision>_<date> protocol.
Figure 31
Feature Extraction Reference Guide
Histogram of LogRatio plot
103
2
QC Report Results
Inter-Feature Statistics
Inter-Feature Statistics
Spike-in probes are known
probes that are hybridized with
known quantities of a target
“spike-in” cocktail. They are
used to perform a quality check
of the microarray/experiment.
Some microarray designs have replicated non-control probes;
that is, multiple features on the microarray contain the same
probe sequence. Many of the Agilent microarray designs also
have spike-in probes, which are replicated across the
microarray (for example, some microarrays have 10
sequences with 30 replicates each). The QC Report uses
these replicated probes to evaluate reproducibility of both
the signals and the log ratios. Metrics such as signal %CV
and log ratio statistics are calculated if probes are present
with a minimum number of replicates.
The protocol indicates if labeled target to these spike-in
probes has been added in the hybridization
(QCMetrics_UseSpikeIns). The minimum number of replicates
(inliers to Sat & NonUnif flagging) is also set in the protocol
(QCMetrics_minReplicate Population).
This section provides an explanation for each of the
segments of the QC report that cover interfeature statistics
and how these replicate statistics can help you assess
performance.
Reproducibility Statistics (%CV Replicated Probes)
Non-control probes
If a non-control probe has a minimum number of inliers, a
%CV (percent coefficient of variation) of the
background-corrected signal is calculated for each channel
(SD of signals/average of signals). This calculation is done
for each replicated probe, and the median of those %CV’s is
reported in the table for each channel. SNP probes are not
included.
104
Feature Extraction Reference Guide
QC Report Results
Reproducibility Statistics (%CV Replicated Probes)
Figure 32
2
QC Report—Reproducibility
A lower median %CV value indicates better reproducibility of
signal across the microarray than a higher value.
Exclusion of dim probes
Feature Extraction calculates the Median %CV using those
probes bright enough to be in the range where the noise is
more proportional to signal. Feature Extraction excludes
from the calculation any sequences for which the Average
(BGSubSignal) x Multiplicative error < Additive error/Dye
Norm Factor. For 1-color data the Dye Norm Factor is 1.
A probe sequence has a %CV calculated if the number of
features that pass the filters (NonUniform and signal filter,
described above) is greater than the minimum replicate
number indicated in the protocol:
“QCMetrics_minReplicatePopulation”.
If the number of replicated sequences with enough inlier
features is less than 10 or less than 10% of the replicated
sequence, that is, if there are not enough bright replicated
probes, the Median %CV field shows up as -1.
Spike-in probes
The same algorithm is used to calculate the Median %CV for
the spike-in probes as well. Because there are only ten
sequences in total and some are expected to fail the
Additive error test described above, the minimum number of
“bright enough” sequences required to calculate the Median
%CV is 3.
Feature Extraction Reference Guide
105
2
QC Report Results
Microarray Uniformity (2-color only)
Microarray Uniformity (2-color only)
The QC Report has two metrics that measure the uniformity
of replicated log ratios and that indicate the span of log
ratios: average S/N and AbsAvgLogRatio. These are
calculated from inlier features of replicated non-control and
spike-in probes.
For example, some microarrays have 100 different
non-control probe sequences with 10 replicate features each.
For each replicate probe, the average and SD of the log
ratios are calculated. The signal to noise (S/N) of the log
ratio for each probe is calculated as the absolute of the
average of the log ratios divided by the SD of the log ratios.
From the population of 100 S/N’s, for example, the average
S/N is determined and shown in Figure 33.
The second metric, AbsAvgLogRatio, indicates the amount of
differential expression (up-regulated or down-regulated). As
described above, averages of log ratios are calculated for
each replicated probe. The absolute of these averages is
determined next. Then, the average of these absolute of
averages is calculated to get a single value for the QC
Report. The larger this value, the more differential
expression is present.
Figure 33
106
QC Report—Array Uniformity: LogRatios
Feature Extraction Reference Guide
QC Report Results
Sensitivity
2
Sensitivity
These values represent the NetSignal to background (BGUsed
- ScannerOffset) ratio of the two spike-in probes with the
lowest background-subtracted signal. Their purpose is to
characterize the sensitivity of detecting a low signal relative
to the background.
Figure 34
Feature Extraction Reference Guide
QC Report—Sensitivity: Agilent SpikeIns Ratio of Signal to
Background for 2 dimmest probes
107
2
QC Report Results
Reproducibility Plots
Reproducibility Plots
Reproducibility plot for 2-color gene expression (spike-in probes)
Signal replicate statistics are calculated for spike-in probes
if three criteria are met:
• They are present on the microarray.
• The protocol indicates that labeled target to these spike-in
probes has been added in the hybridization
(QCMetrics_UseSpikeIns is True).
• There are a minimum number of inlier features for
calculations (QCMetrics_minReplicatePopulation).
As described above for non-control probes, %CV’s are
calculated for inliers for both red and green
background-corrected signals. The %CV for each probe is
plotted on the next page vs. the average of its
background-corrected signal. The median of these %CV’s is
shown directly beneath the plot.
Figure 35
108
QC Report—Agilent SpikeIns: %CV of Average BGSub Signal
Feature Extraction Reference Guide
QC Report Results
Reproducibility Plots
2
Reproducibility plot for 1-color gene expression (spike-in probes)
This graph plots %CV vs. the log_gMedianProcessedSignal for
the 1-color gene expression microarray experiment. The
region where the %CV flattens out and is not tightly
correlated with signal is the range where noise is
proportional to signal. This is generally the range used to
calculate the median %CV.
Figure 36
Feature Extraction Reference Guide
1-color QC Report—Agilent SpikeIns: %CV of Avg. Processed
Signal Plot
109
2
QC Report Results
Reproducibility Plots
Reproducibility plot for miRNA (non-control probes)
This graph plots %CV vs. the log_gMedianProcessedSignal for
the 1-color miRNA microarray experiment. The region where
the %CV flattens out and is not tightly correlated with signal
is the range where noise is proportional to signal. This is
generally the range used to calculate the median %CV.
Figure 37
110
miRNA QC Report — Reproducibility: % CV for Replicated
Probes
Feature Extraction Reference Guide
QC Report Results
Spike-in Signal Statistics
2
Spike-in Signal Statistics
2-color gene expression spike-in signal statistics
These signal statistics and S/N values for spike-ins indicate
accuracy and reproducibility of the signals of the microarray
probes. The table shows the expected signal of the spike-in
probe, the observed average signal, the SD of the observed
signal and the S/N of the observed signal.
Figure 38
Feature Extraction Reference Guide
2-color QC Report—Agilent SpikeIns Signal Statistics
111
2
QC Report Results
Spike-in Signal Statistics
1-color gene expression spike-in signal statistics
For each sequence of spike-ins this table shows the Probe
Name, the median Processed Signal (median of
LogProcessedSignal), %CV
(SD_ProcessedSignals/Avg_ProcessedSignals) and StdDev (of
LogProcessedSignals).
Figure 39
112
1-color QC Report—Agilent SpikeIns Signal Statistics
Feature Extraction Reference Guide
QC Report Results
Spike-in Linearity Check for 2-color Gene Expression
2
Spike-in Linearity Check for 2-color Gene Expression
Using the data calculated for the above table, the observed
average log ratio is plotted vs. the expected log ratio for
each of the spike-in probes. A linear regression analysis is
done using these values and the metrics are shown beneath
the plot. A slope of 1, y-intercept of 0 and R2 of 1 is the
ideal of such a linear regression. A slope < 1 may indicate
compression, such as having under-corrected for background.
The regression coefficient (R2) reflects reproducibility.
The standard deviation for each data point is shown on the
plot by an error bar extending above and below the point.
Figure 40
Feature Extraction Reference Guide
QC Report—Agilent SpikeIns: Expected Log Ratio Vs.
Observed LogRatio
113
2
QC Report Results
Spike-in Linearity Check for 1-color Gene Expression
Spike-in Linearity Check for 1-color Gene Expression
This plot shows the dose/response curve of the spike-ins
from the detection limit to the saturation point.
This plot is usually sigmoidal with
two asymptotes, one at the
scanner saturation point and one
at the level of signal for sequences
with no specifically bound target.
Some microarrays produce plots
missing the top asymptote,
especially if extended dynamic
range is used. (See Figure 41.)
At high signal levels the error bars are small since the
scanner reaches saturation at this point. Both the signals
and standard deviations are underestimated because the
saturated data is not excluded from the calculation.
At low signal levels the error bars are visible because the
signal is dropping into the background noise. The signal
level at the top of the error bars of the features with lowest
signal provides a rough estimate of the lower limit of
detection. Signals at this level can be slightly overestimated
and the error slightly underestimated because the signals
below zero are excluded from the calculation.
The most reliable Feature Extraction data is found in the
signal range where the signal increases linearly with the
concentration of the target.
Figure 41
114
1-color QC Report—Agilent SpikeIns: Log (Signal) vs.
Log (Relative concentration) Plot
Feature Extraction Reference Guide
QC Report Results
Spike-in Linearity Check for 1-color Gene Expression
2
Table of Values for Concentration-Response Plot (1-color only)
This table presents the values for the log signal vs. log
concentration plot shown in Figure 41.
Figure 42
1-color QC Report—Agilent Spike-In ConcentrationResponse Statistics
Detection of missing spike-ins
This section describes how Feature Extraction deals with
missing spike-ins.
Case 1. If the array has a Grid Template with NO SpikeIns
in the design,
• If standard protocol is run, then Feature Extraction will
give a Warning in the Summary Report that there are no
SpikeIn probes.
• If protocol has “SpikeIn Used” set to False, then the QC
metric table in the QC Report will show “-“ for values,
and black font (instead of red, green, or blue fonts)
indicating no evaluation has been done by Feature
Extraction. Specialized SpikeIn plots & tables will be
omitted from the report.
Feature Extraction Reference Guide
115
2
QC Report Results
Spike-in Linearity Check for 1-color Gene Expression
Case 2. If the array has a Grid Template WITH SpikeIns in
the design, but the user adds no SpikeIns to hyb,
• If standard protocol is run, the results will either be
wrong values or listed as “NA”.
• If the protocol has “SpikeIn Used” set to False then the
QC metric table in the QC Report will show “-“ for values,
and black font (instead of red, green, or blue fonts)
indicating no evaluation has been done by Feature
Extraction. Specialized SpikeIn plots & tables will be
omitted from the report.
How the curve and statistics are calculated
Curve fit equation All of the statistics in the table above are
calculated using a parameterized sigmoidal curve fit to the
data.
max – min
F x = min + --------------------------------------- – x – x0 w
1+e
where min is the level of signal for sequences with no
specifically bound target and max is the upper limit of
detection
where x0 is the center of the data and close to the center of
the linear range
where w is the width of the curve on either side of x0.
Curve fit calculations Before the calculations the following
assumptions are made:
• Saturation Point is fixed or close to scanner detection
limit. This value is Log(Scanner Saturation Value) =
4.82.
• The linear range of the curve, (x0-w) (x0+w), does not
define the dynamic range of the data as the data is
close to linear for higher multiples of w away from x0.
116
Feature Extraction Reference Guide
QC Report Results
Spike-in Linearity Check for 1-color Gene Expression
2
• The asymptotes for the max and the min are not
necessarily symmetric. The upper asymptote is a
function of scanner offset, and the lower asymptote is a
function of chemistry/scanner noise.
The calculations then follow this order:
a The Min is estimated by taking all the SpikeIn data and
for each sequence calculating the
BackgroundSubtracted-SignalAverage, the Median of the
Log of the processed Signals, StDev of the Log of the
processed Signals, the %CV of the processed signals.
The Median Log Proc Signal, %CV, StDev of the Log of
the processed signals all show up in the Agilent
SpikeIns Signal Statistics table of the QC report.
For each sequence, use the calculated BackgroundSubtractedSignalAverage and compare against the
StdDeviation of the Negative Controls
(StdDevBgSubSigNegCtrl) using the formula
BGSubAverage * MultErrorGreen >
StdDevBgSubSigNegCtrl. Exclude the Proc Signals that
fail this test, and use the median of the Proc Signals
for the remaining sequences as the initial guess.
b Max is estimated as Log(Scanner SaturationValue).
c x0 is estimated by starting with the y-value
(max+min)/2, then finding the 2 closest Med Log Proc
Signals above and below this point. Finding the
Log(concentrations) of those points and then computing
a slope and an intercept by
slope = (MedianLogProcSig[HIGH] –
MedianLogProcSig[LOW])/(LogConc[HIGH] –
LogConc[LOW]); intercept = LogConc[HIGH] – slope *
MedianLogProcSig[HIGH]
d w is estimated by using the slope calculated above. By
looking at the derivative of F(x) at x0 we get DF(x):x0
= (max-min)/4*w so w = 4*slope / (max – min).
e After the estimates are complete the data is fit and the
parameters (Min,Max, x0, w) are optimized by using a
parameterized curve fitting routine (called
Feature Extraction Reference Guide
117
2
QC Report Results
Spike-in Linearity Check for 1-color Gene Expression
Levenberg-Marquardt and is a standard technique
documented in Numerical Recipes in C on pages 683 –
688).
f After the curve fitting is done, the Low Relative
Concentration is calculated as x0 – 2.3*w.
g The High relative Concentration is calculated as x0 +
2.2*w.
h All the eQC points falling between x0 – 2.3*w and x0 +
2.2*w are then fit through a line with the Slope and
R-Squared value reported.
i All of the points with a concentration below Low
Concentration are used to calculate SpikeIn Detection
limit. For each probe, the mean and standard deviation
is calculated in linear BGSubSignal space. Then the
average plus 1 standard deviation is calculated for each
probe. The maximum of these is used. It is converted
to log10 space and reported as the SpikeIn Detection
Limit.
Relation of curve fit calculations to statistics in table In
summary, Table 16 presents descriptions of the statistics in
Figure 42, their definitions within the equation and their
output in the stats table.
Table 16
Spike-In Concentration-Response Statistics for 1-color microarrays
Statistic
Description
Where in calculations
Stats Table Output
Saturation Point
upper limit of detection
max-step b
eQCOneColorLogHighSignal
Low Threshold
lower limit of detection
min-step a
eQCOneColorLogLowSignal
Low Threshold Error
error for lower limit
See equation below table
eQCOneColorLogLowSignalError
Low Signal
lowest quantifiable signal
in linear range
lowest signal from linear
fit in step h
eQCOneColorLinFitLogLowSignal
High Signal
highest quantifiable signal
in linear range
highest signal from linear
fit in step h
eQCOneColorLinFitLogHighSignal
118
Feature Extraction Reference Guide
QC Report Results
Spike-in Linearity Check for 1-color Gene Expression
Table 16
2
Spike-In Concentration-Response Statistics for 1-color microarrays
Statistic
Description
Where in calculations
Stats Table Output
Low Relative Concentration
lowest concentration
leading to quantifiable
signal
x0-2.3w in step f
eQCOneColorLinFitLogLowConc
High Relative Concentration
highest concentration
leading to quantifiable
signal
x0+2.2w in step g
eQCOneColorLinFitLogHighConc
Slope
slope of the linear fit on
sigmoidal curve
from step h
eQCOneColorLinFitSlope
R^2 Value
correlation coefficient for
linear fit
from step h
eQCOneColorLinFitRSQ
SpikeIn Detection Limit
The average plus 1
standard deviation of the
spike ins below the linear
concentration range
from step i
eQCOneColorSpikeInDetectionLi
mit
LowThresholdError =
SD Log(ProcessedSignals)
2
A
where the set A is from step a in the table
Feature Extraction Reference Guide
119
2
QC Report Results
Spike-in Linearity Check for 1-color Gene Expression
Accuracy of linear fit to middle of sigmoidal curve Agilent
calculated the % difference between expected log processed
signals at the high and low relative concentrations on the
linear curve with the expected log signals for the same
concentrations on the sigmoidal curve.
For the high end of the linear range, the % difference is
15.36%.
For the low end of the linear range, the % difference is
16.75%.
120
Feature Extraction Reference Guide
QC Report Results
QC Report Results in the FEPARAMS and Stats Tables
2
QC Report Results in the FEPARAMS and Stats Tables
See “Parameters/options
(FEPARAMS)” on page 129 and
“Statistical results (STATS)” on
page 159 of this guide for
descriptions of the parameters and
statistics listed in the tables.
Feature Extraction Reference Guide
The FEPARAMS table contains most of the QC header
information. The Stats table output contains all the metrics
shown on the QC Reports. These QC stats let you make
“tracking” charts of individual metrics that you may want to
follow over time. To separate out the FEPARAMS and Stats
tables from each other and the FEATURES table, see the
Feature Extraction 12.0 User Guide.
121
2
QC Report Results
QC Metric Set Results
QC Metric Set Results
The figures in this section show the metric names and
default thresholds for the QC metric set results that appear
in the Evaluation Tables for each of the QC metric sets
available for Feature Extraction:
• CGH_QCMT_Date
• ChIP_QCMT_Date
• GE1_QCMT_Date
• GE2_QCMT_Date
• miRNA_QCMT_Date
You can display the QC Metric Set
Properties by double-clicking on a
QC metric set in the QC Metric Set
Browser.
where QCMT means QC Metrics with Thresholds, QCM
means QC Metrics without thresholds, and “Date” is the date
that the metric set was released from Agilent.
For details on the logic used for evaluating metrics, see
“Metric Evaluation Logic” on page 125.
CGH_QCMT_Jun14
Figure 43
122
QC Metrics for CGH_QCMT_Jun14 metric set
Feature Extraction Reference Guide
QC Report Results
ChIP_QCMT_Jun14
2
SNP probes are not used in calculation of any CGH QC
Metric.
ChIP_QCMT_Jun14
Figure 44
QC Metrics for ChIP_QCMT_Jun14 metric set
GE1_QCMT_Jun14
Figure 45
Feature Extraction Reference Guide
QC Metrics for GE1_QCMT_Jun14 metric set
123
2
QC Report Results
GE2_QCMT_Jun14
GE2_QCMT_Jun14
Figure 46
QC Metrics for GE2_QCMT_Jun14 metric set
miRNA_QCMT_Jun14
Figure 47
124
QC Metrics for miRNA_QCMT_Jun14 metric set
Feature Extraction Reference Guide
QC Report Results
Metric Evaluation Logic
2
Metric Evaluation Logic
For details on how to associate a
QC metric set with a protocol, see
the Feature Extraction User Guide.
When a QC metric set is associated with a protocol, it is
used to evaluate results using up to three defined threshold
values for given metrics. Results are then flagged in the QC
Report Evaluation Metrics table according to the logic
described in the following diagram and tables.
Figure 48 shows the metric evaluation using three threshold
levels. The black dots indicate how a result is evaluated if its
value is the same as a limit value.
Evaluate
Upper limit
Good
Upper warning
limit
Excellent
Lower warning
limit
Good
Lower limit
Evaluate
Figure 48
Three-level QC Metrics evaluation used for Feature Extraction
The following tables describe how results are evaluated using
up to three threshold levels.
Metric Evaluation Logic tables
In the following tables, evaluation metrics are described for
18 cases (IDs). Results are compared to four limit values,
shown in the “Limits used” table: upper limit, upper warning
limit, lower warning limit, and lower limit (v1 through v4).
The logic used is described in the center table, showing the
metric evaluation indication (Excellent, Good, Evaluate) that
Feature Extraction Reference Guide
125
2
QC Report Results
Metric Evaluation Logic
is based on how the result compares to the given limit
value(s). Cases covered indicate the type of threshold along
with the boundaries that are displayed in the QC Report.
(value > Upper limit) => Evaluate
(value > Upper Warning limit) and (value <= Upper limit) => Good
(value >= Lower Warning limit) and (value <= Upper warning limit) => Excellent
(value >= Lower limit) and (value < Lower Warning limit) => Good
(value < Lower limit) => Evaluate
Figure 49
126
QC Metrics evaluation tables and cases
Feature Extraction Reference Guide
Agilent Feature Extraction 12.0
Reference Guide
3
Text File Parameters and Results
Parameters/options (FEPARAMS) 129
FULL FEPARAMS Table 129
COMPACT FEPARAMS Table 150
QC FEPARAMS Table 153
MINIMAL FEPARAMS Table 156
Statistical results (STATS) 159
STATS Table (ALL text output types) 159
Feature results (FEATURES) 178
FULL Features Table 178
COMPACT Features Table 189
QC Features Table 194
MINIMAL Features Table 200
Other text result file annotations 204
Feature Extraction produces a tab-delimited text file that
contains three tables of input parameters and output results.
These tables are FEPARAMS, STATS, and FEATURES. These
three tables list all the possible parameters, statistics and
feature results that can be generated in the text output file.
FEPARAMS table
Contains input parameters and options used to run Feature
Extraction.
STATS table
Gives results derived from statistical calculations that apply
to all features on the microarray.
FEATURES table
Displays results for each feature in over 90 output columns,
such as gene name, log ratio, processed signal, mean signal,
or dye-normalized signal.
Agilent Technologies
127
3
Text File Parameters and Results
You have the option in the Project Properties sheet of
selecting to generate either the FULL set of parameters,
statistics and feature information, COMPACT, QC or
MINIMAL. COMPACT output package is the default.
The COMPACT output package contains only those columns
that are required by GeneSpring and DNA Analytics
software. The tables on the following pages present the text
file summary for all output package types (FULL, COMPACT,
QC, or MINIMAL).
N O TE
The parameters, statistical results, and feature results included vary
for any one output file, depending on the application and protocol used
for Feature Extraction.
You also have the option to generate one file with all three
tables or three separate files with one for each table. To
select to generate one file or three, see the Feature
Extraction 12.0 User Guide.
To display the text results file in an easy-to-read format, see
the Feature Extraction 12.0 User Guide.
128
Feature Extraction Reference Guide
Text File Parameters and Results
Parameters/options (FEPARAMS)
3
Parameters/options (FEPARAMS)
The top-most section of the result file contains the
parameters and option choices that you used to run Feature
Extraction.
FULL FEPARAMS Table
Table 17
List of parameters and options contained within the FULL text output file (FEPARAMS table)
Protocol Step
Parameters
Type/Options
Description
Protocol _Name
text
Name of protocol used
Protocol_date
text
Date the protocol was last modified
Scan_date
text
Date the image was scanned
Scan_ScannerName
text
Serial number of the scanner used
Scan_NumChannels
integer
Number of channels in the scan image
Scan_MicronsPerPixelX
float
Number of microns per pixel in the X axis of
the scan image
Scan_MicronsPerPixelY
float
Number of microns per pixel in the Y axis of
the scan image
Scan_OriginalGUID
text
The global unique identifier for the scan
image
Grid_Name
text
Grid template name or grid file name
Grid_Date
integer
Date the grid template or grid file was
created
Grid_NumSubGridRows
integer
Number of subgrid columns
Grid_NumSubGridCols
integer
Number of subgrid columns
Grid_NumRows
integer
Number of spots per row of each subgrid
Grid_NumCols
integer
Number of spots per column of each
subgrid
Feature Extraction Reference Guide
129
3
Text File Parameters and Results
FULL FEPARAMS Table
Table 17
List of parameters and options contained within the FULL text output file (FEPARAMS table)
Protocol Step
130
Parameters
Type/Options
Description
Grid_RowSpacing
float
Space between rows on the grid
Grid_ColSpacing
float
Space between column on the grid
Grid_OffsetX
float
In a dense pack array, the offset in the X
direction
Grid_OffsetY
float
In a dense pack array, the offset in the Y
direction
Grid_NomSpotWidth
float
Nominal width in microns of a spot from
grid
Grid_NomSpotHeight
float
Nominal height in microns of a spot from
grid
Grid_GenomicBuild
text
The build of the genome used to create the
annotation (if available). If the genome
build is not available (not all designs have
this information), then it is not put out. All
recent and all future designs have it.
FeatureExtractor_Barcode
text
Barcode of the Agilent microarray read
from the scan image
FeatureExtractor_Sample
text
Names of hybridized samples (red/green)
FeatureExtractor_ScanFileName
text
Name of the scan file used for Feature
Extraction
FeatureExtractor_ArrayName
text
Microarray filename
FeatureExtractor_DesignFileName
text
Design or grid file used for Feature
Extraction
FeatureExtractor_PrintingFileName
text
Print file (if available) used for Feature
Extraction
FeatureExtractor_PatternName
text
Agilent pattern file name
FeatureExtractor_ExtractionTime
text
Time stamp at the beginning of Feature
Extraction run for the extraction set
FeatureExtractor_UserName
text
Windows Log-In Name of the User who ran
Feature Extraction
Feature Extraction Reference Guide
Text File Parameters and Results
FULL FEPARAMS Table
Table 17
3
List of parameters and options contained within the FULL text output file (FEPARAMS table)
Protocol Step
Parameters
Type/Options
Description
FeatureExtractor_ComputerName
text
Computer name on which Feature
Extraction was run
FeatureExtractor_ScanFileGUID
text
GUID of the scan file
integer
Indicates whether or not the extraction
was an XDR extraction.
FeatureExtractor_IsXDRExtraction
1 = True
0 = False
DyeNorm_NormFilename
text
Name of the dye normalization list file
DyeNorm_NormNumProbes
integer
Number of probes in the dye normalization
list
Grid_IsGridFile
boolean
Indicates whether the grid is from a grid
file.
Scan_NumScanPass
1 or 2
For 5 micron scans, indicates whether the
scan mode was a single (1) or double-pass
scan mode on the Agilent Scanner.
Place Grid
GridPlacement_Version
text
Version of the grid placement algorithm
Place Grid
GridPlacement_ArrayFormat
integer
Choices for grid placement based on the
format of the image. Choices include:
Automatically Determine
Single Density (11k, 22k)
Double Density (44k)
95k
185 (5 and 10 uM)
65 micron (5 and 10 uM)
30 micron single pack
30 micron multi pack
244 (5 and 10 uM)
25k
Third Party
Feature Extraction Reference Guide
131
3
Text File Parameters and Results
FULL FEPARAMS Table
Table 17
List of parameters and options contained within the FULL text output file (FEPARAMS table)
Protocol Step
Parameters
Place Grid
GridPlacement_enableOriginXCal
Type/Options
Description
integer
Indicates status of the Use the correlation
method to obtain origin X of subgrids flag
1 = True
0 = False
Place Grid
GridPlacement_enableUseCentralPack
integer
1 = True
Indicates status of the Use central part of
pack for slope and skew calculation flag
0 = False
Place Grid
Optimize Grid Fit
GridPlacement_placementMode
IterativeSpotFind_CornerAdjust
integer
Mode of grid placement
0
Allow the grid to distort
1
Place the grid rigidly allowing only
translation and rotation
integer
Indicates whether or not the grid will be
adjusted for better fit by looking at corner
spots on the microarray
0 = False
1 = True
Optimize Grid Fit
IterativeSpotFind_AdjustThreshold
float
Grid will be adjusted if absolute average
difference between grid and spot positions
is greater than this fraction
Optimize Grid Fit
IterativeSpotFind_MaxIterations
integer
Maximum number of times spot finder
algorithm is run to optimize the grid fit
Optimize Grid Fit
IterativeSpotFind_FoundSpot
Threshold
float
Grid will be adjusted if this fraction or more
of the features are considered found by the
spot finder algorithm
Optimize Grid Fit
IterativeSpotFind_NumCornerFeatures
integer
Indicates the square area of features in
each corner of the microarray to be used to
calculate the average difference
Find Spots
SpotAnalysis_Version
text
Version of the spot analysis algorithm
Find Spots
SpotAnalysis_weakthresh
float
Minimum difference between the average
intensities of feature and background after
Kmeans Initialization
Find Spots
SpotAnalysis_MinimumNumPixels
integer
Minimum number of pixels required for the
spot analysis
132
Feature Extraction Reference Guide
Text File Parameters and Results
FULL FEPARAMS Table
Table 17
3
List of parameters and options contained within the FULL text output file (FEPARAMS table)
Protocol Step
Parameters
Type/Options
Description
Find Spots
SpotAnalysis_RegionOfInterest
Multiplier
float
Multiplier that defines how big the Region
of Interest (ROI) is in terms of nominal spot
spacing
Find Spots
SpotAnalysis_convergence_factor
float
Convergence factor of KMeans algorithm
Find Spots
SpotAnalysis_max_em_iter
integer
Maximum number of iterations of the
Bayesian Classification
Find Spots
SpotAnalysis_max_reject_ratio
float
Maximum fraction of pixels to be rejected
while software performs spotfinding
Find Spots
SpotAnalysis_kmeans_rad_reject_
factor
float
Factor that defines how much individual
spot size may vary relative to the nominal
spot size
Find Spots
SpotAnalysis_kmeans_cen_reject_
factor
float
Factor that defines how far the actual
centroid may move relative to its nominal
grid position (in terms of nominal radius).
In the protocol this parameter is called the
Spot Deviation Limit.
Find Spots
SpotAnalysis_kmeans_moi_reject_
factor
float
Maximum allowable moment of inertia of
the spot
Find Spots
SpotAnalysis_isspot_factor
float
Factor from the statistics of the found
feature and background that indicates if
the spot is a spot.
Find Spots
SpotAnalysis_isweakspot_factor
float
Factor from the statistics of the found
feature and background that indicates if
the spot is a strong one.
Find Spots
SpotAnalysis_BackgroundThreshold
float
Factor by which the individual spot
background may vary from the running
average of all the background means.
Find Spots
SpotAnalysis_ROIType
integer
Type of Region of Interest
Feature Extraction Reference Guide
133
3
Text File Parameters and Results
FULL FEPARAMS Table
Table 17
List of parameters and options contained within the FULL text output file (FEPARAMS table)
Protocol Step
Parameters
Type/Options
Description
Find Spots
SpotAnalysis_UseNominalDiameter
FromGT
integer
If True, the nominal spot diameter from the
grid template is used as a starting point for
final spot diameter computation.
1 = True
0 = False
Find Spots
SpotAnalysis_RejectMethod
If False, the nominal diameter is obtained
from the grid placement algorithm.
integer
0
Pixel Outlier Rejection turned off
2
Standard Deviation based
3
Interquartile Range based
Find Spots
SpotAnalysis_StatBoundFeat
float
Multiplier parameters for feature outlier
rejection method as selected above
Find Spots
SpotAnalysis_StatBoundBG
float
Multiplier parameters for background
outlier rejection method as selected above
Find Spots
SpotAnalysis_SpotStatsMethod
integer
Different algorithms to calculate spot
statistics
1
CookieCutter method
2
Whole Spot method
Find Spots
SpotAnalysis_CookiePercentage
float
The fraction of the nominal radius used to
draw the cookie around the centroid of
each spot
Find Spots
SpotAnalysis_ExclusionZone
Percentage
float
The outer radius of the exclusion zone
based on nominal spot size
Find Spots
SpotAnalysis_EstimateLocalRadius
integer
The option to calculate the outer radius of
the local background based on row and
column spacing
1 = True
0 = False
Find Spots
134
SpotAnalysis_LocalBGRadius
float
The outer radius of the local background
supplied from the protocol if
EstimateLocalRadius is not selected
Feature Extraction Reference Guide
Text File Parameters and Results
FULL FEPARAMS Table
Table 17
3
List of parameters and options contained within the FULL text output file (FEPARAMS table)
Protocol Step
Parameters
Type/Options
Description
Find Spots
SpotAnalysis_SignalMethod
integer
The option for the statistical method for
determining signals from features: either
mean (and standard deviation) or median
(and normalized IQR).
Mean is 1 and Median is 2.
Find Spots
SpotAnalysis_ComputePixelSkew
integer
true = 1
false = 0
Find Spots
SpotAnalysis_PixelSkewCookiePct
Find Spots
SpotAnalysis_CentroidDiff
float
(0.00-1.00;
0.70 default)
The percentage of the feature that should
be used when calculating the pixel skew. A
value of .70 means 70% of the radius of the
feature.
Integer
The software computes the per feature
Centroid Difference between the Grid
position and the Spot Center.
1 = True
0 = False
Find Spots
SpotAnalysis_NozzleAdjust
Integer
1 = True
0 = False
Flag Outliers
OutlierFlagger_Version
Flag Outliers
OutlierFlagger_NonUnifOLOn
The option to set whether the program
computes and shows the skew of each
feature. Default is false.
text
The software attempts to adjust a nozzle
group in order to compensate for variations
in printing.
Version of Outlier Flagger algorithm
integer
1 = True
NonUniformity Outlier flagging turned on
0 = False
NonUniformity Outlier flagging turned off
Flag Outliers
OutlierFlagger_FeatATerm
float
Applies to feature: specifies the intensity
dependent variance and is set to the
square of the CV
Flag Outliers
OutlierFlagger_FeatBTerm
float
Applies to feature: specifies the variance
due to the Poisson distributed noise
Feature Extraction Reference Guide
135
3
Text File Parameters and Results
FULL FEPARAMS Table
Table 17
List of parameters and options contained within the FULL text output file (FEPARAMS table)
Protocol Step
Parameters
Type/Options
Description
Flag Outliers
OutlierFlagger_FeatCTerm
float
Applies to feature: specifies variance due
to background noise of the scanner, slide
glass, and other signal-independent
sources
Flag Outliers
OutlierFlagger_BGATerm
float
Applies to background: specifies the
intensity-dependent variance and is set to
the square of the CV
Flag Outliers
OutlierFlagger_BGBTerm
float
Applies to background: specifies the
variance due to the Poisson distributed
noise
Flag Outliers
OutlierFlagger_BGCTerm
float
Applies to background: specifies variance
due to background noise of the scanner,
slide glass, and other signal-independent
sources
Flag Outliers
OutlierFlagger_OLAutoComputeABC
integer
1 = True
AutoCompute Outlier flagging turned on
0 = False
AutoCompute Outlier flagging turned off
For Agilent protocols when this flag is
turned on, the polynomial is calculated
automatically. This means that all above
Feature and BG terms for B and C no longer
appear in the output. Rather, they are
calculated automatically and appear in the
STATS table. Also, the eight parameters
following this row appear.
Flag Outliers
OutlierFlagger_FeatBCoeff
float
Feature: Red Poissonian Noise Term
Multiplier
Flag Outliers
OutlierFlagger_FeatCCoeff
float
Feature: Red Signal Constant Term
Multiplier
Flag Outliers
OutlierFlagger_FeatBCoeff2
float
Feature: Green Poissonian Noise Term
Multiplier
136
Feature Extraction Reference Guide
Text File Parameters and Results
FULL FEPARAMS Table
Table 17
3
List of parameters and options contained within the FULL text output file (FEPARAMS table)
Protocol Step
Parameters
Type/Options
Description
Flag Outliers
OutlierFlagger_FeatCCoeff2
float
Feature: Green Signal Constant Term
Multiplier
Flag Outliers
OutlierFlagger_BGBCoeff
float
Background: Red Poissonian Noise Term
Multiplier
Flag Outliers
OutlierFlagger_BGCCoeff
float
Background: Red Signal Constant Term
Multiplier
Flag Outliers
OutlierFlagger_BGBCoeff2
float
Background: Green Poissonian Noise Term
Multiplier
Flag Outliers
OutlierFlagger_BGCCoeff2
float
Background: Green Signal Constant Term
Multiplier
Flag Outliers
OutlierFlagger_PopnOLOn
integer
1 = True
Population Outlier flagging turned on
0 = False
Population Outlier flagging turned off
Flag Outliers
OutlierFlagger_MinPopulation
integer
Minimum number of replicates to turn on
population outlier flagging
Flag Outliers
OutlierFlagger_IQRatio
float
The boundary conditions for conducting
box-plot analysis to isolate population
outliers
Flag Outliers
OutlierFlagger_BackgroundIQRatio
float
The boundary conditions for conducting
box-plot analysis to isolate population
outliers for the background
Flag Outliers
OutlierFlagger_Use Qtest
integer
Enables Qtest statistics when the minimum
number of replicates for population outliers
is greater than 2 and less than the
minimum population specified in the outlier
section of the protocol.
1 = True
0 = False
Flag Outliers
OutlierFlagger_UsePopnOLInMAGE
integer
1 = True
Indicates whether to report population
outliers as “Failed” in MAGEML output
0 = False
Feature Extraction Reference Guide
137
3
Text File Parameters and Results
FULL FEPARAMS Table
Table 17
List of parameters and options contained within the FULL text output file (FEPARAMS table)
Protocol Step
Parameters
Type/Options
Description
Compute Bkgd,
Bias and Error
BGSubtractor_MultiplicativeDetrend
On
integer
Enables multiplicative detrending.
1 = True
0 = False
1-color and CGH microarray protocols have
this parameter enabled.
integer
No filtering
0
Average filtering
1
Median filtering
Compute Bkgd,
Bias and Error
BGSubtractor_MultDetrendWinFilter
2
Compute Bkgd,
Bias and Error
BGSubtractor_MultDetrendIncrement
integer
The increment in number of features by
which the square window is shifted
horizontally and vertically on the
microarray.
Compute Bkgd,
Bias and Error
BGSubtractor_MultDetrendWindow
integer
Specifies size of the square window by the
number of rows and columns. The
specified percentage of low intensity
features is selected from this window size.
Compute Bkgd,
Bias and Error
BGSubtractor_MultDetrendNeighborhoodSize
float
[0-1]
Specifies the fraction of total number of
neighborhood data points that will be
weighted for linear regression during
surface fitting for each data point
Compute Bkgd,
Bias and Error
BGSubtractor_MultHighPassFilter
integer
Enables rejection of probes close to
1 = True
zero signal from the set of features used in
the fit.
0 = False
Compute Bkgd,
Bias and Error
BGSubtractor_PolynomialMultiplicativeDetrend
integer
1 = True
0 = False
Compute Bkgd,
Bias and Error
138
BGSubtractor_NegCtrlThresholdMultD
etrendFactor
float
The option to use a polynomial surface fit
method for the multiplicative detrending fit
(rather than LOESS).
This factor multiplies the negative control
spread to determine the threshold signal
below which low intensity features are
filtered out of the multiplicative detrending
fit set.
Feature Extraction Reference Guide
Text File Parameters and Results
FULL FEPARAMS Table
Table 17
3
List of parameters and options contained within the FULL text output file (FEPARAMS table)
Protocol Step
Parameters
Type/Options
Description
Compute Bkgd,
Bias and Error
BGSubtractor_PolynomialMultiplicativeDetrendDegree
integer
Shows the degree of the polynomial fit
used for the multiplicative detrending. The
most common choices are 2 (quadratic or
2nd order surface) and 4 (4th order
surface).
Compute Bkgd,
Bias and Error
BGSubtractor_TestMultDetrendOnCVs
integer
Tests whether the replicate CVs improve
(i.e. decrease) after multiplicative
detrending. If this choice is 1=True, and the
replicate CVs don't improve, Feature
Extraction doesn't use the multiplicative
detrending for that array.
Compute Bkgd,
Bias and Error
BGSubtractor_MultDetrendOn
Replicates
integer
Specifies to use only replicated probes
(with multiple features) normalized to their
replicate average for the multiplicative
detrending set.
[-1, 5]
1 = True
0 = False
Compute Bkgd,
Bias and Error
BGSubtractor_BGSubMethod
Feature Extraction Reference Guide
integer
1
Either minimum feature or minimum local
background across the microarray for
background subtraction (global method)
2
Average of local backgrounds for
background subtraction (global method)
3
Average of negative controls for
background for background subtraction
(global method)
5
Local background corresponding to each
feature for background subtraction (local
method)
6
Minimum feature across the microarray for
background subtraction (global method)
7
No background subtraction
139
3
Text File Parameters and Results
FULL FEPARAMS Table
Table 17
List of parameters and options contained within the FULL text output file (FEPARAMS table)
Protocol Step
Parameters
Type/Options
Description
Compute Bkgd,
Bias and Error
BGSubtractor_MaxPVal
float
The pValue at which a feature is
determined to be statistically significant
above background
Compute Bkgd,
Bias and Error
BGSubtractor_WellAboveMulti
float
The number of standard deviations above
background at which the feature is flagged
as well above background
Compute Bkgd,
Bias and Error
BGSubtractor_BackgroundCorrectionO
n
integer
Compute Bkgd,
Bias and Error
BGSubtractor_BgCorrectionOffset
Compute Bkgd,
Bias and Error
BGSubtractor_CalculateSurface
MetricsOn
Compute Bkgd,
Bias and Error
Compute Bkgd,
Bias and Error
BGSubtractor_SpatialDetrendOn
BGSubtractor_DetrendLowPassFilter
1 = True
Globally adjust background turned on
0 = False
Globally adjust background turned off
Adjust the signal of all features by an offset
constant so that very low signal features
end up at this offset. Appears when
Globally adjust background is turned on.
integer
1 = True
Surface fit is done and metrics calculated.
0 = False
Surface fit and metrics are not done.
integer
1 = True
Spatial detrend turned on
0 = False
Spatial detrend turned off
integer
1 = True
Low pass filter used
0 = False
Low pass filter not used
Compute Bkgd,
Bias and Error
BGSubtractor_DetrendLowPass
Percentage
integer
Specifies percentage of features based on
the lowest intensity probes in each window
that will be used to fit the surface
Compute Bkgd,
Bias and Error
BGSubtractor_DetrendLowPass
Window
integer
Specifies size of the square window by the
number of rows and columns. The
specified percentage of low intensity
features is selected from this window size.
140
Feature Extraction Reference Guide
Text File Parameters and Results
FULL FEPARAMS Table
Table 17
3
List of parameters and options contained within the FULL text output file (FEPARAMS table)
Protocol Step
Parameters
Type/Options
Description
Compute Bkgd,
Bias and Error
BGSubtractor_DetrendLowPass
Increment
integer
The increment in number of features by
which the above window is shifted
horizontally and vertically on the
microarray
Compute Bkgd,
Bias and Error
BGSubtractor_NegCtrlSpreadCoeff
float
The number of multiples of the negative
control spread that defines the signal range
within which features are considered to be
within the negative control range for
“FeaturesInNegativeControlRange”
background detrend option.
Compute Bkgd,
Bias and Error
BGSubtractor_NegCtrlSpreadRobust
On
float
Specifies to remove negative control
features that are outliers before calculating
the negative control spread for use with
FeaturesInNegativeControlRange.
Compute Bkgd,
Bias and Error
BGSubtractor_AdditiveDetrend
FeatureSet
integer
Determines which features are considered
for the surface fit set
0
All inlier features
1
Negative control inliers only
2
Features in negative control range
float
Specifies the fraction of total number of
neighborhood data points that will be
weighted for linear regression during
surface fitting for each data point
integer
Decides whether the error model or pixel
staistics are used to determine Positive
and Significance calls and
WellAboveBackground.
Compute Bkgd,
Bias and Error
BGSubtractor_DetrendNeighborhood
Size
Compute Bkgd,
Bias and Error
BGSubtractor_ErrModelSignificance
0 = pixel
statistics
1 = error
model
Feature Extraction Reference Guide
141
3
Text File Parameters and Results
FULL FEPARAMS Table
Table 17
List of parameters and options contained within the FULL text output file (FEPARAMS table)
Protocol Step
Parameters
Compute Bkgd,
Bias and Error
BGSubtractor_RobustNCStats
Type/Options
Description
integer
Specifies if a variation in the population
algorithm is turned on. This algorithm
repeats the population outlier IQR
algorithm on all features classified as
negative controls, after the first pass of
population algorithm has been run on each
sequence.
1 = True
0 = False
You may want to use this algorithm when
you see “hot” features that have not been
flagged as population outliers or “hot”
sequences where all features of the
sequence have higher signals than those in
other negative control sequences.
Compute Bkgd,
Bias and Error
BGSubtractor_RobustNCOutlierFactor
float
To calculate robust IQR statistics, the
algorithm uses upper and lower limits that
contain a (Multiplier x IQR) term. This
parameter is the Multiplier.
Compute Bkgd,
Bias and Error
BGSubtractor_ErrorModel
integer
Choose universal error, or the most
conservative
2
Universal Error Model
0
Most Conservative
Compute Bkgd,
Bias and Error
BGSubtractor_MultErrorGreen
float
Multiplicative error component in Green
channel
Compute Bkgd,
Bias and Error
BGSubtractor_MultErrorRed
float
Multiplicative error component in Red
channel
Compute Bkgd,
Bias and Error
BGSubtractor_AutoEstimateAddErrorG
reen
integer
Compute Bkgd,
Bias and Error
142
BGSubtractor_AutoEstimateAddErrorR
ed
1 = True
Auto-estimation turned on
0 = False
Auto-estimation turned off
integer
1 = True
Auto-estimation turned on
0 = False
Auto-estimation turned off
Feature Extraction Reference Guide
Text File Parameters and Results
FULL FEPARAMS Table
Table 17
3
List of parameters and options contained within the FULL text output file (FEPARAMS table)
Protocol Step
Parameters
Type/Options
Description
Compute Bkgd,
Bias and Error
BGSubtractor_AddErrorGreen
float
This additive error component in the green
channel is entered in the protocol when
auto-estimation is turned off. When
auto-estimation is turned on, the estimated
error value appears in the Stats table as
AddErrorEstimateGreen.
Compute Bkgd,
Bias and Error
BGSubtractor_AddErrorRed
float
This additive error component in the red
channel is entered in the protocol when
auto-estimation is turned off. When
auto-estimation is turned on, the estimated
error value appears in the Stats table as
AddErrorEstimateRed.
Compute Bkgd,
Bias and Error
BGSubtractor_MultNcAutoEstimate
float
Multiplier for the first term (standard
deviation of the inlier negative control) in
the additive error equation.
Compute Bkgd,
Bias and Error
BGSubtractor_MultRMSAutoEstimate
Compute Bkgd,
Bias and Error
BGSubtractor_MultResidualsRMSAuto float
Estimate
[0-10]
Multiplier for the third term in the additive
error equation.
Compute Bkgd,
Bias and Error
BGSubtractor_AutoEstimateNCOnly
Thresh
float
This parameter is for single density 8-pack
microarrays where Feature Extraction may
not be able to accurately subtract the
background using the spatial detrending
method. This parameter provides a
minimum number of features needed for
the software to use the residual or the RMS
to estimate the additive error. It comes up
only if using low density 8-pack
microarrays.
Compute Bkgd,
Bias and Error
BGSubtractor_UseSurrogates
integer
Flag indicating the use of surrogates
1 = True
Use of surrogates turned on
0 = False
Use of surrogates turned off
[0-10]
float
[0-10]
Feature Extraction Reference Guide
Multiplier for the second term
(gMultSpatialDetrendRMSFit) in the
additive error equation.
143
3
Text File Parameters and Results
FULL FEPARAMS Table
Table 17
List of parameters and options contained within the FULL text output file (FEPARAMS table)
Protocol Step
Parameters
Type/Options
Description
Compute Bkgd,
Bias and Error
BGSubtractor_Version
text
Version of BGSubtractor algorithm
text
Version of DyeNorm algorithm
Correct Dye Biases DyeNorm_Version
Correct Dye Biases DyeNorm_UseDyeNormList
Correct Dye Biases DyeNorm_SelectMethod
Correct Dye Biases DyeNorm_ArePosNegCtrlsOK
Correct Dye Biases DyeNorm_SignalCharacteristics
Correct Dye Biases DyeNorm_CorrMethod
integer
0
Automatically determine
1
True
2
False
integer
Method for selecting features used for
measurement of dye bias:
4
Use All Probes
5
Use List of Normalization Genes
6
Use Rank Consistent Probes
7
Use Rank Consistent List of Normalization
Genes
integer
1 = True
Use positive and negative controls for dye
normalization.
0 = False
Do not use these controls.
integer
1
Only positive and significant signals
2
All positive signals
3
All negative and positive signals
integer
Methods for computation of dye
normalization factor to remove dye bias
0
Linear
1
Linear&LOWESS (locally weighted linear
regression preceded by linear scaling in
each dye channel)
2
144
LOWESS (locally weighted linear
regression)
Feature Extraction Reference Guide
Text File Parameters and Results
FULL FEPARAMS Table
Table 17
3
List of parameters and options contained within the FULL text output file (FEPARAMS table)
Protocol Step
Parameters
Type/Options
Description
Correct Dye Biases DyeNorm_LOWESSSmoothFactor
float
Smoothing parameter (Neighborhood size)
for LOWESS curve fitting
Correct Dye Biases DyeNorm_LOWESSNumSteps
integer
Number of iterations in LOWESS
Correct Dye Biases DyeNorm_RankTolerance
float
The threshold to pick rank consistent
features between 2 channels for measuring
dye biases
integer
Allows the rank tolerance to vary with
signal level to allow a fixed percentage of
the data to be considered rank consistent.
Correct Dye Biases DyeNorm_VariableRankTolerance
1 = True
0 = False
Correct Dye Biases DyeNorm_MaxRankedSize
Correct Dye Biases DyeNorm_IsBGPopnOLOn
integer
The limit on the number of points used for
the dye normalization set. If the number is
greater than this, a random subset is
chosen using this number of points.
integer
1 = True
Software excludes any features from the
dye normalization set if the local
backgrounds associated with those
features have been flagged as population
outliers (in either channel).
The default recommendation is False.
0 = False
Compute Ratios
Ratio_Version
text
Version of Ratio algorithm
Compute Ratios
Ratio_PegLogRatioValue
float
Both positive and negative log ratio values
are capped to this absolute value
miRNA Analysis
miRNA_Analysis_OutputGeneView
integer
miRNA Analysis
miRNA Analysis
miRNA_Analysis_EffectiveFeatSizeOn
miRNA_Analysis_MaxFeatToCompEffe
ctiveFeatSize
Feature Extraction Reference Guide
1 = True
Output Geneview File
0 = False
Don’t output Geneview File
integer
1 = True
Enable to analyze by effective feature size.
0 = False
Disable analysis by effective feature size.
integer
Maximum number of features
145
3
Text File Parameters and Results
FULL FEPARAMS Table
Table 17
List of parameters and options contained within the FULL text output file (FEPARAMS table)
Protocol Step
Parameters
Type/Options
Description
miRNA Analysis
miRNA_Analysis_MinNumRatiosToCo
mpEffectiveFeatSize
integer
Maximum number of ratios
miRNA Analysis
miRNA_Analysis_LowSigPctileToComp float
EffectiveFeatSize
Low Signal Percentile
miRNA Analysis
miRNA_Analysis_HighSigPctileToCom
pEffectiveFeatSize
float
High Signal Percentile
miRNA Analysis
miRNA-Analysis_HighRatioCutOff
float
Throw away ratios greater than this value
miRNA Analysis
miRNA_Analysis_DefEffectiveFeatSize
Frac
float
miRNA Analysis
miRNA_Analysis_MinNoiseMultToCo
mpEffectiveFeatSize
float
Minimum Noise Multiplier
miRNA Analysis
miRNA_Analysis_IsDetectedMulti
float
Configures the IsProbeDetected Multiplier
in the miRNA algorithm
miRNA Analysis
miRNA_Analysis_MinimumTotalGeneS float
ignal
Configures the Default Total Gene Signal if
all probes are not detected. Used if the non
detected probes are excluded from the
calculation.
miRNA Analysis
miRNA_Analysis_ExcludeNonDetecte
dProbes
integer
Changes how the Total Gene Signal is
calculated. If a Total Probe Signal is not
detected, then it is not added to the Total
Gene Signal. If a probe that is associated
with an miRNA isn’t detected because it
fails its IsProbeDetected flag then, if this
option is true, it will not contribute to the
totalGeneSignal and its error will not
propagate to the totalGeneError.
1 = True
Exclude non detected probes from analysis
0 = False
Include non detected probes in analysis
(Results will be same as Feature Extraction
v10.5)
146
Feature Extraction Reference Guide
Text File Parameters and Results
FULL FEPARAMS Table
Table 17
3
List of parameters and options contained within the FULL text output file (FEPARAMS table)
Protocol Step
Parameters
Type/Options
Description
miRNA Analysis
miRNA_Analysis_PropagateTotalGene
SignalError
integer
Use this if and only if the all the probes are
not detected and the non detected probes
are excluded from the calculation (see
option above). If true, Total Gene Signal
Error is calculated as if all probes were
included. Invalidates Default Total Gene
Signal.
1 = True
0 = False
Calculate Metrics
QCMetrics_UseSpikeIns
integer
1 = True
Use SpikeIns
0 = False
Do not use SpikeIns
Calculate Metrics
QCMetrics_minReplicatePopulation
integer
Minimum number of replicates necessary
to calculate replicate statistics
Calculate Metrics
QCMetrics_differentialExpression
PValue
float
The pValue to use to look for differentially
expressed genes
Calculate Metrics
QCMetrics_MaxEdgeDefect
Threshold
float
Maximum allowable fraction of features
along any edge of the microarray that are
non-uniform before a grid placement
warning is given.
Calculate Metrics
QCMetrics_MaxEdgeNotFound
Threshold
float
Maximum allowable fraction of features
along any edge of the microarray that are
not found before a grid placement warning
is given.
Calculate Metrics
QCMetrics_MaxLocalBGNonUnif
Threshold
float
Maximum allowable fraction of the local
background regions on the microarray that
are flagged as NonUniform before a grid
placement warning is given.
Calculate Metrics
QCMetrics_MinNegCtrlSDev
float
Minimum value for the standard deviation
for the negative controls
Calculate Metrics
QCMetrics_MinReproducibility
float
Minimum value for the reproducibility
Feature Extraction Reference Guide
147
3
Text File Parameters and Results
FULL FEPARAMS Table
Table 17
List of parameters and options contained within the FULL text output file (FEPARAMS table)
Protocol Step
Parameters
Calculate Metrics
QCMetrics_Formulation
Type/Options
Description
integer
The SpikeIn formulation to use for the
SpikeIn Calculation. Different formulations
will yield different expected values and
different concentration values.
1 = TwoColor
2 = OneColor
3 = CGH
Calculate Metrics
QCMetrics_EnableDyeFlip
integer
1 = True
2 = False
Calculate Metrics
QCMetrics_PercentileValuefor Signal
float
The PercentileIntensitySignal is calculated
by the software on the
[r,g]ProcessedSignal showing the signal at
a given percentile over the NonControl
features. This parameter is the percentile
used for the calculation. By default the
value is set to 75; the software generates
the 75% Signal value of the
ProcessedSignals for all channels
available.
FeatureExtractor_Version
text
Version of Feature Extractor
FeatureExtractor_SingleTextFile
Output
integer
1 = True
0 = False
FeatureExtractor_JPEGDownSample
Factor
FeatureExtractor_ColorMode
148
If True (default), the sign of the slope for
the spikeIns plot and its trend will be
changed when the slope is detected to
have the wrong sign. This means the
labelling was intentionally flipped and must
be flipped back.
The system prints the three tables
(FEParams, Stats and Features) are printed
in the same text file.
The system prints each of the three tables
in separate text files.
float
Factor by which the image is scaled down
and then converted to the JPEG format.
Must be at least 2; 1 is no longer allowed.
integer
A flag to indicate output color
0
One color; green only
1
2-color
2
One color: red only
Feature Extraction Reference Guide
Text File Parameters and Results
FULL FEPARAMS Table
Table 17
3
List of parameters and options contained within the FULL text output file (FEPARAMS table)
Protocol Step
Parameters
FeatureExtractor_QCReportType
FeatureExtractor_OutputQCReport
GraphText
Type/Options
Description
integer
Type of QC report to generate
0
Gene Expression
1
CGH_ChIP
2
miRNA
4
Streamlined CGH
integer
Generate output details on QC report
graphs
1 = True
0 = False
Feature Extraction Reference Guide
149
3
Text File Parameters and Results
COMPACT FEPARAMS Table
COMPACT FEPARAMS Table
Table 18
List of parameters and options contained within the COMPACT text output file (FEPARAMS table)
Protocol Step
150
Parameters
Type/Options
Description
Protocol _Name
text
Name of protocol used
Protocol_date
text
Date the protocol was last modified
Scan_ScannerName
text
Agilent scanner serial number used
Scan_NumChannels
integer
Number of channels in the scan image
Scan_date
text
Date the image was scanned
Scan_MicronsPerPixelX
float
Number of microns per pixel in the X axis of
the scan image
Scan_MicronsPerPixelY
float
Number of microns per pixel in the Y axis of
the scan image
Scan_OriginalGUID
text
The global unique identifier for the scan
image
Scan_NumScanPass
1 or 2
For 5 micron scans, indicates whether the
scan mode was a single (1) or double-pass
scan mode on the Agilent Scanner.
Grid_Name
text
Grid template name or grid file name
Grid_Date
integer
Date the grid template or grid file was
created
Grid_NumSubGridRows
integer
Number of subgrid columns
Grid_NumSubGridCols
integer
Number of subgrid columns
Grid_NumRows
integer
Number of spots per row of each subgrid
Grid_NumCols
integer
Number of spots per column of each
subgrid
Grid_RowSpacing
float
Space between rows on the grid
Grid_ColSpacing
float
Space between column on the grid
Grid_OffsetX
float
In a dense pack array, the offset in the X
direction
Feature Extraction Reference Guide
Text File Parameters and Results
COMPACT FEPARAMS Table
Table 18
3
List of parameters and options contained within the COMPACT text output file (FEPARAMS table)
Protocol Step
Parameters
Type/Options
Description
Grid_OffsetY
float
In a dense pack array, the offset in the Y
direction
Grid_NomSpotWidth
float
Nominal width in microns of a spot from
grid
Grid_NomSpotHeight
float
Nominal height in microns of a spot from
grid
Grid_GenomicBuild
text
The build of the genome used to create the
annotation (if available). If the genome
build is not available (not all designs have
this information), then it is not put out. All
recent and all future designs have it.
FeatureExtractor_Barcode
text
Barcode of the Agilent microarray read
from the scan image
FeatureExtractor_Sample
text
Names of hybridized samples (red/green)
FeatureExtractor_ScanFileName
text
Name of the scan file used for Feature
Extraction
FeatureExtractor_ArrayName
text
Microarray filename
FeatureExtractor_ScanFileGUID
text
GUID of the scan file
FeatureExtractor_DesignFileName
text
Design or grid file used for Feature
Extraction
FeatureExtractor_ExtractionTime
text
Time stamp at the beginning of Feature
Extraction
FeatureExtractor_UserName
text
Windows Log-In Name of the User who ran
Feature Extraction
FeatureExtractor_ComputerName
text
Computer name on which Feature
Extraction was run
FeatureExtractor_Version
text
Version of Feature Extractor
integer
Says if result is from an XDR extraction
FeatureExtractor_IsXDRExtraction
1 = True
0 = False
Feature Extraction Reference Guide
151
3
Text File Parameters and Results
COMPACT FEPARAMS Table
Table 18
List of parameters and options contained within the COMPACT text output file (FEPARAMS table)
Protocol Step
Parameters
Type/Options
Description
FeatureExtractor_ColorMode
integer
A flag to indicate output color
0
One color; green only
1
2-color
FeatureExtractor_QCReportType
152
integer
Type of QC report to generate
0
Gene Expression
1
CGH_ChIP
2
miRNA
4
Streamlined CGH
DyeNorm_NormFilename
text
Name of the dye normalization list file
DyeNorm_NormNumProbes
integer
Number of probes in the dye normalization
list
Grid_IsGridFile
boolean
Feature Extraction Reference Guide
Text File Parameters and Results
QC FEPARAMS Table
3
QC FEPARAMS Table
Table 19
Protocol Step
List of parameters and options contained within the QC text
output file (FEPARAMS table)
Parameters
Type/Options
Description
Protocol _Name
text
Name of protocol used
Protocol_date
text
Date the protocol was last modified
Scan_ScannerName
text
Agilent scanner serial number used
Scan_NumChannels
integer
Number of channels in the scan image
Scan_date
text
Date the image was scanned
Scan_MicronsPerPixelX
float
Number of microns per pixel in the X axis of
the scan image
Scan_MicronsPerPixelY
float
Number of microns per pixel in the Y axis of
the scan image
Scan_OriginalGUID
text
The global unique identifier for the scan
image
Scan_NumScanPass
1 or 2
For 5 micron scans, indicates whether the
scan mode was a single (1) or double-pass
scan mode on the Agilent Scanner.
Grid_Name
text
Grid template name or grid file name
Grid_Date
integer
Date the grid template or grid file was
created
Grid_NumSubGridRows
integer
Number of subgrid columns
Grid_NumSubGridCols
integer
Number of subgrid columns
Grid_NumRows
integer
Number of spots per row of each subgrid
Grid_NumCols
integer
Number of spots per column of each
subgrid
Grid_RowSpacing
float
Space between rows on the grid
Grid_ColSpacing
float
Space between column on the grid
Feature Extraction Reference Guide
153
3
Text File Parameters and Results
QC FEPARAMS Table
Protocol Step
Parameters
Type/Options
Description
Grid_OffsetX
float
In a dense pack array, the offset in the X
direction
Grid_OffsetY
float
In a dense pack array, the offset in the Y
direction
Grid_NomSpotWidth
float
Nominal width in microns of a spot from
grid
Grid_NomSpotHeight
float
Nominal height in microns of a spot from
grid
Grid_GenomicBuild
text
The build of the genome used to create the
annotation (if available). If the genome
build is not available (not all designs have
this information), then it is not put out. All
recent and all future designs have it.
FeatureExtractor_Barcode
text
Barcode of the Agilent microarray read
from the scan image
FeatureExtractor_Sample
text
Names of hybridized samples (red/green)
FeatureExtractor_ScanFileName
text
Name of the scan file used for Feature
Extraction
FeatureExtractor_ArrayName
text
Microarray filename
FeatureExtractor_ScanFileGUID
text
GUID of the scan file
FeatureExtractor_DesignFileName
text
Design or grid file used for Feature
Extraction
FeatureExtractor_ExtractionTime
text
Time stamp at the beginning of Feature
Extraction
FeatureExtractor_UserName
text
Windows Log-In Name of the User who ran
Feature Extraction
FeatureExtractor_ComputerName
text
Computer name on which Feature
Extraction was run
FeatureExtractor_Version
text
Version of Feature Extractor
integer
Says if result is from an XDR extraction
FeatureExtractor_IsXDRExtraction
1 = True
0 = False
154
Feature Extraction Reference Guide
Text File Parameters and Results
QC FEPARAMS Table
Protocol Step
Parameters
Type/Options
Description
FeatureExtractor_ColorMode
integer
A flag to indicate output color
0
One color; green only
1
2-color
FeatureExtractor_QCReportType
3
integer
Type of QC report to generate
0
Gene Expression
1
CGH_ChIP
2
miRNA
4
Streamlined CGH
DyeNorm_NormFilename
text
Name of the dye normalization list file
DyeNorm_NormNumProbes
integer
Number of probes in the dye normalization
list
Grid_IsGridFile
boolean
Indicates whether the grid is from a grid
file.
Feature Extraction Reference Guide
155
3
Text File Parameters and Results
MINIMAL FEPARAMS Table
MINIMAL FEPARAMS Table
Table 20
Protocol Step
156
List of parameters and options contained within the MINIMAL
text output file (FEPARAMS table)
Parameters
Type/Options
Description
Protocol _Name
text
Name of protocol used
Protocol_date
text
Date the protocol was last modified
Scan_ScannerName
text
Agilent scanner serial number used
Scan_NumChannels
integer
Number of channels in the scan image
Scan_date
text
Date the image was scanned
Scan_MicronsPerPixelX
float
Number of microns per pixel in the X axis of
the scan image
Scan_MicronsPerPixelY
float
Number of microns per pixel in the Y axis of
the scan image
Scan_OriginalGUID
text
The global unique identifier for the scan
image
Scan_NumScanPass
1 or 2
For 5 micron scans, indicates whether the
scan mode was a single (1) or double-pass
scan mode on the Agilent Scanner.
Grid_Name
text
Grid template name or grid file name
Grid_Date
integer
Date the grid template or grid file was
created
Grid_NumSubGridRows
integer
Number of subgrid columns
Grid_NumSubGridCols
integer
Number of subgrid columns
Grid_NumRows
integer
Number of spots per row of each subgrid
Grid_NumCols
integer
Number of spots per column of each
subgrid
Grid_RowSpacing
float
Space between rows on the grid
Grid_ColSpacing
float
Space between column on the grid
Feature Extraction Reference Guide
Text File Parameters and Results
MINIMAL FEPARAMS Table
Protocol Step
3
Parameters
Type/Options
Description
Grid_OffsetX
float
In a dense pack array, the offset in the X
direction
Grid_OffsetY
float
In a dense pack array, the offset in the Y
direction
Grid_NomSpotWidth
float
Nominal width in microns of a spot from
grid
Grid_NomSpotHeight
float
Nominal height in microns of a spot from
grid
Grid_GenomicBuild
text
The build of the genome used to create the
annotation (if available). If the genome
build is not available (not all designs have
this information), then it is not put out. All
recent and all future designs have it.
FeatureExtractor_Barcode
text
Barcode of the Agilent microarray read
from the scan image
FeatureExtractor_Sample
text
Names of hybridized samples (red/green)
FeatureExtractor_ScanFileName
text
Name of the scan file used for Feature
Extraction
FeatureExtractor_ArrayName
text
Microarray filename
FeatureExtractor_ScanFileGUID
text
GUID of the scan file
FeatureExtractor_DesignFileName
text
Design or grid file used for Feature
Extraction
FeatureExtractor_ExtractionTime
text
Time stamp at the beginning of Feature
Extraction
FeatureExtractor_UserName
text
Windows Log-In Name of the User who ran
Feature Extraction
FeatureExtractor_ComputerName
text
Computer name on which Feature
Extraction was run
FeatureExtractor_Version
text
Version of Feature Extractor
integer
Says if result is from an XDR extraction
FeatureExtractor_IsXDRExtraction
1 = True
0 = False
Feature Extraction Reference Guide
157
3
Text File Parameters and Results
MINIMAL FEPARAMS Table
Protocol Step
Parameters
Type/Options
Description
FeatureExtractor_ColorMode
integer
A flag to indicate output color
0
One color; green only
1
2-color
FeatureExtractor_QCReportType
158
integer
Type of QC report to generate
0
Gene Expression
1
CGH_ChIP
2
miRNA
4
Streamlined CGH
DyeNorm_NormFilename
text
Name of the dye normalization list file
DyeNorm_NormNumProbes
integer
Number of probes in the dye normalization
list
Grid_IsGridFile
boolean
Feature Extraction Reference Guide
Text File Parameters and Results
Statistical results (STATS)
3
Statistical results (STATS)
This middle section of the text file describes the results from
the global array-wide statistical calculations. The STATS
results are reported to 9 decimal places in exponential
notation for all results files (FULL, COMPACT, QC, or
MINIMAL).
STATS Table (ALL text output types)
Table 21
Stats results contained in the text output file (STATS table)*
Stats (Green Channel)
Stats (Red Channel)
Type
Description
gDarkOffsetAverage
rDarkOffsetAverage
float
Average dark offset per image per channel
as measured by scanner
gDarkOffsetMedian
rDarkOffsetMedian
float
Median dark offset per image per channel
as measured by the scanner
gDarkOffsetStdDev
rDarkOffsetStdDev
float
Standard deviation of the data points
measured by the scanner to determine the
dark offset per image per channel.
gDarkOffsetNumPts
rDarkOffsetNumPts
integer
Number of points of data measured by the
scanner to determine the dark offset per
image per channel
gSaturationValue
rSaturationValue
integer
Signal intensity at which spot is
considered saturated.
gAvgSig2BkgeQC
rAvgSig2BkgeQC
float
The average ratio of net signal to local
background for all spike-in probes
gAvgSig2BkgNegCtrl
rAvgSig2BkgNegCtrl
float
The average ratio of net signal to local
background for all negative control probes
gRatioSig2BkgeQC_NegCtrl
rRatioSig2BkgeQC_NegCtrl
float
The ratio of AvgSig2BkgeQC to
AvgSig2BkgNegCtrl
gNumSatFeat
rNumSatFeat
integer
The number of saturated features on the
microarray per channel
Feature Extraction Reference Guide
159
3
Text File Parameters and Results
STATS Table (ALL text output types)
Table 21
Stats results contained in the text output file (STATS table)* (continued)
Stats (Green Channel)
Stats (Red Channel)
Type
Description
gLocalBGInlierNetAve
rLocalBGInlierNetAve
float
The average of the net signal of all inlier
local backgrounds
gLocalBGInlierAve
rLocalBGInlierAve
float
The average of all inlier local backgrounds
gLocalBGInlierSDev
rLocalBGInlierSDev
float
The standard deviation of all inlier local
backgrounds
gLocalBGInlierNum
rLocalBGInlierNum
integer
The number of inlier local backgrounds
gGlobalBGInlierAve
rGlobalBGInlierAve
float
The average of all inliers used in
background estimation for the selected
global background subtraction method or
the average of all inlier local backgrounds
if the local background subtraction method
is selected (after global background
adjustment is applied, if selected)
gGlobalBGInlierSDev
rGlobalBGInlierSDev
float
The standard deviation of all inliers used in
background estimation for the selected
global background subtraction method or
the standard deviation of all inlier local
backgrounds if the local background
subtraction method is selected
gGlobalBGInlierNum
rGlobalBGInlierNum
integer
The number of all inliers used in
background estimation for the selected
global background subtraction method or
the number of all inlier local backgrounds if
the local background subtraction method
is selected
gNumFeatureNonUnifOL
rNumFeatureNonUnifOL
integer
The number of features that are flagged as
non-uniformity outliers
gNumPopnOL
rNumPopnOL
integer
The number of features that are flagged as
population outliers
gNumNonUnifBGOL
rNumNonUnifBGOL
integer
The number of local background regions
that are flagged as non-uniformity outliers
gNumPopnBGOL
rNumPopnBGOL
integer
The number of local background regions
that are flagged as population outliers
gOffsetUsed
rOffsetUsed
float
Software estimated scanner offset
160
Feature Extraction Reference Guide
Text File Parameters and Results
STATS Table (ALL text output types)
Table 21
3
Stats results contained in the text output file (STATS table)* (continued)
Stats (Green Channel)
Stats (Red Channel)
Type
Description
gGlobalFeatInlierAve
rGlobalFeatInlierAve
float
Average of all inlier features
gGlobalFeatInlierSDev
rGlobalFeatInlierSDev
float
Standard deviation of all inlier features
gGlobalFeatInlierNum
rGlobalFeatInlierNum
float
Number of all inlier features
AllColorPrcntSat
float
The percentage of features that are
saturated in both the green AND red
channels
AnyColorPrcntSat
float
The percentage of features that are
saturated in either the green or red
channel
AnyColorPrcntFeatNonUnifOL
float
The percentage of features that are feature
non-uniformity outliers in either channel
AnyColorPrcntBGNonUnifOL
float
The percentage of local backgrounds that
are non-uniformity outliers in either
channel
AnyColorPrcntFeatPopnOL
float
The percentage of features that are
population outliers in either the green or
red channel
AnyColorPrcntBGPopnOL
float
The percentage of local backgrounds that
are population outliers in either channel
TotalPrcntFeatOL
float
The percentage of non-control features
that are feature non-uniformity outliers in
either the green or red channel or are
saturated in both channels
gBGAdjust
rBGAdjust
float
Background offset constant to adjust all
feature signals. If Adjust Background
Globally is set True, all feature signals are
adjusted by this offset. If set to the value
entered in the protocol, all feature signals
are adjusted so that very low level feature
signals equal the protocol value.
gNumNegBGSubFeat
rNumNegBGSubFeat
integer
Number of background-subtracted
features with negative signals
Feature Extraction Reference Guide
161
3
Text File Parameters and Results
STATS Table (ALL text output types)
Table 21
Stats results contained in the text output file (STATS table)* (continued)
Stats (Green Channel)
Stats (Red Channel)
Type
Description
gNonCtrlNumNegFeatBGSub
Sig
rNonCtrlNumNegFeatBGSubSig integer
Number of non-control features with
negative background-subtracted signals
gLinearDyeNormFactor
rLinearDyeNormFactor
float
Global dye norm factor
gRMSLowessDNF
rRMSLowessDNF
float
The root mean square of the average
lowess dye norm factor. The lowess dye
norm factor for each feature is its
DyeNormSignal divided by its
BGSubSignal.
DyeNormDimensionlessRMS
float
Dimensionless RMS correction metric
(metric that indicates how much correction
has been applied based upon the LOWESS
curve)
DyeNormUnitWeightedRMS
float
Unit weighted RMS correction metric
(metric that indicates how much correction
has been applied based upon the LOWESS
curve)
gSpatialDetrendRMSFit
rSpatialDetrendRMSFit
float
Root mean square (RMS) of the fitted data
points obtained from the Loess algorithm.
This gives an idea of the curvature of the
surface fit.
gSpatialDetrendRMS Filtered
MinusFit
rSpatialDetrendRMS Filtered
MinusFit
float
Approximate residual from the surface fit.
gSpatialDetrendSurfaceArea
rSpatialDetrendSurfaceArea
float
Normalized area–the fitted surface area
divided by the projected area on the
microarray; also gives an idea of the
curvature of the surface gradient.
gSpatialDetrendVolume
rSpatialDetrendVolume
float
Sum of the intensities of the surface area
minus the offset. The offset is calculated
as the volume under the flat surface
(parallel to the glass slide) passing through
the minimum intensity point of the fitted
surface. This number (total volume - offset)
is normalized by the area of the microarray.
gSpatialDetrendAveFit
rSpatialDetrendAveFit
float
Describes the average intensity of the
surface gradient
162
Feature Extraction Reference Guide
Text File Parameters and Results
STATS Table (ALL text output types)
Table 21
3
Stats results contained in the text output file (STATS table)* (continued)
Stats (Green Channel)
Stats (Red Channel)
Type
Description
gNonCtrlNumSatFeat
rNonCtrlNumSatFeat
integer
The number of saturated non-control
features
gNonCtrl99PrcntNetSig
rNonCtrl99PrcntNetSig
float
NetSignal intensity at 99th percentile for
all non-control probes
gNonCtrl50PrcntNetSig
rNonCtrl50PrcntNetSig
float
NetSignal intensity at 50th percentile for
all non-control probes
gNonCtrl1PrcntNetSig
rNonCtrl1PrcntNetSig
float
NetSignal intensity at 1st percentile for all
non-control probes
gNonCtrlMedPrcntCVBGSub
Sig
rNonCtrlMedPrcntCVBGSubSig
float
The median percent CV of
background-subtracted signals for inlier
noncontrol probes
gCtrleQCNumSatFeat
rCtrleQCNumSatFeat
integer
The number of saturated spike-in features
gCtrleQC99PrcntNetSig
rCtrleQC99PrcntNetSig
float
NetSignal intensity at 99th percentile of all
spike-in probes
gCtrleQC50PrcntNetSig
rCtrleQC50PrcntNetSig
float
NetSignal intensity at 50th percentile of all
spike-in probes
gCtrleQC1PrcntNetSig
rCtrleQC1PrcntNetSig
float
NetSignal intensity at 1st percentile of all
spike-in probes
geQCMedPrcntCVBGSubSig
reQCMedPrcntCVBGSubSig
float
The median percent CV of
background-subtracted signals for inlier
spike-in probes
geQCSig2BkgLow1
reQCSig2BkgLow1
float
Median ratio (net signal to BGUsed) of all
inlier features for an spike-in probe with
lowest concentration spiked in red and
green channels
geQCSig2BkgLow2
reQCSig2BkgLow2
float
Median ratio (net signal to BGUsed) of all
inlier features for an spike-in probe with
second lowest concentration spiked in red
and green channels
gNegCtrlNumInliers
rNegCtrlNumInliers
integer
Number of all inlier negative controls
Feature Extraction Reference Guide
163
3
Text File Parameters and Results
STATS Table (ALL text output types)
Table 21
Stats results contained in the text output file (STATS table)* (continued)
Stats (Green Channel)
Stats (Red Channel)
Type
Description
gNegCtrlAveNetSig
rNegCtrlAveNetSig
float
Average net signal of all inlier negative
controls
gNegCtrlSDevNetSig
rNegCtrlSDevNetSig
float
Standard deviation of the net signal of all
inlier negative controls
gNegCtrlAveBGSubSig
rNegCtrlAveBGSubSig
float
Average background-subtracted signal of
all inlier negative controls
gNegCtrlSDevBGSubSig
rNegCtrlSDevBGSubSig
float
Standard deviation of the
background-subtracted signals of all inlier
negative controls
gAveNumPixOLLo
rAveNumPixOLLo
integer
The average number of pixels that are
rejected from each feature at the low end
of the intensity spectrum
gAveNumPixOLHi
rAveNumPixOLHi
integer
The average number of pixels that are
rejected from each feature at the high end
of the intensity spectrum
gPixCVofHighSignalFeat
rPixCVofHighSignalFeat
float
Average of pixel CV for features with high
signal
gNumHighSignalFeat
rNumHighSignalFeat
integer
The number of features with high signal
NonCtrlAbsAveLogRatio
float
This result is from a two-step calculation.
Step 1 for each probe calculates the
absolute average log ratio of all inlier
non-control features with minimum
number of replicates. Step 2 calculates the
average of all absolute average log ratios
calculated in step 1.
NonCtrlSDevLogRatio
float
The average standard deviation of log
ratios of all inlier non-control probe sets
with a minimum number of replicates
NonCtrlSNRLogRatio
float
The average of signal to noise values of the
log ratio for all inlier non-control probe sets
with a minimum number of replicates
164
Feature Extraction Reference Guide
Text File Parameters and Results
STATS Table (ALL text output types)
Table 21
3
Stats results contained in the text output file (STATS table)* (continued)
Stats (Green Channel)
Stats (Red Channel)
Type
Description
eQCAbsAveLogRatio
float
This result is from a two-step calculation.
Step 1 for each probe calculates the
absolute average log ratio of all inlier
spikein features with minimum number of
replicates. Step 2 calculates the average of
all absolute average log ratios calculated in
step 1.
eQCSDevLogRatio
float
Average standard deviation of log ratios of
all inlier spike-in probe sets with a
minimum number of replicates
eQCSNRLogRatio
float
Average signal to noise value of log ratios
of all inlier spike-in probe sets with a
minimum number of replicates
AddErrorEstimateGreen
float
The additive error estimated for the
microarray in the green channel.
AddErrorEstimateRed
float
The additive error estimated for the
microarray in the red channel.
TotalNumFeatures
integer
Total number of features that show up in
output file.
NonCtrlNumUpReg
integer
Number of up-regulated non-control
probes
NonCtrlNumDownReg
integer
Number of down-regulated non-control
probes
eQCObsVsExpLRSlope
float
For 2-color QC report: Slope of the linear
regression fit of the plot of the expected
versus observed average log ratio for each
spike-in probe
eQCObsVsExpLRIntercept
float
For 2-color QC report: Intercept of the
linear regression fit of the plot of the
expected versus observed average log ratio
for each spike-in probe
Feature Extraction Reference Guide
165
3
Text File Parameters and Results
STATS Table (ALL text output types)
Table 21
Stats results contained in the text output file (STATS table)* (continued)
Stats (Green Channel)
Stats (Red Channel)
Type
Description
eQCObsVsExpCorr
float
For 2-color QC report: The R2 value of the
linear regression fit of the plot of the
expected versus observed average log ratio
for each spike-in probe
NumIsNorm
integer
Number of features used for normalization
ROI Width
float
The width or height (in pixels) of the region
of interest (ROI) about a nominal spot
location. The spotfinder determines the
found centroid and spot size of the spot
within the ROI.
CentroidDiffX
float
The average absolute of difference
between nominal centroids and
corresponding found centroids in X
direction
CentroidDiffY
float
The average absolute of difference
between nominal centroids and
corresponding found centroids in Y
direction
NumFoundFeat
integer
The number of features that are flagged as
found
MaxNonUnifEdges
float
Maximum fraction of features that are
non-uniform along any edge of the
microarray
MaxSpotNotFoundEdges
float
Maximum fraction of features that are not
found along any edge of the microarray
float
Root mean square (RMS) of the fitted data
points obtained from the second degree
polynomial equation in Multiplicative
Detrending. This gives an idea of the
curvature of the surface fit to the
“hybridization dome” in the Agilent
Hybridization chambers.
ROI Height
gMultDetrendRMS Fit
166
rMultDetrendRMS Fit
Feature Extraction Reference Guide
Text File Parameters and Results
STATS Table (ALL text output types)
Table 21
3
Stats results contained in the text output file (STATS table)* (continued)
Stats (Green Channel)
Stats (Red Channel)
Type
Description
gMultDetrendSurfaceAverage
rMultDetrendSurfaceAverage
float
The average of the surface calculated by
multiplicative detrending. This average is
used to normalize the surface. It is a
straight average over all the points in the
surface.
DerivativeOfLogRatioSD
float
Measures the standard deviation of the
probe-to-probe difference of the log ratios.
This is a metric used in CGH experiments
where differences in the log ratios are
small on average. A smaller standard
deviation here indicates less noise in the
biological signals.
eQCLowSigName1
text
The probe name of the eQC probe spiked in
at the lowest concentration.
eQCLowSigName2
text
The probe name of the eQC probe spiked in
at the second lowest concentration.
eQCOneColorLogLowSignal
float
Agilent Spike-In Concentration-Response
Statistic in the 1-color QC Report: Log of
low signal for the data
eQCOneColorLogLowSignalError
float
Agilent Spike-In Concentration-Response
Statistic in the 1-color QC Report: Error in
the log of low signal for the data
eQCOneColorLogHighSignal
float
Agilent Spike-In Concentration-Response
Statistic in the 1-color QC Report: Log of
high signal for the data
eQCOneColorLinFitLogLowConc
float
Agilent Spike-In Concentration-Response
Statistic in the 1-color QC Report: Log of
low concentration in the linear range of
curve fit
eQCOneColorLinFitLogLowSignal
float
Agilent Spike-In Concentration-Response
Statistic in the 1-color QC Report: Log of
low signal in the linear range of curve fit
Feature Extraction Reference Guide
167
3
Text File Parameters and Results
STATS Table (ALL text output types)
Table 21
Stats results contained in the text output file (STATS table)* (continued)
Stats (Green Channel)
Stats (Red Channel)
Type
Description
eQCOneColorLinFitLogHighConc
float
Agilent Spike-In Concentration-Response
Statistic in the 1-color QC Report: Log of
high concentration in the linear range of
curve fit
eQCOneColorLinFitLogHighSignal
float
Agilent Spike-In Concentration-Response
Statistic in the 1-color QC Report: Log of
high signal in the linear range of curve fit
eQCOneColorLinFitSlope
float
Agilent Spike-In Concentration-Response
Statistic in the 1-color QC Report: Slope of
the linear range of curve fit
eQCOneColorLinFitIntercept
float
Agilent Spike-In Concentration-Response
Statistic in the 1-color QC Report: Intercept
of the linear range of curve fit
eQCOneColorLinFitRSQ
float
Agilent Spike-In Concentration-Response
Statistic in the 1-color QC Report: Square
of the correlation coefficient of the linear
range of curve fit.
eQCOneColorSpikeDetectionLimit
float
The detection limit as determined by
measuring the average plus 1 standard
deviation of all spike-in probes below the
linear concentration range. This value is
the maximum of these.
gNonCtrl50PrcntBGSubSig
gNonCtrl50PrcntBGSubSig
float
Background-subtracted signal intensity at
50th percentile for all non-control probes.
gCtrleQC50PrcntBGSubSig
rCtrleQC50PrcntBGSubSig
float
The median background-subtracted signal
for all the embedded QC probes on the
microarray.
168
Feature Extraction Reference Guide
Text File Parameters and Results
STATS Table (ALL text output types)
Table 21
3
Stats results contained in the text output file (STATS table)* (continued)
Stats (Green Channel)
Stats (Red Channel)
Type
Description
gMedPrcntCVProcSignal
rMedPrcntCVProcSignal
float
The median %CV for replicate non-control
probes using the processed signal. This
value is calculated by calculating the
average, SD and %CV of the processed
signal of each replicated probe.
For non-control replicated probes, there
must be at least 10 CVs from which to
calculate a median; otherwise, -1 is
reported.
The MedPrcntCVProcSignal and the
MedPrcntCVBGSubSignal show if
Multiplicative Detrending is having a
positive effect on the data. If multiplicative
detrending is helping, the
MedPrcntCVProcSignal should be smaller
than the MedPrcntCVBGSubSignal.
geQCMedPrcntCVProcSignal
reQCMedPrcntCVProcSignal
float
This is the same as
MedPrcntCVProcSignal, except that it is
performed using the eQC SpikeIn
Replicates rather than the nonControl
Replicates. There must be at least 3 CVs
from which to calculate a median.
gOutlierFlagger_Auto_FeatB
Term
rOutlierFlagger_Auto_FeatB
Term
float
Applies to feature: specifies the variance
due to the Poisson distributed noise;
automatically calculated when
OLAutoCompute is turned on
gOutlierFlagger_Auto_FeatC
Term
rOutlierFlagger_Auto_FeatC
Term
float
Applies to feature: specifies variance due
to background noise of the scanner, slide
glass, and other signal-independent
sources; automatically calculated when
OLAutoCompute is turned on
gOutlierFlagger_Auto_BgndB
Term
rOutlierFlagger_Auto_BgndB
Term
float
Applies to background: specifies the
variance due to the Poisson distributed
noise; automatically calculated when
OLAutoCompute is turned on
Feature Extraction Reference Guide
169
3
Text File Parameters and Results
STATS Table (ALL text output types)
Table 21
Stats results contained in the text output file (STATS table)* (continued)
Stats (Green Channel)
Stats (Red Channel)
Type
Description
gOutlierFlagger_Auto_BgndC
Term
rOutlierFlagger_Auto_BgndC
Term
float
Applies to background: specifies variance
due to background noise of the scanner,
slide glass, and other signal-independent
sources; automatically calculated when
OLAutoCompute is turned on
OutlierFlagger_FeatChiSq
float
Confidence Interval for the feature
OutlierFlagger_BgndChiSq
float
Confidence Interval for the background
gXDRLowPMTSlope
rXDRLowPMTSlope
The slope that is multiplied by the original
low intensity Mean Signal to get the XDR
mean signal. Used in the linear equation
relating the Mean (or Median) Signal in the
low intensity scan to the scaled intensity
used in the combined XDR output.
gXDRLowPMTIntercept
rXDRLowPMTIntercept
The intercept that is added to the
Slope*LowIntensityMeanSignal to get the
XDR Mean Signal. Used in the linear
equation relating the Mean (or Median)
Signal in the low intensity scan to the
scaled intensity used in the combined XDR
output.
GriddingStatus
integer
Indicates that the automatic image
processing was flagged as
needing evaluation.
NumGeneNonUnifOL
integer
Number of genes that do not have any
replicate features on the array where both
color channels are not Feature
Non-Uniform outliers. If multiple probes
address the same gene, this value actually
states the number of probes that have no
non-uniform replicates.
TotalNumberOfReplicated
Genes
integer
Number of genes that have replicate
features on the array.
170
Feature Extraction Reference Guide
Text File Parameters and Results
STATS Table (ALL text output types)
Table 21
3
Stats results contained in the text output file (STATS table)* (continued)
Stats (Green Channel)
Type
Description
gMultDetrendMeanSignal
Difference
float
This is output for miRNA only. If
multiplicative detrending is turned on, the
meanSignal over all replicated noncontrols
is calculated before detrending and after
detrending. The difference in mean signals
is reported here. Because the mean signal
should not change, this number should be
close to 0. Without Multiplicative
detrending this number is always 0.
EffectiveFeatureSizeFraction
float
Estimates the ratio of the effective feature
size to the nominal feature size. It is
calculated by looking at the ratio of the
whole spot measurement versus the
cookie measurement.
Feature UniformityAnomaly
Fraction
float
Fraction (Num/TotalNum) of the number of
features looked at that had anomalous
ratios. This gives a measure of the
percentage of representative spots that are
strange (e.g., donuts, super hot spots, hot
crescents).
UsedDefaultEffectiveFeature
Size
integer
Reports whether or not the default
effective feature size was used. If the
default was used, the stat is 1. If the
effective feature size was estimated, the
stat value is 0.
float
The protocol lets you enter the Percentile
Value at which the intensity of the
noncontrol signals is recorded. All
protocols specify the 75th percentile. This
number is the intensity of all the
noncontrol signals in the 75th percentile.
This stat is used to normalize 1-color data.
float
These are metrics for miRNA only. This is
the value of the TotalGeneSignal for all
genes at the 99th percentile.
gPercentileIntensityProcessed
Signal
Stats (Red Channel)
rPercentileIntensityProcessed
Signal
gTotalSignal99pctile
Feature Extraction Reference Guide
171
3
Text File Parameters and Results
STATS Table (ALL text output types)
Table 21
Stats results contained in the text output file (STATS table)* (continued)
Stats (Green Channel)
Stats (Red Channel)
gTotalSignal75pctile
Type
Description
float
These are metrics for miRNA only. This is
the value of the TotalGeneSignal for all
genes at the 75th percentile.
gNegCtrlSpread
rNegCtrlSpread
float
The root mean square (RMS) of the
preliminary spatial fit of the negative
controls. It is equivalent to a standard
deviation of NC signals after removal of
spatial homogeneities. Used as a
preliminary estimation of the noise on the
array for selecting near-zero probes in
spatial detrending, and conversely for
excluding near-zero probes in
multiplicative detrending.
gNonCtrlNumWellAboveBG
rNonCtrlNumWellAboveBG
integer
Measure of the number of noncontrol
features whose signals are well above
background. Used as a metric for the
number of features with significant signal.
ImageDepth
string
16 bit or 20 bit
AFHold
float
The percentage of time, during a scan that
the Autofocus assembly holds its position
rather than actively maintaining focus.
Typically, the value is less than 2%;
however, the value will be larger if there
are obstructions on the microarray that
interfere with the laser beams.
float
The voltages that Photomultipliers are set
to. The voltage adjusts the spectral
response of the scanner to incoming light
from the lasers. In general, the higher the
PMTVoltage, the higher the signals will be
for fluorescent artifacts that are scanned.
Typical numbers here are between 350 –
525 mV, but can vary depending on the
PMT.
gPMTVolts
172
rPMTVolts
Feature Extraction Reference Guide
Text File Parameters and Results
STATS Table (ALL text output types)
Table 21
3
Stats results contained in the text output file (STATS table)* (continued)
Stats (Green Channel)
Type
Description
GlassThickness
float
Expressed in microns. This represents the
thickness of the microarray slide, as
measured during autofocus homing. Using
standard Agilent slides, the values range
from 900 – 1000. Nominal values for
non-Agilent slides are specified between
900 and 1100 for C scanners, and 900 and
1200 for B scanners.
RestrictionControl
float
Restriction control probes are a set of
probes spanning cut sites that are not
variant in samples. If the protocol is
followed correctly, these probes should
always give 0 signal. The final restriction
control value is the minimum of the
restriction control values of red channel
and green channel. If restriction control
probes are not present in the design, the
RestrictionControl value is set to “-1”.
integer
Direction Dependent Noise during
scanning. For single-pass scanning mode
(available in some Agilent scanner
software), the average of background
signal on an even-scan line is different
from an odd-scan line. During
postprocessing, the scanner control
software finds the DDN difference
between both directions (an average
difference over the entire scan). It then
calculates the even-line average minus
odd-line-average. A positive DDN value
means the even-line average value is
greater than the odd-line average value,
and a negative DDN means the even-line
average is less than the odd-line average.
The DDN values are written to the image
file header. These stat values are not given
for images that do not have DDN
information.
gDDN
Stats (Red Channel)
rDDN
Feature Extraction Reference Guide
173
3
Text File Parameters and Results
STATS Table (ALL text output types)
Table 21
Stats results contained in the text output file (STATS table)* (continued)
Stats (Green Channel)
Stats (Red Channel)
GridHasBeenOptimized
Type
Description
boolean
Indicates if grid has been adjusted for
better fit as result of performing the
interactively adjust corners method.
0 = False
1 = True
ExtractionStatus
integer
0=in
range;
This is put out only if a metric set has been
run. It gives a status of the overall array.
1=out of
range
QCMetricResults
String
If the Extraction Status = 0, the output says
ExtractionInRange. If the Extraction Status
= 1, the output says ExtractionEvaluate.
UpRandomnessRatio
float
Variance measure of whether or not
positive Log Ratios appear to be correlated
with position on the array
DownRandomnessRatio
float
Variance measure of whether or not
negative Log Ratios appear to be
correlated with position on the array
UpRandomnessSDRatio
float
StDev measure of whether or not positive
Log Ratios appear to be correlated with
position on the array
DownRandomnessSDRatio
float
StDev measure of whether or not negative
Log Ratios appear to be correlated with
position on the array
float
These are metrics for miRNA only. This is
the log10 - transformed value of
TotalGeneSignal for the miRNA spikein
gene dmr285 within the subtype mask
8196. If the parameter “Do you want
minimum signal value as 0.1?” value in
protocol is true then the values of
TotalGeneSignal less than 0.1 will be set to
0.1 for the calculation. Otherwise the
original value for TotalGeneSignal is used
in the calculation.
gdmr285GeneSignal
174
rdmr285GeneSignal
Feature Extraction Reference Guide
Text File Parameters and Results
STATS Table (ALL text output types)
Table 21
3
Stats results contained in the text output file (STATS table)* (continued)
Stats (Green Channel)
Stats (Red Channel)
Type
Description
gdmr31aGeneSignal
rdmr31aGeneSignal
float
These are metrics for miRNA only. This is
the log10 - transformed value of
TotalGeneSignal for the miRNA spikein
gene dmr31a within the subtype mask
8196. If the parameter “Do you want
minimum signal value as 0.1?” value in
protocol is true then the values of
TotalGeneSignal less than 0.1 will be set to
0.1 for the calculation. Otherwise the
original value for TotalGeneSignal is used
in the calculation.
gdmr6GeneSignal
rdmr6GeneSignal
float
These are metrics for miRNA only. This is
the log10 - transformed value of
TotalGeneSignal for the miRNA spikein
gene dmr6 within the subtype mask 8196.
If the parameter “Do you want minimum
signal value as 0.1?” value in protocol is
true then the values of TotalGeneSignal
less than 0.1 will be set to 0.1 for the
calculation. Otherwise the original value
for TotalGeneSignal is used in the
calculation.
gdmr3GeneSignal
rdmr3GeneSignal
float
These are metrics for miRNA only. This is
the log10 - transformed value of
TotalGeneSignal for the miRNA spikein
gene dmr3 within the subtype mask 8196.
If the parameter “Do you want minimum
signal value as 0.1?” value in protocol is
true then the values of TotalGeneSignal
less than 0.1 will be set to 0.1 for the
calculation. Otherwise the original value
for TotalGeneSignal is used in the
calculation.
Feature Extraction Reference Guide
175
3
Text File Parameters and Results
STATS Table (ALL text output types)
Table 21
Stats results contained in the text output file (STATS table)* (continued)
Stats (Green Channel)
Stats (Red Channel)
Type
Description
gdmr6ProbeRatio
rdmr6ProbeRatio
float
These are metrics for miRNA only. This is
the log2 - transformed value of the ratio of
the TotalGeneSignal value for the longer
probe in dmr6 divided by the
TotalGeneSignal value for shorter probe in
dmr6. for the miRNA spikein gene dmr3
within the subtype mask 8196. The probe
length can be determined from the probe
name itself: for example, dmr_6_17 means
17 is the probe length. If the parameter “Do
you want minimum signal value as 0.1?”
value in protocol is true then the values of
TotalGeneSignal less than 0.1 will be set to
0.1 for the calculation. Otherwise the
original value for TotalGeneSignal is used
in the calculation.
gdmr3ProbeRatio
rdmr3ProbeRatio
float
These are metrics for miRNA only. This is
the log2 - transformed value of the ratio of
the TotalGeneSignal value for the longer
probe in dmr3 divided by the
TotalGeneSignal value for the shorter
probe in dmr3. for the miRNA spikein gene
dmr3 within the subtype mask 8196. The
probe length can be determined from the
probe name itself: for example, dmr_3_17
means 17 is the probe length.If the
parameter “Do you want minimum signal
value as 0.1?” value in protocol is true then
the values of TotalGeneSignal less than 0.1
will be set to 0.1 for the calculation.
Otherwise the original value for
TotalGeneSignal is used in the calculation.
float
This metric is for CGH only. It calculates
the amount of amplifications versus
deletions per chromosome to determine if
there is an imbalance that falls outside of
normal expectations.
LogRatioImbalance
176
Feature Extraction Reference Guide
Text File Parameters and Results
STATS Table (ALL text output types)
Table 21
3
Stats results contained in the text output file (STATS table)* (continued)
Stats (Green Channel)
Stats (Red Channel)
Type
Metric_MetricName
Metric_MetricName_IsInRange
Description
(Optional. Only displayed when a metric
set is used.) The name of a metric in the
metric set. The given value is the one that
has been calculated for this metric. You
can have more than one metric in a given
metric set.
integer
1=in
range;
0=out of
range
(Optional. Only displayed when a metric
set is used.) Indicates whether the metric
was within any user-defined thresholds
found in the metric set for that metric.
* Results are reported to 9 decimal places in exponential notation for all result files.
Feature Extraction Reference Guide
177
3
Text File Parameters and Results
Feature results (FEATURES)
Feature results (FEATURES)
The bottom section of the text file gives descriptions of the
results for each feature. Results are reported to 9 decimal
places in exponential notation for all result files.
FULL Features Table
Table 22
Feature results contained in the FULL output text file (FULL FEATURES table)*
Features (Green)
Features (Red)
Types
Options
Description
FeatureNum
integer
Feature number
Row
integer
Feature location: row
Col
integer
Feature location: column
Accessions
text
Gene accession numbers
Chr_coord
text
Chromosome coordinates of the feature
SubTypeMask
integer
Numeric code defining the subtype of
any control feature
SubTypeName
integer
Name of the subtype of any control
feature
Start
integer
Indicates the place in the transcript
where the probe sequence starts.
Sequence
text
The sequence of bases printed on the
array.
ProbeUID
integer
Unique integer for each unique probe in
a design
178
Feature Extraction Reference Guide
Text File Parameters and Results
FULL Features Table
Table 22
3
Feature results contained in the FULL output text file (FULL FEATURES table)* (continued)
Features (Green)
Features (Red)
ControlType
Types
Options
integer
Description
Feature control type (See “XML Control
Type output” on page 220 for
definitions.)
0
Control type none
1
Positive control
-1
Negative control
-15000
SNP
-20000
Not probe (See Ch. 4 for definition)
-30000
Ignore (See Ch. 4 for definition)
ProbeName
text
An Agilent-assigned identifier for the
probe synthesized on the microarray
GeneName
text
This is an identifier for the gene for
which the probe provides expression
information. The target sequence
identified by the systematic name is
normally a representative or consensus
sequence for the gene.
SystematicName
text
This is an identifier for the target
sequence that the probe was designed
to hybridize with. Where possible, a
public database identifier is used (e.g.,
TAIR locus identifier for Arabidopsis).
Systematic name is reported ONLY if
Gene name and Systematic name are
different.
Description
text
Description of gene
PositionX
float
Found coordinates of the feature
centroid in microns
PositionY
Feature Extraction Reference Guide
179
3
Text File Parameters and Results
FULL Features Table
Table 22
Feature results contained in the FULL output text file (FULL FEATURES table)* (continued)
Features (Green)
Features (Red)
LogRatio (base 10)
Types
Options
Description
per feature, log of
(rProcessedSignal/gProcessedSignal)
float
If SURROGATES are turned off, then:
LogRatioError
-4
if DyeNormRedSig <= 0.0 &
DyeNormGreenSig > 0.0
4
if DyeNormRedSig > 0.0 &
DyeNormGreenSig <= 0.0
0
if DyeNormRedSig <= 0.0 &
DyeNormGreenSig <= 0.0
float
If SURROGATES are turned off, then:
1000
if DyeNormRedSig <= 0.0 OR
DyeNormGreenSig <= 0.0
IF SURROGATES are turned on, then:
LogRatioError = error of the log ratio
calculated according to the error model
chosen
PValueLogRatio
gSurrogateUsed
180
float
rSurrogateUsed
float
Significance level of the LogRatio
computed for a feature
Non-zero value
The g(r) surrogate value used
0
No surrogate value used
Feature Extraction Reference Guide
Text File Parameters and Results
FULL Features Table
Table 22
3
Feature results contained in the FULL output text file (FULL FEATURES table)* (continued)
Features (Green)
Features (Red)
Types
gIsFound
rIsFound
boolean
Options
Description
1 = IsFound
A boolean used to flag found features.
The flag is applied independently in
each channel.
0 = IsNotFound
A feature is considered Found if two
conditions are true: 1) the difference
between the feature signal and the local
background signal is more than 1.5
times the local background noise and 2)
the spot diameter is at least 0.30 times
the nominal spot diameter.
gProcessedSignal
rProcessedSignal
float
The signal left after all the Feature
Extraction processing steps have been
completed. In the case of one color,
ProcesssedSignal contains the
Multiplicatively Detrended
BackgroundSubtracted Signal if the
detrending is selected and helps. If the
detrending does not help, this column
will contain the
BackgroundSubtractedSignal.
gProcessedSigError
rProcessedSigError
float
The universal or propagated error left
after all the processing steps of Feature
Extraction have been completed. In the
case of one color, ProcessedSignalError
has had the Error Model applied and will
contain at least the larger of the
universal (UEM) error or the propagated
error.
If multiplicative detrending is performed,
ProcessedSignalError contains the error
propagated from detrending. This is
done by dividing the error by the
normalized MultDetrendSignal.
Feature Extraction Reference Guide
181
3
Text File Parameters and Results
FULL Features Table
Table 22
Feature results contained in the FULL output text file (FULL FEATURES table)* (continued)
Features (Green)
Features (Red)
Types
Options
Description
gNumPixOLHi
rNumPixOLHi
integer
Number of outlier pixels per feature with
intensity > upper threshold set via the
pixel outlier rejection method. The
number is computed independently in
each channel. These pixels are omitted
from all subsequent calculations.
gNumPixOLLo
rNumPixOLLo
integer
Number of outlier pixels per feature with
intensity < lower threshold set via the
pixel outlier rejection method. The
number is computed independently in
each channel. These pixels are omitted
from all subsequent calculations.
NOTE: The pixel outlier method is the
ONLY step that removes data in Feature
Extraction.
gNumPix
rNumPix
integer
Total number of pixels used to compute
feature statistics; i.e. total number of
inlier pixels/per spot; same in both
channels
gMeanSignal
rMeanSignal
float
Raw mean signal of feature from inlier
pixels in green and/or red channel
gMedianSignal
rMedianSignal
float
Raw median signal of feature from inlier
pixels in green and/or red channel
gPixSDev
rPixSDev
float
Standard deviation of all inlier pixels per
feature; this is computed independently
in each channel.
gPixNormIQR
rPixNormIQR
float
The normalized Inter-quartile range of
all of the inlier pixels per feature. The
range is computed independently in
each channel.
gBGNumPix
rBGNumPix
integer
Total number of pixels used to compute
local BG statistics per spot; i.e. total
number of BG inlier pixels; same in both
channels
182
Feature Extraction Reference Guide
Text File Parameters and Results
FULL Features Table
Table 22
3
Feature results contained in the FULL output text file (FULL FEATURES table)* (continued)
Features (Green)
Features (Red)
Types
gBGMeanSignal
rBGMeanSignal
float
Mean local background signal (local to
corresponding feature) computed per
channel (inlier pixels)
gBGMedianSignal
rBGMedianSignal
float
Median local background signal (local to
corresponding feature) computed per
channel (inlier pixels)
gBGPixSDev
rBGPixSDev
float
Standard deviation of all inlier pixels per
local BG of each feature, computed
independently in each channel
gBGPixNormIQR
rBGPixNormIQR
float
The normalized Inter-quartile range of
all of the inlier pixels per local BG of
each feature. The range is computed
independently in each channel.
gNumSatPix
rNumSatPix
integer
Total number of saturated pixels per
feature, computed per channel
gIsSaturated
rIsSaturated
boolean
1 = Saturated or
0 = Not saturated
Boolean flag indicating if a feature is
saturated or not. A feature is saturated
IF 50% of the pixels in a feature are
above the saturation threshold.
gIsLowPMTScaled
Up
rIsLowPMTScaled
Up
boolean
1 = Low
Reports if the feature signal value is
from the scaled-up low signal image or
from the high signal image
PixCorrelation
Options
0 = High
float
Description
Ratio of estimated feature covariance in
RedGreen space to product of feature
standard deviation in Red Green space
The covariance of two features
measures their tendency to vary
together, i.e., to co-vary. In this case, it is
a cumulative quantitation of the
tendency of pixels belonging to a
particular feature in Red and Green
spaces to co-vary.
BGPixCorrelation
Feature Extraction Reference Guide
float
The same concept as above but in case
of background.
183
3
Text File Parameters and Results
FULL Features Table
Table 22
Feature results contained in the FULL output text file (FULL FEATURES table)* (continued)
Features (Green)
Features (Red)
Types
Options
Description
gIsFeatNonUnifOL
rIsFeatNonUnifOL
boolean
g(r)IsFeatNonUnifO
L = 1 indicates
Feature is a
non-uniformity
outlier in g(r)
Boolean flag indicating if a feature is a
NonUniformity Outlier or not. A feature
is non-uniform if the pixel noise of
feature exceeds a threshold established
for a “uniform” feature.
gIsBGNonUnifOL
rIsBGNonUnifOL
boolean
g(r)IsBGNonUnifOL
= 1 indicates Local
background is a
non-uniformity
outlier in g(r)
The same concept as above but for
background.
gIsFeatPopnOL
rIsFeatPopnOL
boolean
g(r)IsFeatPopnOL =
1 indicates Feature
is a population
outlier in g(r)
Boolean flag indicating if a feature is a
Population Outlier or not. Probes with
replicate features on a microarray are
examined using population statistics.
A feature is a population outlier if its
signal is less than a lower threshold or
exceeds an upper threshold determined
using a multiplier (1.42) times the
interquartile range (i.e., IQR) of the
population.
gIsBGPopnOL
rIsBGPopnOL
IsManualFlag
gBGSubSignal
184
boolean
g(r)IsBGPopnOL = 1
indicates local
background is a
population outlier in
g(r)
boolean
rBGSubSignal
float
The same concept as above but for
background
Boolean to flag features for downstream
filtering in third party gene expression
software.
g(r)BGSubSignal =
g(r)MeanSignal g(r)BGUsed
Background-subtracted signal. To
display the values used to calculate this
variable using different background
signals and settings of spatial detrend
and global background adjust, see
Table 34 on page 254.
Feature Extraction Reference Guide
Text File Parameters and Results
FULL Features Table
Table 22
3
Feature results contained in the FULL output text file (FULL FEATURES table)* (continued)
Features (Green)
Features (Red)
Types
gBGSubSigError
rBGSubSigError
float
Options
Description
Propagated standard error as computed
on net g(r) background-subtracted
signal.
For one color, the error model is applied
to the background-subtracted signal.
This will contain the larger of he
universal (UEM) error or the propagated
error.
BGSubSigCorrelation
float
Ratio of estimated backgroundsubtracted feature signal covariance in
RG space to product of backgroundsubtracted feature standard deviation in
RG space
g(r)isPosAndSignif
= 1 indicates
Feature is positive
and significant
above background
Boolean flag, established via a 2-sided
t-test, indicates if the mean signal of a
feature is greater than the
corresponding background (selected by
user) and if this difference is significant.
To display variables used in the t-test,
see Table 34 on page 254.
gIsPosAndSignif
rIsPosAndSignif
Boolean
gPValFeatEqBG
rPValFeatEqBG
float
pValue from t-test of significance
between g(r)Mean signal and g(r)
background (selected by user)
gNumBGUsed
rNumBGUsed
integer
Number of local background regions or
features used to calculate the
background used for background
subtraction on this feature.
gIsWellAboveBG
rIsWellAboveBG
Boolean
Boolean flag indicating if a feature is
WellAbove Background or not,
feature passes g(r)IsPosAndSignif and
additionally the g(r)BGSubSignal is
greater than 2.6*g(r)BG_SD. You can
change the multiplier 2.6.
Feature Extraction Reference Guide
185
3
Text File Parameters and Results
FULL Features Table
Table 22
Feature results contained in the FULL output text file (FULL FEATURES table)* (continued)
Features (Green)
Features (Red)
Types
Options
Description
gBGUsed
rBGUsed
float
g(r)BGSubSignal =
g(r)MeanSignal g(r)BGUsed
Background used to subtract from the
MeanSignal; variable also used in t-test.
To display the values used to calculate
this variable using different background
signals and settings of spatial detrend
and global background adjust, see
Table 34 on page 254.
gBGSDUsed
rBGSDUsed
float
IsNormalization
boolean
Standard deviation of background used
in g(r) channel; variable also used in
t-test and surrogate algorithms. To
display the values used to calculate this
variable using different background
signals and settings of spatial detrend
and global background adjust, see
Table 34 on page 254.
1 = Feature used;
A boolean flag which indicates if a
0 = Feature not used feature is used to measure dye bias
gDyeNormSignal
rDyeNormSignal
float
The dye-normalized signal in the
indicated channel
gDyeNormError
rDyeNormError
float
The standard error associated with the
dye-normalized signal
float
Dye-normalized red and green pixel
correlation
DyeNormCorrelation
ErrorModel
0 = Propagated
model chosen by
you or by software
1 = Universal error
model chosen by
you or by software
xDev
186
float
Indicates the error model that you chose
for Feature Extraction or that the
software uses if you have chosen the
“Most Conservative” option
A signal-to-noise parameter used to
calculate pValue; calculated differently
depending on error model chosen
Feature Extraction Reference Guide
Text File Parameters and Results
FULL Features Table
Table 22
3
Feature results contained in the FULL output text file (FULL FEATURES table)* (continued)
Features (Green)
Features (Red)
Types
Options
Description
gSpatialDetrendIsIn
FilteredSet
rSpatialDetrendIsIn
FilteredSet
boolean
1 = Feature in
filtered set
Set to true for a given feature if it is part
of the filtered set used to detrend the
background. This feature is considered
part of the locally weighted lowest x% of
features as defined by the
DetrendLowPassPercentage.
0 = Feature not in
filtered set
gSpatialDetrend
SurfaceValue
rSpatialDetrend
SurfaceValue
float
Value of the smoothed surface
calculated by the Spatial detrend
algorithm
gIsLowEnoughAdd
Detrend
rIsLowEnoughAdd
Detrend
boolean
These points are considered to be in the
background for the purposes of spatial
detrending and multiplicative
detrending. If the Boolean value is true
for a given point, it will be used in
spatial detrending and not in
multiplicative detrending (depends on
parameters).
SpotExtentX
float
Diameter of the spot (X-axis)
SpotExtentY
float
Diameter of the spot (Y-axis)
float
MeanSignal minus DarkOffset
gTotalProbeSignal
float
This signal is the robust average of all
the processed green signals for each
replicated probe multiplied by the total
number of probe replicates, the
EffectiveFeature SizeFraction, the
Nominal Spot Area and the Weight. For
miRNA analyses
gTotalProbeError
float
This error is the robust average of all the
processed green signal errors for each
replicated probe multiplied by the total
number of probe replicates, the
EffectiveFeature SizeFraction, the
Nominal Spot Area and the Weight. For
miRNA analyses
gNetSignal
rNetSignal
Feature Extraction Reference Guide
187
3
Text File Parameters and Results
FULL Features Table
Table 22
Feature results contained in the FULL output text file (FULL FEATURES table)* (continued)
Features (Green)
Features (Red)
Types
Options
Description
gTotalGeneSignal
float
This signal is the sum of the total probe
signals in the green channel per gene.
For miRNA analyses.
gTotalGeneError
float
This error is the square root of the sum
of the squares of the TotalProbeError.
For miRNA analyses.
gIsGeneDetected
boolean
Lets you know if the gene was detected
on the miRNA microarray.
gMultDetrendSignal
rMultDetrendSignal
float
A surface is fitted through the log of the
background-subtracted signal to look for
multiplicative gradients. A normalized
version of that surface interpolated at
each point of the microarray is stored in
MultDetrendSignal. The surface is
normalized by dividing each point by the
overall average of the surface. That
average is stored in
MultDetrendSurfaceAverage as a
statistic. 1-color only
gProcessed
Background
rProcessed
Background
float
Indicates the Background signal that
was selected to be used (Mean or
Median).
gProcessedBkng
Error
rProcessedBkng
Error
float
Indicates the Background error that was
selected to be used (PixSD or NormIQR)
IsUsedBGAdjust
boolean
1 = Feature used
A Boolean used to flag features used for
0 = Feature not used computation of global BG offset
gInterpolatedNeg
CtrlSub
rInterpolatedNeg
CtrlSub
float
Value at the polynomial fit of the
negative controls.
gIsInNegCtrlRange
rIsInNegCtrlRange
boolean
Set to true for a given feature if its signal
intensity is in the negative control
range.
gIsUsedInMD
rIsUsedInMD
boolean
Indicates whether this feature was
included in the set used to generate the
multiplicative detrend surface.
*
Results are reported to 9 decimal places in exponential notation for all result files.
188
Feature Extraction Reference Guide
Text File Parameters and Results
COMPACT Features Table
3
COMPACT Features Table
Table 23
Feature results contained in the COMPACT output text file (COMPACT FEATURES table)*
Features (Green)
Features (Red)
Types
Options
Description
FeatureNum
integer
Feature number
Row
integer
Feature location: row
Col
integer
Feature location: column
SubTypeMask
integer
Numeric code defining the subtype of
any control feature
ControlType
integer
Feature control type (See “XML Control
Type output” on page 220 for
definitions.)
0
Control type none
1
Positive control
-1
Negative control
-15000
SNP
-20000
Not probe (See Ch. 4 for definition)
-30000
Ignore (See Ch. 4 for definition)
ProbeName
text
An Agilent-assigned identifier for the
probe synthesized on the microarray
SystematicName
text
This is an identifier for the target
sequence that the probe was designed
to hybridize with. Where possible, a
public database identifier is used (e.g.,
TAIR locus identifier for Arabidopsis).
Systematic name is reported ONLY if
Gene name and Systematic name are
different.
Position X
Position Y
float
Found coordinates of the feature
centroid in microns
Feature Extraction Reference Guide
189
3
Text File Parameters and Results
COMPACT Features Table
Table 23
Feature results contained in the COMPACT output text file (COMPACT FEATURES table)* (continued)
Features (Green)
Features (Red)
LogRatio (base 10)
Types
Options
Description
per feature, log of
(rProcessedSignal/gProcessedSignal)
float
If SURROGATES are turned off, then:
LogRatioError
-4
if DyeNormRedSig <= 0.0 &
DyeNormGreenSig > 0.0
4
if DyeNormRedSig > 0.0 &
DyeNormGreenSig <= 0.0
0
if DyeNormRedSig <= 0.0 &
DyeNormGreenSig <= 0.0
float
If SURROGATES are turned off, then:
1000
if DyeNormRedSig <= 0.0 OR
DyeNormGreenSig <= 0.0
IF SURROGATES are turned on, then:
LogRatioError = error of the log ratio
calculated according to the error model
chosen
PValueLogRatio
gProcessedSignal
190
rProcessedSignal
float
Significance level of the Log Ratio
computed for a feature
float
The signal left after all the Feature
Extraction processing steps have been
completed. In the case of one color,
ProcesssedSignal contains the
Multiplicatively Detrended
BackgroundSubtracted Signal if the
detrending is selected and helps. If the
detrending does not help, this column
will contain the
BackgroundSubtractedSignal.
Feature Extraction Reference Guide
Text File Parameters and Results
COMPACT Features Table
Table 23
3
Feature results contained in the COMPACT output text file (COMPACT FEATURES table)* (continued)
Features (Green)
Features (Red)
Types
gProcessedSigError
rProcessedSigError
float
Options
Description
The universal or propagated error left
after all the processing steps of Feature
Extraction have been completed. In the
case of one color, ProcessedSignalError
has had the Error Model applied and will
contain at least the larger of the
universal (UEM) error or the propagated
error.
If multiplicative detrending is performed,
ProcessedSignalError contains the error
propagated from detrending. This is
done by dividing the error by the
normalized MultDetrendSignal.
gMedianSignal
rMedianSignal
float
Raw median signal of feature in green
(red) channel (inlier pixels)
gBGMedianSignal
rBGMedianSignal
float
Median local background signal (local to
corresponding feature) computed per
channel (inlier pixels)
gBGPixSDev
rBGPixSDev
float
Standard deviation of all inlier pixels per
local BG of each feature, computed
independently in each channel
gIsSaturated
rIsSaturated
boolean
gIsLowPMTScaled
Up
rIsLowPMTScaled
Up
boolean
gIsFeatNonUnifOL
rIsFeatNonUnifOL
boolean
Feature Extraction Reference Guide
1 = Saturated or
0 = Not saturated
Boolean flag indicating if a feature is
saturated or not. A feature is saturated
IF 50% of the pixels in a feature are
above the saturation threshold.
1 = Low
0 = High
Reports if the feature signal value is
from the scaled-up low signal image or
from the high signal image
g(r)IsFeatNonUnifO
L = 1 indicates
Feature is a
non-uniformity
outlier in g(r)
Boolean flag indicating if a feature is a
NonUniformity Outlier or not. A feature
is non-uniform if the pixel noise of
feature exceeds a threshold established
for a “uniform” feature.
191
3
Text File Parameters and Results
COMPACT Features Table
Table 23
Feature results contained in the COMPACT output text file (COMPACT FEATURES table)* (continued)
Features (Green)
Features (Red)
Types
Options
Description
gIsBGNonUnifOL
rIsBGNonUnifOL
boolean
g(r)IsBGNonUnifOL
= 1 indicates Local
background is a
non-uniformity
outlier in g(r)
The same concept as above but for
background.
gIsFeatPopnOL
rIsFeatPopnOL
boolean
g(r)IsFeatPopnOL =
1 indicates Feature
is a population
outlier in g(r)
Boolean flag indicating if a feature is a
Population Outlier or not. Probes with
replicate features on a microarray are
examined using population statistics.
A feature is a population outlier if its
signal is less than a lower threshold or
exceeds an upper threshold determined
using a multiplier (1.42) times the
interquartile range (i.e., IQR) of the
population.
gIsBGPopnOL
rIsBGPopnOL
IsManualFlag
boolean
g(r)IsBGPopnOL = 1
indicates local
background is a
population outlier in
g(r)
boolean
The same concept as above but for
background
Flags features for downstream filtering
in third party gene expression software.
gBGSubSignal
rBGSubSignal
float
g(r)BGSubSignal =
g(r)MeanSignal g(r)BGUsed
Background-subtracted signal. To
display the values used to calculate this
variable using different background
signals and settings of spatial detrend
and global background adjust, see
Table 34 on page 254.
gIsPosAndSignif
rIsPosAndSignif
boolean
g(r)isPosAndSignif
= 1 indicates
Feature is positive
and significant
above background
Boolean flag, established via a 2-sided
t-test, indicates if the mean signal of a
feature is greater than the
corresponding background (selected by
user) and if this difference is significant.
To display variables used in the t-test,
see Table 34 on page 254.
192
Feature Extraction Reference Guide
Text File Parameters and Results
COMPACT Features Table
Table 23
3
Feature results contained in the COMPACT output text file (COMPACT FEATURES table)* (continued)
Features (Green)
Features (Red)
Types
gIsWellAboveBG
rIsWellAboveBG
boolean
Options
Description
Boolean flag indicating if a feature is
WellAbove Background or not,
feature passes g(r)IsPosAndSignif and
additionally the g(r)BGSubSignal is
greater than 2.6*g(r)BG_SD. You can
change the multiplier 2.6.
SpotExtentX
float
Diameter of the spot (X-axis)
float
Mean local background signal (local to
corresponding feature) computed per
channel (inlier pixels)
gTotalProbeSignal
float
This signal is the robust average of all
the processed green signals for each
replicated probe multiplied by the total
number of probe replicates, the
EffectiveFeature SizeFraction, the
Nominal Spot Area and the Weight. For
miRNA analyses
gTotalProbeError
float
This error is the robust average of all the
processed green signal errors for each
replicated probe multiplied by the total
number of probe replicates, the
EffectiveFeature SizeFraction, the
Nominal Spot Area and the Weight. For
miRNA analyses
gTotalGeneSignal
float
This signal is the sum of the total probe
signals in the green channel per gene.
For miRNA analyses.
gTotalGeneError
float
This error is the square root of the sum
of the squares of the TotalProbeError.
For miRNA analyses.
gIsGeneDetected
boolean
Lets you know if the gene was detected
on the miRNA microarray.
gBGMeanSignal
rBGMeanSignal
* Results are reported to 9 decimal places in exponential notation for all result files.
Feature Extraction Reference Guide
193
3
Text File Parameters and Results
QC Features Table
QC Features Table
Table 24
Features (Green)
Features (Red)
Types
Feature results contained in the QC output text file (QC
FEATURES table)
Options
Description
FeatureNum
integer
Feature number
Row
integer
Feature location: row
Col
integer
Feature location: column
SubTypeMask
integer
Numeric code defining the subtype of
any control feature
ControlType
integer
Feature control type (See “XML Control
Type output” on page 220 for
definitions.)
0
1
-1
-15000
-20000
-30000
Control type none
Positive control
Negative control
SNP
Not probe (See Ch. 4 for definition)
Ignore (See Ch. 4 for definition)
ProbeName
text
An Agilent-assigned identifier for the
probe synthesized on the microarray
SystematicName
text
This is an identifier for the target
sequence that the probe was designed
to hybridize with. Where possible, a
public database identifier is used (e.g.,
TAIR locus identifier for Arabidopsis).
Systematic name is reported ONLY if
Gene name and Systematic name are
different.
Description
text
Description of gene
194
Feature Extraction Reference Guide
Text File Parameters and Results
QC Features Table
Features (Green)
Features (Red)
PositionX
Types
Options
LogRatio (base 10)
Description
float
Found coordinates of the feature
centroid in microns
float
per feature, log of
(rProcessedSignal/gProcessedSignal)
PositionY
3
If SURROGATES are turned off, then:
LogRatioError
-4
if DyeNormRedSig <= 0.0 &
DyeNormGreenSig > 0.0
4
if DyeNormRedSig > 0.0 &
DyeNormGreenSig <= 0.0
0
if DyeNormRedSig <= 0.0 &
DyeNormGreenSig <= 0.0
float
If SURROGATES are turned off, then:
1000
if DyeNormRedSig <= 0.0 OR
DyeNormGreenSig <= 0.0
IF SURROGATES are turned on, then:
LogRatioError = error of the log ratio
calculated according to the error model
chosen
PValueLogRatio
Feature Extraction Reference Guide
float
Significance level of the LogRatio
computed for a feature
195
3
Text File Parameters and Results
QC Features Table
Features (Green)
Features (Red)
Types
Options
Description
gProcessedSignal
rProcessedSignal
float
The signal left after all the Feature
Extraction processing steps have been
completed. In the case of one color,
ProcesssedSignal contains the
Multiplicatively Detrended
BackgroundSubtracted Signal if the
detrending is selected and helps. If the
detrending does not help, this column
will contain the
BackgroundSubtractedSignal.
gProcessedSigError
rProcessedSigError
float
The universal or propagated error left
after all the processing steps of Feature
Extraction have been completed. In the
case of one color, ProcessedSignalError
has had the Error Model applied and will
contain at least the larger of the
universal (UEM) error or the propagated
error.
If multiplicative detrending is performed,
ProcessedSignalError contains the error
propagated from detrending. This is
done by dividing the error by the
normalized MultDetrendSignal.
gNumPixOLHi
rNumPixOLHi
integer
Number of outlier pixels per feature with
intensity > upper threshold set via the
pixel outlier rejection method. The
number is computed independently in
each channel. These pixels are omitted
from all subsequent calculations.
gNumPixOLLo
rNumPixOLLo
integer
Number of outlier pixels per feature with
intensity < lower threshold set via the
pixel outlier rejection method. The
number is computed independently in
each channel. These pixels are omitted
from all subsequent calculations.
NOTE: The pixel outlier method is the
ONLY step that removes data in Feature
Extraction.
196
Feature Extraction Reference Guide
Text File Parameters and Results
QC Features Table
Features (Green)
Features (Red)
Types
gNumPix
rNumPix
integer
Total number of pixels used to compute
feature statistics; i.e. total number of
inlier pixels/per spot; same in both
channels
gMeanSignal
rMeanSignal
float
Raw mean signal of feature from inlier
pixels in green and/or red channel
gMedianSignal
rMedianSignal
float
Raw median signal of feature from inlier
pixels in green and/or red channel
gPixSDev
rPixSDev
float
Standard deviation of all inlier pixels per
feature; this is computed independently
in each channel.
gBGMeanSignal
rBGMeanSignal
float
Mean local background signal (local to
corresponding feature) computed per
channel (inlier pixels)
gBGMedianSignal
rBGMedianSignal
float
Median local background signal (local to
corresponding feature) computed per
channel (inlier pixels)
gBGPixSDev
rBGPixSDev
float
Standard deviation of all inlier pixels per
local BG of each feature, computed
independently in each channel
gIsSaturated
rIsSaturated
boolean
gIsLowPMTScaled
Up
rIsLowPMTScaled
Up
boolean
BGPixCorrelation
gIsFeatNonUnifOL
Options
3
1 = Saturated or
0 = Not saturated
Boolean flag indicating if a feature is
saturated or not. A feature is saturated
IF 50% of the pixels in a feature are
above the saturation threshold.
1 = Low
Reports if the feature signal value is
from the scaled-up low signal image or
from the high signal image
0 = High
float
rIsFeatNonUnifOL
Feature Extraction Reference Guide
boolean
Description
The same concept as above but in case
of background.
g(r)IsFeatNonUnifO
L = 1 indicates
Feature is a
non-uniformity
outlier in g(r)
Boolean flag indicating if a feature is a
NonUniformity Outlier or not. A feature
is non-uniform if the pixel noise of
feature exceeds a threshold established
for a “uniform” feature.
197
3
Text File Parameters and Results
QC Features Table
Features (Green)
Features (Red)
Types
Options
Description
gIsBGNonUnifOL
rIsBGNonUnifOL
boolean
g(r)IsBGNonUnifOL
= 1 indicates Local
background is a
non-uniformity
outlier in g(r)
The same concept as above but for
background.
gIsFeatPopnOL
rIsFeatPopnOL
boolean
g(r)IsFeatPopnOL =
1 indicates Feature
is a population
outlier in g(r)
Boolean flag indicating if a feature is a
Population Outlier or not. Probes with
replicate features on a microarray are
examined using population statistics.
A feature is a population outlier if its
signal is less than a lower threshold or
exceeds an upper threshold determined
using a multiplier (1.42) times the
interquartile range (i.e., IQR) of the
population.
gIsBGPopnOL
rIsBGPopnOL
IsManualFlag
boolean
g(r)IsBGPopnOL = 1
indicates local
background is a
population outlier in
g(r)
boolean
The same concept as above but for
background
Flags features for downstream filtering
in third party gene expression software.
gBGSubSignal
rBGSubSignal
float
g(r)BGSubSignal =
g(r)MeanSignal g(r)BGUsed
Background-subtracted signal. To
display the values used to calculate this
variable using different background
signals and settings of spatial detrend
and global background adjust, see
Table 34 on page 254.
gIsPosAndSignif
rIsPosAndSignif
Boolean
g(r)isPosAndSignif
= 1 indicates
Feature is positive
and significant
above background
Boolean flag, established via a 2-sided
t-test, indicates if the mean signal of a
feature is greater than the
corresponding background (selected by
user) and if this difference is significant.
To display variables used in the t-test,
see Table 34 on page 254.
198
Feature Extraction Reference Guide
Text File Parameters and Results
QC Features Table
Features (Green)
Features (Red)
Types
gIsWellAboveBG
rIsWellAboveBG
Boolean
Options
3
Description
Boolean flag indicating if a feature is
WellAbove Background or not,
feature passes g(r)IsPosAndSignif and
additionally the g(r)BGSubSignal is
greater than 2.6*g(r)BG_SD. You can
change the multiplier 2.6.
SpotExtentX
float
Diameter of the spot (X-axis)
float
Mean local background signal (local to
corresponding feature) computed per
channel (inlier pixels)
gTotalProbeSignal
float
This signal is the robust average of all
the processed green signals for each
replicated probe multiplied by the total
number of probe replicates, the
EffectiveFeature SizeFraction, the
Nominal Spot Area and the Weight. For
miRNA analyses
gTotalProbeError
float
This error is the robust average of all the
processed green signal errors for each
replicated probe multiplied by the total
number of probe replicates, the
EffectiveFeature SizeFraction, the
Nominal Spot Area and the Weight. For
miRNA analyses
gTotalGeneSignal
float
This signal is the sum of the total probe
signals in the green channel per gene.
For miRNA analyses.
gTotalGeneError
float
This error is the square root of the sum
of the squares of the TotalProbeError.
For miRNA analyses.
gIsGeneDetected
boolean
Lets you know if the gene was detected
on the miRNA microarray.
gBGMeanSignal
rBGMeanSignal
Feature Extraction Reference Guide
199
3
Text File Parameters and Results
MINIMAL Features Table
MINIMAL Features Table
Table 25
Features (Green)
Features (Red)
Types
Feature results contained in the MINIMAL output text file
(MINIMAL FEATURES table)
Options
Description
FeatureNum
integer
Feature number
Row
integer
Feature location: row
Col
integer
Feature location: column
ControlType
integer
Feature control type (See “XML Control
Type output” on page 220 for
definitions.)
0
1
-1
-15000
-20000
-30000
Control type none
Positive control
Negative control
SNP
Not probe (See Ch. 4 for definition)
Ignore (See Ch. 4 for definition)
ProbeName
text
An Agilent-assigned identifier for the
probe synthesized on the microarray
SystematicName
text
This is an identifier for the target
sequence that the probe was designed
to hybridize with. Where possible, a
public database identifier is used (e.g.,
TAIR locus identifier for Arabidopsis).
Systematic name is reported ONLY if
Gene name and Systematic name are
different.
200
Feature Extraction Reference Guide
Text File Parameters and Results
MINIMAL Features Table
Features (Green)
Features (Red)
LogRatio (base 10)
Types
Options
3
Description
per feature, log of
(rProcessedSignal/gProcessedSignal)
float
If SURROGATES are turned off, then:
LogRatioError
-4
if DyeNormRedSig <= 0.0 &
DyeNormGreenSig > 0.0
4
if DyeNormRedSig > 0.0 &
DyeNormGreenSig <= 0.0
0
if DyeNormRedSig <= 0.0 &
DyeNormGreenSig <= 0.0
float
If SURROGATES are turned off, then:
1000
if DyeNormRedSig <= 0.0 OR
DyeNormGreenSig <= 0.0
IF SURROGATES are turned on, then:
LogRatioError = error of the log ratio
calculated according to the error model
chosen
PValueLogRatio
gProcessedSignal
rProcessedSignal
Feature Extraction Reference Guide
float
Significance level of the LogRatio
computed for a feature
float
The signal left after all the Feature
Extraction processing steps have been
completed. In the case of one color,
ProcesssedSignal contains the
Multiplicatively Detrended
BackgroundSubtracted Signal if the
detrending is selected and helps. If the
detrending does not help, this column
will contain the
BackgroundSubtractedSignal.
201
3
Text File Parameters and Results
MINIMAL Features Table
Features (Green)
Features (Red)
Types
gProcessedSigError
rProcessedSigError
float
Options
Description
The universal or propagated error left
after all the processing steps of Feature
Extraction have been completed. In the
case of one color, ProcessedSignalError
has had the Error Model applied and will
contain at least the larger of the
universal (UEM) error or the propagated
error.
If multiplicative detrending is performed,
ProcessedSignalError contains the error
propagated from detrending. This is
done by dividing the error by the
normalized MultDetrendSignal.
gNumPixOLHi
rNumPixOLHi
integer
Number of outlier pixels per feature with
intensity > upper threshold set via the
pixel outlier rejection method. The
number is computed independently in
each channel. These pixels are omitted
from all subsequent calculations.
gMedianSignal
rMedianSignal
float
Raw median signal of feature from inlier
pixels in green and/or red channel
gPixNormIQR
rPixNormIQR
float
The normalized Inter-quartile range of
all of the inlier pixels per feature. The
range is computed independently in
each channel.
gIsSaturated
rIsSaturated
boolean
1 = Saturated or
0 = Not saturated
Boolean flag indicating if a feature is
saturated or not. A feature is saturated
IF 50% of the pixels in a feature are
above the saturation threshold.
gIsFeatNonUnifOL
rIsFeatNonUnifOL
boolean
g(r)IsFeatNonUnifO
L = 1 indicates
Feature is a
non-uniformity
outlier in g(r)
Boolean flag indicating if a feature is a
NonUniformity Outlier or not. A feature
is non-uniform if the pixel noise of
feature exceeds a threshold established
for a “uniform” feature.
202
Feature Extraction Reference Guide
Text File Parameters and Results
MINIMAL Features Table
Features (Green)
Features (Red)
Types
Options
Description
gIsFeatPopnOL
rIsFeatPopnOL
boolean
g(r)IsFeatPopnOL =
1 indicates Feature
is a population
outlier in g(r)
Boolean flag indicating if a feature is a
Population Outlier or not. Probes with
replicate features on a microarray are
examined using population statistics.
3
A feature is a population outlier if its
signal is less than a lower threshold or
exceeds an upper threshold determined
using a multiplier (1.42) times the
interquartile range (i.e., IQR) of the
population.
gIsWellAboveBG
rIsWellAboveBG
Boolean
Boolean flag indicating if a feature is
WellAbove Background or not,
feature passes g(r)IsPosAndSignif and
additionally the g(r)BGSubSignal is
greater than 2.6*g(r)BG_SD. You can
change the multiplier 2.6.
Feature Extraction Reference Guide
203
3
Text File Parameters and Results
Other text result file annotations
Other text result file annotations
The following public accession numbers may or may not
show up in the Feature Results section of the output text
file.
Table 26
204
Public accession numbers in the output text file
Abbreviation
Description
dbj
DNA Database of Japan
emb
EMBL
gb
GenBank
gbpri
GenBank primate nucleotide accession number
gi
GenBank Gene Identifier
gp
GenPept protein identification number
mgi
Mouse Genome Informatics
pdb
Brookhaven Protein data bank
pir
NBRF PIR
prf
Protein Research Foundation
rafl
RIKEN full Length cDNA
ref
RefSeq
sp
SwissProt
tair
The Arabidopsis Information Resource
ug
UniGenelocuslink: LocusLink ID
wi
Whitehead
Feature Extraction Reference Guide
Agilent Feature Extraction 12.0
Reference Guide
4
MAGE-ML (XML) File Results
How Agilent output file formats are used by databases 206
MAGE-ML results 207
Helpful hints for transferring Agilent output files 220
This chapter provides a listing of MAGE-ML results in the
form of tables. Refer to these tables when you want to know
the results reported in a particular file. This chapter also
contains a section on TIFF files and formats.
Agilent Technologies
205
4
MAGE-ML (XML) File Results
How Agilent output file formats are used by databases
How Agilent output file formats are used by databases
Pattern files should be loaded to
the database via FTP if possible to
ensure that the pattern element,
name attribute, is used to name the
pattern.
Data analysis programs must match up information about
the layout and annotation of the microarray features with
the profile result files for each microarray within their
databases. Agilent provides this design information for its
microarrays in a variety of file formats, including GAL and
MAGE-ML. These files describe the gene probes and their
number and spacing on the microarray. Profile result files
contain the signal and error information for each of the
hybridized gene probes on the microarray.
Both pattern files and profile result files contain information
that can be formatted in several ways: tab-delimited text
format or an XML format, MAGE-ML.
Agilent only supports GEML2 Pattern files and MAGE-ML
profiles for use with Rosetta Resolver. The pattern name in
Rosetta Resolver should match the profile pattern name
embedded in the profile data so that the data can be
correctly associated. To do this, use the pattern autoimport
function in Rosetta Resolver or correctly specify the pattern
name when manually importing the pattern. (The Agilent
pattern name in most cases is “Agilent-xxxxxx” where the
xxxxxx is the AMADID number of the microarray.)
For transfer of data into GeneSpring, the pattern
information can be obtained from within the Feature
Extraction profile tab text file or can be obtained by
download from the GeneSpring Web site.
206
Feature Extraction Reference Guide
MAGE-ML (XML) File Results
MAGE-ML results
4
MAGE-ML results
Differences between MAGE-ML and text result files
The MAGE-ML result file includes most of the same
parameters, statistics and results as the FULL text result file
with the following differences:
• Scanner control parameters are included in the file.
• Some Feature Extraction parameter names (FE PARAMS
table) have been changed to accommodate Rosetta
Resolver terminology.
• MAGE result file includes all information included in the
FEATURES table except for annotations, deletion control
information and spot size information.
• Feature results (FEATURES table) are associated with
quantitation types as defined by the Object Management
Group in its Gene Expression Specification paper of
February 2003 V.1. These types are listed here:
• Measured Signal
• Derived Signal
• Ratio
• Confidence Indicators—error and p-value
• Specialized Quantitation Type (SQT) — includes all
other data
Full and Compact Output Packages
In the Properties sheet for the project you can select if you
want the MAGE-ML result file to contain all the possible
columns and results (Full) or a reduced set of results
(Compact).
Feature Extraction Reference Guide
207
4
MAGE-ML (XML) File Results
Tables for Full Output Package
MAGE-ML files can also be compressed before they are sent
via FTP. Compressed MAGE-ML files further reduces the size
of the file to decrease the transfer time. Use both Compact
and Compressed MAGE-ML files for Resolver. The Compact
package contains only those columns required by Resolver,
GeneSpring, CGH Analytics and Chip Analytics.
In the Compact version of the MAGE-ML file, the entire
FEPARAMS section is included. MAGE-ML has a rich
mechanism for describing protocols and protocol parameters.
Tables for Full Output Package
Table 27
208
Scan protocol parameters in MAGE-ML result file
Parameter
Description
Image acquisition identifier
Barcode or identifier for microarray
Log information
Warnings and errors during run
Activity date
Time stamp for scanner run
Scanner information
Information such as name, make
model and serial number of scanner
Operator
Person that runs scanner
ScanNumber
Number of the scan associated with
the values listed in this table
Red.LASER_POWER_VALUE
Value of laser power in red channel
Green.LASER_POWER_VALUE
Value of laser power in green channel
Red.PMT_GAIN_VALUE
Photomultiplier gain in red channel
Green.PMT_GAIN_VALUE
Photomultiplier gain in green channel
Red.Saturation_Value
Signal value beyond which signal is
saturated in the red channel
Green.Saturation_Value
Signal value beyond which signal is
saturated in the green channel
Feature Extraction Reference Guide
MAGE-ML (XML) File Results
Tables for Full Output Package
Table 27
Description
MICRONS_PER_PIXEL_X
Radius of pixel in the x direction
MICRONS_PER_PIXEL_Y
Radius of pixel in the y direction
GlassThickness
Thickness of microarray slide
Red.DarkOffsetAverage
Dark offset data per image in red
channel as measured by scanner
Green.DarkOffsetAverage
Dark offset data per image in green
channel as measured by scanner
PercentAutoFocusHold
Amount of movement in the autofocus
because of fluctuations in the glass
DarkOffsetSubtracted
Resulting signal when dark offset
value is subtracted
Table 28
Feature Extraction Reference Guide
Scan protocol parameters in MAGE-ML result file (continued)
Parameter
T
N O TE
4
Feature Extraction protocol parameters in MAGE-ML result file
Differences between FEPARAMS in text file and MAGE-ML file
Text File FEPARAMS
MAGE-ML File FEPARAMS
Ratio_ErrorModel
Error Model
Ratio_AddErrorRed
Red.ADDITIVE_ERROR
Ratio_AddErrorGreen
Green.ADDITIVE_ERROR
Ratio_MultErrorRed
Red.MULTIPLICATIVE_ERROR
Ratio_MultErrorGreen
Green.MULTIPLICATIVE_ERROR
For 1-color, red signals and log ratios are not included in the MAGE-ML
output files.
209
4
MAGE-ML (XML) File Results
Tables for Full Output Package
Table 29
Feature results (Full) contained in the MAGE-ML (FEATURES table)
Quant
Type
Features (Green)
SQT*
X_IMAGE_POSITION
SQT
Features (Red)
Options
Description
Y_IMAGE_POSITION
Found coordinates of the feature
centroid
SpotExtentX
Diameter of the spot (X- or Y-Axis)
SpotExtentY
Ratio
LogRatio (base 10)
log(REDsignal/GREENsignal) per
feature (processed signals used to
calculate log ratio)
If SURROGATES are turned off, then:
Error
-4
if DyeNormRedSig <= 0.0 &
DyeNormGreenSig > 0.0
4
if DyeNormRedSig > 0.0 &
DyeNormGreenSig <= 0.0
0
if DyeNormRedSig <= 0.0 &
DyeNormGreenSig <= 0.0
LogRatioError
If SURROGATES are turned off, then:
1000
if DyeNormRedSig <= 0.0 OR
DyeNormGreenSig <= 0.0
IF SURROGATES are turned on, then:
LogRatioError = error of the log ratio
calculated according to the error model
chosen
PValue
PValueLogRatio
SQT
gSurrogateUsed
210
Significance level of the Log Ratio
computed for a feature
rSurrogateUsed
Non-zero value
The g(r) surrogate value used
0
No surrogate value used
Feature Extraction Reference Guide
MAGE-ML (XML) File Results
Tables for Full Output Package
Table 29
4
Feature results (Full) contained in the MAGE-ML (FEATURES table)
Quant
Type
Features (Green)
Features (Red)
SQT
gIsFound
rIsFound
Options
Description
1 = IsFound
A boolean used to flag found (strong)
features. The flag is applied
independently in each channel.
0 = IsNotFound
A feature is considered found if the
calculated spot centroid is within the
bounds of the spot deviation limit with
respect to corresponding nominal
centroid. NOTE: IsFound was
previously termed IsStrong.
Derived
Signal
Green.DerivedSignal
Red.DerivedSignal
The propagated feature signal, per
channel, used for computation of log
ratio
Error
Green.ProcessedSig
Error
Red.ProcessedSig
Error
Standard error of propagated feature
signal, per channel
SQT
gNumPixOLHi
rNumPixOLHi
Number of outlier pixels per feature
with intensity > upper threshold set via
the pixel outlier rejection method. The
number is computed independently in
each channel. These pixels are omitted
from all subsequent calculations.
SQT
gNumPixOLLo
rNumPixOLLo
Number of outlier pixels per feature
with intensity < lower threshold set via
the pixel outlier rejection method. The
number is computed independently in
each channel.
NOTE: The pixel outlier method is the
ONLY step that removes data in
Feature Extraction.
SQT
gNumPix
rNumPix
Feature Extraction Reference Guide
Total number of pixels used to compute
feature statistics, i.e., total number of
inlier pixels/per spot, same in both
channels
211
4
MAGE-ML (XML) File Results
Tables for Full Output Package
Table 29
Feature results (Full) contained in the MAGE-ML (FEATURES table)
Quant
Type
Features (Green)
Features (Red)
Measur
ed
Signal
Green.Measured
Signal
Red.Measured
Signal
Raw mean signal of feature in green
(red) channel
SQT
gMedianSignal
rMedianSignal
Raw median signal of feature in green
(red) channel
SQT
gNetSignal
rNetSignal
MeanSignal minus DarkOffset
Error
Green.PixSDev
Red.PixSDev
Standard deviation of all inlier pixels
per feature. This is computed
independently in each channel.
SQT
gBGNumPix
rBGNumPix
Total Number of pixels used to
compute Local BG statistics per spot;
i.e., total number of BG inlier pixels.
This number is computed
independently in each channel.
Measur
ed
Signal
Green.Background
Red.Background
Mean local background signal (local to
corresponding feature) computed per
channel
SQT
gBGMedianSignal
rBGMedianSignal
Median local background signal (local
to corresponding feature) computed
per channel
Error
Green.BGPixSDev
Red.BGPixSDev
Standard deviation of all inlier pixels
per Local BG of each feature,
computed independently in each
channel
SQT
gNumSatPix
rNumSatPix
Total number of saturated pixels per
feature, computed per channel
SQT
gIsSaturated
rIsSaturated
212
Options
1 = Saturated or
0 = Not saturated
Description
Integer indicating if a feature is
saturated or not. A feature is saturated
IF 50% of the pixels in a feature are
above the saturation threshold.
Feature Extraction Reference Guide
MAGE-ML (XML) File Results
Tables for Full Output Package
Table 29
Feature results (Full) contained in the MAGE-ML (FEATURES table)
Quant
Type
Features (Green)
Features (Red)
SQT
gIsLowPMTScaledUp
rIsLowPMTScaledUp
Options
Description
1 = Low
For XDR features, this is an integer
indicating if the low PMT value was
used for the calculations, or the high
value.
0 = High
SQT
4
PixCorrelation
Ratio of estimated feature covariance
in RedGreen space to product of
feature Standard Deviation in Red
Green space
The covariance of two features
measures their tendency to vary
together, i.e., to co-vary. In this case, it
is a cumulative quantitation of the
tendency of pixels belonging to a
particular feature in Red and Green
spaces to co-vary.
float
BGPixCorrelation
The same concept as above but in case
of background
SQT
gIsFeatNonUnifOL
rIsFeatNonUnifOL
g(r)IsFeatNonUnifOL
= 1 indicates Feature
is a non-uniformity
outlier in g(r)
Integer indicating if a feature is a
NonUniformity Outlier or not. A feature
is non-uniform if the pixel noise of
feature exceeds a threshold
established for a “uniform” feature.
SQT
gIsBGNonUnifOL
rIsBGNonUnifOL
g(r)IsBGNonUnifOL =
1 indicates Local
background is a
non-uniformity outlier
in g(r)
The same concept as above but for
background
Feature Extraction Reference Guide
213
4
MAGE-ML (XML) File Results
Tables for Full Output Package
Table 29
Feature results (Full) contained in the MAGE-ML (FEATURES table)
Quant
Type
Features (Green)
Features (Red)
Options
Description
SQT
gIsFeatPopnOL
rIsFeatPopnOL
g(r)IsFeatPopnOL = 1
indicates Feature is a
population outlier in
g(r)
Boolean flag indicating if a feature is a
Population Outlier or not. Probes with
replicate features on a microarray are
examined using population statistics.
A feature is a population outlier if its
signal is less than a lower threshold or
exceeds an upper threshold
determined using a multiplier (1.42)
times the interquartile range (i.e., IQR)
of the population.
SQT
gIsBGPopnOL
SQT
IsManualFlag
SQT
gBGSubSignal
Error
gBGSubSigError
SQT
BGSubSigCorrelation
214
rIsBGPopnOL
g(r)IsBGPopnOL = 1
indicates local
background is a
population outlier in
g(r)
The same concept as above but for
background
rBGSubSignal
gBGSubSignal =
gMeanSignal gBGUsed
Background-subtracted signal
rBGSubSigError
To display the values used to calculate
this variable using different
background signals and settings of
spatial detrend and global background
adjust, see Table 34 on page 254.
Propagated standard error as
computed on net g(r)
background-subtracted signal
Ratio of estimated backgroundsubtracted feature signal covariance in
RG space to product of backgroundsubtracted feature Standard Deviation
in RG space
Feature Extraction Reference Guide
MAGE-ML (XML) File Results
Tables for Full Output Package
Table 29
4
Feature results (Full) contained in the MAGE-ML (FEATURES table)
Quant
Type
Features (Green)
Features (Red)
Options
Description
SQT
gIsPosAndSignif
rIsPosAndSignif
g(r)isPosAndSignif =
1 indicates Feature is
positive and
significant above
background
Boolean flag, established via a 2-sided
t-test, indicates if the mean signal of a
feature is greater than the
corresponding background (selected
by user) and if this difference is
significant. To display variables used in
the t-test, see Table 34 on page 254.
SQT
gPValFeatEqBG
rPValFeatEqBG
P-value from t-test of significance
between g(r)Mean signal and g(r)
background
SQT
gIsWellAboveBG
rIsWellAboveBG
Boolean flag indicating if a feature is
WellAbove Background or not
Feature passes g(r)IsPosAndSignif and
additionally the g(r)BGSubSignal is
greater than 2.6*g(r)BGSDUsed.
Boolean gSpatialDetrendIsIn
FilteredSet
rSpatialDetrendIsIn
FilteredSet
Set to true for a given feature if it is
part of the filtered set used to detrend
the background. This feature is
considered part of the locally weighted
lowest x% of features as defined by the
DetrendLowPassPercentage.
float
gSpatialDetrend
SurfaceValue
rSpatialDetrend
SurfaceValue
Value of the smoothed surface
calculated by the Spatial detrend
algorithm
SQT
IsUsedBGAdjust
SQT
gBGUsed
rBGUsed
1 = Feature used
0 = Feature not used
A boolean used to flag features used
for computation of global BG offset
gBGSubSignal =
gMeanSignal gBGUsed
Background used to subtract from the
MeanSignal; variable also used in
t-test. To display the values used to
calculate this variable using different
background signals and settings of
spatial detrend and global background
adjust, see Table 34 on page 254.
* SQT — Specialized Quantitation Type
Feature Extraction Reference Guide
215
4
MAGE-ML (XML) File Results
Table for Compact Output Package
Table for Compact Output Package
This table contains only those columns required by Resolver,
GeneSpring, CGH Analytics and Chip Analytics.
In the Compact version of the MAGE-ML file, the entire
FEPARAMS section is included. MAGE-ML has a rich
mechanism for describing protocols and protocol parameters.
Table 30
Feature results (Compact) contained in the MAGE-ML (FEATURES table)
Quant
Type
Features (Green)
Ratio
LogRatio (base 10)
Features (Red)
Options
Description
log(REDsignal/GREENsignal) per feature
(processed signals used to calculate log
ratio)
If SURROGATES are turned off, then:
SQT*
X_IMAGE_POSITION
Y_IMAGE_POSITION
216
-4
if DyeNormRedSig <= 0.0 &
DyeNormGreenSig > 0.0
4
if DyeNormRedSig > 0.0 &
DyeNormGreenSig <= 0.0
0
if DyeNormRedSig <= 0.0 &
DyeNormGreenSig <= 0.0
float
Found coordinates of the feature
centroid in microns
Feature Extraction Reference Guide
MAGE-ML (XML) File Results
Table for Compact Output Package
Table 30
Feature results (Compact) contained in the MAGE-ML (FEATURES table)
Quant
Type
Features (Green)
Error
LogRatioError
Features (Red)
Options
4
Description
If SURROGATES are turned off, then:
1000
if DyeNormRedSig <= 0.0 OR
DyeNormGreenSig <= 0.0
IF SURROGATES are turned on, then:
LogRatioError = error of the log ratio
calculated according to the error model
chosen
PValue
PValueLogRatio
Significance level of the Log Ratio
computed for a feature
Derived
Signal
Green.DerivedSignal
Red.DerivedSignal
The propagated feature signal, per
channel, used for computation of log
ratio
Error
Green.ProcessedSig
Error
Red.ProcessedSig
Error
Standard error of propagated feature
signal, per channel
Measured
Signal
Green.Measured
Signal
Red.Measured
Signal
Raw mean signal of feature in green
(red) channel
SQT
gMedianSignal
rMedianSignal
Raw median signal of feature in green
(red) channel
SQT
gBGMedianSignal
rBGMedianSignal
Median local background signal (local to
corresponding feature) computed per
channel
Error
Green.BGPixSDev
Red.BGPixSDev
Standard deviation of all inlier pixels per
Local BG of each feature, computed
independently in each channel
SQT
gIsSaturated
rIsSaturated
Feature Extraction Reference Guide
1 = Saturated or
0 = Not saturated
Integer indicating if a feature is
saturated or not. A feature is saturated IF
50% of the pixels in a feature are above
the saturation threshold.
217
4
MAGE-ML (XML) File Results
Table for Compact Output Package
Table 30
Feature results (Compact) contained in the MAGE-ML (FEATURES table)
Quant
Type
Features (Green)
SQT
gIsLowPMTScaledUp rIsLowPMTScaledUp
Features (Red)
Options
Description
1 = Low
0 = High
For XDR features, this is an integer
indicating if the low PMT value was used
for the calculations, or the high value.
SQT
gIsFeatNonUnifOL
rIsFeatNonUnifOL
g(r)IsFeatNonUnifOL
= 1 indicates
Feature is a
non-uniformity
outlier in g(r)
Integer indicating if a feature is a
NonUniformity Outlier or not. A feature is
non-uniform if the pixel noise of feature
exceeds a threshold established for a
“uniform” feature.
SQT
gIsBGNonUnifOL
rIsBGNonUnifOL
g(r)IsBGNonUnifOL
= 1 indicates Local
background is a
non-uniformity
outlier in g(r)
The same concept as above but for
background
SQT
gIsFeatPopnOL
rIsFeatPopnOL
g(r)IsFeatPopnOL =
1 indicates Feature
is a population
outlier in g(r)
Boolean flag indicating if a feature is a
Population Outlier or not. Probes with
replicate features on a microarray are
examined using population statistics.
A feature is a population outlier if its
signal is less than a lower threshold or
exceeds an upper threshold determined
using a multiplier (1.42) times the
interquartile range (i.e., IQR) of the
population.
SQT
gIsBGPopnOL
rIsBGPopnOL
g(r)IsBGPopnOL = 1
indicates local
background is a
population outlier in
g(r)
The same concept as above but for
background
SQT
gBGSubSignal
rBGSubSignal
gBGSubSignal =
gMeanSignal gBGUsed
Background-subtracted signal
218
To display the values used to calculate
this variable using different background
signals and settings of spatial detrend
and global background adjust, see
Table 34 on page 254.
Feature Extraction Reference Guide
MAGE-ML (XML) File Results
Table for Compact Output Package
Table 30
Feature results (Compact) contained in the MAGE-ML (FEATURES table)
Quant
Type
Features (Green)
SQT
IsManualFlag
SQT
gIsPosAndSignif
rIsPosAndSignif
SQT
gIsWellAboveBG
rIsWellAboveBG
Features (Red)
Options
4
Description
Boolean flag that describes if the feature
centroid was manually adjusted.
g(r)isPosAndSignif
= 1 indicates
Feature is positive
and significant
above background
Boolean flag, established via a 2-sided
t-test, indicates if the mean signal of a
feature is greater than the corresponding
background (selected by user) and if this
difference is significant. To display
variables used in the t-test, see Table 34
on page 254.
Boolean flag indicating if a feature is
WellAbove Background or not
Feature passes g(r)IsPosAndSignif and
additionally the g(r)BGSubSignal is
greater than 2.6*g(r)BGSDUsed.
* SQT — Specialized Quantitation Type
Feature Extraction Reference Guide
219
4
MAGE-ML (XML) File Results
Helpful hints for transferring Agilent output files
Helpful hints for transferring Agilent output files
XML output
There are several situations you should be aware of as you
use MAGE-ML (XML) output with gene expression data
analysis software from Rosetta BioSoftware (Rosetta
Resolver software):
If there is no barcode
If there is no barcode in the original .tif file for whatever
reason, there will be no barcode information in the
MAGE-ML output (warning message in Project Run
summary). For the data to load into Rosetta Resolver, it
must have a barcode associated with it. You can add barcode
information in the Scan Image Properties dialog box. See the
Feature Extraction 12.0 User Guide.
Access control list (ACL)
Rosetta Resolver knows about the access control list (ACL)
assigned to the scan and can easily recognize and load any
MAGE-ML file. The owner of the data sets the chip and hybe
access controls in Rosetta Resolver before importing the
profile (scan) data. For autoimport, the profile is normally
placed in the MAGE directory.
XML Control Type output
If a feature is used in dye normalization, its Control_Type is
normalization, even though it can also be a positive or
negative control. If a feature is not used in normalization, it
is either positive, negative, deletion, mismatch, or false.
220
Feature Extraction Reference Guide
MAGE-ML (XML) File Results
XML output
Table 31
4
Control Type Definitions
Name
XML
Probe
false
Positive Control
pos or positive
Negative Control
neg or negative
Not Probe*
notprobe
*Not Probe—These features are feature extracted, but they
are not used by Feature Extraction as input to any
calculations; these features are not used during outlier
analysis or for the dye normalization calculation. However,
dye normalization values and ratios are calculated, and the
results appear in the text and XML output files, and the
feature extraction visual results file. An exception is that Not
Probe’s background is used in the calculation of the local
background with the radius method.
Conversion of feature flag information
Failed (MAGE-ML) produce the following settings:
• Bit 8 (green) and 12 (red) are set if the feature is
saturated in both channels.
• Bit 18 is set if the feature, or its deletion control, is a
non-uniformity outlier in either color, or if the feature
is a population outlier in either color and the Report
Population Outliers as Failed in MAGE-ML file option
is set to True.
• Bit 23 is set if the probe is low specificity, e.g., when
the deletion control is greater than or equal to the
feature.
Feature Extraction Reference Guide
221
4
MAGE-ML (XML) File Results
TIFF Results
TIFF Results
You can transfer the original TIFF file or a JPEG file to
Rosetta Resolver or a third-party program. The shape file,
.shp, created during Feature Extraction cannot be displayed
by any program other than Agilent Feature Extraction
software.
TIFF file format options
See the Feature Extraction 12.0
User Guide for more information on
the File Info dialog box.
Feature Extraction supports the TIFF file format. All file
information for each file is listed in the File Info dialog box.
The TIFF file is compliant with Adobe version 6.0 file
format. The complete specification is available from the
following URL:
http://partners.adobe.com/asn/developer/PDFS/TN/TIFF6.pdf.
There are two sets of custom TIFF tags in the Agilent file
format.
Genetic Analysis Technology Consortium (GATC) TIFF Tags
Agilent Technologies is not a member of GATC or otherwise
connected to this organization, and makes no internal use of
these tags. They are included for the convenience of
customers who use software that requires them.
Custom TIFF Tags Agilent Technologies uses its own custom
TIFF tags for storing additional file information.
222
TIFF Tag 37701
This tag points to a data structure. This data structure is
not public, but information stored in the data structure is
available to customers in the MATLAB file format.
TIFF Tag 37702
This tag points to a string containing the file description.
The usual TIFF description tags (tag 270) are used to hold
the color name, “red” or “green,” for each image. This allows
programs that interpret only “standard” TIFF tags to
determine image colors. The Page Name tag (tag 285) also
contains the color names.
Feature Extraction Reference Guide
Agilent Feature Extraction 12.0
Reference Guide
5
How Algorithms Calculate Results
Overview of Feature Extraction algorithms 224
XDR Extraction Process 234
How each algorithm calculates a result 238
Example calculations for feature 12519 of Agilent Human 22K image 290
This chapter shows you how each Feature Extraction
algorithm uses its parameters to calculate results that are
passed on to the next algorithm and finally on to third-party
data analysis programs.
Agilent Technologies
223
5
How Algorithms Calculate Results
Overview of Feature Extraction algorithms
Overview of Feature Extraction algorithms
Protocol step algorithms operate similarly during the Feature
Extraction process for 2-color gene expression, CGH, ChIP,
and non-Agilent microarrays. That is, the algorithms and
parameter fields are similar, but the parameter values are
different depending on the protocol.
The Feature Extraction process for 1-color gene expression
microarrays includes only seven protocol steps, and for
miRNA analysis the process includes those seven steps plus
a MicroRNA Analysis step.
The examples used are primarily for 2-color microarrays.
Any differences in algorithms and functions for other
microarray experiments are also explained.
Algorithms and functions they perform
Place Grid
This algorithm finds the grid to define the nominal positions
of the spots on the microarray.
For more information on the
algorithms for XDR extraction, see
“XDR Extraction Process” on
page 234.
224
eXtended Dynamic Range (XDR) extraction For an XDR
extraction, the grid placement is done using the high
intensity scan (i.e., higher PMT voltage). The grid found
using the high intensity scan is used as the starting point
for the remaining extraction of both the high and low
intensity images.
Feature Extraction Reference Guide
How Algorithms Calculate Results
Algorithms and functions they perform
N O TE
5
With version 10.x and higher of the software, you no longer have to
perform XDR dual scans or extractions to capture the full dynamic range of
the data. You can get the same dynamic range by working with the 20-bit
TIFF Dynamic Range option. This option is meant to be a replacement for
the XDR option. You capture the full dynamic range with better accuracy.
Choosing the XDR option may still be useful if you want to compare XDR
data from the G2565BA Scanner with XDR data from the G2565CA
Scanner.
Optimize Grid Fit
This algorithm improves the grid fit on the entire
microarray. Leveraging from the Spot Finder algorithm, this
protocol step examines the spots in the four corners of the
microarray and iteratively adjusting the grid for a better fit.
If the grid has been optimized by this protocol step, the
STATS table shows the stat GridHasBeenOptimized with
boolean of 1; or a boolean of 0 if the grid has not been
optimized.
Find Spots
This algorithm locates the exact size and centroid of each
spot on the scanned microarray. Once the spot centroids
have been located, the CookieCutter algorithm or WholeSpot
algorithm defines the feature for each spot. The software
then defines the local background for each spot based on the
radius of a circle drawn around the spot.
Next, the pixel outlier algorithm identifies outlier pixels in
the feature and in the local background for each spot. These
pixels are then omitted from further calculations. This is the
only point where data is omitted. Subsequent outlier
analyses flag data, but do not remove the data.
Inlier pixels within the cookie area represent a feature while
the inlier pixels within the annulus around the feature, after
excluding the exclusion zone, represent the local background.
Feature Extraction Reference Guide
225
5
How Algorithms Calculate Results
Algorithms and functions they perform
The Feature Extraction program calculates the following
values from these inlier pixels: mean, median, standard
deviation, normalized IQR, and number of inlier pixels.
XDR extraction This is the only step that is run twice on an
XDR extraction. The spot placement and spot measurements
are found separately for the high and low intensity scans.
Then the XDR algorithm decides on a feature by feature
basis which scan the data should come from (more on this
follows). For features that are very bright in the high
intensity scan, the XDR algorithm uses the data from the
low intensity scan. This choice is made independently for
each color channel.
For each feature that uses data from the low intensity scan,
the following columns get replaced (determined separately
for red and green channels): NumPixOLHi, NumPixOLLo,
NumPix, MeanSignal, MedianSignal, PixSDev, PixNormIQR,
NumSatPix, IsSaturated, NetSignal.
These columns include the raw data from the spotfinding
and measurement steps (signal levels, pixel noise levels,
number of pixels, if the pixels and feature are saturated).
Once the substitutions have been made to some features in
each color channel, the extraction proceeds as if there were
only a single combined set of features.
Flag Outliers
Next, the Flag Outliers algorithm flags anomalous features
and local backgrounds as non-uniformity outliers and/or
population outliers. Population outlier flagging is based on
population statistics of replicate features on the microarray.
Which of two statistical tests is used to identify population
outliers depends on the number of replicate features on the
microarray.
Non-uniformity outlier flagging is based on statistical
deviation from the expected noise in the Agilent
microarray-based system (scanner, labeling/hybridization
protocols, and microarrays). The algorithm automatically
226
Feature Extraction Reference Guide
How Algorithms Calculate Results
Algorithms and functions they perform
5
calculates the B (linear) and C (constant) terms of the
polynomial fit for the expected noise for any type of
microarray experiment.
Compute Bkgd, Bias and Error
This algorithm applies background subtraction to each
feature to yield the background-subtracted intensity. You can
also apply a “spatial detrend” algorithm to estimate and
remove noise due to a systematic gradient on the
microarray.
Another algorithm can correct for any underestimation or
overestimation of the background in both the red and green
channels of low-intensity signals by applying a global
background adjustment value to the background-subtracted
signals.
Before using the algorithm for estimating the error, the
system uses an algorithm to calculate robust negative control
statistics for both CGH and miRNA data.
CGH microarrays have a variety of sequences that are used
as negative controls. Occasionally, “hot” features are not
flagged as population outliers. In addition, “hot” sequences
may exist; that is, all features of that sequence have higher
signals than features in other negative control sequences.
These problems can inflate NegC SD, which is used in the
calculation of AdditiveError for the CGH error model.
To provide an estimate of the error in the backgroundsubtracted signal calculation, the error model is now
calculated after background subtraction. The 1-color error
model has been changed to exactly mimic the 2-color error
model.
To determine if the feature intensity is significant compared
to the background intensity, two kinds of tests are available:
t-test and WellAboveBG test. Both of these tests depend
upon an estimation of background error.
The default protocol for older Agilent protocols still uses
pixel statistics of local background regions to estimate
background error in the 2-sided t-test. Newer Agilent
Feature Extraction Reference Guide
227
5
How Algorithms Calculate Results
Algorithms and functions they perform
protocols use an improved estimation of background error:
the additive error, calculated from the Agilent error model.
You can choose between these two background error
estimations in the protocol parameter field, “Significance (for
IsPosAndSignif and IsWellAboveBG)”.
The WellAboveSDMulti confidence test is used to determine
if the feature background-subtracted signal is well above its
background error.
Surrogates are calculated here and depend on the
significance model used. Given the standard t-test, the
surrogates are calculated exactly as before. Given the new
significance test based upon additive error, the surrogate
value is determined by the additive error and the p-value.
The program can also use a multiplicative detrend algorithm,
if selected or the default in the protocol, to provide a
surface fit to account for the dome effect that can happen
when microarrays are processed.
Placing the error model calculation step before the
significance calculation permits the result of the error model
calculation to be used for the significance calculation,
surrogate calculation and multiplicative detrending steps.
Correct Dye Biases
Since dye bias between the red and green channels is a
common phenomenon in a dual-color microarray platform,
this algorithm adjusts for the bias by multiplying the
background-subtracted signals with the appropriate dye
normalization factors. Both linear and non-linear (locally
weighted) normalization methods are available.
Surrogates are applied after the dye norm fit and before the
dye normalization takes place. This ensures that only real
data contribute to the fit and also surrogate data is correctly
dye-normalized for both the Linear and Lowess options.
Because 1-color experiments use only the green channel,
they do not use this protocol step. Surrogates exist and can
be used for 1-color.
228
Feature Extraction Reference Guide
How Algorithms Calculate Results
Algorithms and functions they perform
5
Compute Ratios
This algorithm determines if a feature is differentially
expressed by calculating the log ratio of the red over green
processed signals. The processed signal is the
dye-normalized signal.
Because 1-color experiments use only the green channel,
they do not use this protocol step.
MicroRNA Analysis
This step is used in the 1-color miRNA analysis after
background effects have been accounted for. The algorithms
in this step calculate the TotalGeneSignal, the
TotalGeneError, The GeneSignal, and the ProbeRatio for the
analysis.
Calculate Metrics
These algorithms calculate all the QC metrics for the
analysis. One of the primary algorithms in this step is the
gridding test, whose parameter values are hidden in the
protocol. This algorithm yields grid warnings on the
Summary Reports and the “Evaluate Grid” warning in the
QC Report. Agilent has added many more tests to assess if
gridding has been successful or not.
Protocols for Agilent arrays also have associated QC metric
sets. These metrics are calculated at this step.
Agilent miRNA protocols also have specialized metrics
calculated at this step.
Generate Results
This part of the process generates the output result files
using the parameter values specified in the protocol step
and the selections made in the Project Properties window.
This step is not discussed in this chapter.
Feature Extraction Reference Guide
229
5
How Algorithms Calculate Results
Algorithms and results they produce
Algorithms and results they produce
Table 32 summarizes the results for each algorithm (protocol
step). These result names are used in the equations for the
calculations for each algorithm.
Table 32
Algorithms (Protocol Steps) and the results they produce
Protocol Step
Results
Result Definition
Find Spots
MeanSignal
Average raw signal of feature calculated from the intensities of all
inlier pixels that represent the feature (after outlier pixel rejection).
The number of inlier pixels is shown in the column NumPix.
Find Spots
MedianSignal
Median raw signal of feature calculated from the intensities of all
inlier pixels that represent the feature (after outlier pixel rejection).
The number of inlier pixels is shown in the column NumPix.
Find Spots
BGMeanSignal
Average raw signal of the local background calculated from
intensities of all inlier pixels that represent the local background of
the feature (after outlier pixel rejection). The number of inlier pixels
is shown in the column BGNumPix.
Find Spots
BGMedianSignal
Median raw signal of the local background calculated from
intensities of all inlier pixels that represent the local background of
the feature (after outlier pixel rejection). The number of inlier pixels
is shown in the column BGNumPix.
Find Spots
NetSignal
MeanSignal minus Dark Offset
Find Spots
IsSaturated
A Boolean flag of 1 indicates that the feature is saturated; at least
50% of the inlier pixels in the feature have intensities above the
saturation threshold. One can determine the saturation level of a
feature by dividing the NumSatPix by the NumPix.
Flag Outliers
IsFeatureNonUnifOL
A Boolean flag of 1 indicates that the feature is a non-uniformity
outlier; the measured feature pixel variance is greater than the
expected feature pixel variance plus the confidence interval.
Flag Outliers
IsFeatPopOL
A Boolean flag of 1 indicates that the feature is a population
outlier. This means that the feature MeanSignal is greater than the
upper rejection boundary or less than the lower rejection boundary,
both of which are determined by multiplying a factor (1.42) by the
interquartile range of the population, made up of intra-array feature
replicates. (See “Step 6. Reject outliers” on page 245.)
230
Feature Extraction Reference Guide
How Algorithms Calculate Results
Algorithms and results they produce
Table 32
5
Algorithms (Protocol Steps) and the results they produce (continued)
Protocol Step
Results
Result Definition
Compute Bkgd, Bias
and Error
BGAdjust
An adjustment value added to the initial background-subtracted
signal to correct for underestimation or overestimation of the
background. This value can be positive or negative. Note the
BGAdjust values are reported per channel in the STATS table of
Feature Extraction text file.
Compute Bkgd, Bias
and Error
BGused
Final background signal used to subtract the background from the
feature mean signal. To view the values used to calculate this
variable using different background signals and settings of spatial
detrend and global background adjust, see Table 34 on page 254.
Compute Bkgd, Bias
and Error
BGSubSignal
Feature signal after subtraction of the background corrections. To
view the values used to calculate this variable using different
background signals and settings of spatial detrend and global
background adjust, see Table 34 on page 254.
Compute Bkgd, Bias
and Error
IsPosAndSignif
If significance is based on pixel statistics, a Boolean flag of 1
indicates that the feature MeanSignal is greater than and
significant compared to the background signal (i.e BGUsed).
If significance is based on the Additive Error of the Error Model, a
Boolean flag of 1 means that the feature MeanSignal is greater
than and significant compared to the Additive Error,
Compute Bkgd, Bias
and Error
IsWellAboveBG
A Boolean flag of 1 indicates that the feature BGSubSignal is well
above background and passes the IsPosAndSignif test.
Compute Bkgd, Bias
and Error
SpatialDetrendIsIn
FilteredSet
Set to true for a given feature if it is part of the filtered set used to
detrend the background. The feature may be in the set of locally
weighted lowest x% of features as defined by the
DetrendLowPassPercentage, may be a negative control feature or
may be part of the set of features that are in the negative control
range. The feature set is defined by the detrend method selected.
Compute Bkgd, Bias
and Error
SpatialDetrend
SurfaceValue
Value of the smoothed surface, at that feature, calculated by the
Spatial detrend algorithm
Feature Extraction Reference Guide
231
5
How Algorithms Calculate Results
Algorithms and results they produce
Table 32
Algorithms (Protocol Steps) and the results they produce (continued)
Protocol Step
Results
Result Definition
Compute Bkgd, Bias
and Error
MultDetrendSignal
A surface is fitted through the log of the background-subtracted
signal to look for multiplicative gradients. A normalized version of
that surface interpolated at each point of the microarray is stored
in MultDetrendSignal. The surface is normalized by dividing each
point by the overall average of the surface. That average is stored
in MultDetrendSurfaceAverage as a statistic.
If the protocol uses the option to fit to only replicate features, the
surface is normalized for the fit. The MultDetrend SurfaceAverage
is smaller in this case, a number around 1.
Compute Bkgd, Bias
and Error
SurrogateUsed
A non-zero surrogate value indicates that the MeanSignal is less
than or not significant versus the background or the BGSubSignal
is less than the Error, where the Error is the Additive Error for all
default Agilent Protocols.
Correct Dye Biases
DyeNormSignal
A dye-normalized signal calculated by multiplying the BGSubSignal
with the appropriate DyeNormFactor.
Correct Dye Biases
LinearDyeNormFactor
(Table 17 on page 129)
A global constant to normalize the dye bias from all feature
background-subtracted signals. LinearDyeNormFactor is
calculated such that geometric mean intensity of the selected
normalization features equals 1000.
Compute Ratios
ProcessedSignal
The signal left after all the Feature Extraction processing steps
have been completed. In the case of 1-color, ProcessedSignal
contains the Multiplicatively Detrended BackgroundSubtracted
Signal if the detrending is selected and helps. If the detrending
does not help, this column will contain the
BackgroundSubtractedSignal.
Compute Ratios
ProcessedSigError
The universal or propagated error left after all the processing steps
of the Feature Extraction process have been completed. In the case
of one color,
If multiplicative detrending is performed, ProcessedSignalError
contains the error propagated from detrending. This is done by
dividing the error by the normalized MultDetrendSignal.
Compute Ratios
232
LogRatio
Log of the ratio of rProcessedSignal over gProcessedSignal. The
log ratio indicates the level of gene expression in cyanine 5-labeled
sample relative to cyanine 3-labeled sample.
Feature Extraction Reference Guide
How Algorithms Calculate Results
Algorithms and results they produce
Table 32
5
Algorithms (Protocol Steps) and the results they produce (continued)
Protocol Step
Results
Result Definition
Compute Ratios
pValueLogRatio
P-value indicates the level of significance in the differential
expression of a gene as measured through the log ratio.
MicroRNA Analysis
gTotalGeneSignal
This signal is the sum of the total probe signals in the green
channel per gene.
MicroRNA Analysis
gTotalGeneError
This error is the square root of the sum of the squares of the
TotalProbeError.
Feature Extraction Reference Guide
233
5
How Algorithms Calculate Results
XDR Extraction Process
XDR Extraction Process
What is XDR scanning?
The Agilent scanner can cover a dynamic intensity range
greatly in excess of the range covered by a single scan.
Furthermore, Agilent microarray features can produce
signals that span a broader range of intensity than a single
scan can cover. Therefore, you can use eXtended Dynamic
Range (XDR) to cover the full dynamic intensity range of
your microarray features and hence see the most useful
biology.
To do this you set the scanner to scan twice, once at a high
PMT setting (the high intensity scan) followed immediately
by a low PMT setting (the low intensity scan). This
functionality is enabled using Agilent Scan Control Software
version 7.0. The two scans are labeled in their tiff headers
as paired scans of the same microarray.
XDR Feature Extraction process
The Feature Extraction program (v9.1 and later) uses this
information to know to extract the low and high PMT images
as a pair. In this XDR extraction type, the Feature
Extraction program processes the two scans together and
produces a single set of outputs that contain data from both
scans.
Some of the features contain data from the high intensity
scan and some from the low intensity scan. You can
determine this by viewing the column, r,gIsLowPMTScaledUp,
for each color channel. For signals that are very bright (or
saturated) in the high intensity scan (e.g., a scan at 100%
PMT gain), the XDR algorithm substitutes the data from the
low intensity scan (e.g., 10% PMT gain) after scaling the
intensity appropriately.
234
Feature Extraction Reference Guide
How Algorithms Calculate Results
XDR Feature Extraction process
5
To extract these arrays, the Feature Extraction program uses
a somewhat different flow of the image processing and data
analysis algorithms.
The Feature Extraction program places the grid on the high
intensity scan only, then finds spots using this grid on each
of the two scans.
The XDR algorithm decides which features should use the
low intensity scan data, scales these signals appropriately
and does a replacement for each feature and color channel
where appropriate. Then Feature Extraction proceeds with
the rest of the data analysis (outlier detection, background
correction, dye normalization, etc.) exactly as it would for a
single non-XDR scan.
Upon completion, the Feature Extraction program generates
results as if they were from a single measurement of the
microarray. The QC report and the stats table indicate that
the Feature Extraction program extracted an XDR image pair
by stating the new saturation value. This is the saturation
value of the low intensity scan after suitable scaling. For
instance, if the high intensity scan is at 100% and the low
intensity scan is at 10%, the new saturation values will be
around 650,000 (about 10x greater than a normal 100% PMT
gain scan). This lets you use data in your calculations
covering a much greater dynamic range.
Feature Extraction Reference Guide
235
5
How Algorithms Calculate Results
How the XDR algorithm works
How the XDR algorithm works
How does the XDR algorithm decide how to combine and
scale the data from the high intensity and low intensity
scans? The general theory is that the high intensity gives the
best results for the low end of the signal range and the low
intensity scan gives better data for bright features (less
affected by saturation). The Feature Extraction program uses
a signal level of 20,000 as the cut-off between the two scans.
If the NetSignal of the high intensity scan is greater than
20,000 counts, then the data from the low intensity scan is
used.
The low intensity scan is scanned with a lower PMT gain
than the high intensity scan (say 10% versus 100%). So to
combine the data, the signals from the low intensity scan
must be increased to match those from the high intensity
scans.
To determine the factor by which the low-intensity signal
should be scaled, the algorithm uses features that have
signals in an overlap range where both the high and low
intensity scans provide very stable data. This range is Net
Signals in the high intensity scan greater than 300 counts
and less than 20,000 counts.
Using data in this range, the Feature Extraction program
generates a linear fit (with a slope and an intercept) that
transforms the low-intensity mean signals into the same
range as high intensity scans. The final scaled signal for the
XDR extraction is MeanSignal ([low-intensity scan * slope] +
intercept).
The linear fit constants determined in this step are included
in the stats table.
For signals over 20,000 counts in the high intensity scan,
therefore, the low intensity scan signals can extend to nearly
1.2 million counts.
If the low intensity scan has a spot centroid too far from the
high intensity centroid (greater than 2 pixels), the algorithm
does not make a substitution.
236
Feature Extraction Reference Guide
How Algorithms Calculate Results
Troubleshooting the XDR extraction
5
Troubleshooting the XDR extraction
The XDR algorithm provides warnings in the project
summary report to indicate an issue with the XDR
extraction process.
• No XDR signal substitution for color red/green.
This message appears if there are no features for which
the low intensity data are substituted. This could occur on
a dim array
Computation of the XDR fit for red/green is based on only X
pairs of (high PMT, low PMT) matching values.
This message appears if very few features had data in the
overlap range for the fit. The user should check the data
in this case to confirm that the XDR combination is
satisfactory.
• Computation of the XDR fit for red/green results in a
large intercept.
This message appears if the linear fit between the low
and high intensity scans has a very large intercept.
This can be indicative of a poor linear fit. The user
should check the data in this case to confirm that the
XDR combination is satisfactory.
• Computed XDR ratio for red/green is X vs. expected Y
from PMT settings. Check scanner calibration.
This message appears if the ratio of the high/low intensity
scans is different from what is expected from the scanner.
For instance, an XDR scan set with 100% and 10% for
PMT gain settings should yield a ratio close to 10.
If this ratio is different than expected, the Feature
Extraction program may or may not have performed
correctly. But you should check the data in this case to
confirm that the XDR combination is satisfactory.
This message is more likely to appear as the low intensity
PMT gain setting gets closer 1%. This is because the
percentage error in the PMT gain setting increases as the
setting moves away from 100%.
Feature Extraction Reference Guide
237
5
How Algorithms Calculate Results
How each algorithm calculates a result
How each algorithm calculates a result
Place Grid
Step 1. Place a grid to find the nominal spot positions
After the Feature Extraction program automatically
determines the format of the grid, it initiates the next steps.
The algorithm reduces the two-dimensional image data of
the microarray to two one-dimensional data sets that are
further processed to determine the layout of the grid on the
microarray.
Projection of the two-dimensional microarray is performed
to produce two one-dimensional data sets (projected
signals). From the one-dimensional data sets, peaks of the
projected signals are filtered to determine which peaks to
retain for further processing, based on predetermined peak
height and peak width thresholds.
Nominal spacing between the features may be estimated
based on a statistical determination of a most frequent
distance between centers of retained peaks that are adjacent
to one another. Coordinates for the features on the
microarray, relative to the X and Y axes, are generated based
on the selected peaks and peak spacing. The grid is then
adjusted for rotation and skew.
The background peak shift flag helps to improve the
gridding. Ideally, all background pixels should have a gray
value of zero. In practice these values are nonzero.
When this flag is set to true, the algorithm determines the
background pixels’ pixel value from the histogram of the
image. All pixels having a non-zero value (background +/window) are set to zero, thus reducing the contribution of
background pixels in the two one-dimensional projected
signals. This shift in the peak of the background signal leads
to better determination of peaks.
238
Feature Extraction Reference Guide
How Algorithms Calculate Results
Place Grid
5
The following figures illustrate the result of applying
Background Peak Shifting. Figure 50 is a histogram of a typical
30 micron feature array before Background Peak Shifting.
Figure 51 depicts the same array after applying Background
Peak Shifting. Note that this operation is done internally in
the grid placement algorithm. The actual image data remains
unchanged. Some variations in the results are expected with
and without use of this flag as the grid positions obtained
differ.
Feature Extraction Reference Guide
Figure 50
Histogram of a 30 micron feature array image. The X-axis corresponds to the pixel value and the Y-axis to the frequency of
occurrence.
Figure 51
Zoomed in section of Figure 50. The background peaks are at
32 for the red channel and 50 for the green channel.
239
5
How Algorithms Calculate Results
Place Grid
Figure 52
Histogram of a 30 micron feature array image after Background Peak Shifting.
Figure 53
Zoomed in section of Figure 52. Note the peaks at pixel value=0. Also note the dips in the frequency of values near the
pixel value of 32 for the red channel and 50 for the green
channel.
When the Use central part of pack for slope and skew
calculation flag is set to True, the gridding algorithm is
modified to use central region of the pack to obtain slope,
skew and origin of each pack, instead of using the edges of
packs. This enables the algorithm to correctly place the grid
for arrays that have edges populated with dim spots.
When the Use the correlation method to obtain origin X of
subgrids is set to False, results obtained from the projection
data analysis are used to estimate the origin. Selecting this
option will use the same calculations used in Feature
Extraction version 10.7/10.9 or earlier. When the flag is set
to True, the software performs one extra step of correlation
following the projection data analysis to get the origin. This
option is of use particularly in cases where pack edges have
dim spots and are failing to grid.
240
Feature Extraction Reference Guide
How Algorithms Calculate Results
Optimize Grid Fit
5
Optimize Grid Fit
Step 2. Iteratively adjust grid by examining the corner spots
This algorithm improves the grid fit by leveraging from the
Spot Finder algorithm. Looking only at the specified square
area of features at each corner of the microarray, it
performs the iteratively adjust corners method up to the
maximum number of iterations specified in the protocol. It
adjusts the grid only if the following criteria are met.
• The absolute average difference between the grid position
and the spot position is within the specified Adjustment
Threshold.
• The number of features considered found by the spot
finder algorithm is within the specified Found Spot
Threshold.
Find Spots
Step 3. Locate the spot centroids
The calculation is based on an iterative Bayesianprobability-based pixel classification. A binary feature mask
is created that classifies the pixels in a region of interest
around each grid position into feature pixels or background
pixels. The approximate radius of each feature mask is
considered as the corresponding spot radius and the center
of mass of the feature mask is considered as the actual spot
centroid.
In the visual results view (.shp file), all spots that are found
are shown using a blue “X” on the spot and marked as
“Found”. For all spots, the blue cross (+) shows the location
of the grid. If the centroid cannot be found because the spot
is too weak, or the distance between + and X centroids
exceeds the range specified by the Spot Deviation Limit, this
spot is labeled “Not Found”.
Feature Extraction Reference Guide
241
5
How Algorithms Calculate Results
Find Spots
Step 4. Define features
See the Feature Extraction 10.9 User Guide for how the
Feature Extraction program defines features either with the
CookieCutter method or the WholeSpot method.
Step 5. Estimate the radius for the local background
The radius is the distance from the center of the cookie or
whole spot to the edge of the outermost region, as shown in
Figure 54. The default radius is the value specified in the
protocol. You can also enter a minimum radius whose value
is less than the default radius, or you can enter a larger
radius to capture more pixels in the background. You can
use the radius method for estimating global backgrounds as
well.
The figures in this step represent the local background for
the CookieCutter method for defining features. The radius
for the local background is estimated in the same way for
the WholeSpot method.
Feature or cookie
Exclusion zone
Local background
Figure 54
Local background in relation to other zones for
CookieCutter method
Default radius The default radius is the radius of the local
background for one feature. This radius is known as the
SELF radius and its value is the default value that you see
in the Find and Measure Spots protocol step if
autoestimation is turned off.
242
Feature Extraction Reference Guide
How Algorithms Calculate Results
Find Spots
5
Although the radius can map a
circle that appears to overlap other
features, the Feature Extraction
program does not use these pixels
to calculate the local background
signal.
Figure 55
Example of a SELF radius
The value of the default radius (in microns) depends on the
scan resolution and interspot spacing found in the TIFF and
grid template or file, shown in equation [1]:
Default Local Radius = SELF = (0.6 x Scan_resolution x Max (Interspotspacing_x, Interspotspacing_y))
[1]
For the WholeSpot method, if
extraction stops at this step, you
may need to enter a larger radius
than the protocol default radius.
The software autoestimates the Default Local Radius if
specified in the protocol. Otherwise, you can enter this
radius in the Feature Extraction Protocol Editor.
Minimum radius The minimum radius that you can enter is
the FLOOR (Default Radius), where FLOOR rounds the
calculated value of the default radius down to the next lower
integer, e.g., FLOOR (87.6) = 87.
Maximum radius The software lets you enter a maximum
radius for the local background no greater than the distance
from the center of the innermost feature to the edge of a
circle that approximately surrounds the fourth closest set of
nearest neighbors, or n=4, as shown in Equation 2. The set
of eight nearest neighbors closest to the feature of interest is
defined as n=1, as shown in Equation 3.
Feature Extraction Reference Guide
243
5
How Algorithms Calculate Results
Find Spots
Figure 56
Example of the radius for the first closest set of nearest
neighbors, or n=1 (eight nearest neighbors)
The value of the maximum radius also depends on the scan
resolution and interspot spacing in the TIFF and grid
template or file, shown in the equation.
Max radius = CEILING [(Scan_resolution x 4.7)
2
Interspotspacing_x + Interspotspacing_y
2
where CEILING rounds the calculated value up to the next
higher integer, e.g., CEILING [3.2] = 4.
Any radius The value of any radius between the minimum
and maximum that circumscribes a circle surrounding the
nth closest set of nearest neighbors from the central spot
can be approximated as:
Radius_n = Scan_resolution x n.6
2
2
Interspotspacing_x + Interspotspacing_y
[3]
where n=1,2,3 or 4. Figure 57 shows the set of nearest
neighbors where n = 2.
244
Feature Extraction Reference Guide
[2]
How Algorithms Calculate Results
Find Spots
Figure 57
5
Example of the radius for the second closest set of nearest
neighbors, or n=2
Step 6. Reject outliers
The calculation to determine the boundaries for rejection of
the outlier pixels is defined in the following equations and
diagram.
Assumptions for default value of 1.42 The following
assumptions lead to the default value of 1.42 for this
parameter.
• Normal distribution for pixel intensity, where y-axis
corresponds to pixel frequency and x-axis corresponds to
pixel intensity.
• A 99% confidence interval that the pixels of interest are
contained within the boundaries for rejection.
Feature Extraction Reference Guide
245
5
How Algorithms Calculate Results
Find Spots
The Interquartile Range (IQR) is the
range of points under a Gaussian
distribution contained between the
25th percentile mark (25% of the
points are contained under the
curve from the zero point to the
25th percentile mark) and the 75th
percentile mark. The 50th
percentile mark is coincident with
the median of the curve.
The boundary for rejection is the
point on the x-axis beyond which
all pixels will be rejected.
“D” is the distance between the
mean of the curve and the
boundary for rejection.
Calculations of default value The following calculations are
based on the above assumptions.
• If a pixel is located within the 99% confidence interval, it
is 2.6 standard deviations (SD) away from the mean. Or,
D = 2.6*SD and
.
• From the Z table for cumulative normal frequency
distribution, the ZP=0.75 = 0.675.
Therefore,
SD = IQR/2
• If you combine the four equations above and solve for the
Mult_factor, the Mult_factor = 1.42.
• If you would rather use a 95% confidence interval, IQR
Mult_factor = 0.952. The reason for this is, assuming
normal distribution and infinite degrees of freedom,
D = 1.96 * SD =
.
Figure 58
Important points on Gaussian curve—# of pixels vs.
intensity
Step 7. Calculate the mean signal of the feature (MeanSignal)
The intensities of inlier pixels of a feature are averaged to
give mean signal of the feature before background
subtraction. The NumPix column in the result file lists the
number of inlier pixels in the cookie that remain after
rejection of outlier pixels.
246
Feature Extraction Reference Guide
How Algorithms Calculate Results
Find Spots
5
[4]
where n is the # of inlier pixels (i.e. NumPix), and Xi is
pixel intensity in the feature
The number of pixels that are removed as outliers at the
high end and low end of the intensity distribution are shown
in 4 columns of the FEATURES table: NumPixOLLo and
NumPixOLHi (for both red and green channels).
If the method in the protocol for
calculating the spot value from
pixel statistics has been chosen to
be Median/Normalized
InterQuartile Range instead of
Mean/Standard Deviation, the
program makes these substitutions
for the spot value and background
subtraction calculations:
MedianSignal for MeanSignal
BGMedianSignal for BGMean
Signal
PixNorm IQR for PixSDev
GPixNormIQR for BGPixSDev
NormIQR = 0.7413 x IQR
The program does not make these
substitutions for the Feature
NonUniformity Outlier algorithm.
See the previous page for the
definition of the Interquartile
Range (IQR).
Feature Extraction Reference Guide
Step 8. Calculate the mean signal of the local background
(BGMeanSignal)
The intensities of local background inlier pixels are averaged
to give the local background mean signal. The BGNumPix
column in the result file lists the number of inlier pixels in
the local background radius that remain after rejection of
outlier pixels.
[5]
where n is the # of inlier pixels in the local background (i.e.
BGNumPix), and Xi is the pixel intensity in the local
background
Step 9. Determine if the feature is saturated (IsSaturated)
Feature is saturated if 50% of inlier pixels have intensity
values above the saturation threshold.
247
5
How Algorithms Calculate Results
Flag Outliers
Flag Outliers
Step 10. Determine if the feature is a non-uniformity outlier
(IsFeatNonUnifOL)
2
M is the measured variance of
inlier pixels in the feature or
background (e.g. PixSDev2 or
BGPixSDev2).
2
E is the estimated variance
using known noise characteristics
of the Agilent Microarray Gene
Expression system.
The non-uniformity outlier algorithm flags anomalous
features and local backgrounds based on statistical
deviations from the Agilent noise model. Feature or
background is flagged as a non-uniformity outlier (e.g.
IsFeatNonUnifOL or IsBGNonUnifOL, respectively) if the
measured variance is greater than the product of the
estimated variance and the confidence interval multiplier.
2
2
M E CI
For more information on
confidence interval, check
Numerical Recipes in C (Chapter
15, page 692).
where CI is the confidence interval
calculated from chi square distribution
The following equations are calculated for each feature and
background per channel.
Estimated Feature or Background Variance
The Agilent noise model estimates the expected variance by
using noise effects from the Agilent Microarray Gene
Expression system, which includes microarray manufacture,
wet lab chemistry, and scanner noise.
E = Labeling/FeatureSynthesis + Counting + Noise [6]
E = x + Bx + C [7]
Net signal is the mean signal (i.e.
MeanSignal or BGMeanSignal,
respectively) minus the
MinSigArray, which is minimum
feature signal or minimum local
background signal on the
microarray, representing an
estimate of the scanner offset.
248
x is the net signal of feature or background.
A or Labeling/FeatureSynthesis is the term that estimates the
sources of variance that are proportional to the square of
the signal, including microarray manufacturing and wet
chemistry effects; the variance follows a Gaussian
distribution. This term is intensity dependent and is the
square of the CV (e.g. coefficient of variation) estimate of
the pixel noise.
Feature Extraction Reference Guide
How Algorithms Calculate Results
Flag Outliers
5
PixSDev
CV = ---------------------------------------------------------------------- 8
MeanSignal – MinSig Array
where B or Counting is the term that estimates the sources
of variance that are proportional to the square-root of the
signal, including scanning measurement or counting error;
the variance follows a Poisson distribution. This term is
dependent on the intensity and the scan resolution of the
image.
where C or Noise is the term that estimates the sources of
variance that are independent of the signal, including
electronic noise in scanner and background level noise in
glass; the variance is a Constant.
The variables A, B and C have different values for feature
and background. For Agilent data produced with the
GE2-SSPE_95_Feb07 protocol, these values are determined
empirically (default selection in protocol) from self-vs-self
experiments and from the known noise characteristics of the
Agilent Microarray system discussed above. For all other
Agilent Feature Extraction protocols, only the A term is
empirically determined.
For all other Agilent protocols, the default selection in the
protocol is to determine the B and C terms automatically.
Here is how the Feature Extraction program calculates these
terms:
• Saturated features are omitted from the population of
negative control probes (NC). This NC set and the local
background regions associated with these features are
used in the calculations.
• Calculates Net Signal.
• Calculates the pixel standard deviation and then squares
it to yield the pixel variance.
• From a histogram plot of number of features or bkgd vs.
net signal, finds the net signal value for the 25th
percentile.
Feature Extraction Reference Guide
249
5
How Algorithms Calculate Results
Flag Outliers
• From a histogram plot of number of feature or local bkgd
vs. variance, finds the variance for the 25th percentile.
• Calculates the B term as 25%NetSignal X B Term
Multiplier and the C term as 25%Variance X C Term
Multiplier.
For a given scanner, multipliers need to be determined.
This tuning should use many images from different
batches of microarrays, different users, and different
processes. Different channels may need their own
multipliers.
Measured Feature or Background Variance
2
M
1
= ------------
n–1
n–1
Xi – X
2
[9]
i=0
where n is # of inlier pixels in the feature or background
(i.e. NumPix or BGNumPix, respectively).
where Xi is raw pixel intensity in the feature or background.
(inlier pixels)
where X is mean raw pixel intensity for the feature or
background (i.e. MeanSignal or BGMeanSignal, respectively).
Step 11. Determine if the feature is a population outlier
(IsFeatPopOL)
Agilent provides two different statistical algorithms for
identifying population outliers. You select the appropriate
algorithm to use in the protocol.
For probe sequences with enough replicate features, Feature
Extraction uses the IQR test for population outlier analysis.
The minimum number of replicates needed is set by the
protocol field, “Minimum Population” and is set to 10 as the
default for most Agilent protocols.
250
Feature Extraction Reference Guide
How Algorithms Calculate Results
Flag Outliers
5
If the protocol choice, “Use Qtest for Small Populations?” is
set to True, the Q-test method is used when a probe
sequence has fewer than the minimum population number of
features. The Q-test choice is set to True for Agilent’s newer
protocols.
Qtest for replicate features < minimum population number
Q-test allows population outlier flagging for probe sequences
from one less than the minimum population number down to
3.
This test is especially useful for NegC probes on CGH
microarrays. Flagging features as population outliers is
needed to accurately calculate NegCAvg and SD statistics. It
is also useful for the miRNA extraction where flagging
features as population outliers is needed to accurately
calculate Gene statistics.
This algorithm uses the following equation:
Qi = |Xi - Xnearest|\|Xmax - Xmin|
Where Xi = the intensity of a probe sequence;
Xnearest = the intensity of the nearest probe sequence in
intensity
Xmax = the intensity of the most intense probe sequence
Xmin = the intensity of the least intense probe sequence
Qi is compared to Qcritical to determine if the feature is an
outlier. Qcritical depends upon the number of replicate
features (N) and upon the chosen confidence level.
Agilent has chosen a 95% confidence level and bases the
identification of population outliers on this table:
Feature Extraction Reference Guide
251
5
How Algorithms Calculate Results
Flag Outliers
Table 33
Qcritical values at 95% confidence level
Number of
replicated
features (N)
Qcritical
3
0.970
4
0.829
5
0.710
6
0.625
7
0.568
8
0.526
9
0.493
10
0.466
IQR Test for replicate features > or = minimum population number
The following equations are calculated for each feature and
background population per channel.
The intensities of all features or background regions in the
population are plotted on a distribution curve. The
difference in intensities between the 25th and 75th
percentiles represent the Interquartile Range (IQR).
See “Step 6. Reject outliers” on
page 245 for definitions to help you
understand the Interquartile Range
Figure 59
252
Interquartile Range
Feature Extraction Reference Guide
How Algorithms Calculate Results
Flag Outliers
5
[10]
where IQR = Intensity at 75th percentile – Intensity at 25th
percentile.
where 1.42 is the IQR factor. Agilent uses 1.42 as the IQR
factor so that the cutoff boundaries encompass 99% of the
expected population distribution. The user can change this
factor to encompass different boundaries, as discussed in the
Feature Extraction 10.9 User Guide.
Feature or background is flagged as population outlier (e.g.
IsFeatPopOL or IsBGPopOL, respectively) if the mean signal
(e.g. MeanSignal or BGMeanSignal) is greater than the upper
rejection boundary (RBupper) or less than the lower
rejection boundary (RBLower).
MeanSignal > RBUpper
MeanSignal < RBLower
where
RBUpper = I75percentile + CutoffPopOutlier
and
RBUpper = I25percentile - CutoffPopOutlier
Feature Extraction Reference Guide
253
5
How Algorithms Calculate Results
Compute Bkgd, Bias and Error
Compute Bkgd, Bias and Error
Feature extraction completes several steps in order to
determine the error model for each feature. First it
determines and subtracts the background for each feature on
the array. This is followed by detrending the array for
systematic error. Finally an error model accounts for
systematic and random errors encountered during sample
preparation, hybridization, and scanning steps.
Step 12. Calculate the feature background-subtracted signal
(BGSubSignal)
The feature background-subtracted signal, BGSubSignal, is
calculated by subtracting a value called the BGUsed from the
feature mean signal.
BGSubSignal = MeanSignal – BGUsed
[11]
where BGSubSignal and BGUsed depend on the type of
background method and the settings for spatial detrend and
global background adjust. See the following table.
Table 34
Values for BGSubSignal, BGUsed and BGSDUsed for different methods and settings*
Background
Subtraction
Method
Background
Subtraction
Variable
Spatial Detrend
(SpDe) OFF
Global Bkgnd
Adjust (GBA) OFF
SpDe ON
SpDe OFF
Spatial Detrend ON
GBA OFF
GBA ON
Global Bkgnd Adjust ON
No
background
subtract
BGUsed =
BGMeanSignal†
SpatialDetrend
SurfaceValue
BGAdjust
SpatialDetrendSurface
Value (SDSV) + BGAdjust
BGSDUsed =
BGPixSDev‡
BGPixSDev
BGPixSDev
BGPixSDev
BGSubSignal =
MeanSignal
MeanSignal BGUsed
MeanSignal BGUsed
MeanSignal - BGUsed
BGUsed =
BGMeanSignal
BGMeanSignal
+ SDSV
BGMeanSignal
+ BGAdjust
BGMeanSignal + SDSV +
BGAdjust
BGSDUsed =
BGPixSDev
BGPixSDev
BGPixSDev
BGPixSDev
Local
Background
254
Feature Extraction Reference Guide
How Algorithms Calculate Results
Compute Bkgd, Bias and Error
Table 34
Values for BGSubSignal, BGUsed and BGSDUsed for different methods and settings* (continued)
Background
Subtraction
Method
Global
Background
method
5
Background
Subtraction
Variable
Spatial Detrend
(SpDe) OFF
Global Bkgnd
Adjust (GBA) OFF
SpDe ON
SpDe OFF
Spatial Detrend ON
GBA OFF
GBA ON
Global Bkgnd Adjust ON
BGSubSignal =
MeanSignal BGUsed
MeanSignal BGUsed
MeanSignal BGUsed
MeanSignal - BGUsed
BGUsed =
GlobalBGInlierAve** GBGIA + SDSV
(GBGIA)
GBGIA +
BGAdjust
GBGIA + SDSV + BGAdjust
BGSDUsed =
GlobalBGInlierSDev GBGISD
(GBGISD)
GBGISD
GBGISD
BGSubSignal =
MeanSignal BGUsed
MeanSignal BGUsed
MeanSignal - BGUsed
MeanSignal BGUsed
* For both the red and green channels (2-color, CGH and non-Agilent microarrays)
† With No background subtraction as the setting, BGMeanSignal is the value for BGUsed only for the t-test, but no BGUsed is
subtracted from the MeanSignal to produce BGSubSignal.
‡ If the method in the protocol for calculating the spot value from pixel statistics is Median/Normalized InterQuartile Range
instead of Mean/Standard Deviation, the program makes these substitutions for the spot value and background subtraction
calculations:
MedianSignal for MeanSignal
BGMedianSignal for BGMeanSignal
PixNorm IQR for PixSDev
GPixNormIQR for BGPixSDev
NormIQR = 0.7413 x IQR
** If Median is the selection in the protocol, the median is substituted for the mean in the inlierAve and the InlierSDev
calculations.
Feature Extraction Reference Guide
255
5
How Algorithms Calculate Results
Compute Bkgd, Bias and Error
Step 13. Perform background spatial detrending to fit a surface
To calculate the spatial shape or surface for each channel,
the Feature Extraction program uses one of these
background subtraction protocol selections:
• All Feature Types
This selection fits the surface to a set of very low
intensity features evenly distributed on the slide using a
“moving windowed filtering”.
This algorithm, which was the original algorithm for gene
expression microarrays, moves a window over the whole
microarray and attempts to choose a fixed number of data
points with the lowest intensity inside each window. This
option is recommended for those arrays without negative
controls and is illustrated in the following figure:
Figure 60
256
The effect of a moving window on selecting the lowest intensity features as an estimate of background. In the figures
above, the blue squares represent the low intensity features
found on the array. In the absence of a moving window, the
lowest features on the entire array are located and may exhibit spatial bias. With the moving window, the lowest features from each region of the microarray are better identified.
Feature Extraction Reference Guide
How Algorithms Calculate Results
Compute Bkgd, Bias and Error
5
• OnlyNegativeControlFeatures
This selection fits the surface to the negative control
features distributed on the slide and is recommended for
Agilent CGH microarrays.
This option works well with well defined negative
controls. Outlier filtering should be enabled with this
option to ensure good negative control values. To enable
outlier filtering, set “NegCtrlSpread Outlier Rejection On”
to True, which removes artifacts from distorting the
control feature set distribution. This is illustrated in the
following figure:
Figure 61
Feature Extraction Reference Guide
The purple surface represents a smoothed fit to all the negative control feature inliers. The residual of the surface fit is
the Error on background subtraction in the Additive Error Estimation (see “Step 16. Determine the error in the signal
calculation” on page 266).
257
5
How Algorithms Calculate Results
Compute Bkgd, Bias and Error
• FeaturesInNegativeControlRange
This algorithm does two levels of filtering. First, it finds
the features in the range of negative controls, by fitting
the negative controls to a surface and finding non-control
features whose signal is within 3 standard deviations of
that fit. Then, it fits a Lowess curve to this set of
features. It interpolates from that fit to calculate a
background signal for each feature. This method is
recommended for Agilent GE1, GE2, and miRNA
microarrays.
For high density microarrays, this algorithm can take a
long time to complete its calculations. To speed up the
process, you can elect in the protocol to randomly select a
small percentage of the total points with which to
calculate the fit. To do this, you set “Perform Filtering for
Fit” to True, which significantly reduces the amount of
time for spatial detrending of high density microarrays.
Figure 62
258
The purple surface represents the smoothed fit of all features, plus or minus 3 errors of the negative control fit. The
residual of the surface fit is the Error on background subtraction in the Additive Error Estimation (see “Step 16. Determine
the error in the signal calculation” on page 266).
Feature Extraction Reference Guide
How Algorithms Calculate Results
Compute Bkgd, Bias and Error
5
The FeaturesInNegativeControlRange algorithm has been
shown to more accurately estimate zero than the All Feature
Types background algorithm. This improvement is shown by
viewing the features used in the additive detrend algorithm
(colored in blue) superimposed on the
InterpolatedNegCtrlSubSignal distribution. You can see that
the signals of those features are closer to zero when the
FeaturesInNegativeControlRange algorithm is used.
Figure 63
The effects of using all features for detrending (shown in the
left figure) as compared to using the features in the negative
control range (shown in the right figure). Features that had
detrending added are shown in blue. The FeaturesInNegativeControlRange algorithm more accurately centers the values around zero.
A 2D-Loess algorithm fits the surface on the mean
intensities of the filtered low intensity features of both red
and green channels separately. This is described graphically
in the following figure.
Feature Extraction Reference Guide
259
5
How Algorithms Calculate Results
Compute Bkgd, Bias and Error
Figure 64
The effect of a 2-dimensional Loess fit to the green mean signal intensities across the array. You can find more information on the algorithm from the Web site
http://www.itl.nist.gov/div898/handbook/pmd/section1/
pmd144.htm
If N = number of data points selected for surface fitting
after filtering and Ii = ith point from the filtered low
intensity data set, the Loess algorithm fits a surface through
these data points to obtain an intensity value describing the
surface corresponding to each input data point.
Let Oi denote the fitted output surface corresponding to the
ith input point Ii. The statistical results that come out of this
calculation are described in the table on the next page.
260
Feature Extraction Reference Guide
How Algorithms Calculate Results
Compute Bkgd, Bias and Error
Table 35
5
Statistical results of spatial detrend algorithm
Result
Description and Equation
SpatialDetrendRMSFit
This result gives an idea of the extent of the
surface fit. It is the root mean square of the
fitted data points obtained from the Loess
algorithm.
N
2
Oi
N
i = 1 -
Oi – --------------N
i = 1
---------------------------------------------N
SpatialDetrendRMSFiltered
minusFit
[12]
This result is the approximate residual from the
surface fit. The deviations of the input (filtered)
points from the corresponding output (fitted)
data points are computed. An outlier rejection
is performed on the set of deviations using the
standard IQR technique (Figure 59 on
page 252). Here I is the value from the Loess fit
and O is the BGSubSignal.
N
I i – Oi
2
i=1
[13]
--------------------------------N
SpatialDetrendSurfaceArea
Feature Extraction Reference Guide
This result gives an idea of the curvature of the
surface gradient.
261
5
How Algorithms Calculate Results
Compute Bkgd, Bias and Error
Table 35
Statistical results of spatial detrend algorithm (continued)
Result
Description and Equation
SpatialDetrendVolume
The volume is calculated as the sum of the
intensities of the surface area minus the offset.
The offset is calculated as the volume under
the flat surface (parallel to the glass slide)
passing through the minimum intensity point of
the fitted surface. This number (total volume offset) is normalized by the area of the
microarray.
SpatialDetrendAveFit
This describes the average intensity of the
surface gradient.
N
Oi
i--------------= 1 - [14]
N
Step 14. Adjust the background
This algorithm determines the offset in both the red and
green channels by identifying features that are not
differentially expressed and fall within the central tendency
of the data, especially in the lower intensity domain. These
features should not be saturated or be flagged as
non-uniform outliers.
Using this method yields more accurate and reproducible
background-subtracted signals and log ratios for two-channel
data than using no correction or single-channel correction.
Using a self-self microarray (i.e. same target labeled in red
and green channels), one expects to see a linear plot of red
background-subtracted signal versus green. If the
backgrounds have not been estimated correctly in one
channel with respect to the second channel, there will be a
bias. This bias yields a “hook” at the low end of the signal
range when shown in a plot with log scale axes (see
Figure 65).
262
Feature Extraction Reference Guide
How Algorithms Calculate Results
Compute Bkgd, Bias and Error
Figure 65
5
Unadjusted background-subtracted signals
The background adjustment algorithm first finds the central
tendency of the data (features shown as blue circles in the
figures). Using this subset of features, the algorithm then
estimates the best adjustment in both the red and green
channels to remove the bias. After the background
adjustment, the bias is removed and the plot is linear
(Figure 66).
Feature Extraction Reference Guide
263
5
How Algorithms Calculate Results
Compute Bkgd, Bias and Error
Figure 66
Adjusted background-subtracted signals
The bias, if uncorrected, yields a log ratio versus signal plot
that is not symmetric about the log ratio axis (Figure 67);
whereas, after adjustment, the data is more symmetric
(Figure 68).
Figure 67
264
Log ratios calculated from unadjusted backgroundsubtracted signals
Feature Extraction Reference Guide
How Algorithms Calculate Results
Compute Bkgd, Bias and Error
Figure 68
5
Log ratios calculated from adjusted background-subtracted
signals
How is the Adjust background globally “pad” used? If Adjust
background globally is selected, you can enter a constant
between 0 and 500, called the pad value, which forces the
log ratio of red/green towards zero.
The value of the pad is expressed in raw counts, before dye
normalization. The Feature Extraction program assumes that
this value applies to the red or green channel with the
smallest mean signal and automatically computes the
corresponding raw value in the other channel that would
yield a corrected log ratio of zero after dye normalization.
The red and green feature signals are analyzed for rank
consistency. If red signal is plotted vs. green signal and the
slope of the rank consistent features is >1, then the pad
value is assigned to the green channel. If the slope is <1, the
value is assigned to the red channel.
For instance, if you set Adjust background globally to 50,
and if the slope is 1.2, then a value of 50 is added to the
green background-subtracted signal of all features; whereas,
a value of (50*1.2) = 60 is added to the red
background-subtracted signal of all features.
Feature Extraction Reference Guide
265
5
How Algorithms Calculate Results
Compute Bkgd, Bias and Error
Conversely, if you set Adjust background globally to 50, and
if the slope is 0.5, then a value of 50 is added to the red
background-subtracted signal of all features; whereas, a
value of (50/ 0.5) = 100 is added to the green
background-subtracted signal of all features.
Step 15. Calculate robust negative control statistics
This algorithm is used primarily for CGH and miRNA
microarrays. It repeats the population outlier algorithm, but
not on one sequence at a time, rather on the distribution of
all features that are classified as NegC or negative controls.
The algorithm calculates robust IQR statistics on features not
designated as non-uniform outliers, population outliers or
saturated.
UpperLimit = 75th percentile + Multiplier*IQR
LowerLimit = 25th percentile - Multiplier*IQR
The default value for this multiplier is 5.
The algorithm then omits features that are outside the Upper
and LowerLimits and calculates the new robust Count, Avg,
and SD of these inliers for the net signal and the
background-subtracted signal:
g(r)NegCtrlNumInliers
g(r)NegCtrlAveNetSig
g(r)NegCtrlSDevNetSig
g(r)NegCtrlAveBGSubSig
g(r)NegCtrlSDevBGSubSig
Step 16. Determine the error in the signal calculation
This step calculates the error on the background-subtracted
and detrended signal. You can select for the error calculation
either the Universal Error Model or the model (Universal or
propagated) that produces the largest (most conservative)
estimate of the error.
266
Feature Extraction Reference Guide
How Algorithms Calculate Results
Compute Bkgd, Bias and Error
5
The Feature Extraction program does a dynamic
computation of an approximation for the additive terms in
both the red and green channels for the Universal Error
Model. The estimation of the dynamic additive error term for
each channel (red or green) is based on the following
equation (for 1-color gene expression, the green channel):
AddError =
2
2
2
2
2
2
2
2
m 1 NegCtrl + m 2 DNF (RMSFit ) + m 3 DNF (residual )
[15]
where m1 = MultNcAutoEstimate
m2 = MultRMSAutoEstimate
m3 = MultResidualRMSAutoEstimate
DNF = LinearDyeNormFactor of the corresponding channel
residual = The residual of the 2D Loess fit
Since the Additive Error is now calculated in Compute
Background, Bias and Error Section, the DNF is 1 and the
Variance of the NegCtrls are not scaled for the DNF either.
This scaling is done to the AdditiveError after DyeNorm is
completed.
2
NegCtrl = Variance of the inlier negative control
For definitions of non-uniform and
population outliers, see the Feature
Extraction 10.9 User Guide.
where inlier negative control implies the negative controls
for the corresponding channel after rejections of saturated,
population and non-uniform outliers.
The RMSFit term drops out of the
equation for microarrays of less
than 5000 features.
where SpatialDetrendRMSFit = RMS of the points defining
the surface fit for that channel. For more details on this
term, see Table 35 on page 261.
For Agilent 8 x format oligo microarrays, the auto-estimation
algorithm uses only the variance of the inlier negative
controls. You can set m1 or m2 in equation 22 equal to zero
in the protocol settings.
Feature Extraction Reference Guide
267
5
How Algorithms Calculate Results
Compute Bkgd, Bias and Error
MultNcAutoEstimate
Multiplier for the first term in the additive error equation
(standard deviation of the inlier negative control). The value
changes depending on the protocol used:
GE1, GE2 and miRNA = 0
CGH and ChIP = 1
non-Agilent = 1
MultRMSAutoEstimate
Multiplier for the second term in the additive error equation
(g(r)SpatialDetrendRMSFit). This term is proportional to the
amount of sequence variability in the foreground.
On gene expression arrays, Agilent uses this term because
there is a single sequence for all negative controls so an
estimation of any sequence-dependent foreground noise
using negative controls is not possible.
For CGH microarrays, the error model choice is to make this
term and m3 zero and use only m1 because there are a
variety of sequences used for the negative controls.
GE1, GE2 and miRNA = 0
CGH and ChIP = 0
non-Agilent = 4
MultResidualRMSAutoEstimate
Multiplier for the third term in the equation and is the
width of the distribution of signals used in the background
spatial detrending set (after the background surface has
been subtracted out).
When the background detrending set includes a group of
features well-distributed across the microarray with a
variety of sequences, the width of the distribution of the
signals of these features after background subtraction is a
very good estimate of the uncertainty of the dim signals, or
the additive error.
GE1, GE2 and miRNA = 1
CGH and ChIP = 0
non-Agilent = 0
268
Feature Extraction Reference Guide
How Algorithms Calculate Results
Compute Bkgd, Bias and Error
5
Step 17. Calculate the significance of feature intensity relative to
background (IsPosAndSignif)
The significance of the feature intensity compared to the
background intensity (local or global) is calculated using two
different significance tests: one using pixel statistics for both
the feature and the background values and the other using
the additive error from the Error Model calculation for the
background value.
Significance based on pixel statistics This method to
determine significance uses the 2-sided Student’s t-test with
mean signal for the feature and the background correction
for the background. This is implemented as an incomplete
Beta Function approximation.
X F – X B
t = ------------------------------------------------------------------------------------------------- [16]
2
2
n F – 1 F + n B – 1 B 1
1
-------------------------------------------------------------- ------ + ----
df
n
n
F
B
where X F is the mean signal (MeanSignal) of the feature
and X B is the background correction used for subtraction
(BGUsed — see Table 34 on page 254).
where
and
are the number of inlier pixels in the
feature or background (local), respectively (e.g. NumPix or
BGNumPix).
where
and
are variances of inlier pixels for feature
and background, respectively (e.g. PixSDev2 or BGSDUsed2).
2
1
F = --------------nF – 1
2
1
B = --------------nB – 1
Feature Extraction Reference Guide
n–1
X i – X F
2
[17]
Xi is pixel intensity
i=0
n–1
X i – X B
2
[18]
i=0
269
5
How Algorithms Calculate Results
Compute Bkgd, Bias and Error
where df is the degrees of freedom,
df = nF + nB - 2
After the p-value is calculated from the 2-sided t-test using
incomplete Beta Function, it is compared to the user-defined
max p-value. If the calculated p-value from the Beta
Function is less than the user-defined max p-value, then the
feature signal is considered to be significantly different from
the background signal.
If p-valueCalculated < p-valueMax, and if MeanSignal >
BGUsed, then feature gets a Boolean flag of 1 under the
IsPosAndSignif column in Feature Extraction result file.
Significance based on additive error The Error model
significance also uses a Gaussian probability distribution for
the calculation and tests to see if a signal is greater than 0
with a known additive error. We compute the probability in
a similar way to the Pixel Significance calculation. But
instead of having a feature signal and a background signal,
the test uses the feature signal and one error (background
signal distribution is assumed to be around 0 with one
error).
The degrees of freedom are large enough to make the
function Gaussian. We define the error as one standard
deviation (1SD) from the probability of 0 on the Gaussian
curve and equal to a p-value of .01 (AdditiveError/2.6).
If the probability is greater than or equal to 1SD or .01, the
background-subtracted signal is flagged as positive and
significant. If it is less than 1SD or .01, it is flagged as not
significant.
The value of the surrogate is scaled by the probability
returned. The surrogate value for the Not significant signals
equals AddError/2.6 * the probability, calculated this way for
two reasons.
• Signals stay continuous.
• Surrogate values are not larger than the smallest
significant signals.
270
Feature Extraction Reference Guide
How Algorithms Calculate Results
Compute Bkgd, Bias and Error
5
Step 18. Determine if the feature background-subtracted signal is
well above the background (IsWellAboveBG)
The feature background-subtracted signal (i.e. BGSubSignal)
is compared to the noise of its background (local or global):
BGSubSignal > WellAboveSDMulti x SDBG
where
WellABoveSDMulti is the well above SD multiplier (5,
default) - this means a feature is well above
background if its signal is 5 times the additive error.
SDBG is the background standard deviation (i.e.
BGSDUsed)
For the Error model significance test, the SD becomes
AddError/2.6.
If the background-subtracted signal is greater than the
WellAboveSDMulti x SDBG, and if the feature passes the
IsPosAndSignif test, then the feature gets a Boolean flag of 1
under the IsWellAboveBG column in Feature Extraction
result file.
Step 19. Calculate the surrogate value (SurrogateUsed)
The surrogate value is calculated and used as the “lowest
limit of detection” to replace the dye-normalized signal when
any of the following situations occur. These tests are done
for each channel:
• MeanSignal is less than BGUsed or not significant
compared to BGUsed (i.e., IsPosAndSignif = 0).
• BGSubSignal is less than its background standard
deviation (i.e., BGSubSignal < BGSDUsed).
The decision to replace a dye-normalized signal with a
surrogate value is not made, however, until after probes
are selected for correcting the dye bias.
The surrogate value is calculated in this step using these
criteria:
If pixel significance is used to calculate IsPosAndSignif, then
Feature Extraction Reference Guide
271
5
How Algorithms Calculate Results
Compute Bkgd, Bias and Error
SurrogateUsed = SDBG
[19]
where SDBG is the background standard deviation
(i.e. BGSDUsed)
For the local background method, the standard deviation
of the background is at the pixel-level of the local
background.
For global background methods, the standard deviation of
the background is at the replicate background-population
level of the microarray.
If Error model significance is used to calculate
IsPosAndSignif, then
SurrogateUsed = AddError/LinearDyeNormFactor
[20]
where AddError is the additive error from the Error
Model calculation
If Multiplicative Detrending is used, the SurrogateUsed is
scaled by the MultDetrendSignal for each feature.
If a p-value other than default 0.01 is chosen in the
protocol, then the SurrogateUsed is adjusted appropriately.
Step 20. Perform multiplicative detrending
Multiplicative detrending is an algorithm designed to
compensate for slight linear variations in intensities that can
occur if the processing is not homogeneous across the slide.
This non-homogeneous processing results in different
chemical reaction times, for example, between the sides and
the center, and produces a “dome effect”.
With 2-color microarrays these dome effects are the same in
each channel and for the most part cancel out during the
calculations. Agilent has found multiplicative detrending to
still be useful, however, for all the microarrays. It is turned
on in all protocols, except for the GE2-nonAT_95 protocol.
272
Feature Extraction Reference Guide
How Algorithms Calculate Results
Compute Bkgd, Bias and Error
5
This algorithm is designed to correct the data by fitting a
smoothed surface via a second degree polynomial fit to the
higher signals on the microarray (after outliers are rejected).
This is shown in the following illustration:
Figure 69
The effect of multiplicative detrending across array features.
A second-order polynomial is fit to the higher signals on the
array resulting in a subtle shape fit. This fit results in the ProcessedSignal having a better fit to the data than the BGSubSignal.
An option also exists in the 2-color gene expression
protocols to detrend only on replicate signals. The algorithm
normalizes replicates, fits the surface to the normalized
replicates and then uses the fit to detrend the data.
Because the multiplicative trend can be confused with the
additive trend for dim microarrays, data points inside a
multiple times the standard deviation from the center of the
signals for the negative control population are excluded.
The equations for statistics and results that are produced by
this calculation are shown in the following table. See
Table 32, “Algorithms (Protocol Steps) and the results they
produce,” on page 230 for descriptions of these results.
Feature Extraction Reference Guide
273
5
How Algorithms Calculate Results
Correct Dye Biases
Table 36
Statistics and Results for Multiplicative Detrending
Results
Equation
gMultDetrendRMSFit
N
MDS i – average MDS
MDS =
MultDetrendSignal
2
i-----------------------------------------------------------------------------=1
N
[21]
gMultDetrendSignal
Fitted (log 10(BgSubSignal))
10
----------------------------------------------------------------------------------------N
Fitted (log 10(BgSubSignal))
10
i
i---------------------------------------------------------------------------------=1
-
N
[22]
gProcessedSignal
BGSubSignal i
---------------------------------------------------- [23]
MultDetrendSignal i
gProcessedSigError
BGSubSignalError
-----------------------------------------------------i [24]
MultDetrendSignal i
Correct Dye Biases
Step 21. Determine normalization features
Normalization features are features used to evaluate the dye
bias between the red and green channels.
Using “All Probes” method Under this method, the initial
normalization features are selected based on the following
three criteria:
274
Feature Extraction Reference Guide
How Algorithms Calculate Results
Correct Dye Biases
5
• Features are positive and significant versus the
background (e.g. IsPosAndSignif = 1)
• Features are non-control (e.g. ControlType = 0)
• Features are non-outlier (e.g. IsFeatNonUnifOL = 0,
IsFeatPopnOL = 0, IsSaturated = 0)
Using “List of Normalization Genes” method Under this method,
the user selects the normalization features. These features
can be housekeeping genes or genes with no differential
expression.
Using “Rank Consistency Probes” method Under this method,
the chosen normalization features simulate housekeeping
genes. These features fall within the central tendency of the
data, having consistent trends between the red and green
channels. They are selected based on the following two
criteria:
• Features pass the three criteria described in the “all
significant, non-control, and non-outlier features” method
and
• Features pass the rank consistency filter between the red
and green channels
Rank consistency filter is done by transforming the feature
BGSubSignal to feature rank per channel. Next, the feature
correlation strength is calculated per feature:
R – G
CS = --------------------N
[25]
where R and G are the ranks of feature in the red and
green channels, respectively
where N is the total number of initial normalization features
If the CS , where is the threshold percentile, then
feature passes the rank consistency filter between the red
and green channels and falls within the central tendency of
the data. Note is a user-defined parameter in the Feature
Extraction program.
Feature Extraction Reference Guide
275
5
How Algorithms Calculate Results
Correct Dye Biases
Using “Rank Consistent List of Normalization Genes” This
method uses the rank consistent normalization genes from
the list. These genes follow the criteria described above.
Step 22. Calculate the normalization factor
LinearDyeNormFactor The linear dye normalization method
assumes that dye bias is not intensity-dependent and
therefore takes a global approach to dye normalization. A
linear dye normalization factor is computed per channel by
setting the geometric mean of signal intensity of the
normalization features equal to 1000:
1000
LinearDyeNormFactor = -----------------------------n
1
--- log X i
n
i=1
[26]
10
The LinearDyeNormFactor (red and
green channels) values are listed in
the STATS table.
where
is the background-subtracted signal of a feature
(i.e. BGSubSignal/MultDetrendSignal)
where is the number of features used for normalization
(i.e. features with IsNormalization = 1)
LOWESSDyeNormFactor The LOWESS dye normalization
method assumes that dye bias may be intensity-dependent
and therefore takes a local approach to dye normalization.
The LOWESS dye normalization factor is calculated by fitting
the locally weighted linear regression curve to the chosen
normalization features. The amount of dye bias is
determined from the curve at each feature’s intensity. Each
feature gets a different LOWESS dye normalization factor per
channel.
The LOWESS method corrects the log ratio data so that its
central tendency after dye normalization lies along zero for
all intensity ranges, assuming an equal number of up- and
276
Feature Extraction Reference Guide
How Algorithms Calculate Results
Correct Dye Biases
5
down-regulated features in any given signal range. The
LOWESS DyeNormFactor is derived for each channel by the
procedure described on the next page:
a A linear regression curve is fit to the data in a plot of
M vs. A, where M (y axis) = Log(R/G) and A (x axis) =
1/2 x Log(R*G). R and G represent the red and green
background-subtracted signals. This LOWESS curve fit
through the central tendency of the M vs. A plot is
defined as Mfit, and is a function of A.
b The dye normalization step transforms the data so that
the central tendency of Mfit at every A is shifted to be
equal to zero.
c After the correction factor is determined for any
feature, it is split evenly over the red and green
channels.
The new signals after correction, R’ and G’, are
obtained by transforming the original R and G:
R’ = R/(10MFit/2) and G’ = G*(10MFit/2)
d If the original log ratio is exactly along the fit line Mfit,
the new log ratio is shifted to zero:
If log(R/G) = Mfit, then Log(R) = Log(G) + Mfit
or Log(R’*10MFit/2) = Log (G’*10-MFit/2) + Mfit
or Log(R’) + Mfit/2 = Log(G’) - Mfit/2 + Mfit
or Log(R’/G’) = 0
e The LOWESSDyeNormFactor for R is 1/(10M’/2).
The LOWESSDyeNormFactor for G is 10M’/2.
Note that the Linear&LOWESS dye
normalization factor is not reported
in the Feature Extraction output
file. Therefore, the only way to
know the Linear & Lowess dye
norm factor is to calculate it using
the following equation.
Linear&LOWESSDyeNormFactor This curve fitting algorithm
does a linear scaling/normalization of the data individually
in each channel before performing a non-linear dye
normalization.
The Linear&LOWESS dye normalization factor can be
calculated from the following equation:
DyeNormalSignal
Linear&LOWESSDyeNormFactor = -------------------------------------------------------------------------------------------------------BGSubSignal LinearDyeNormFactor
Feature Extraction Reference Guide
[27]
277
5
How Algorithms Calculate Results
Compute Ratios
Step 23. Determine if surrogate values must substitute for
low-intensity signals
At this point two criteria are used to determine is surrogate
values must take the place of the low-intensity signals:
• The feature signal is not positive and significant versus
background.
• The signal is not larger than the background error.
Surrogate values were computed during background
subtraction and are stored in the SurrogateUsed column.
Step 24. Calculate the dye-normalized signal (DyeNormSignal)
The dye-normalized signal is calculated by multiplying the
background-subtracted signal by the dye normalization
factor:
DyeNormSignal =
(BGSubSignal/MultDetrendSignal) × DNF [28]
where DNF = LinearDyeNormFactor, when linear dye
normalization method is used and where:
DNF=LinearDyeNormFactor × LOWESSDyeNormFactor
[29]
when LOWESS dye normalization method is used.
Compute Ratios
Step 25. Calculate the processed signal (ProcessedSignal)
The processed signal is used in calculating the log ratio. If a
surrogate is not used (i.e. SurrogateUsed = zero value), then
the processed signal is the dye-normalized signal. If a
surrogate is used (i.e. SurrogateUsed = non-zero value), then
the processed signal is the SurrogateUsed value.
if SurrogateUsed = 0, then
ProcessedSignal = DyeNormSignal
278
Feature Extraction Reference Guide
How Algorithms Calculate Results
Compute Ratios
5
if SurrogateUsed 0, then
ProcessedSignal = SurrogateUsed * DyeNormFactors,
where DyeNormFactors = LinearDyeNormFactor *
LowessDyeNormFactor, if Linear and Lowess methods are
used
Step 26. Calculate the log ratio of feature (LogRatio)
The log ratio i is the measure of differential expression
between the red and green channels for every probe i:
ProcessedSignal r i
LogRatio i = Log 10 ---------------------------------------------------
ProcessedSignal g i
[30]
where ProcessedSignalr,i and ProcessedSignalg,i are signals
post dye normalization and post surrogate processing in the
red and green channels, respectively.
Step 27. Calculate the p-value and error on log ratio of feature
(PvalueLogRatio and LogRatioError)
PvalueLogRatio gives the statistical significance on the log
ratio per each feature (e.g. gene) between the red and green
channels. The p-value is a measure of the confidence
(viewed as a probability) that the feature is not differentially
expressed.
For example, if the p-value is less than 0.01, we can say
with a 99% confidence level that the gene is differentially
expressed. In other words, there would be a 1% random
chance of getting this low of a p-value with a gene that is
actually not differentially expressed:
xdev
xdev
p-value = 1 – Erf --------------- = Erfc ---------------
2
2
[31]
where:
2
–t
2
Erf x = --------- x e dt [32]
0
pi
Feature Extraction Reference Guide
279
5
How Algorithms Calculate Results
Calculate Metrics
Erf(x) is the error function of the expression as given by
the above equation: It is twice the integral of the Gaussian
distribution with mean = 0 and variance = 1/2
Erfc is the complementary error function as defined by the
above equation.
xdev is the deviation of LogRatio from 0.
LogRatio
xdev = ---------------------------------------LogRatioError
[33]
Equation 22 is analogous to a signal to noise metric.
For more details on calculations
with the Universal Error Model, see
the confidential Agilent technical
paper on error modeling.
If the Universal Error Model is used, then xdev is
computed from six sources:
• ProcessedSignals (red and green channels)
• Multiplicative error factors (red and green)
• Additive error factors (red and green)
The terms xdev, ‘multiplicative error’, and ‘additive error’
come from the Universal Error Model, as developed by
Rosetta Biosoftware.
Once xdev is computed, it is plugged back into Equation 2,
where LogRatioError is derived.
For more details on calculations
with the propagation error model,
see the confidential Agilent
technical paper on error modeling.
If the Propagation of Pixel Level Error Model is used, then
LogRatioError is computed from the following sources:
• Feature PixSDev (red and green channels)
• Background Noise (calculation is dependent upon the
chosen BkSubMethod; red and green channels)
Once the LogRatioError is computed, it is plugged back into
Equation 21, where xdev is derived.
Calculate Metrics
Although the QC metrics are calculated in this step, only the
gridding tests are discussed in this section.
280
Feature Extraction Reference Guide
How Algorithms Calculate Results
Calculate Metrics
5
Step 28. Perform a series of gridding tests to make sure that grid
placement has been successful
These tests are performed to yield warnings on the
Summary Reports about unsuccessful gridding. They also
produce the assessment shown in the QC Report of whether
the grid needs to be evaluated or not.
In Feature Extraction, new tests have been added and
thresholds tuned to decrease the number of false negatives
(Summary Report shows no problems when there are) and
false positives (Summary Report shows a problem when
there isn’t).
The parameters for these tests do not appear in the
protocols, but they do appear in the FEParams output.
The following shows a question asked by each test, the
metric used to answer the question (“stat” name that
appears in the result text file as the Statistics table), and
the threshold to assess gridding success or failure. If a grid
fails any one of these tests, a warning or warnings appear in
the reports.
Test 1
How many features are “not found” along the edge of the
microarray?
Stat name: MaxSpotNotFoundEdges
Threshold_Max: 0.72
Test 2
How many local background regions are flagged as
non-uniform outliers in either channel?
Stat name: AnyColorPrcntBGNonUnifOL
Threshold_Max: 2%
Test 3
How broad is the distribution of NegControl net signals?
Stat name: Max{gNegCtrlSDevNetSig, rNegCtrlSDevNetSig}
Threshold_Max: 100
Test 4
Feature Extraction Reference Guide
What is the median CV% of BGSubSignal of the NonControl
replicated sequences?
281
5
How Algorithms Calculate Results
Calculate Metrics
Stat names: Max{gNegCtrlMedPrcntCVBGSubSig,
rNegCtrlMedPrcntCVBGSubSig} or just the green stat for a
1-color application
Threshold_Max: 50%
Test 5
What is the difference between feature centers found by the
gridding algorithm vs. the spot-finding algorithm?
Stat names: Max{CentroidDiffX, CentroidDiffY}
Threshold_Max: 10%
Optional Test 6
How many features along the edge of the microarray are
flagged as non-uniform outliers in either channel?
This test is used only if one of these two metrics is
unavailable:
• No replicated features are present to calculate the
NonCtrlMedPrcntCVBGSubSig metric.
• Or no NegControls are present to calculate the StdDev.
Stat name: MaxNonUnifEdges
Threshold_Max: 10%
282
Feature Extraction Reference Guide
How Algorithms Calculate Results
MicroRNA Analysis
5
MicroRNA Analysis
This step is only used for the feature extraction of
microRNA microarray 1-color images.
This analysis samples multiple probes with multiple features
per probe and reports the measurements and errors as the
TotalGeneSignal and TotalGeneSignalError for each of the
miRNAs of the 8-pack microarray. These values are reported
in both the text file and a new file called the “GeneView”
file.
Several steps are needed to calculate the total gene signal.
First, you calculate the TotalProbeSignal and then you sum
the TotalProbeSignal over the number of probes per gene.
To calculate the TotalProbeSignal and the TotalProbeError,
this algorithm does the following steps:
a Calculates the EffectiveFeatureSizeFraction
b Finds the robust average of all the processed signals for
each replicated probe (features with the same
sequence) measured in the extraction. The same is
done for the processed Signal Error column by
propagating the error.
c Calculates the Nominal Spot Area S in square microns.
S = SpotWidth 2 SpotHeight 2 34
d Multiplies each average by the total number of pixwls
targeted by that probe (The total number of Features
*S*EffectiveFeatureSizeFraction).
e Further multiplies by weight, where the weight is
calculated as 1/30,000.
The equations and descriptions for calculating each output
or result column are listed in the following table:
Feature Extraction Reference Guide
283
5
How Algorithms Calculate Results
MicroRNA Analysis
Table 37
Statistics and Results for the MicroRNA Analysis (see also Table 32, “Algorithms (Protocol Steps) and
the results they produce,” on page 230)
Feature or Stat
Equation or Description
gTotalProbeSignal
In Pr
gProcSignal PR
i
i
-------------------------------------------------
In PR
Tot PR E S W [35]
Where:
PR = Index of Probe Replicates for given miRNA
In = Number of replicate population inliers
Tot = Total number of probe replicates
E = EffectiveFeatureSizeFraction
S = Nominal Spot Area - equation described on previous page
W = Weight - described on previous page
And:
The number of probes used in the calculation is based on whether the
protocol option “Exclude Non Detected Probes” was turned on or off. For
more information see the Feature Extraction 10.9 User Guide.
gTotalProbeError
In PR
gProcSignalError PR
2
i
i
-------------------------------------------------------------------- Tot PR E S W [36]
In PR
gTotalGeneSignal
NumProbesPerGene
gTotalProbeSignal
[37]
i=0
284
Feature Extraction Reference Guide
How Algorithms Calculate Results
MicroRNA Analysis
Table 37
5
Statistics and Results for the MicroRNA Analysis (continued)(see also Table 32, “Algorithms (Protocol
Steps) and the results they produce,” on page 230)
Feature or Stat
Equation or Description
gTotalGeneError
NumProbesPerGene
gTotalProbeError
2
[38]
i=0
gGeneSignal
This signal is the log10- transformed value of the gTotalGeneSignal value
calculated for each of the four miRNA spike-in genes within the subtype
mask 8196.
gProbeRatio
This is the log2 - transformed value of the ratio of the TotalGeneSignal value
for the longer probe divided by the TotalGeneSignal value for shorter probe.
The probe length can be determined from the probe name itself: for example,
dmr_6_17 means 17 is the probe length.
IsGeneDetected
This flag marks a gene as detected or not detected. It is computed by
checking all the probes that make up the gene. A probe is considered
detected if its signal is some multiple of its error where the multiplier is
defined in the Feature Extraction protocol (default=3). If one probe of the set
of probes comprising the gene is detected, then the gene is considered
detected.
gEffectiveFeatureSizeFraction
Estimates the ratio of the effective feature size to the nominal feature size. It
is calculated by looking at the ratio of the whole spot measurement versus
the cookie measurement.
gFeatureUniformityAnaomalyFraction
Calculates the ratio of the number of features having anomalous effective
feature size fractions to the total number of features. This gives a measure
of the percentage of representative spots that are strange (e.g., donuts,
super hot spots, or hot crescents).
gUsedDefaultEffectiveFeatureSize
Reports whether an effective feature size was estimated or not. Stat value is
0 if Yes and 1 if No. If No, the default effective feature size value is used.
Feature Extraction Reference Guide
285
5
How Algorithms Calculate Results
MicroRNA Analysis
Since v.10.7, support for miRNA Spike-In analysis has been
available. The miRNA Spike-In genes have a subtype mask of
8196 and consists of the following miRNA probes:
• dmr285
• dmr31a
• dmr6
• dmr3
Values for GeneSignal and ProbeRatio are calculated for each
of the four probes.
How the miRNA Spike-In Statistics and Metrics are calculated
To calculate the miRNA Spike-Ins, four miRNAs from the
species Drosophila melanogaster are utilized with the
assumption that these sequences will not have any
hybridization potential against the real targets on the
microarray. Those four miRNAs are named dmr6, dmr3,
dmr31a, and dmr285.
The sequences come from the microRNA database (miRBase
http://www.mirbase.org). These miRNAs have been placed on
the array in multiple locations as replicated probe pairs with
corresponding names: dmr6, dmr3, dmr31a, and dmr285.
Replicated probe pairs means that two probes have been
designed for each of the four miRNAs; a longer probe and a
shorter probe. Multiple copies of each probe exist on the
array in random locations. The probe length can be
determined from the probe name itself by examining the last
portion of the probe name. For example, the probe dmr_3_17
has a length of 17.
In order for these probes to show any legitimate signal in
your microarray experiment, the experimental protocol must
be modified to include target mixtures of these Spike-Ins
(please see the miRNA manual for details).
The Feature Extraction software will assume that these
Spike-Ins have been added and attempt to calculate the
statistics and metrics unless that option has been specifically
disabled via Feature Extraction protocol modification. The
286
Feature Extraction Reference Guide
How Algorithms Calculate Results
MicroRNA Analysis
5
software will calculate six statistics associated with the
Spike-Ins and add these six statistics to the STATS table
that is output as part of the tab text output of Feature
Extraction. The software will then calculate three metrics
from those statistics. The software will output and grade
these metrics on the miRNA QC report.
Statistics
Two of the statistics calculated are summarized as
ProbeRatios. The ProbeRatio used to calculate the statistic
is defined as:
TotalProbeSignal longerProbe
ProbeRatio = Log 2 ----------------------------------------------------------------------------------------- [39]
TotalProbeSignal shorterProbe
The Total Probe Signal is defined in Table 37, “Statistics and
Results for the MicroRNA Analysis (see also Table 32,
“Algorithms (Protocol Steps) and the results they produce,”
on page 230),” on page 284.
The other four statistics calculated are summarized as Gene
Signals. The Gene Signal is defined as:
GeneSignal = Log 10 TotalGeneSignal [40]
The Total Gene Signal is defined in Table 37, “Statistics and
Results for the MicroRNA Analysis (see also Table 32,
“Algorithms (Protocol Steps) and the results they produce,”
on page 230),” on page 284.
The Statistics calculated are:
Feature Extraction Reference Guide
287
5
How Algorithms Calculate Results
MicroRNA Analysis
Table 38
miRNA Spike-In Statistics
Statistic Name
Statistic Type
Description
gdmr285GeneSignal
float
The Gene Signal for the dmr285
miRNA. Note that the leading 'g'
means the data is calculated
from the green channel.
gdmr31aGeneSignal
float
The Gene Signal for the dmr31a
miRNA. Note that the leading 'g'
means the data is calculated
from the green channel.
gdmr6GeneSignal
float
The Gene Signal for the dmr6
miRNA. Note that the leading 'g'
means the data is calculated
from the green channel.
gdmr3GeneSignal
float
The Gene Signal for the dmr3
miRNA. Note that the leading 'g'
means the data is calculated
from the green channel.
gdmr6ProbeRatio
float
The Probe Ratio of the 2 dmr6
probes.
gdmr3ProbeRatio
float
The Probe Ratio of the 2 dmr3
probes.
Metrics
The Feature Extraction software, via the miRNA metric set
provided with Feature Extraction versions 10.7 and later,
calculates three metrics that appear on the miRNA QC
report: LabelingSpike-InSignal, HybSpike-InSignal, and
StringencySpike-InRatio. Two of the three metrics have
thresholds associated with them, as defined in the QC metric
set; the other metric does not, as of Feature Extraction 10.7.
This may change in future updates.
The Spike-In controls, when used in conjugation with the
Spike-In metrics, can help troubleshoot potential issues with
your miRNA microarray experiment. The Spike-Ins and
288
Feature Extraction Reference Guide
How Algorithms Calculate Results
MicroRNA Analysis
5
associated metrics are for use with the Agilent miRNA
experimental protocol only. We have not tested, nor
evaluated any deviations from our standard protocol and
therefore cannot offer support guidance with issues arising
from the use of other protocols.
The LabelingSpike-InSignal metric helps determine if there
might be a problem with the labeling reaction. The Agilent
protocol for use with the Spike-Ins must be used for the
metric to give meaningful values. The metric encompasses
two different Spike-In miRNAs and reports the average
signal strength. A value for this metric below the threshold
is indicative of a labeling problem. The
LabelingSpike-InSignal is calculated as:
gdmr285GeneSignal + gdmr31aGeneSignal
LabelingSpike – InSignal = -------------------------------------------------------------------------------------------------------------------[41]
2
The HybSpike-InSignal metric helps determine potential
hybridization issues. The Spike-In targets used in computing
this metric are added to the mix after labeling, just prior to
hybridization.
If both the HybSpike-InSignal and LabelingSpike-InSignal are
low (e.g. below the threshold), then there may be an issue
with the hybridization of this array. If the
LabelingSpike-InSignal metric is below the threshold, but the
HybSpike-InSignal is not, then the efficiency of the Labeling
reaction may have been compromised. The
HybSpike-InSignal metric is calculated as:
gdmr3GeneSignal + gdmr6GeneSignal [42]
HybSpike – InSignal = ------------------------------------------------------------------------------------------------------2
The StringencySpike-InSignalRatio metric may help evaluate
wash stringency. As of Feature Extraction 10.7, there are no
thresholds for this metric. This may change with future
updates. The StringencySpike-InRatio is calculated as:
StringencySpike – InRatio = gdmr3ProbeRatio [43]
Feature Extraction Reference Guide
289
5
How Algorithms Calculate Results
Example calculations for feature 12519 of Agilent Human 22K image
Example calculations for feature 12519 of Agilent Human 22K
image
Figure 70
Visual results of feature number 12519 from “Shapes” file
(*.shp) of Human_22K_expression microarray image
The 2-color gene expression Human 22K microarray image,
“Human_22K_expression”, is included in the Example Images
that Agilent provides on the Feature Extraction software
installation CD.
290
Feature Extraction Reference Guide
How Algorithms Calculate Results
Data from the FEPARAMS table
5
Data from the FEPARAMS table
BGSubtractor_BGSubMethod
BGSubtractor_BackgroundCorrectionOn
7
0
BGSubtractor_SpatialDetrendOn
1
The BGSubMethod of 7 corresponds to No Background
Subtraction method (see Table 17 on page 129 of this
guide.). Global Background Adjustment is turned Off. Spatial
Detrending is turned On.
Data from the STATS Table
LowessDyeNormFactor is not
shown in Feature Extraction result
file. This value can be back
calculated using DyeNormSignal
equation on page 245.
gLinearDyeNormFactor
rLinearDyeNormFactor
15.881
4.14607
Data from the FEATURES Table
Results from Find And Measure Spots Algorithm
FeatureNum
12519
gNumPix
62
rNumPix
62
Feature Extraction Reference Guide
gMeanSignal
rMeanSignal
3021.774
13502.52
gPixSDev
187.8805
rPixSDev
1102.547
291
5
How Algorithms Calculate Results
Data from the FEATURES Table
Results from Correct Bkgd and Signal Biases Algorithm
FeatureNum
gSpatialDetrendSurfaceValue rSpatialDetrendSurfaceValue
12519
FeatureNum
12519
FeatureNum
12519
gBGUsed
rBGUsed
81.5464
72.2993
gIsPosAndSignif
1
81.5464
gBGSDUsed
3.5514
rIsPosAndSignif
1
rBGSDUsed
5.34552
gIsWellAboveBG
72.2993
gBGSubSignal
2940.23
rBGSubSignal
13430.2
rIsWellAboveBG
1
1
rBGUsed = rSpatialDetrendSurfaceValue
72.2993 = 72.2993
Note that this equation is valid only if there is no
background subtraction, spatial detrending is on, and there
is no global background adjustment.
For an explanation of BGUsed with
other background settings, see
Table 34 on page 254.
rBGSubSignal = rMeanSignal - rGBGUsed
13430.2 = 13502.52 - 72.2993
Results from Correct Dye Biases Algorithm
Refer to “Data from the STATS
Table” on page 291 for the
LinearDyeNormFactor value.
FeatureNum
12519
gDyeNormSignal
45834.1
rDyeNormSignal
49209.6
rDyeNormSignal = rBGSubSignal x rLinearDyeNormFactor x rLOWESSDyeNormFactor
49209.6 = 13430.2 x 4.14607 x rLOWESSDyeNormFactor
292
Feature Extraction Reference Guide
How Algorithms Calculate Results
Data from the FEATURES Table
5
Results from Compute Ratios and Errors Algorithm
FeatureNum
12519
gSurrogateUsed
0
rSurrogateUsed
0
45834.13
FeatureNum
12519
gProcessedSignal
LogRatio
LogRatioError
0.0308611696
0.06148592089
rProcessedSignal
49209.64
PValueLogRatio
0.6157220099
For the red channel, does the feature number 12519 pass the
two criteria listed that are required to calculate an accurate
and reproducible log ratio?
• Feature is positive and significant vs. background (i.e.
IsPosAndSignif = 1.
• BGSubSignal is greater than its background standard
deviation (i.e. BGSDUsed).
For this example calculation, feature number 12519 passed
both criteria. Since rSurrogateUsed = 0, the rDyeNormSignal
is the same value as the rProcessedSignal.
rProcessedSignal = rDyeNormSignal, if rSurrogateUsed
49209.6 = 49209.6
Feature Extraction Reference Guide
293
5
How Algorithms Calculate Results
Data from the FEATURES Table
If a feature fails either or both of the criteria above,
SurrogateUsed is a non-zero value and is calculated as
shown in the following equation, depending on the
Significance test parameter chosen in the Compute Bkgd,
Bias, and Error protocol step.
rSurrogateUsed = rAddError/rLinearDyeNormFactor
if Use Error Model for Significance is selected
rSurrogateUsed = rBGSDUsed
if Use Pixel Statistics for
Significance is selected
If a surrogate is used in the red channel (i.e. rSurrogateUsed
is a non-zero value), the red processed signal is calculated
as surrogate value multiplied by the dye normalization
factors.
rProcessedSignal = rSurrogateUsed * rLinearDyeNormFactor *
rLowessDyeNormFator, if rSurrogateUsed
The Log ratio is the log of red processed signal over green
processed signal.
rProcessedSignal
LogRatio = log -----------------------------------------------gProcessedSignal
0.0308612 = log (49209.64 / 45834.13)
It is important to note that log ratio and p-value
calculations are computed differently, depending on whether
a surrogate is used in only one channel, both channels, or
neither channels.
If a feature uses a surrogate in only the red channel (Case 2
of Table 39) and the red surrogate value is not greater than
the green processed signal, the p-value and error on the log
ratio are calculated, as usual, using equations 1 and 2 in
294
Feature Extraction Reference Guide
How Algorithms Calculate Results
Data from the FEATURES Table
5
“Step 27. Calculate the p-value and error on log ratio of
feature (PvalueLogRatio and LogRatioError)” on page 279 of
this guide.
Table 39
Summary – Use of surrogates for calculations
Case 1: R/G
Case 2: r/G
Both channels use DyeNorm Signals.
r = rSurrogateUsed
P-value and log ratio are calculated as usual.
G = gDyeNormSignal
For signals not using surrogates,
g(r)DyeNormSignal = g(r)ProcessedSignal,
which is then used to calculate log ratio.
P-value and log ratio are calculated as usual.
Case 3: R/g
Case 4: r/g
R = DyeNormSignal
Both channels use surrogates.
g = gSurrogateUsed
Feature Extraction automatically sets
LogRatio = 0 and pValueLogRatio = 1
P-value and log ratio are calculated as usual.
If R/g < 1, then Feature Extraction automatically sets
LogRatio = 0 and pValueLogRatio = 1
Feature Extraction Reference Guide
If r/G > 1, then Feature Extraction automatically sets
LogRatio = 0 and PvalueLogRatio = 1
For signals using surrogates,
g(r)ProcessedSignal =
g(r) SurrogateUsed * g(r)DyeNormFactors.
295
5
296
How Algorithms Calculate Results
Data from the FEATURES Table
Feature Extraction Reference Guide
Agilent Feature Extraction 12.0
Reference Guide
6
Command Line Feature Extraction
Commands 299
Return Codes 305
Extraction Input 307
Extraction Results 312
The command line version of Feature Extraction software is
called FeNoWindows. You can run FeNoWindows from any
directory. The Feature Extraction installation includes
FeNoWindows along with the necessary grid templates and
protocols. The installer places FeNoWindows.exe in the Feature
Extraction folder, and edits the System Path Variable to include
the Feature Extraction folder.
N O TE
When you start FeNoWindows, you cannot return to Feature Extraction until
FeNoWindows completes any running tasks and exits (or exits due to an error).
FeNoWindows accepts only one project as input. Also, project files containing
more than one extraction, especially 30u extractions, run the risk of running out of
memory.
FeNoWindows accepts project files from v8.5 and later as
input for running Feature Extraction. A Feature Extraction
project file is an XML file that specifies an extraction set.
You create project files using the Feature Extraction user
interface.
FeNoWindows returns result information in XML format; the
result looks similar to a project XML file. FeNoWindows
appends a result code to the project XML file that indicates
Agilent Technologies
297
6
Command Line Feature Extraction
the basic status of the run, such as successful completion,
unsuccessful attempts, warnings, or errors. For a complete
listing of return codes, see Table 40 on page 305.
298
Feature Extraction Reference Guide
Command Line Feature Extraction
Commands
6
Commands
FENoWindows commands are available to perform the
following operations:
• Run extraction
• Add and remove design file (i.e. grid templates)
• Add and remove and export protocols
• Add, remove and export metricsets files
• Add, remove and export dyenormlist
• Get the barcode from image file
• Get the XDR Scan ID from image file
• Link protocol to design file
• Get all protocol list
• Get all metric set list
• Get all design file list
• Get license status
• Get license file text
• Set license
Command line syntax
FeNoWindows [-c command] [-o output_file ] [-p protocol][
-getxdrscanid tif_file] [-getprotocollist][-q <linktype]
[-b tif_file] <input_file> …
command can be any of the following:
[extract | addgrid | addprotocol | adddyenormlist |
removegrid | removeprotocol | removedyenormlist |
linkprotocoltogrid | exportprotocols |
exportdyenormlists]
If you do not specify a command, it defaults to extract.
Feature Extraction Reference Guide
299
6
Command Line Feature Extraction
Commands and arguments
Commands and arguments
extract
This command runs Feature Extraction on the input project.
FeNoWindows –c extract [-o <output_file> ]
<input_file>
input_file The name of an xml project file with the
extension .fep.
output_file The name of the result .xml file. This file looks
like a project file with the status added (see the following
description).
CA U T I O N
extract
You must specify the -o option when specifying the output file name, or
FeNoWindows will not create the file.
This command extracts the designated TIFF file using the
protocol specified. If the protocol is not present, then the
default protocol in Feature Extraction is used. The default
grid template is used for the extraction. This command
creates a temporary project.fep file and uses it for
extraction. SAF information cannot be provided for executing
extraction using this switch.
FeNoWindows [-c extract] [-o <output_file>] [-i <tiff_file>]
[-p <protocol_name>]
output_file The name of the result .xml file. This file looks
like a project file with the status added (see following
description).
tiff_file
The absolute path to the TIFF image file.
protocol_name
extraction.
CA U T I O N
300
The name of the protocol to use for
You must specify the -o option when specifying the output file name, or
FeNoWindows will not create the file.
Feature Extraction Reference Guide
Command Line Feature Extraction
Commands and arguments
addgrid
6
This command adds a grid to the local database.
FeNoWindows –c addgrid [ <design_file_path> |
<grid_file_path>]
design_file_path
grid_file_path
addprotocol
The path and name of a design file.
The path and name of a grid file.
This command adds a protocol to the database.
FeNoWindows –c addprotocol[<protocol_file_path>]
protocol_file_path
addmetricset
The path and name of a protocol file.
This command adds a metric set to the database.
FeNoWindows –c addmetricset[<metricset_file_path>]
metricset_file_path
adddyenormlist
The path and name of a metric set file.
This command adds a dyenormlist to the database.
FeNoWindows –c adddyenormlist [–g gridtemplatename]
<dyenormlist_file_path>
gridtemplatename The name of the database grid template
that the probes in the dye norm list must match
dyenormlist_file_path
list
The path and name of the dye norm
The dye norm list needs to look like:
ProbeName1
ProbeName2
ProbeName3
GeneName1 SystematicName1
GeneName2 SystematicName2
GeneName3 SystematicName3
Spaces between words must be a tab, and no white space is
allowed at the end of the file. When a list is read into the
database, it is checked against the specified grid template to
make sure that the probes match with what is in the grid
template. The basename of the file is used to name the dye
norm list in the database.
Feature Extraction Reference Guide
301
6
Command Line Feature Extraction
Commands and arguments
Example:
-c adddyenormlist -g 14850_D_F_20060807 C:\
DyeNormlist\MyNormlist.txt
removegrid
This command removes a grid from the database.
FeNoWindows –c removegrid <gridname>
gridname
removeprotocol
The name of the grid.
This command removes a protocol from the database.
FeNoWindows –c removeprotocol <protocol_name>
protocol_name
removemetricset
The path to the protocol file.
This command removes a metric set from the database.
FeNoWindows –c removemetricset <metricset_name>
metricset_name
removedyenormlist
The path to the metric set file.
This command removes a dyenormlist from the database.
FeNoWindows –c removedyenormlist [–g gridtemplatename]
<dyenormlistname>
gridtemplatename Name of the grid template associated with
the dye norm list to be removed
dyenormlistname Name of the dye norm list to be removed
Example:
FeNoWindows -c removedyenormlist -g
14850_D_F_20060807 MyNormlist
linkprotocoltogrid
This command links a protocol to a grid template so that
the protocol is automatically assigned if a valid scan barcode
exists.
Command example: FeNoWindows
-c linkprotocoltogrid
-p myOneColorProtocol
-q OneColor 012345_D_
20050212
302
Feature Extraction Reference Guide
Command Line Feature Extraction
Commands and arguments
6
FeNoWindows –c linkprotocoltogrid [-p protocol] [-q linktype
<gridname> ]
linktype Type of link, either OneColor or TwoColor, that
links protocol to grid template
exportprotocols
This command exports all the protocols in a given database
to the location you specify.
FeNoWindows –c exportprotocols <to_directory>
to_directory The complete path to the directory where you
want to keep the protocols.
exportmetricsets
This command exports all the metric sets in a given
database to the location you specify.
FeNoWindows –c exportmetricsets <to_directory>
to_directory The complete path to the directory where you
want to keep the metric sets.
exportdyenormlists
This command exports all the dyenormlists in a given
database to the location you specify.
FeNoWindows –c exportdyenormlists <to_directory>
to_directory The complete path to the directory where you
want to keep the dye norm lists.
Example:
FeNoWindows -c exportdyenormlists C:\DyeNormList
barcode
This command gets the barcode from the tiff image.
FeNoWindows –b tif_file
XDRScan ID
This gets the GUID of the corresponding low PMT scan from
the input high PMT scan for making XDR project files.
Example:
FeNoWindow -getxdrscanid high_pmt_tif_file
Feature Extraction Reference Guide
303
6
Command Line Feature Extraction
Commands and arguments
GetProtocolList
This gets the list of protocols available from within Feature
Extraction.
Example:
FeNoWindows -getprotocollist
304
Feature Extraction Reference Guide
Command Line Feature Extraction
Return Codes
6
Return Codes
Return codes are integers that represent errors that caused
FeNoWindows to fail without generating output.
They are listed in Table 40.
Table 40
FeNoWindows return codes
Return code
Description
0
The extraction project completed without
errors. The output file contains extraction
information for every extraction. This success
code does not guarantee the validity of every
extraction in the set.
1
The input parameter was not found.
Check that the filename and path are correct, or
that the database entry exists and is spelled
correctly.
Feature Extraction Reference Guide
2
Invalid input file. Check that you specified a
valid input file name.
3
Request ignored. If you receive this code when
you are adding a protocol or grid template, the
object already exists in the database and will
not be added. If you receive this code when you
are deleting objects, the object was not found
in the database.
4
No license, or invalid license. Check the
existence, location, and expiration date of your
Feature Extraction license.
5
Initialization failure – MFC failed to initialize.
Call tech support.
6
Initialization failure – COM failed to initialize.
Call tech support.
7
Invalid command line arguments. Check
spelling and syntax.
8
Feature extraction failed. Call tech support.
305
6
Command Line Feature Extraction
Return Codes
Table 40
306
FeNoWindows return codes
Return code
Description
9
Feature Extraction failed to add or remove a
protocol. Database could be down. Restart the
database by rebooting or starting the AGTFEDB
service from the control panel.
10
Feature Extraction failed to add or remove a
grid template. Restart the database.
11
The grid template or protocol link failed. Restart
the database.
Feature Extraction Reference Guide
Command Line Feature Extraction
Extraction Input
6
Extraction Input
The input file for extraction is a Feature Extraction project
(standard, not on-time) file with a file type of XML.
An example of a project file (.fep) is shown. To create
project files, use the Feature Extraction user interface and
the instructions in the Quick Start Guide.
Project
Properties
Settings
<FeatureExtractionML>
<FEPMLVerInfo VerMaj="2" VerMin="50"/>
<FEProject Operator="Unknown"
ResultsDirectory=""
ResultsLocationSameAsImage="True"
OutputMAGE="False"
Note that MAGEOutPkgType
and TextOutPkgType are Full.
This means all the features are
sent to the output file. A compact
subset of features is the alternate
choice.
MAGEOutPkgType="Full"
See Chapter 3 and Chapter 4 of the
Reference Guide for a listing of the
FULL and COMPACT sets of
features sent to the text and
MAGE-ML result files.
TextZipTxtFile="False"
OutputMAGECompressed="False"
OutputJPEG="False"
OutputText="True"
TextOutPkgType="Full"
CropMultipackImage="False"
OutputVisualResults="True"
OutputGRID="False"
OutputArrayQCReport="True"
FTPSendTiffFile="False"
FTPMachineDestination=""
FTPPort="21"
FTPUserName="resolverftp"
FTPPassword=""
FTPProfileDestinationFolder="mage"
Feature Extraction Reference Guide
307
6
Command Line Feature Extraction
Extraction Input
OverWritePreviousResults="False"
RDAUserName="" // For Resolver
RDACtrlGroups="" // For Resolver
DefaultQCMetricSet="" // No longer used
AfterArrayPostProcessingStep=""
AfterSlidePostProcessingStep=""
AfterBatchPostProcessingStep=""
ExternalDyeNormList=""
DefaultProtocol=""
UseGridFileIfAvailable="False"
UseProjDefProtocolFirst="False">
<Extraction Name="US23502418_251407710012_S01">
<XDRScanID Name=""/>
<Image Name="C:\Images\
US23502418_251407710012_S01.tif"/>
<Grid Name="014947_D_20051222"
IsGridFile="False"/>
<Protocol Name="CGH_107_Sep09_2"/>
<Array ID="1"/>
<Sample Name=""/>
</Array>
<Array ID="2"/>
<Sample Name=""/>
</Array>
<Array ID="3"/>
<Sample Name=""/>
</Array>
<Array ID="4"/>
<Sample Name=""/>
</Array>
308
Feature Extraction Reference Guide
Command Line Feature Extraction
Extraction Input
6
<Array ID="5"/>
<Sample Name=""/>
</Array>
<Array ID="7"/>
<Sample Name=""/>
</Array>
<Array ID="8"/>
<Sample Name=""/>
</Array>
</Extraction>
</FEProject>
</FeatureExtractionML>
Example of XDR
extraction set
If you are extracting an XDR pair of images, the Extraction
entity structure will look like the following:
<Extraction Name="US45102874_251494710148_S01">
<XDRScanID Name="01122007125846"/>
<Image Name="C:\GridComparison\
US45102874_251494710148_S01_H.tif"/>
<ImageXDR2
Name="US45102874_251494710148_S01_L.tif
"/>
<Grid Name="014947_D_20060807"
IsGridFile="False"/>
<Protocol Name="miRNA_95_16Jan"/>
<Array ID="1"/>
<Sample Name=""/>
</Array>
<Array ID="2"/>
<Sample Name=""/>
</Array>
Feature Extraction Reference Guide
309
6
Command Line Feature Extraction
Extraction Input
<Array ID="3"/>
<Sample Name=""/>
</Array>
<Array ID="4"/>
<Sample Name=""/>
</Array>
<Array ID="5"/>
<Sample Name=""/>
</Array>
<Array ID="7"/>
<Sample Name=""/>
</Array>
<Array ID="8"/>
<Sample Name=""/>
</Array>
</Extraction>
Example of extraction set
with grid file
If you are extracting with a grid file, the Extraction entity
structure will look like the following:
<Extraction Name="US14702375_251494710059_S01">
<Image Name="C:\GridComparison\
US14702375_251494710059_S01.tif"/>
<Grid Name=" C:\GridComparison\
gridfile_grid.csv" IsGridFile="True"/>
<Protocol Name="miRNA_95_16Jan"/>
<Array ID="1"/>
<Sample Name=""/>
</Array>
<Array ID="2"/>
<Sample Name=""/>
310
Feature Extraction Reference Guide
Command Line Feature Extraction
Extraction Input
6
</Array>
<Array ID="3"/>
<Sample Name=""/>
</Array>
<Array ID="4"/>
<Sample Name=""/>
</Array>
<Array ID="5"/>
<Sample Name=""/>
</Array>
<Array ID="7"/>
<Sample Name=""/>
</Array>
<Array ID="8"/>
<Sample Name=""/>
</Array>
</Extraction>
Feature Extraction Reference Guide
311
6
Command Line Feature Extraction
Extraction Results
Extraction Results
The information contained in the output file (specified with
the -o command) depends on the extraction operation
performed and the options you specified. For example, the
XML file can contain status, time, warning or error
messages, and indicate the number of outliers. Status
information (Success, Error, Warning) is particularly
important.
Status information
Success
Feature Extraction had no issues extracting the data.
Warning
Feature Extraction generated the data, which might be
usable. Users should check the RTF file for the warning.
Feature Extraction probably ran OK. A common warning is
“No SpikeIns found on this design.”
Error
Output files may or may not have been generated. If output
files were generated, users need to look at the image and
shape files to make sure they are OK. The grid may not have
been placed correctly. Users should not trust the data
without visual inspection.
FeNoWindows occasionally reports failures that are not true
errors. The image, RTF file and QC report, and possibly the
shapes file, need to be examined to see why things failed.
312
Feature Extraction Reference Guide
Command Line Feature Extraction
Examples of status information
6
Examples of status information
The following XML file fragments show you examples of
what the status information might look like (presented in
red) after an extraction set is run.
Each of these messages is associated with an extraction set
that has been run.
<FeatureExtractionML>
<FEPMLVerInfo VerMaj="2" VerMin="50" />
<FEProject Operator="Unknown">
<Extaction Name="SinglePack">
<XDRScanID Name="" />
<Image Name="C:\Images\SinglePack.tif" />
<Grid IsGridFile="False”
Name="014077_D_20051222" />
<Protocol Name="CGH_107_Sep09_2" />
<GridFile Path="" />
<FeatFile Path="" />
<ShapeFile Path="" />
<Arrays>
<Array ID="251407710012" />
<SampleId Name="" />
<JpegFile Path="" />
<TextFile Path="C:\Images\
SinglePack_CGH_107_Sep09.txt" />
<QCReport Path="C:\Images\
SinglePack_CGH_107_Sep09.pdf" />
<MAGEML Path="" />
<Result Status="Warning"> //The
overall result of the aray.
<ResultMessages
Status="Success"
Feature Extraction Reference Guide
313
6
Command Line Feature Extraction
Examples of status information
All result messages in the result
entity are array level messages.
These are the same messages that
show up in the batch Run
Summary. Each message has a
message ID associated with it. If
the message is Error or Warning
then message ID indicates the type
of failure or in which module the
failure occurred. The errors and
warnings are summarized in the
tables at the end of this chapter.
Message="1 (Red) and 0
(Green) saturated features"
MessageID="62" />
<ResultMessages
Status="Success"
Message="16 (Red) and 13
(Green) feature non-uniformity outliers"
MessageID="63" />
<ResultMessages
Status="Warning"
Message="Multiplicative
detrending effect inconclusive (CVs increasing):
detrending removed."
MessageID="1032" />
</Result>
<StatsTable>
<Stats Type="float"
The entire stats table is output. We
included only the first two stats as
shown in this example.
Name="gDarkOffsetAverage"
Value="24" />
<Stats Type="float"
Name="gDarkOffsetMedian"
Value="24" />
</StatsTable>
</Array>
</Arrays>
<ExtractionResult Status="Warning">
//The overall result of the slide.
<ResultMessages
Status="Success"
Message="Grid Template in use
: 014077_D_20051222"
314
Feature Extraction Reference Guide
Command Line Feature Extraction
Error codes from XML file
6
MessageID="29" />
All result messages in the
extraction result entity are slide
level messages. These are the
same messages that show up in
the batch Run Summary. Each
message has a message ID
associated with it. If the message
is Error or Warning then message
ID indicates the type of failure or in
which module the failure occurred.
The errors and warnings are
summarized in the tables at the
end of this chapter.
<ResultMessages
Status="Success"
Message="Protocol in use:
CGH_107_Sep09"
MessageID="30" />
</ExtractionResults>
</Extraction>
</FEProjectResults>
</FeatureExtractionML>
Error codes from XML file
The bold error codes do not
correspond to unique error
messages but instead tell you in
which module the software had an
error.
Feature Extraction Reference Guide
Table 41
XML error codes
Error
code
Error message
Type
Abort?
2002
*** Unable to load tiff image content. ***
Memory
Yes
2000
Insufficient memory
Memory
Yes
3000
Grid is placed outside the scan!
Gridding
Failure
Yes
3000
Found Feature num outside the Scan at
xpos ypos – Ignoring
Gridding
Failure
No
3000
Gridding Error: X location obtained for
grid origin is invalid (GridPlacement)
Grid
Metrics
Yes
3000
Gridding Error: Y location obtained for
grid origin is invalid (GridPlacement)
Grid
Metrics
Yes
3000
The grid may be placed incorrectly. The
spot centroids are shifted relative to their
nominal grid
Grid
Metrics
No
315
6
Command Line Feature Extraction
Error codes from XML file
Table 41
316
XML error codes
Error
code
Error message
Type
Abort?
3000
There are a large percentage of not found
features along one or more of the array
edges. We recommend checking the QC
Report, the image and the grid before
using this data.
Grid
Metrics
No
3000
There is a large percentage of
background non-uniform outliers. We
recommend checking the QC Report, the
image and the grid before using this
data.
Grid
Metrics
No
3000
There are a large number of negative
control outliers. We recommend
checking the QC Report, the image and
the grid before using this data.
Grid
Metrics
No
3000
The Median percent CV of the replicated
probes is very high. We recommend
checking the QC Report, the image and
the grid before using this data.
Grid
Metrics
No
4000
Algorithm Error: This means that Poly
Outlier flagger had a problem. Several
possible error messages can be
generated here but they all happen in
Outlier Flagging.
Data
Processing
Yes
4000
(SpotAnalyzer) Not enough pixels for
good pixels statistics. Try adjusting the
protocol. Try turning off pixel outlier
rejection.
Data
Processing
Yes
4000
Execution error: (DyeNorm) No
normalization file selected. The select
Protocol requests use of a Dye Norm list
during Dye Normalization, but a Dye
Norm List was not supplied either by
external file or by GridTemplate default
Data
Processing
Yes
Feature Extraction Reference Guide
Command Line Feature Extraction
Error codes from XML file
Table 41
Feature Extraction Reference Guide
6
XML error codes
Error
code
Error message
Type
Abort?
4000
NRC Error: a or b too big, or MAXIT too
small in betacf. Note this error can be
generated in Dye Normalization or in
Background Subtraction. The Error code
will either be 4050 or 4012 as a result.
Data
Processing
Yes
4000
Execution error: (DyeNorm) Need a 2
color scan to do dye normalization.
Data
Processing
Yes
4000
Data
Execution error: (DyeNorm) There are
Processing
not enough features to perform dye
normalization. All features designated
for use in dye normalization are not fit to
be used. These features may be controls,
outliers, or contain bad probe sequences.
Yes
4000
There appears to be a large shift (x.x
pixels) between the two scans in
red/green. (Comes up if scans from XDR
pair are not aligned).
Data
Processing
No
4000
Execution Error: (BGSub) BGSub Error
Message.
Data
Processing
Yes
4000
Found Feature (%d,%d -- %d) with 0
pixels used to calculate mean -- Dubious
Significance
Data
Processing
No
4006
(SpotAnalyzer) The background Radius
(either calculated or specified) is either
smaller than a single feature or larger
than the scan. Check the specified
BGRadius or the Col and Row Spot
Spacing of the Grid.
Data
Processing
Yes
4007
(SpotAnalyzer) Given the current
background Radius (either calculated or
specified), the region of interests for
computing spot Statistics have no pixels!
Please check the Background Radius in
the Protocol.
Data
Processing
Yes
317
6
Command Line Feature Extraction
Error codes from XML file
Table 41
318
XML error codes
Error
code
Error message
Type
Abort?
4015
The select Protocol requests use of a
Dye Norm list during Dye Normalization,
but a Dye Norm List was not supplied
either by external file or by GridTemplate
default
Data
Processing
Yes
5000
Execution error: Cannot Open file (… etc
…)
I/O Error
No
5000
Print Failure …
I/O Error
No
5000
Execution error: Failed to generate a
picture of grid corners.
I/O Error
No
5000
Error accessing scan file …
I/O Error
Yes
7000
*** User aborted ***
Abort
Yes
8000
The scan has no barcode or the grid
template you assigned to this extraction
set has an AMADID different from the
AMADID in its scan's barcode info, FE
unable to automate the extraction The
operation completed successfully
8000
Metricset %s is not present in database.
Please import missing metricset into
database.
I/O
Yes
8000
Unable to start extraction: Unsupported
scanner. Model GenePix 4000B [83750]
by Axon Instruments (V1.00) is not
supported
I/O
Yes
8000
Unable to start extraction: Unable to
open C:\Documents and Settings\
avinash_borde\Desktop\\
P90S35_portrait01_GE2-NonAT_95_Feb
07_feat.csv The system cannot find the
file specified.
I/O
Yes
8000
Unable to find a default grid template
from eArray. + some reason
I/O
Yes
Feature Extraction Reference Guide
Command Line Feature Extraction
Warning codes from XML file
Table 41
6
XML error codes
Error
code
Error message
Type
Abort?
8000
Unable to start extraction: Extraction
creating error. Grid does not match
image size.
8000
Failed to import design file into database.
+ some reason.
8000
Unable to find default protocol for
extraction. + some reason.
8000
Unable to start extraction:
ALL
Yes
10000
Extraction failed.
ALL
Yes
10000
Extraction completed with errors.
ALL
No
20000
Execution error: Low Level Runtime
Error.
Memory
Yes
Warning codes from XML file
Feature Extraction Reference Guide
Table 42
XML warning codes
Warning
code
Warning message
Resolution
1024
The scan resolution is not
sufficient for the density of the
design. Gridding might be off,
intensities might be imprecise.
Rescan the image in 5 micron
mode.
1060
Agilent does not support this
configuration, please consult the
support matrix in the Feature
Extraction users guide for a
supported configuration.
See Table 1, Supported Scans
and Array Formats in the Feature
Extraction User Guide.
319
6
320
Command Line Feature Extraction
Warning codes from XML file
Warning
code
Warning message
Resolution
1125
The computation of the XDR fit
for red/green is based on only
num pairs of (high PMT, low
PMT) matching values.
Signal ranges of the scan are not
high enough to warrant XDR.
This can be ignored.
1126
The computation of the XDR fit
for red/green is based on a
small range of values (low PMT
range: xx.xx ).
Most likely the signal ranges are
not high enough to warrant XDR.
This can be ignored.
1127
The computation of the XDR fit
for red/green results in a large
intercept (xx.xx).
Most likely the background on
this array is high. Check the QC
report.
1128
The computed XDR ratio for
red/green is xx.xx vs expected
xx.xx from PMT settings. Check
scanner calibration.
Could show an ozone problem if
the red ratio is always off.
Scanner PMT calibration should
be checked but the effect on the
data is arguably small in the two
color case because of dye
normalization.
1029
Feature Significance will be
computed on Pixel Statistics
since the Error Model is turned
off.
Protocol Error. Run correct
Agilent protocol. This warning
will NOT come up when Feature
Extraction is properly configured
and standard tested protocols
are used.
1031
Multiplicative Detrending will
not be performed (red/green
Channel): did not find enough
suitable replicated features to be
able to reliably detrend.
Didn’t find enough non Control
replicates to detrend. Doesn’t
effect data. Use a design with
replicated features (at least 75
total replicates (more is better!)
with at least 5 replicates per
feature with at least 5 different
probes replicated). OR run
detrending using all features not
replicated ones.
Feature Extraction Reference Guide
Command Line Feature Extraction
Warning codes from XML file
Feature Extraction Reference Guide
6
Warning
code
Warning message
Resolution
1031
Multiplicative Detrending will
not be performed (%s Channel):
did not find enough suitable
features to be able to reliably
detrend.
Probably indicates another
problem. This array should be
looked at.
1032
Multiplicative detrending effect
inconclusive (CVs increasing):
detrending removed.
Need at least 5 replicates per
feature with at least 5 different
probes replicated. If detrending
doesn’t help the data then we
turn it off. Maybe we fit noise.
This warning can be ignored.
1033
(BGSub) Failed to automatically
estimate additive error. Value
num has been used as the
Red/Green additive error.
Won’t come up using standard
protocols. The surface fit needs
to be calculated.
1034
The auto-estimate of the
additive error used only Negative
Control statistics for this array.
Won’t come up using standard
protocols. The surface fit needs
to be calculated.
1036
The CGH QCReport cannot be
generated for one color Data.
Won’t come up using standard
protocols.
1037
CGH is not a one color protocol.
No valid formulation exists.
Ignoring the protocol's
parameter 'UseSpikeIns'.
Won’t come up using standard
protocols.
1038
Not enough significant eQC
replicates for some probes. Their
statistics will be set to zero.
Maybe nothing was Spiked In. If
SpikeIn’s were used then this
indicates another problem. This
array should be looked at.
1039
There are no eQC probes on this
array -- Cannot perform a fit of
the data.
The design in use has no
spike-ins defined. Can be
ignored or you can create a
special protocol just turning off
Spike-ins.
321
6
322
Command Line Feature Extraction
Warning codes from XML file
Warning
code
Warning message
Resolution
1040
The SpikeIns on this array
appear suspect. Software is
unable to make a fit of the data.
Setting the fit statistics to 0.
Either nothing was Spiked in or
there is another problem with
the data.
1041
The SpikeIns on this array
appear suspect. Most of the eQC
probes measured are either in
the noise or saturated, Cannot
make a linear fit of the data.
Setting the fit statistics to 0.
Either nothing was Spiked in or
there is another problem with
the data.
1042
This CGH design has no
systematic name defined -cannot calculate derivative of
the log ratio SD.
This is a design file problem. The
systematic name for CGH arrays
needs to have the chromosome
coordinates defined to compute
the DLRSD metric.
1043
No Spike-in probes found in this The design in use has no
Array -- Setting the protocol's
spike-ins defined. Can be
parameter 'UseSpikeIns' to false ignored or you can create a
special protocol just turning off
Spike-ins.
1044
(Ratio) Warning: Detected a
negative or zero propagated
variance on the log ratio. Check
the log file for more details.
Indicates data problem. This
array should be looked at.
1045
The AutoFocus was suspended
for an extended period of time
during the scan( xxx.xx). Inspect
the surface of the slide for
contamination, and make sure
that the scan region does not
overlap the barcode or other
non-transparent areas of the
slide. Check the scan image for
anomalies and then rescan.
Rescan the array.
Feature Extraction Reference Guide
Command Line Feature Extraction
Warning codes from XML file
Feature Extraction Reference Guide
6
Warning
code
Warning message
Resolution
1046
The AutoFocus was suspended
during the scan for (xxx.xx%) of
time, longer period than the
threshold (xxx.xx%). Inspect the
surface of the slide for
contamination, and make sure
that the scan region does not
overlap the barcode or other
non-transparent areas of the
slide. Check the scan image for
anomalies and then rescan, if
necessary.
Rescan the array.
1047
The AutoFocus was suspended
during the low PMT scan for
(xxx.xx%) of time, longer period
than the threshold (xxx.xx%).
Inspect the surface of the slide
for contamination, and make
sure that the scan region does
not overlap the barcode or other
non-transparent areas of the
slide. Check the scan image for
anomalies and then rescan, if
necessary.
Rescan the array.
1048
There is no barcode/array
identifier in the scan header.
MAGE / GEML output is invalid.
If the scan is correctly named
then the MAGE-ML output will
be again valid. This warning can
be ignored.
1050
Extraction of %s discarded
before completion
1300
QCMetrics Totals: Found %d of
%d Individual Metrics In Range.
Overall, the Array …
When Running the software
using a metric set with
thresholds and evaluation
criteria, the array wasn’t in
range of the given metrics and
needs to be looked at. This
would be important for a user to
take a look at the data before
further processing.
323
6
324
Command Line Feature Extraction
Warning codes from XML file
Warning
code
Warning message
Resolution
1051
(BGSubtract) There are no
negative controls on this array.
Switching background method
to MinFeat.
1052
(BGSubtract) Failed to calculate
background statistics.
1053
Feature Significance will be
computed on Pixel Statistics
since the Error Model is turned
off.
1055
FE unable to find attached
protocol %s into database.
Searching default protocol for
extraction.
If the attached protocol is not
found in database.
1056
Unable to get application type
from grid template. FE
automatically treated the
application type as Expression.
If the application type is blank in
grid template.
1057
Grid template online Update
status: + reason.
Failed to check grid template for
update or failed to download
Grid template during update.
1058
Failed to import new grid
template into database. +
reason.
Failed to import design file
during Grid template update.
Feature Extraction Reference Guide
Index
Numerics
1-color detrend algorithm, 272
A
Agilent scanner protocols
difference between gene expression
and CGH protocols, 15
GE2_11kx2_1005, 14, 55
GE2_22k_1005, 14, 55
algorithms
how calculate results, 238
overview, 224
results they produce, 230
annotations
public accession numbers, 204
C
command line syntax, 299
commands
add grid, 301
addprotocol, 301
exportprotocols, 303
extract, 300, 303
linkprotocoltogrid, 302
removegrid, 302
removeprotocol, 302
commands and arguments, 300
compute ratios and errors
calculate feature log ratio, 279
calculate processed signal, 278
calculate pvalue and log ratio
error, 279
calculate surrogate value, 271
control types, 221
Feature Extraction Reference Guide
correct bkgd and signal biases
calculate background-subtracted
feature signal, 254
calculate significance, 269
how background adjustment
works, 262
how multiplicative detrend algorithm
works (1-color only), 272
values for BGSubSignal, BGUsed and
BGSDUsed, 254
correct dye biases
calculate normalization factor, 276
select normalization features, 274
G
E
MAGE-ML format
result file, 207
MAGE-ML result file
feature results, 210, 216
protocol parameters, 209
scan protocol parameters, 208
multiplicative detrend algorithm
(1-color), 272
example calculations, 290
extraction input, 307
extraction results
example output file, 313
status information, 312
F
feature flag info, conversion of, 221
features
results, 178
file format options, 222
find and measure spots
calculate mean signal of feature, 246
calculate mean signal of local
background, 247
define features, 242
estimate local background radius, 242
reject pixel outliers, 245
saturated features, 247
flag outliers
non-uniformity, 248
population, 250
GEML result file
feature results, 210, 216
L
log ratios
from adjusted background-subtracted
signals, 264
from unadjusted background-subtracted
signals, 263
M
N
nonuniformity outliers
estimated feature or bkgd
variance, 248
measured feature or bkgd
variance, 250
O
outliers
criteria for rejecting, 246
interquartile range method, 246
standard deviation method, 246
325
Index
output files
control types, 221
how used by databases, 206
integrating with Resolver, 220
text, 127
QC Report Types
1-color gene expression, 72, 75, 79
2-color gene expression, 69
CGH, 77, 81
R
P
parameter options, 129
place grid
find nominal spot positions, 238
protocol
find settings, 14, 55
hidden settings, 15
public accession numbers, 204
Q
QC Report
foreground surface fit, 97
header, 87, 88
local background inliers, 97
microarray uniformity, 106
net signal statistics, 91
outlier number and distribution, 91
plot of background-corrected
signals, 95
plot of LogRatio vs Average Log
Signal, 101
reproducibility plot (spike-ins), 108
reproducibility statistics (non-control
probes), 104
results in FEPARAMS and STATS
table, 121
sensitivity, 107
spike-in log ratio statistics, 108
spot finding four corners, 90
up- and down-regulated features, 100
QC Report (1-color only)
Histogram of Signals Plot, 96
Multiplicative Surface Fit, 99
Spatial Distribution of Median
Signals, 102
326
results
features, 178
integrating with Resolver, 220
QC Report parameters and stats, 121
statistical, 159
text file, 127
text file output, 127
return codes, 305
Rosetta Biosoftware, use of XML output
with, 220
S
signals
background-subtracted, adjusted, 264
background-subtracted,
unadjusted, 263
statistical results, 159
T
tables
FEPARAMS, 129
parameters, 129
statistical results, 159
text file
feature results, 178
parameters, 127
statistical results, 159
text file results, 127
TIFF file format options, 222
TIFF results, 222
U
up-and down-regulated features
spatial distribution, 100
Feature Extraction Reference Guide
www.agilent.com
In this book
The Reference Guide
presents descriptions of
the protocols, or methods,
available for use with
Agilent Feature Extraction
12.0, as well as a listing
of results and an
explanation of how the
Feature Extraction
algorithms work.
This guide provides:
• a list of the default
settings for each
protocol shipped or
downloaded with the
software
• a list of all the
parameters and results
available after feature
extraction
• the equations and a
sample calculation for
the feature extraction
process
Agilent Technologies, Inc. 2015
Revision A2, August 2015
*G4460-90052*
G4460-90052
Agilent Technologies