1
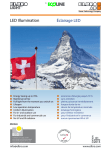
2012 / EN
led_guide-titulka.pdf 1 18. 5. 2012 8:20:04
OMS LED CALCULATOR – USER MANUAL
Table of content
1. Prologue
1.1 What is LED CALCULATOR
1.2 What for you need LED CALCULATOR
1.3 System requirements
2. Where you can find it and how to log in
2.1 Web browser
2.2 Username and passwort
3. LED CALCULATOR
3.1 Overview „MAIN WINDOW“
3.2 Parameter window
3.3 Detailed explanation of parameter window
3.4 Sensor settings
3.5 How LED luminaires influence air condition systems
3.6 Report window
3.7 Detailed explanation of report window
4. Print and Export
4.1 Print
4.2 Export
5. Help menu
6.Glossary – Lighting terminology for OMS
LED CALCULATOR
232
USER MANUAL/OMS LED CALCULATOR
1.1. What is LED CALCULATOR?
LED CALCULATOR is a user friendly, web based software specially written to compare luminaires with classic
and LED based light sources.
It matches different economic, environmental and technical data, like CO2 consumption, system power,
maintenance cost, influence on air condition systems and many more.
1.2. Why you need LED CALCULATOR?
LEDCALC supports to visualize the advantages of LED based luminaires. A lot of information are displayed and calculated:
•
Payback time
•
Energy consumption in a certain time period
•
Influence of LED based luminaires on air condition systems
•
Impact of daylight sensors on total investment costs
•
Effect of presents detectors on total investment cost
•
Ascendancy of maintenance cycles on total investment costs
•Graphical analysis
OMS LED CALCULATOR
1. Prologue
1.3. System requirements
LED CALCULATOR is web based and running on every operating system with internet browser.
•
Minimum software requirements
Operating system
•
•
Windows 95 or higher
Mac OS X
Internet browser
•
•
•
•
2.Where you
can find it
and how to
log in
Internet explorer
Mozilla Firefox
Safari
or other dedicated browsers for tablet computers
2.1. Web browser
Open the web browser located on your desktop (figure 2.1.1)
Figure 2.1.1:
Windows 7
233
Please type in the address field following link (figure 2.1.2) and press enter:
http://intranet.oms.sk/OMSLC/Pages/Report.aspx
Figure 2.1.2:
Internet explorer
Please type
in the address field
2.2. User name and password
Right after following the link appears an input box (figure 2.2.1) which is asking for user name and password.
For your personal login information please contact sales at OMS.
Figure 2.2.1
User name and password request]
Please enter your user name and
password to log in to
OMS LED CALCULATOR
3. LED
CALCULATOR
3.1. Overview main window
Parameter window
This section allows the luminaire choice for the comparison. Additional you are able to do several manual entries to
specify the frame conditions of the calculation.
Report window
This view shows all selected parameters from the luminaires and the results of the calculation in an alphanumerical and
graphical way.
Figure 3.1.1
Parameter and report window
The main window is
separated in two parts
Report window
234
USER MANUAL/OMS LED CALCULATOR
Parameter window
From the drop down menu you can select two luminaires. This menu is frequently updated by OMS with the
latest information and with new luminaires.
The data of the fixtures in this software are based on real photometric measurements.
Figure 3.2.1:
Parameter and report window
LED CALCULATOR will be updated
continuously by OMS so that you
are able to compare always the
latest OMS LED luminaires.
OMS LED CALCULATOR
3.2. Parameter window
3.3. Detailed explanation of parameter window
Product 1
Select luminaire 1 from the drop down menu
Product 2
Select luminaire 2 which you want to compare with product 1
Luminaire price 1
Insert the selling price of the first luminaire
Lamp price 1
Insert in case of a luminaire with classic light sources the purchase price from the light source.
Attention: Some luminaires have two or more light sources, in this case please count with the total price.
Luminaire price 2
Insert the selling price of the second luminaire
Lamp price 2
See LAMP PRICE 1
Currency
Insert country specific currencies which are important for international business activities. (Default value is €)
235
Basic quantity of first product
Insert the quantities of products which are needed for a certain room size.
ATTENTION: Exact quantities are necessary to be confirmed by professional lighting calculation.
(Default value is 20)
Energy price
This value is important when you know the exact energy price per kilowatt from the country of installation to calculate
the energy cost differences between the selected luminaires.
(Default value is 0,2€/kW)
Maintenancance work price
The maintenance work price is the cost for maintaining the installed luminaires. This value shows the customer the
difference between a classic light source which has to be changed continuously and a LED light source which is almost
maintenance free. The work price is in every country different, this depends on different labor costs.
Additional lifting devices may be needed for higher installations, don´t forget to add these costs here in this field too.
(Default value is 25€/h)
Maintenancance work time
Maintenance takes time, which is a big cost factor in servicing. Think about office buildings or shopping centers with
thousands of luminaires which have to be maintained continuously.
The maintenance value has to be added in hours, e.g. for 30 min. per luminaire you write 0,5 in the field. (Default value
is 0,25 for 15 min.)
Please think about manipulation times if you are using special lifting devices.
Evaluation period
It describes the time period for the comparison in hours. Because of the minimum LED lifetime, the default value is
50.000 hours.
Air condition coefficient 1/2
Please check “How LED luminaires influence air condition systems”
(Default value is 1)
Daylight sensor coefficient 1/2
Daylight sensors significantly influence the overall operating costs of installed luminaires.
These detectors check the daylight situation and control the luminous flux according to the natural light.
If it is sunny outside, the sensor reduces the light output to a minimum level which saves a lot of energy opposite
luminaires without.
Please check sensor setting table with different combinations of sensors for your individual calculation.
(Default value is 1)
Present detector coefficient 1/2
Presence detectors sense continuously any movements next to the luminaire. In case of no activities in the defined area
the luminaire dim down or switch off automatically. This results to additional energy savings.
Please check the sensors setting table with different combinations for your individual calculation.
(Default value is 1)
Days per year
This field represents the operating time per year.
(Default value is 365)
Hours per day
This field represents the operating time per day.
(Default value is 12)
3.4. Sensor settings
Depending on application the use of sensors reduce the power consumption effectively. Unfortunately the values
are varying a lot in praxis. The exact calculation is only possible if you know the installation and application
parameters. In case you do not know them, put there indicative values.
Motion detector
Motion sensors are often used in indoor spaces to control luminaires. If no movement is detected, it is assumed that
the space is empty, and thus does not need to be lit. Turning off the lights in such circumstances can save substantial
amounts of energy. In lighting practice occupancy sensors are sometime also called “presence sensors” or “vacancy
sensors”.
Occupancy sensors for lighting control use infrared (IR) or microwave technology, or a combination of the two. The field
of view of the sensor must be carefully selected / adjusted so that it responds only to motion in the space served by the
controlled lighting. For example, an occupancy sensor controlling lights in an office should not detect motion in the
corridor outside the office. Sensors and their placement are never perfect, therefore most systems incorporate a delay
time before switching. This delay time is often user-selectable, but a typical default value is 15 minutes. This means that
236
USER MANUAL/OMS LED CALCULATOR
Daylight sensors
Several studies have recorded the energy savings due to daylight harvesting.
Savings are very dependent on the type of space the light harvesting control system is deployed in, and its usage. Clearly,
savings can only accrue in spaces with substantial daylight where electric lighting would have been otherwise used.
Therefore daylight harvesting works best in spaces with access to conventional or clerestory windows, skylights, light
tube groups, glass block walls, and other passive day lighting sources from sunlight; and where electric lighting would
otherwise be left on for long periods. Such spaces have included offices, atria, interior public multistory plazas and
shopping mall courts, and schools.
However, studies have shown that by using daylight harvesting technologies, owners can see an average annual energy
savings of 30%
TYPE OF DIMMING
NO DIMMING PRESENCE / MOTION DETECTOR DAYLIGHT SENSOR PRESENTS / MOTION & DAYLIGHT SENSOR DAYLIGHT DEPENDENCY FACTOR
OMS LED CALCULATOR
the sensor must detect no motion for the entire delay time before the lights are switched. Most systems switch lights
off at the end of the delay time, but more sophisticated systems with dimming technology reduce lighting slowly to a
minimum level (or zero) over several minutes, to minimize the potential disruption in adjacent spaces. If lights are off and
an occupant re-enters a space, most current systems switch lights back on when motion is detected. However, systems
designed to switch lights off automatically with no occupancy, and that require the occupant to switch lights on when
they re-enter are gaining in popularity due to their potential for increased energy savings. These savings accrue because
in a space with access to daylight the occupant may decide on their return that they no longer require supplemental
electric light.
OCCUPANCY DEPENDENCY FACTOR
1
1
1
0,9
0,8 0,9
0,72 0,72
No dimming
Customer has no sensors installed. In this case fill all fields with 1
Presence / motion detector
Customer has a presence or motion detector installed. In this case fill this field with 0,9 if the area of installed luminaire
is not frequently in use (e.g. corridor in a hotel). The luminaires are automatically switched on if someone is entering
this area.
Daylight sensor
Customer has a daylight sensor installed. In this case you can fill this field with 0,8.
3.5. How LED luminaires influence air condition systems
The fact that LED luminaires have usually a higher efficiency opens the possibility to save energy on air condition
sytems, which is a perfect selling argument too.
Compared are two downlights, left side with 46 W LED light source and on the right with 2x32W FSMH (TC-TEL).
The luminaire which is equipped with TC-TEL light source has a power consumption of 2x32W (64W total) and a installed
lumen package (light source) of 3600lm.
The electronic control gear needs 2W additional.
The light output ratio is 100%.
This results in a net lumen output of 4800 lumens and a system efficiency of 75.0lm per watt.
On the other side we have a luminaire which is equipped with an LED module and has a power consumption of 46W
in total inclusive driver.
The light output ratio is 100% (according the latest regulation for photometric measurements, LOR for LED based
luminaires are always mentioned in 100%).
On this example we have a net lumen output of 2950 lumens and a system efficiency of 64.1lm per watt.
237
It means, with a LED equipped luminaire we need a significant lower power consumption to achieve the same net lumen
output.
For a room with 10 pcs of luminaires equipped by 2x32W (TC-TEL) you need 640W electrical energy. Only 20% of the
electrical energy is transformed into light, 80% is transformed to thermal energy.
This thermal energy in the amount of 512W has to be cooled down by air condition system.
Opposite is a room with 10pcs of luminaires, equipped by a 46W LED module, in total 460W power consumption.
Let´s calculate, because efficacy of an LED is higher, that 30% of electrical energy is transformed into light and 70%
is transformed into heat. In this case the air condition system has only to cool down additional 322W thermal energy.
Conclusion: Difference of 190W which do not need to be cooled down.
3.6. Report window
Basic information about 1st selected luminaire
Basic information about 2st selected luminaire
Figure 3.6.1:
Report window
Basic information about
1st. and 2st. selected
luminaire
Technical specification of first
selected luminaire
Calculated values of first selected
luminaire
Diagram and payback
comparision of selected luminaires.
Technical specification of first selected luminaire
Calculed values of first selected luminaire
Diagram and payback comparison of selected luminairea
3.7. Detailed explanation of report window
1. Basic information (1st and 2nd Luminaire)
•
•
•
•
•
•
238
Manufacturer: producer of the luminaire
Type: E.g. DOWNLIGHT, SPOT, GRIDLIGHT…
Product name: Name of product e.g. CASTOR
Color temperature: 4000k / 3000k / ….. (see glossary)
CRI (color rendering index): e.g. 80 / 83 / …. (see glossary)
Lumen output: e.g. 2000lm / 3000lm / …. (see glossary)
USER MANUAL/OMS LED CALCULATOR
Detail technical information (1st and 2nd Luminaire)
Lumen output light source measured
This value shows the measured lumen output from the light source without losses from driver / ballast and optic.
Wattage
This value represents the system wattage of the luminaire including losses on driver or ballast.
Light source efficacy
This value is calculated by “lumen output light source measured” and the wattage, called efficacy of the light source in
lumen / watt [lm/w].
LOR (Light Output Ratio)
Optical efficacy - for detailed information please see glossary.
System efficiency
This value indicates the overall efficiency of the luminaire including all losses (driver / ballast, optic, thermal).
OMS LED CALCULATOR
2.
Net lumen output from luminaire
This value is the lumen output from the luminaire including all losses.
Luminaire price
This value displays the price of the luminaire, which was defined in the parameter view.
Cost for light source
This value displays the price of the light source (e.g. the price of an incandescent bulb or a T5 tube), which was defined
in the parameter view.
Color consistence
For detailed information please see glossary.
Lifetime
This field displays the evaluated average lifetime of the light source.
Classic lamps have an average lifetime between 2000h - 20.000h, LED´s between 50.000h – 100.000h.
Maintenance cycle
This calculated value displays how often the luminaires have to be maintained during the evaluation period (maintenance
includes: changing of light source, cleaning and other operations which keep the luminaire functional).
Maintenance factor
This value is preset, for classic light sources “0,8” and for LED light sources “0,9”.
Air Condition
This value is displayed from the parameter field and depends on air condition systems and type of installed luminaires.
Present detection
This value is displayed from the parameter field and depends on usage of present detection systems.
Daylight sensor
This value is displayed from the parameter field and depends on usage of daylight sensors.
3.
Calculated values (1st and 2nd Luminaire)
Calcul. Qty of products incl.LLMF (see glossary for lamp lumen maintenance factor LLMF)
This field displays the quantities of installed luminaires in ratio of the net lumen output from the first selected luminaires,
taking into account also the LLMF.
Initial investment costs
This field displays the initial investment costs of the luminaires.
Energy costs
This field counts the costs for energy consumptions during the operation time (evaluation period).
Reductions (AC, PD, DS)
This field displays the energy savings on air condition systems, savings based on present detections and daylight sensors.
Maintenance
This field displays the cost of maintenance during evaluation period.
Total costs
This field shows the summery of all costs after the evaluation period.
239
4.
Diagram output (1st and 2nd Luminaire)
Figure 3.1.1:
Diagram output
System efficiency
Displays the direct comparison of the efficiency from both selected luminaires.
Net lumen output
Displays the direct comparison of the net lumen output from both selected luminaires.
Life time
Displays the direct comparison of the lifetime from both selected luminaires.
Unified glare rating [UGR] (see glossary)
Displays the direct comparison of unified glare rating from both selected luminaires
Payback time diagram
This diagram visualizes the payback time due to higher initial costs of LED fixtures
The crossing of the graphs show the breakeven point, that means after how many hours of operation the system is
profitable compared to the second luminaire.
4. Print and
Export
240
The print and export function provides several possibilities to publish the result.
On the upper right corner you find the action button. Chose from the drop down menu „PRINT“ or „EXPORT“.
USER MANUAL/OMS LED CALCULATOR
This function sends the report directly to the installed printer. After click appears the standard print window which you
know from other windows applications.
Figure 4.1.1:
Print
OMS LED CALCULATOR
4.1.Print
4.2. Export
This function exports the report to different file formats.
Figure 4.2.1:
Export
Following file formats
are supported:
XML
CSV
PDF
MHTML
Excel
TIFF
Word
5.Help menu
Figure 5.1.1:
The help menu gives access to the user manual and glossary.
You find it on the upper right side.
After click, the help window pops up to open the glossary or the user manual.
Figure 5.1.2:
241
6.Glossary –
Lighting
terminology
for OMS
LED
CALCULATOR
Color Rendering Index (CRI)
Color rendering is measured on an index from 0-100. Natural daylight and incandescent lamps have CRI 100.
It describes the ability to reproduce colors by an object.
Objects and people viewed under lamps with a high color rendering index (CRI) generally appear more true to life.
Figure 6.1.1:
Colour Rendering Index
Color Temperature
The absolute temperature of a blackbody radiator having a chromaticity equal to that of the light source.
Figure 6.1.2:
Colour Temperature
Lumen
Lumen is the basic unit for measurement of light.
A dinner candle puts out about 12 lumens. A 60-watt bulb is much more powerful and provides 855 lumens. If a uniform
point source of 1 candela is at the center of a sphere of one foot radius which has an opening of one square foot area
at its surface, the quantity of light that passes through is exact one lumen.
Figure 6.1.3:
Energy Efficient Lighting
LUMEN/WATT
Source Paragon Lighting and
Green Ecometrics research
Energy efficient lighting fixtures
such as LED are provide twice the
lumens per watt of electricity than
legacy metal halide fixtures.
200
150
100
50
0
LED
T8
T5 HO
Fluorescent Fluorescent
High
Pressure
Sodium
Metal
Metal halide
halide
Pulse Start
Lumens Per Watt (lpw)
Examples:
Edison’s first lamp 1.4 lpw
Incandescent lamp 10-40 lpw
Fluorescent lamps 35-104 lpw
Halogen lamps 20-45 lpw
Mercury lamps 37-63 lpw
Metal halide lamps
80-125 lpw
High pressure sodium lamps 54153 lpw
242
A measure of the efficacy of a light source in terms of the light produced for the power consumed. For example, a 100watt lamp producing 1750 lumens gives 17.5 lumens per watt.
Net lumen output
Describes the lumen output including all losses from reflector, diffuser, etc.
Light output ratio (LOR)
According to DIN/EN 13032/2, the LOR (Light Output Ratio) describes the ratio of the luminous flux of the luminaire
to the lumens of the lamps used. Luminaires with direct/indirect emission also specify the “DLOR” (Downward Light
Output Ratio) and the “ULOR” (Upward Light Output Ratio) as separate components. These indicate the light intensity
distribution of a luminaire in the lower and upper parts of the room. NOTE: According the latest regulation for
photometric measurements LOR for LED based luminaires is always mentioned in 100%.
USER MANUAL/OMS LED CALCULATOR
Color constancy is a part of the visual perception system which allows people to perceive color in a variety of conditions,
and to see some consistency in the color. An apple which is red in the bright morning sunlight will also appear red
under candlelight and in the late afternoon, when the wavelengths of the light available are actually very different.
Likewise, if the apple is partially in the sun and partially in the shade, an observer will read the entire apple as red. This
allows someone to recognize the apple even though the conditions have changed, with the eyes perceiving the color
as relatively constant.
Figure 6.1.4:
Color consistency:
The colors of a hot air balloon
are recognized as being
the same in sun and shade
MacAdam set up an experiment in which a trained observer viewed two different colors, at a fixed luminance of about
48 cd/m2. One of the colors (the “test” color) was fixed, but the other was adjustable by the observer, and the observer
was asked to adjust that color until it matched the test color. This match was, of course, not perfect, since the human
eye, like any other instrument, has limited accuracy. It was found by MacAdam, however, that all of the matches made
by the observer fell into an ellipse on the CIE 1931 chromaticity diagram. The measurements were made at 25 points
on the chromaticity diagram, and it was found that the size and orientation of the ellipses on the diagram varied widely
depending on the test color. These 25 ellipses measured by MacAdam, for a particular observer are shown on the
chromaticity diagram.
OMS LED CALCULATOR
Color consistency / MacAdam ellipses
Figure 5.1.5:
MacAdam ellipses for one of
MacAdam’s test participants,
Perley G. Nutting Jr. (observer
“PGN”), plotted on the CIE 1931
xy chromaticity diagram.
The ellipses are ten times their
actual size, as depicted in
MacAdam’s paper.
Unified glare rating (UGR)
The UGR method (Unified Glare Rating) is an international index presented by CIE in publication 117 and is used to
evaluate and limit the psychological direct glare from luminaires. Contrary to previous methods where the glare was
rated using the luminance values of a single luminaire, this method calculates the glare of the entire lighting installation
at a defined observer position. According to DIN EN 12464, the UGR reference value is provided for a standard room.
An exact calculation of the UGR value at a defined observer position in a room is possible with modern lighting design
programs. The lower the UGR value, the lower the glare. Where the luminance is < 1500 cd/m2, additional data is
provided on the elevation angle, either 65°. This is the critical angle above which the luminaire should not exceed 1500
cd/ m2.
Efficacy
Efficacy is the ratio of lamp lumens to the electrical power (watts) consumed. Usually it is expressed in lumens per watt.
System efficiency includes ballast losses.
Lamp lumen maintenance factor
The lamp lumen maintenance factor LLMF takes into account the reduction of luminous flux due to the ageing of the
lamp. It signifies the ratio of the lamp lumens at a specific time and the new value. The current data provided by the
lamp manufacturers must be taken into account here.
Lumen maintenance curves
for various
Commercial light type OS
% Rated Lumen Output
Figure 5.1.5:
Burning Hours
243