1
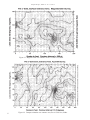
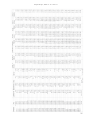
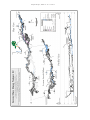
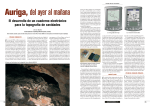
Compass & Tape, Volume 17 No. 1 Issue 57
Compass & Tape
Volume 17 Number 1 Issue 57
Newsletter of the Survey and
Cartography Section of the
National Speleological Society
1
Compass & Tape, Volume 17 No. 1 Issue 57
Survey and
Cartography Section
The Survey and Cartography Section (SACS) is an internal organization of the NSS that is devoted to improving the state of cave
documentation and survey, cave data archiving and management, and of all forms of cave cartography.
Membership: Membership in the Section is open to anyone who is interested in surveying and documenting caves, management and
archiving of cave data and in all forms of cave cartography. Membership in the National Speleological Society is not required.
Dues: Does are $4.00 per year and includes four issue of Compass & Tape. Four issues of the section publication are scheduled to be
published annually. However, if there are fewer, then all memberships will be extended to ensure that four issues are received. Dues can
be paid in advance for up to 3 years ($12.00). Checks should be made payable to “SACS” and sent to the Treasuer.
Compass & Tape: This is the Section’s quarterly publication and is mailed to all members. It is scheduled to be published on a quarterly
basis, but if insufficient material is available for an issue, the quarterly schedule may not be met. Compass & Tape includes articles
covering a wide range of topics, including equipment reviews, techniques, computer processing, mapping standards, artistic techniques,
all forms of cave cartography and publications of interest and appropriate material reprinted from national and international publications.
It is the primaly medium for conveying information and ideas within the U.S. cave mapping community. All members are strongly
encouraged to contribute material and to comment on published material.. Items for publication should be submitted to the Editor.
NSS Convention Session: SACS sponsors a Survey and Cartography session at each NSS Convention. Papers are presented on a
variety of topics of interest to the cave mapper and cartographer. Everyone is welcome and encouraged to present a paper at the
convention. Contact the Vice Chair for additional information about presenting a paper.
Annual Section Meeting: The Section holds its only formal meeting each year at the NSS Convention. Section business, including
election of officers, is done at the meeting.
Back Issues: SACS started in 1983 and copies of back issues of Compass & Tape are available. The cost is $1.00 each for 1-2 back
issues, $0.75 each for 3-6 back issues and $.50 each for more than six back issues at a time. Back issues can be ordered from the Treasurer.
Overseas Members: SACS welcomes members from foreign countries. The rate for all foreign members is US$4.00 per year and SACS
pays the cost of surface mailing of Compass & Tape. If you need air mail delivery, please inquire about rates. All checks MUST be
payable in US$ and drawn on a U.S. bank.
Chair:
Vice Chair
Carol Vesely
817 Wildrose Avenue
Monrovia, CA 91016-3022
(818) 357-6927
Nigel Dyson Hudson
10 Slators Lane
Newfield, NY 14867
(607) 564-7927
[email protected]
Secretary:
Robin Barber
4312 Winding Way
Fort Worth, TX 76126
[email protected]
Treasurer:
Bob Hoke
6304 Kaybro Street
Laurel, MD 20707
(301) 725-5877
[email protected]
Editor: Patricia Kambesis
Hoffman Environmental Research Institue
Western Kentucky University
Bowling Green, KY 42721
ph: 270-745-5201
[email protected]
2
Compass & Tape, Volume 17 No. 1 Issue 57
INSIDE
Call for Papers, 2005 NSS Convention.....................................................................4
The Effects of Lava on Compass Readings: Part II
by Dale J. Green................................................................................................5
Auriga, or Trading your Survey Notebook for a PDA
by Luc Le Blanc................................................................................................12
An Analysis of Systematic and Survey Errors or
Better surveying through Mathematics
by Dale Andreatta.............................................................................................16
ISSN: 1074-596
Front Cover: Julie Hudson setting stations
in Guess Cave, Alabama. Photo: Alan Cressler
Back Cover: Map of Maw Rang Naisaw #2
by Stan Allison. Blue-ribbon
in the Novice Section of 2003
NSS Cartographic Salon.
Permission to reprint material from Compass & Tape is granted
to grottos and other organizations of the NSS, provided that proper
credit is given. Others should request permission from the editor
or from the author or cartographers. The opinions and policies
stated in this publication are not neccesasily those of the NSS,
the Survey and Cartography Section or the Editor. Articles and
editorials, illustrations, photos, cartoons and maps published in
Compass & Tape are attributed to and copyrighted by the person
or persons whose bylines accompany the articles.
The editor reserves the right to select which of the submitted
materials will be used for publication. Of the material selected,
the editor reserves the right to delete redundant or inappropriate
material, to correct errors of spelling, grammer, or punctuation,
and to edit for clarity, so long as such alternations do not change
the meaning or intent of the author(s). In the event that significant changes are contemplated, the author(s) will be consulted
and given the opportunity to review the changes prior to publication.
Published in February 2005
by the Survey and Cartography Section of the
National Speleological Society.
Publishing Editor: Patricia Kambesis
Circulation Editor & Printing: Bob Hoke
SUBMISSIONS
All types of materials related to cave survey and survey data,
cartography, and cave documentation in general, are welcome for
publication in Compass & Tape. Manuscripts are accepted in
ANY form but are most welcome on 3.5 inch diskettes, CD’s
either IBM compatible or Mac format or via email. Typed material is next best although we will accept handwritten material as
long as it is legible. Artwork is any form. shape or size is also
welcome. Send all submission for Compass & Tape to:
Patricia Kambesis
Hoffman Environmental Research Institute
Dept. of Geography/Geology Western Kentucky University
Bowling Green, KY 42121
270-745-5201
Email: [email protected]
3
Compass & Tape, Volume 17 No. 1 Issue 57
2005 NSS Convention, Huntsville, Alabama
Survey and Cartography Section
CALL FOR PAPERS
This is a call for papers for the Survey and Cartography session at the 2005
NSS Convention. The session is informal and provides a good way to tell other
cave mappers what you are doing, and to discuss problems related to cave
surveying, data management and manipulation, and cartography. Most cave
surveyors have either devloped useful techniques that may benefit others or
are encountering problems that someone else may have solved. In either case,
an informal session presentation would be appropriate.
The session is informal and the audience is friendly. There are no requirements to provide fancy visual
aids or to provide a written paper (other than an abstract to be included in the Convention Program.)
Of course, the Compass & Tape editor would be glad to receive any written papers for publication.
Presentations can be on any topic related to any aspect of cave mapping, and the material presented
can be for any level of mapping/cartographic experience. A partial list of potential presentation topics
include:
•
•
•
•
•
•
•
•
•
•
•
•
Cave mapping applications of high-accuracy GPS and digital mapping technology
How to keep cave mud off your survey instruments
How to minimize instrument fogging
How to resolve blunders without another trip to the cave
How to set and maintain mapping standards in a project
Keeping track of survey data in a large project
Mapping standards (accuracy, symbols, etc)
New and improved computer programs for mapping (compare, describe, critique)
New tools and toys to aid in mapping or cartography
Representing complex vertical caves on a 2-dimensional map
Use of computers to draw cave maps (techniques, pros, cons)
Use of computers to interactively view cave maps (views, colors, rotation, perspective)
The above list is obviously incomplete. If you are doing something that you think would be of interest to
other cave surveyors, please consider doing a presentation on it. When you submit your abstract,
please let the session coordinator, Nigel Dyson Hudson, know what equipment you will need for your
presentation. You can assume that the ususal 35mm slide projector or computer projector will be
available, but don’t make any other assumptions.
Abstract deadline is April 15, 2005. Please send your abstracts either by email or snailmail to:
Nigel Dyson Hudson
10 Slators Lane
Newfield, NY 14867
[email protected]
4
Compass & Tape, Volume 17 No. 1 Issue 57
The Effects of Lava on Compass Readings: Part II
By Dale J. Green
4230 Sovereign Way
Salt Lake City, UT 84124-3138
[email protected]
In the last issue of Compass & Tape (Vol 16, No. 4, Issue 56) the author addressed the causes of
magnetic anomalies in lava tubes including: (1) A property of magnetic material called susceptibility
which causes magnetic lines-of-force to be diverted away from a void: (2) Magnetization of magnetite
from lightning strikes: (3) Minor magnetization when lava cools below the Curie temperature. Measurements of compass needle deflections internally and externally of lava tubes show that all readings
may be in error of a few degrees because of susceptibility effects and in some cases they may be over
10 degrees. Errors from magnetization by lightning strikes may cause needle deflections of 10s of
degrees. Fore- and back-sights cannot correct for erroneous readings caused by distortion of the
earth’s magnetic field. Part II of this series discusses field observations and surveys conducted by the
author.
Surveys at Pot o’ Gold Cave, Idaho
are at 200E, 20N-60N, which represents the entrance,
Pot o’ Gold Cave is the largest lava tube thus and at 0E-50E, 20N. Another magnetic low at 20E,
far surveyed in this investigation. More than any other 20N-40N, may be due to a large passage detected
cave measured, it demonstrates how lightning strikes by resistivity at this location, and a magnetometer surand magnetic induction can adversely affect compass vey to the west. It cannot be entered.
readings. Magnetometer and compass azimuth surIn addition to the two distinct lightning-strike
veys have been conducted on the surface over all of
the lava tubes investigated for this paper. They have anomalies on Figure 13, the contours over the rest of
not been presented because the information they con- the map show effects of smaller or older, faded strikes.
tain does not contribute much to understanding the These strikes do not appear in the cave directly beanomalies found inside the caves. However, the sur- neath their surface location. In all caves, lightning
face surveys for Pot o’ Gold Cave are presented here strikes found internally are located along the edges of
because they best illustrate an important discovery the tube. This makes sense, in that electrical currents
concerning large lava tubes that exhale air. For what take the least path of resistance, which would be along
ever reason, these caves appear to attract lightning moist walls rather than through air.
strikes. In each case of the four large lava tubes with
The contour map of Figure 14 demonstrates
air currents that have been surveyed, the area over
and around the entrance is peppered with magnetic an amazing variation of irregular compass bearings over
anomalies that have completely destroyed the signa- the area. Hardly anywhere on the map can you walk
ture of an underlying void, which is usually a distinct, more than 10 feet in any direction and still read the
linear magnetic low. Around lava tubes without air same bearing to a distant target with a magnetic comflow, lightning strikes are found to be distributed ran- pass. As bad as this condition is, the situation is worse
in some areas inside the cave.
domly and never at the entrance.
Vestiges of the magnetic anomaly caused by
the voids of Pot o’ Gold Cave beneath the surface,
Inside Pot o’ Gold Cave, a 200-foot centerline
was laid out from the gate to a convenient rock. Cross
tapes were then laid perpendicular to the centerline
5
Compass & Tape, Volume 17 No. 1 Issue 57
Figure 13. Magnetic field over entrance of Pot ‘o Gold Cave, Idaho.
6
Figure 14. Compass azimuths over entrance area, Pot ‘o Gold Cave, Idaho.
Compass & Tape, Volume 17 No. 1 Issue 57
Figure 15. Magnetic field strengths inside Pot o’ Gold Cave.
every 10 feet, starting at the 20-foot mark to avoid
the iron gate. Readings were taken every 5 feet along
the tape except at the walls where adjustments had to
be made because of physical constraints.
Two features on the magnetic field-strength
map stand out (Figure 15). First is the large anomaly
at the north end of Line 30W. Unfortunately, limitations in the plotting software don’t allow proper display of the anomaly. However, the field strength at the
north end of Line 50W, 20 feet away is 39,000 nt,
and the 30W anomaly strength is 58,000 nt, a difference of 19,000 nt. This is nearly 2 times the highest
anomaly that I have ever measured elsewhere. It may
even be larger, but extremely high gradients prevented
full measurements. Obviously, the cause is a lightning
strike. The second feature is the high concentration of
contour lines from the entrance to Line 90W. These
contours show a decrease of nearly 10,000 nt from
south to north, 20% of the earth’s magnetic field, that
cannot be simply explained. It is possible that a very
strong magnetic low exists to the north. A surface
resistivity survey has detected a large, near parallel
tube not far to the north but it is uncertain how this
would affect the magnetics here.
As expected, compass readings along transverse lines show great variation. The strong dips at
the north ends of lines 20W through 50W are to be
expected because of the anomaly. What happens with
Line 70W was completely unexpected and unexplained. A monotonic change of 27 degrees was measured in a traverse of 30 feet. Any station in this area
would have an appreciable error. Azimuth variations
in each line’s southern portion can be explained by
large breakdown blocks.
Transverse lines 110W through 190W are located over a relatively flat floor with occasional large
7
Compass & Tape, Volume 17 No. 1 Issue 57
breakdown blocks. The azimuths
along the lines have comparatively
small variations compared to the entrance area. Most of them decrease
in value from south to north, especially Line 190W. Bearings taken
at a station along this line near the
south wall would all read about 5
degrees more than bearings taken
at a station near the north wall.
Which reading is right? Would taking a bearing in the line’s center be
more correct, since its value is approximately the average of the other
two? Only a survey independent
of a magnetic compass would tell.
It may be that all readings are off.
On other lines, the dips and
rises in azimuth are mainly in areas
of breakdown, but the correlation
is not one to one. One dip should
Figure 16. Compass azimuths for Lines 20W thru 100W.
be mentioned on Line 160W at
35’N. On the approach to a large
block fallen from the ceiling, a sudden drop of 2.5O
was noted. Past the block, the readings resumed their The Gypsum Cave Anomaly
normal S-N decrease. Possibly this is direct proof of
how remanent magnetism in reoriented breakdown
The lava flow containing Gypsum Cave, the
blocks can distort compass readings.
longest lava tube in Idaho, comes from a vent over 10
As mentioned before, because magnetite conducts magnetic lines-of-force better than air, there is a
concentration of the field near lava tube walls. Because of Pot o’ Gold passage dimensions, it was possible to document how this concentration affects compass readings. Unfortunately, corresponding field
strengths close to the walls could not be obtained because of the high gradient. Note the south end of Lines
130W through 180W. In each case, as readings were
taken about 2 feet from the wall, then 5 feet from the
wall, the compass reading increases. The change
would probably have been much more had I held the
compass right at the wall. Corresponding readings
could not be taken at the north wall because of problems sighting on the station light.
8
miles away. It is therefore logical to assume that a
lava tube would exist upstream from Gypsum’s entrance. A magnetometer survey does, in fact, reveal a
very large void starting about 50 feet up flow from the
sink leading into the cave, as shown in Figure 18. This
is not just another anomaly - it is the largest in magnitude and width, and the best void-defining anomaly
that I have ever seen. It must represent a cavity of
considerable dimensions.
A resistivity survey was also conducted over
the magnetic anomaly to further define the dimensions.
Surprisingly, instead of delineating a huge resistivity
high, as would be expected over such a large void, the
result was a very low resistivity anomaly. Apparently
the cave floor is covered (or the cavity filled) with highly
conductive, wet salts, which effectively short-circuits
the resistivity prospecting current.
Compass & Tape, Volume 17 No. 1 Issue 57
A compass azimuth survey over
the anomaly yielded astonishing results
(Figure. 19). Not only was the main
magnetic anomaly large beyond any
expectations, but the compass bearing
deviations were large enough to easily
delineate the tube beneath the surface for
the entire 200 foot length of the magnetometer survey. Traversing Line 40N
gives a compass bearing change of 14
degrees in a distance of 80 feet! This
deviation is due entirely to magnetic induction, not lightning strikes or the compass needle being attracted to the magnetite. While the magnetic field and compass bearing deviations inside the cave
cannot be measured at this time, the surface survey can give an indication of what
would be expected if we were surveying
an entrance to a chamber with these dimensions.
Figure 17. Compass azimuths for Lines 110W to 190W.
Summary
Compass bearings can deviate from magnetic
north on lava fields because of:
Of these three causes, (b) creates the most
problems. Effects from magnetic induction (a) are
(a) Magnetic induction due to the susceptibility of found mostly in large lava tubes. Reorientation of
magnetite. This causes magnetic lines-of-force to breakdown (c) can occur in any size lava cave, but
go around voids in lava.
the effects are relatively minor.
Fore- and back-sights cannot correct for any
(b) Strong, permanent magnetic fields created by of the above causes of errors. They can correct for
lightning strikes. These can be very prevalent near misreading or misreporting of the compass, i.e., readlava tubes that exhale air currents. Internally, mag- ing 97O but reporting 79O, etc.
netic fields from strikes appear to be concentrated
along walls. Older lava flows show more effects Recommendations
of lightning strikes than younger lava flows do.
All members of a lava tube survey team should
(c) Reorientation of breakdown blocks that re- be aware of sources of compass bearing errors that
tained the earth’s original magnetic field when the can affect their mapping. The person doing book
lava cooled below the Curie temperature. Reori- should be alert to bearings that do not appear to fit the
ented large breakdown blocks affect the compass physical cave. Above all, the instrument reader should
more than small blocks do. Piles of small rocks do avoid taking readings next to walls. This last bit of
advice may seem impractical because the best station
not seem to affect readings.
9
Compass & Tape, Volume 17 No. 1 Issue 57
sites are often on walls. However, if the tape is held
taut, the compass can be read along the tape at a reasonable distance from the wall, say 4-5 feet. Clinometer readings are in no way affected by magnetic
anomalies.
Instead of fore- and back-sights, it is strongly
recommended that two readings be taken at each station spaced about 5 feet apart along the tape. This
serves not only to correct misreporting the bearing, it
also gives an immediate indication of the effect that
magnetic anomalies are having on the bearing. It is the
best way to determine if the station is near a lightning
strike anomaly. If this does not solve the problem,
move the station away from the strong anomaly if you
can. Also, a station located in a strong magnetic gradient may be made ‘virtual’ by fore-sighting to it from
the previous station, then back-sighting from the next
station. The virtual station is never actually occupied
by the compass. This works because high magnetic
gradients are uncommon and it is quite unlikely that
you will encounter two in a row. Fortunately, errors
due to magnetic susceptibilty appear to be fairly random, and cancel out to some degree. The same can
probably be said of reoriented breakdown blocks
.
Acknowledgments
Richard C. Fox, Practical Geophysics, Inc.,
Elko, Nevada, provided the magnetometer. Chris
Figure 18. Magnetic anomaly over presumed cavity up flow from Gypsum Cave.
10
Compass & Tape, Volume 17 No. 1 Issue 57
Figure 19. Compass azimuths over presumed cavity up flow from Gypsum Cave. Solid line is center of
magnetic anomaly (Fig. 19), dashed line is center of azimuth anomaly.
Anderson, Randy James, Mark James, and Ernie
Moss, members of the Silver Sage Grotto, Idaho Falls,
Idaho, assisted surveying the interior of Pot o’ Gold
Cave. Chris assisted in obtaining the permit. This
paper was inspired by a communication from Scott
Earl, Idaho Cave Survey, concerning wild compass
readings at lava tube entrances.
Reference
Briener, S., 1973, Applications Manual for Portable
Magnetometers. Geometrics, Sunnyvale, CA.
11
Compass & Tape, Volume 17 No. 1 Issue 57
Auriga, or Trading your
Survey Notebook for a PDA
By Luc Le Blanc
The Auriga software was initially developed in Germany to support
an electronic surveying instrument designed by Martin Melzer [1].
The software has subsequently been almost entirely rewritten by Luc
Le Blanc to become a general-purpose package for entering, storing, processing and viewing cave survey data on a Palm PDA (Personal Digital Assistant). In this revised and updated article originally featured in BCRA’s Compass Points, the author describes how
the software can be used at present, and possibilities for future development
In March 2002, before leaving for Mexpé,
our annual 3-week caving expedition in the Mexican
Sierra Negra, I realized that we would again be performing the required survey data conversions on our
programmable calculator with its antique text mode
interface. We could indeed run more sophisticated cave
survey software on a laptop computer, but the closest
village is a 3-hour walk away and does not even have
electricity. Solar recharging works fine in Mexico, although seven hours of bright sunlight are consumed in
2.5 hours of laptop use. Could a simple low-cost Palm
OS PDA, powered by two AAA batteries that last for
about a month, be a viable solution? After all, we had
already designed a spreadsheet to perform basic survey data conversions into XYZ coordinates on a Palm.
A few days before departure, Martin Melzer replied
to my enquiry posted on the Cavers’ Digest about the
existence of a Palm OS cave survey software… I left
for Mexico with Martin’s Auriga software in my Palm,
along with two sample caves.
Figure 1: Palm top running Auriga: the
cave map screen. Loop errors are
graphically displayed with a dotted line
between the actual and theoretical ends
of erroneous survey shots.
At the time Auriga was mostly meant to support
Martin’s sensor box prototype, but it nonetheless offered a good user interface to manually input survey
data and display the resulting line plot. Unfortunately,
computed coordinates were kept internally, Auriga
offering no list display of any sort. In order to start
plotting our maps while at camp, we needed these
coordinates. I submitted to Martin a long list of suggestions for improvement. Knowing words are cheap,
I also proposed help. Martin had already received
several information requests about Auriga, but this was
the first help offer. Since he had already stopped developing his prototype, he sent me his source code.
We had both taken a risk that turned into a successful
collaboration: the Auriga code base was healthy and
well-thought out, while I was willing to put the necessary time and energy into the adventure. And time and
energy it took. I decided to make Auriga as universal
I was immediately delighted with Auriga. It and user-friendly as can be - almost everything is now
was living proof of the feasibility of a field-oriented configurable, often with overridable defaults if applicave survey software on a Palm device. Working in cable:
real-time software development, I was well aware that
· naming format and auto-incrementation
even a 16 MHz CPU can do wonders with number
scheme of survey stations;
crunching, but in those times of bloated Operating
Systems and resource-hungry sloppy software, I pre· map units (length, angle, and slope 0 referviously had no idea where the Palm OS stood.
ence);
12
Compass & Tape, Volume 17 No. 1 Issue 57
· computation and display options;
· handling of reverse headings and slopes
(backsights);
· handling of passage dimensions;
· handling of unsaved data;
· handling of duplicate and incomplete shots;
· hardware button use.
ince our caving group did not have Martin’s
sensor box, still in prototype state up to this day, I
concentrated on the manual input side. But our need
was broader than Martin’s single input approach: we
had to survey a complex cave system with several simultaneous teams, possibly with different instruments
(e.g. metric tape in small passages and Topofil [2] in
collectors) using different measurement units (e.g. a
Topofil counting in centimetres) and bearing different
calibrations. Of course, we would have to merge all
this data once back at camp.
Mixing Instruments Thanks to Sessions
brations, measurement units, and some default settings
(see screenshots in Figure 2). The data read from the
instruments can then be input “as is” into Auriga; the
surveyor is not bothered by the broken beginning of
his tape, the magnetic deviation, or the compass shift,
since the session takes care of these. When computations are performed, Auriga simply uses the proper
session settings to interpret the survey data, without
altering it. In this respect, Auriga is as faithful as a paper notebook.
Tight Storage
Despite an effort to squeeze as much survey
information as possible into the meager 56 bytes used
for each survey shot record in the Auriga cave databases, limits are few. Length, heading, slopes, and reverse headings and slopes are each stored with twodecimal precision as 16-bit integers, i.e. in hundredths
of units. Survey shot length is thus “limited” to 635.55
meters (or feet, depending on user choice), an uncommon span in caves. In addition, a note of up to
255 characters can be appended to each survey shot,
to each session record, and to the cave database as a
whole. Auriga cave databases can currently hold up
to a maximum of 16 384 records (one per survey shot
or session).
The ability to mix heterogeneous data was
made possible with the addition of sessions, a concept often found in Windows/Mac OS cave survey
software. Each survey shot belongs to a session, i.e. Managing Passages
an abstract time period (its actual duration is left up to
the user) during which survey shots are taken. Each
Survey stations can be named with up to 8
survey session consists of two sets of instruments, cali- characters, with user control over the permitted char-
Figure 2: Session settings screens: calibrating instrument sets and shot settings.
13
Compass & Tape, Volume 17 No. 1 Issue 57
acter set (numeric, alphanumeric, punctuation, etc.)
The user can choose between a 4.4 format (e.g. “2.6”
or “A31.74”) and an 8-character free format (e.g.
“Cascade”, “X24-46b”). Both formats allow the use
of series, a concept inspired by Toporobot. A series is
simply a suite of survey stations and shots sharing a
common root (like “A2.0”, “A2.2” and “A2.31b”),
which can be acted upon collectively. As series are
usually, and appropriately, made equivalent to cave
passages, their use allows users to selectively hide
passages from a crowded line plot, distinctively color
them, exclude surface shots from total cave development, select the projection direction of a passage in
the projected cross-section line plot view, or just navigate between passages when reviewing survey shots.
The sole prerequisite for series is to have a “seriesbeginning survey shot”, i.e. a virtual survey shot linking the series-beginning virtual station to the rest of the
cave (or to itself, if it represents the cave entrance).
IR beaming is the common Palm OS deviceto-device data sharing mode. Auriga can send a whole
cave database, or a subset of it, to another device. In
the latter case, survey shot are nonetheless accompanied by corresponding sessions, so as to make the
beamed data complete by itself. If the cave database
does not already exist on the target device, it is created and filled with the beamed data. Otherwise, a
record-by-record merge process is triggered. Similar
but different survey shot or session records are duplicated and logged into a text memo for subsequent
clean-up by the user. Otherwise, if the beamed records
contain a note or passage dimensions and the target
device does not have this information, while the rest of
the record is the same, records on the target device
are simply updated with this additional information.
The HotSync process takes place on the target PC through a conduit launched by the Hotsync
Manager. This process of synchronizing the Auriga cave
The series beginning station must bear the databases with those present on the PC is a more comsmallest station number within the series (e.g. station plex process than IR beaming, for two reasons: it runs
2.3 cannot be the beginning station of series 2 if there between heterogeneous databases (Auriga and nonexists a physical station 2.1). Since series-beginning Auriga) and it is a bidirectional process (insertions,
shots are virtual (zero-length) shots, the unused shot deletions and modifications must be reflected on both
data storage space in their database record can in- sides).
stead hold a geographic location (like the UTM coorIt is highly unlikely that any PC cave survey
dinates of the cave entrance) or an absolute XYZ coordinate - a convenient feature when working with cave software would have its internal data format match
Auriga databases field for field. Some software recsubsets.
ognize series, some don’t; and the same goes for reverse measurements, mixed direct and reverse shots,
mixed measurement units, etc. Thus, in order to transSharing the Data
If several teams are let loose surveying a cave, fer the Auriga survey data to the desktop software,
conflicts are to be expected (…) with regard to sta- the conduit has to adapt this data to a format the tartion names or session numbers. To circumvent these, get software can understand. This can mean merging
Auriga offers various maintenance functions to rename the session calibration with shot data, removing seor shift station names or series numbers, renumber or ries-beginning virtual shots, inverting reverse shots to
merge sessions, or move survey shots to another ses- make them all forward, etc. In the process, some insion. Ideally, teams should harmonize their data be- formation could be lost if the data were to be later
fore merging it, in order to minimize tedious subse- resent to Auriga. To prevent this information loss, the
conduit performs a two-phase sync: the Auriga data
quent clean-ups.
received through the HotSync manager is first stored
Two mechanisms allow sharing survey data into a mirror database on the PC before being adapted
between teams: infrared (IR) beaming and the Palm for the target software. This way, if the survey data is
modified via the PC software, thus requiring a transfer
HotSync process.
back to Auriga (data consistency between the PC and
14
Compass & Tape, Volume 17 No. 1 Issue 57
the Palm must be maintained if further surveying with
Auriga is to take place in that cave), the conduit can
fetch from the mirror database the previously dropped
data and re-attach it back to the synced records before writing them into the Auriga database. Of course,
the extent of this data removal and recovery depends
on the target software, some being more restrictive
than others. And to support the multiple survey teams
mode, the Auriga conduit structure supports both the
usual single user mode and a multiple user mode where
several users can collectively sync their data with the
same cave database.
The current Auriga conduit, developed by
Chris Chénier, can export Auriga data as either Compass or Visual Topo files. Chris is now working on
implementing the import by Auriga of existing cave survey data from these same software; allowing the exchange of data between the Palm and the PC so one
can take advantage of both environments. The XMLbased data conversion grammar used by the Auriga
conduit makes it easy and quick to add support for
other cave survey software.
Surveying with Auriga
Auriga can be used as:
· an electronic notebook to input numeric
survey data and instantly view the line plot
while in the cave;
Figure 3: A combination binder for both numeric data
and sketching
inside the cover of a regular survey binder (see Figure
3). This option offers the convenience of inputting the
numeric data on the Palm side, and sketching the cave
on the paper side, in a survey notebook that retains its
usual thickness. Lastly, Armor makes, for US$ 49, a
watertight box with a write-through screen on the
cover; the box can be fitted with a homemade flap to
cover this screen between survey stations. Auriga is
designed so that you never have to take the Palm out
of the pouch or box while in the cave; and it was improved accordingly to ease data input, up to the point
where the usual stylus is not required anymore (Figure
4): a context-sensitive custom alphanumeric keypad
· a scientific calculator to convert survey shots
into Cartesian coordinates while at camp;
· an input device to transfer survey data from
the paper notebook to the PC without
wasting battery power.
The most common use for Auriga is to input
survey data while in the cave. But what about carrying
a Palm in this muddy, wet and often cold environment?
Once you accept that you must treat the Palm with
proper care, it is no problem. In easier caves, wrapping the Palm in a Ziploc bag and carrying it inside the
survey notebook (still required for sketching) may be
sufficient. Alternatively, Aquacase makes, for US$ 30, Figure 4: Using Auriga to input survey
data underground.
a watertight write-through pouch that can be screwed
15
Compass & Tape, Volume 17 No. 1 Issue 57
Figure 5: Field data and keypad screens.
with finger-tappable keys was developed for survey
data input and navigation between fields (see Figure
5).
A configurable input Assistant (Figure 5) fur- 5.
ther increases the user-friendliness of the whole input
process by automatically creating survey shots based 6.
on the previous one, auto-incrementing station names
(with both digits and letters), popping-up the custom
keypad when necessary, preventing mishaps that could
result in data loss and even turning off the device after
the shot was saved. Combined with the use of the
hardware application buttons, Auriga really lets your
fingers do the tapping!
numeric keypad changes to an alphabetic layout
to edit the survey shot note;
Edit the note and finger-tap the OK button;
Hit the To Do hardware button to save the survey shot;
a. the line plot gets updated and displayed;
b.tap on the Calculator button in the silkscreen
area to return to the Survey Shot form
A typical fully assisted data input sequence
goes like this:
1.
Start the Assistant mode by tapping its pushbutton
in the Survey Shot form;
2.
Create a new survey shot with the To Do hardware button,
a. the custom numeric keypad pops up;
3.
Finger-tap in the survey data, changing fields with
the arrow keys;
4.
When the last numeric field is input, the custom
16
Figure 6: Input Assistant configuration screen.
Compass & Tape, Volume 17 No. 1 Issue 57
7.
Tap the To Do hardware button to create a new
survey shot;
a. a new survey shot gets created with
incremented station numbers,
b. the custom numeric keypad pops up,
c. the Palm turns itself off (turn it back on again
when ready to input the next shot by hitting
the Address Book button).
Computing the Cave
Auriga automatically performs all the computations required to display the line plot and essential
statistics (Figure 7). In order to handle every possible
survey shot arrangement (like leap-frogging or multiple shots leaving from or arriving at a station) and to
pave the way for the upcoming loop closure algorithm,
a full-blown undirected graph is now internally constructed to represent survey stations (nodes) and survey shots (vertices) between them. An iterative algorithm scans in alternating directions the list of survey
shots in the cave database to compute XYZ Cartesian station locations relative to the origin.
Any station can be manually selected as the
Cartesian origin (0,0,0) of the cave, or as a location
with a user-defined fixed offset from this absolute origin. If the cave does not have a determined origin, the
computation process chooses the first survey station
(sorted in alphanumeric order) as the origin and assumes a null offset. It is thus possible to assign a predetermined XYZ coordinate to a station (presumably
computed somewhere else), thus allowing the computation of “real” coordinates from a cave data subset
that does not include the cave origin.
Likewise, any station involved in a zero-length
survey shot (series beginning or virtual shot) to which
a geographic position is assigned (UTM or latitudelongitude, with or without altitude) can be manually
selected as the geographic reference for the cave. The
geographic location of any other survey station displayed in the line plot can then be queried for its geographic location. Conversely, the geographic position
Figure 7: Survey statistics summary screen.
of surface features like sinkholes or resurgences can
be stored into virtual shots looping onto themselves
for display in the line plot; this allows viewing where
the caves heads to relative to these points of interest.
Viewing the Cave
The line plot display offers top and S-N, WE, developed and projected cross-section views of
the cave, with full pan and zoom capability and the
ability to graphically poke stations (and see the corresponding survey shot note and station coordinates).
Hardware buttons can be used to navigate between
shots and passages or pan and zoom the view. Additionally, all survey stations linked to another station
(once selected with the stylus) can be cycled through
with the push of a hardware button. But the most interesting new feature is probably the ability to get the
orientation of a passage, the inclination of a slope, or
the distance between two points by dragging a line
with the stylus. Orientation angles obtained through
this feature are automatically copied to the clipboard
to allow quick pasting into the projection angle selection dialog for use by the projected cross-section view.
The line plot is probably the most compelling
feature to use Auriga underground: surveying with
Auriga allows cavers to see what the cave looks like
and where it heads to right as it is being surveyed. Not
only can survey errors be detected faster, but it can
orient the exploration process: by knowing right away
17
Compass & Tape, Volume 17 No. 1 Issue 57
where passages head to, surveyors can decide which
lead to survey in priority. If a connection is expected,
Auriga can let cavers know immediately how close
they are from the other passage and eventually keep
hope… Actually, Auriga could become an incentive to
survey while exploring, a good practice in every respect! And, thanks to Markus Dresch/PalmSide’s
XPrint Library, granted free right of use to Auriga, the
line plot can now be sent, right from the Palm, to various PCL, ESC or Postscript-enabled printers via the
built-in serial, infrared or Bluetooth link.
Auriga also offers spreadsheet-like displays
of survey shots and survey station coordinates, to provide surveyors with the coordinate data required to
draw their cave maps on paper while at camp. These Figure 8: Poking the Line plot display to obtain dislists are also printable.
tance and angular information.
What’s Next?
The display of passage widths is currently in
the works, as well as loop closure and the introduction of the cave system concept, where several
caves can be logically linked and geographically
positioned on a common display.
Other minor improvements include theodolite and depth meter logic (to handle cave diving
survey data), and better statistics. Of course, the
recent presentation at the 2004 NSS Convention
may prompt unforeseen new demands.
Meanwhile, the rising activity in the field of
electronic data acquisition may well push Auriga into
looping the loop by reactivating its serial link with sensor boxes. This would give Auriga an additional boost:
the prospect of affordable electronic cave surveying
may well become irresistible. In his article in the December issue of the BCRA’s CREG journal [3], Martin Melzer considers the options for building such an
electronic surveying instrument, and mentions True
North Technology’s compass/clinometer module [4]
as the best commercially available hardware option to
date. Thanks to Nigel Dyson-Hudson, who generously
lent me his own module, I will experiment with it in the
hope of supporting it in Auriga.
18
The ultimate future addition to Auriga will be
the ability to sketch the cave walls and details directly
onto the Palm screen using vector graphics. This may
sound like a heresy to purists, but a full screen of drawing space for every single survey shot on a grid displaying that shot, in scale with the surveyor’s own visual perception, would possibly lead to better sketches.
This feature would definitely render the paper notebook useless, while allowing cavers to come back to
the surface with an almost finished cave map. But the
complexities of this feature, with regards to curve handling, storage and conduit syncing could be the topic
of an article by itself.
Trying Auriga
The Auriga Palm software and PC conduit can
be freely downloaded from the Auriga homepage [5]
along with sample caves, embedded help and a 40page user manual. Do read the manual at least once.
Auriga is not complicated, t complex; the manual should
give you a good understanding of the underlying concepts and may help you discover features that are not
immediately obvious in the user interface.
Compass & Tape, Volume 17 No. 1 Issue 57
If you do not have access to a Palm OS device, you can nonetheless try the software under a free
Windows-based emulator. Get the details on the Auriga homepage [5].
[2] A Topofil is a device using a thread rolling onto a
drum connected to a length counter. Models made for
cave surveying also feature an embedded compass
and a protractor to measure the slope.
Luc Le Blanc is president of the Société québécoise [3] Melzer, Martin. (2003). How to design an elecde spéléologie.
tronic surveying instrument, Cave Radio and Electronics Group Journal, 54, 12-15. Available through
Martin Melzer,s Web site: www.melzer.ch
References
[4] True North Technology’s compass/clinometer
Revolution module: www.tntc.com/Products/
[1] Home page of the original Auriga project: revolution.htm
home.nikocity.de/andymon/hfg/auriga4.htm
[5] Auriga home page: www.speleo.qc.ca/auriga
19
Compass & Tape, Volume 17 No. 1 Issue 57
An Analysis of Systematic and Random Surveying Errors
or
Better Surveying Through Mathematics
by Dale Andreatta
Questions to be answered:
1. What are the relative magnitudes of the 3 common types of survey errors, random readability
errors, blunders, and instrument offset?
2. Given the results of #1, can we improve our surveying, either in accuracy or in speed?
Random readability errors are caused by human limitations when dealing with instruments. These
errors are usually small, and have an equal probability
of being in one direction vs. the other. User bias, which
is the intentional or unintentional tendency for the second instrument reader to echo the readings of the first
instrument reader could be included in random error
since there would be an equal likelihood of being off in
one direction vs. the other.
ability of getting that reading. The horizontal axis indicates the deviation from the true reading. The careful
surveyors get readings that are not exactly the true
reading, but are closely clustered around it. They are
almost always within 1o of the true reading. The sloppy
surveyors are also clustered around the true reading,
but not as tightly. Tlhey have maybe a 50% change of
being within 1o of the true reading, but a 50% change
of being more than 1o off. A significant fraction of the
time there are more than 2o off.
Systematic errors are repeating errors caused
by small defects in the equipment, and are the same
One way of quantifying the wide of the statisfor every instrument.
tical curve (or the sloppiness of the surveyors) is the
“expected error.” The expected error is the level of
Blunders are major errors coming from such error within which 50% of the measurements will fall.
things as transposing digits, misrecording the data in For the sloppy surveyors shown above, the expected
the survey book, switching the %-grade and degrees error is about 1o . In all calculations regarding random
on the ‘clino, reading the compass backwards, and errors, I will assume the surveyors are slopped with
others. These errors are somewhat random, though an expected error of 1o .
they don’t fall into any kind of pattern the way readability errors would tend to do.
Another way of quantifying the width of a
curve or the sloppiness of the surveying is the stanClassical Statistical Analysis
dard deviation. For a normal distributuion, there is a
fixed relatinship between the expected error and the
Situations like this are covered in the field standard deviation. The standard deviation is 1.48
called statistics. It is assumed that for the random times the expected error.
readability errors, the errors are distributed “normally”.
Suppose a passage is 2318 feet long in 50
Normal or Gaussian distributions are illustrated equal shots. (Later we will look at 50 shots of real
in Figure 1. The height of the line indicates the prob- cave data with a total length of 2318 feet, that’s why
20
Compass & Tape, Volume 17 No. 1 Issue 57
Experienced surveyors with
whom I have communciated
have suggested that instrument
offsets are on the order of 1o .
An instrument offset of 1.0o will
continue to propagate and the error at the end is simply sin(1o)
times the length of the passsage.
This will be 1.75% of the length
of the passage. For a 2318 foot
long passage the error will be 40
feet. If the isntrument error is 1/
2o the error is 20 feet.
Figure 1: Normal distributuions
the odd number here). Assume the are all in the same
line to make this easy to visualize. The true path is
represented in Figure 2 by the straight line. If the surveyors are perfect, but the instrument is off by a certain aount, the surveyed path will also be a straight lin
but will differ from the real path by a certain angle.
This does not depend on the number of shots or the
length of the individual shots.
If the instrument is perfect but the surveyors
are imperfect, the measured path will zig-zag around
the true path, sometimes above, sometimes below. At
the last survey station there will be some error.
If the random readability errors are “normally distributed” as
described above, certain relationships exist among the probabilities of various level
of error. If there is a 50% change that the error in a
single shot is less than 1o, there is a 75% chance that
it is less than 1.7o and 90% that is is less than 2.4o.
This level of error might correspond to a fairly sloppy
survey, where foresight and backsight usually agree
within 2o, sometimes more, sometimes less, with the
true reading being the average of the two readings.
If there are n shots, the random errors will
tend to cancel, since it is highly unlikely that all the
errors will be off in the same direction. The more
shots there are, the greater the tendency for the errors
to cancel. If there are n shots, all of the same length,
the probabilities for the average error over
those n shots are reduced by a factor of1:
error in n shots = 1/Ön times error in 1 shot
If, for example n is 50, there is a 50%
change that the average error will be
within 1/Ö50 times 1o which is 0.14o ,
very much better than with a single shot.
There is a 75% chance that the average
error will be within 0.24o , and a 90%
chance that the average error will be
within 0.34o . Table 1 summarizes the
likely errors for a number of shots, asFigure 2 Survey paths
21
Compass & Tape, Volume 17 No. 1 Issue 57
Table 1. SLummary of expected errors
feet. If the blunder is 10o , the error is sin (10o) times
46 feet or 8 feet. This is somewhat more than the random error, but still less than even the small instrument
For the case where you have a 2318-foot error. Obviously if there are multiple blunders, or single
passage in 50 shots, with the sloppy surveying de- large blunders, or ongoing mistakes, such as reading
scribed above, at the end of 50 shots your average %-grade instead of the slope in degrees, these errors
error is 50% likely to be within 0.140. The error in will not be small. A single blunder of small magnitude
height would be 2318 * sin(0.140) = 5.66 feet, much doesn’t wipe out an otherwise good survey.
smaller than the 20 feet of error one gets with even 1/
2o of instrument offset.
Real Survey Data
The more points the higher the accuracy, however, you have to have a large increase in the number
The above has assumed that all shots are equal
of points to have much effect. One caver I know al- in length and in the same line. What if they are not?
lows no shots longer than 50 feet. Adding a few more To study this problem, survey data from an actual cave
shots probably doesn’t help the accuracy much, es- survey was used. This was 50 shots of data from the
pecially since random error is so small compared to main passage at Redmond Creek Cave in southern
instrument offset. There may be other considerations Kentucky. This was put into a spreadsheet, which is
which say not to allow shots longer than 50 feet. One included in Appendix II. The raw cave data is in the
might want to have more cross sections, and longer left 5 columns. The cave goes generally south from
shots tend to leave the sketcher falling behind
the entrance, dropping about 30 feet and then rising
again such that is 16.66 feet above the entrance after
One might think that if the instrument offset is 50 shots.
less than the readability of the instrument, then the offset must be negligible and shouldn’t be worried about.
In the error column of the spreadsheet a set of
The above numbers say that this is not true. One might errors was assigned. This is a set of 50 numbers with
also wonder how to correct for instrument offset to an an approximately normal distribution, an average of 0
accuracy better than the readability of the instrument. and a standard deviation of about 1.48o. (actually
A technique will be presented in Appendix 1 for doing 1.52). These are typical random errors with an exthis.
pected error of about 1o. Note that there are 8 times
out of the 50 readings when the error is larger than 2o,
Blunders
which implies that foresight and backsight would differ by more than 2o.
The effect of a single blunder is the sine of the
blunder angle times the length of the shot. With 2318
The errors were put in a random arrangement
feet in 50 shots the average shot length is about 46 by writing all 50 numbers on slips of papers and drawing them out of a pile. The true z (vertical)
22
suming that there is a 50% change of a single shot
being within 1o .
Compass & Tape, Volume 17 No. 1 Issue 57
measurements can be found in the True Z column without taking the errors into account. The Error Z column is the same calculations with the random error
included. The difference between these numbers is in
the Difference column and is the effect of the errors
The bottom number in the Difference Column is the
final error after 50 shots.
When there are 5 data points, the factor is
0.4299, giving the estimate of the standard deviation
as 0.4299*9.4= 4.04 feet. The expected error is
1/1.48 times this or 2.73 feet based on these tests.
The horizontal errors are generally larger than
the vertical errors, but not be a large factor. The largest horizontal error in the table above was 9.6 feet.
Similarly, one can tally up the north-south and This is again very small compared to the error from
east-west locations of the survey points, with and with- instrument offset.
out the random errors, and these are in the 10th through
13th columns. One can calculate a total horizontal Conclusions
error which is in the right column. Again, the bottom
The conclusions I draw from this work are:
number is the error after 50 shots.
The random error column was rearranged 4 1.
times by putting the top number on the bottom and
moving all numbers up. This gives 5 different sets of
random numbers. The final errors for each configura- 2.
tion can again be calculated, and the errors are summarized in Table 2.
The bottom row of numbers in Table 2 is for
the set of numbers currently in the spreadsheet in Appendix II.
Assuming there are no major blunders, the largest source of error is instrument error.
The overall effect of random error is consistently
small, provided there are a reasonably large number of survey points (10 or more). This true even
if the surveying is pretty sloppy.
3.
Even a small instrument error has much larger effect than random readability errors.
The range of final numbers for z was -6.9 to 4.
+2.5, a range of 9.4. One method for estimating standard deviation is to use the range of data and the number of points2. The standard deviation is thus a “factor” times the range and the factor is based on the
number of data points. The factor is smaller if the 5.
number of data points is larger. This method is recommended for 20 data points or fewer.
The best ways to improve or maintain good quality
survey data are to correlate or calibrate the instruments used, and of course to avoid major
blunders.
Meticulous matching of foresight and backsight
readings beyond that necessary to catch blunders
is not worthwhile. More work does not mean
better results.
Table 2. Errors due to random error
23
Compass & Tape, Volume 17 No. 1 Issue 57
reading is shy of 0.5o, in a real survey you would
Appendix I: A method of calibrating instruments probably just call it 0.5. When calculating the
instrument you should call it 0.4 or whatever you
Some methods are proposed here (not yet tested) for think is appropriate.
calibrating instruments. These method depends on
whether or not a compass course is available with If a survey course is available
“true” readings known.
Use each instrument on the course about 10
One option is always to simply use the same set of times in the same direction, preferably using different
instruments for the entire survey. The cave map may people. As described above, don’t try to hard to
be rotated slightly with respect to the true orientation, get the best reading. The average of these 10
but the entire cave will be rotated the same amount. measurements is the reading for that instrument. The
Obviously, this is not practical in large survey projects. difference between this reading and the known true
A ‘clino can be calibrated against true vertical reading is the instrument offset, and it can be added
by measuring horizontally out from a wall and verti- to the in-cave survey data. One can use the above
cally up from the floor. Clearly you don’t want to do techniques for both compass and ‘clino.
this in a sagging old bar, and even in a new building the
floor should be checked with a level. The true angle If such a course is not available
would be the arctangent of the vertical measurement
Use the techniques above to calibrate all
divided by the horizontal measurement. This could be
compared to the ‘clino reading to give an accurate inclinometers. The, one compass would be chosen
as the “master compass”. Somewhere, perhaps
‘clino correction.
outside the cave entrance, a FROM point and a
Another way to do this would be to measure
distant TO point would be chosen. The FROM
up from the floor a certain amount at both ends of a
point might be a tree, and the TO point might be a
hallway to give the “from” and “to” points. The
distant power pole. Obviously the FROM point
‘clino should read 0 The advantage of this is that
should be well away from magnetic fields and metal
you may have some unintentional tendency to read
objects, and both points should be points that will be
the ‘clino as 0o since this is what you are expecting.
around for a while. The above procedure with 10
Another method might be to use 2 points on readings would be used, and the average recorded.
the same level, using a string and a line level to
confirm that they are indeed on the same level.
When doing the ‘clino readings a number of
readings should be taken and averaged. Statistical
techniques can be used to determine the number of
readings needed to get a good average. I recommend at least 10 readings. The instrument should be
read as precisely as possible. For example, if the
24
In the future, if any other compasses were
used, they would be run through the same test with
10 readings of that instrument. The difference
between this average and the average from the
master instrument would be the offset for the new
instrument. This technique might give a cave map
that was rotated from its true orientation, but it
should all be rotated by the same amount.
Compass & Tape, Volume 17 No. 1 Issue 57
25
Compass & Tape, Volume 17 No. 1 Issue 57
26