1
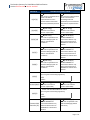
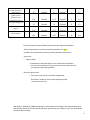
DATA SCORING
The following table (Table [x]) details how tasks were scored, errors
evaluated, and the time data analyzed.10
Measures
Rationale and Scoring
Effectiveness:
Task Success
A task was counted as a “Success” if the participant was able to achieve
the correct outcome, without assistance, within the time allotted on a
per task basis.
The total number of successes were calculated for each task and then
divided by the total number of times that task was attempted. The
results are provided as a percentage.
Task times were recorded for successes. Observed task times divided
by the optimal time for each task is a measure of optimal efficiency.
Effectiveness:
Task Failures
Optimal task performance time, as benchmarked by expert performance
under realistic conditions, is recorded when constructing tasks. Target
task times used for task times in the Moderator’s Guide must be
operationally defined by taking multiple measures of optimal
performance and multiplying by some factor [e.g., 1.25] that allows
some time buffer because the participants are presumably not trained to
expert performance. Thus, if expert, optimal performance on a task
was [x] seconds then allotted task time performance was [x * 1.25]
seconds. This ratio should be aggregated across tasks and reported with
mean and variance scores.
If the participant abandoned the task, did not reach the correct answer
or performed it incorrectly, or reached the end of the allotted time
before successful completion, the task was counted as an “Failures.”
No task times were taken for errors.
The total number of errors was calculated for each task and then
divided by the total number of times that task was attempted. Not all
deviations would be counted as errors.11 This should also be expressed
as the mean number of failed tasks per participant
Efficiency:
Task Deviations
On a qualitative level, an enumeration of errors and error types should
be collected.
The participant’s path (i.e., steps) through the application was recorded.
Deviations occur if the participant, for example, went to a wrong
screen, clicked on an incorrect menu item, followed an incorrect link,
or interacted incorrectly with an on-screen control. This path was
compared to the optimal path. The number of steps in the observed path
is divided by the number of optimal steps to provide a ratio of path
deviation.
_________________________________________
10 An
excellent resource is Tullis, T. & Albert, W. (2008). Measuring the User Experience. Burlington, MA:
Morgan Kaufman. Also see www.measuringusability.com
11 Errors have to be operationally defined by the test team prior to testing.
13