1
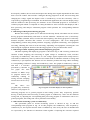
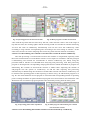
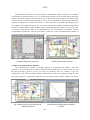
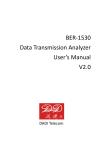
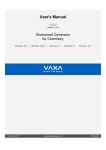
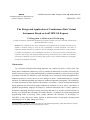
MATCH Commun. Math. Comput. Chem. 60 (2008) 325-331
MATCH
Communications in Mathematical
and in Computer Chemistry
ISSN 0340 - 6253
The Design and Application of Conductance Rate Virtual
Instrument Based on LabVIEW 8.0 Express
LI Jiang-yuan , LI Yuan-wen, GUO De-peng
(College of Chemistry and Chemical Engineering, China West Normal University, Nanchong 637002,China)
(Received December 17, 2007)
Abstract: The conductance rate Virtual Instrument is developed based on LabVIEW 8.0 Express and
applied to multitask testing by using the easy expandability of Virtual Instrument. The result of
application indicates that this test system not only has advantages of friendly interface, easily operating,
a computer for multipurpose, easy expandability of function, etc; but also has function of real-time data
acquisition, data storage, data display and data processing; avoids personal error of data record and data
processing by handwork in process of testing, improves the veracity and the automaticity and expands
the function of traditional instrument.
1 Instruction
As a common electrochemical testing apparatus, the conductivity meter is widely used. The
testing data of traditional conductivity meter is obtained by handwork or recorder. Obviously, the
analysis and processing of testing data obtained by traditional conductivity meter can only be done
by manual work and it is difficult to avoid man-made error, which may restrict the application of
conductivity meter in a sense (Wu et al, 1998; Wang et al, 2001). Virtual Instrument (VI) expands
functions of traditional apparatus and improves traditional apparatus intelligently. The technology
of virtual instrument not only improves the functions of real-time, veracity and automatization of
testing apparatus, but also realizes single computer for multitask (Liu et al, 2005). LabVIEW is a
graphical programming language developed by National Instruments and is widely applied in
instrument controlling, automatic testing, processing data and et al. It is the excellent software to
develop VI. LabVIEW has advantages of friendly interface, vivid panel of Virtual Instrument and
programming mode of flowing, which greatly enhances the efficiency of developing VI.
LabVIEW is more and more widely applied in different fields of instrument measuring and
controlling (Lei et al, 2004; Zhang et al, 1998).
Correspondence: Li Jiangyuan, College of Chemistry and Chemical Engineering, China West Normal University,
Nanchong 637002,P.R.China; E-mail: [email protected]
- 326 The research about conductivity meter connected to computer has been reported in recent
years (Kang et al, 2002; Kuang et al, 2004), but the software is mostly developed in text-based
programming language (for example: C, Turbo Pascal, VB and so on). The text-based language
has disadvantage of long developing periods, difficult maintenance and difficultly expanding. The
VI of conductivity meter based on LabVIEW has not been reported yet. The VI of conductivity
meter developed by authors is developed in graphical programming language—LabVIEW 8.0
Express which not only has advantages of easy expandability, friendly interface, easy operation, et
al, but also realizes the multitask measuring real-time. The result is satisfying.
2 Structure of testing system
The diagram of test system is showed in Fig. 1. The system consists of hardware and software
in general. The hardware deals the amplification, filtering, acquiring and display of analog signal.
As the central part of VI, the software realizes the driving of DAQ board, data display real-time,
designing of VI panel, analysis and processing of data, generation of result report and so on.
Conductivity meter
Adjusting circuit
DAQ board
Computer
LabVIEW
Fig. 1 The structure diagram of the system
Conductivity meter: The type of conductivity meter is D307 which has function of output
of direct analog signal. The direct analog signal which expresses the value of conductivity is
automatically acquired by computer with the DAQ board after being pretreated by adjusting
circuit. The other conductivity meter which has function of direct signal output can be acceptable
as well.
Adjusting circuit: The adjusting circuit consists of differential amplifier which is mainly
made of a low drift operational amplifier—Op07 and first order active filter which is mainly made
of a high gain operational amplifier—CA741. And they jointly realize the analog signal
amplification and filter which could make the gain value reach as high as possible but not exceed
the input range of DAQ board. Thus, not only the precision and accuracy of testing is enhanced,
but also the data of testing can be not lost.
DAQ board: DAQ board PCI2005 is produced by Beijing Art Science and Technology
Development Corp. Ltd. And it is a 16 bits A/D analog/digital converter based on PCI bus. It can
acquire the data through 16 single channels or 8 double channels. It has an input resistance of
100MΩ, a sampling frequency of 200KHz and a range of analog input of ±10V. Inserting DAQ
board into built-in PCI plug of computer and calling the corresponding driving program, the
real-time data acquisition is obtained with LabVIEW programming. For the other type DAQ board,
the data acquisition can be realized by the same way plus a corresponding driving program.
Computer: it has an available PCI plugs, 256M memory or more, 220M hard disk or more,
486/DX or more advanced CPU, 600×800 or more resolution. The general computer is acceptable.
3 The design and realization of LabVIEW 8.0 Express
In accordance with the practical application of conductivity and configuration of VI
- 327 developed by authors, the VI tracks and acquires the analog direct signal outputted from the outlet
that is used to connect with recorder. Calling the driving program to do the A/D converting and
changing the voltage signal into digital value of conductivity, at last the real-timely value is
expressed by programming of LabVIEW. For the different application, the real-time display image
and the method of data processing are different. So the LabVIEW program of VI includes a
common program which is composed of a DAQ board driver and a real-time data displayer and a
data processing and analysis LabVIEW program which performs the corresponding different
testing task.
3.1 The design of DAQ board driving program
Because this testing system uses a domestic-made DAQ board, LabVIEW can not call the
driving program automatically and needs to call the Function >Advanced>>CLF (Call Library
Function Node) (National, 2003) to realize the data acquiring. The driving program is realized by
Stacked Sequence Structure that consists of seven subprograms. The seven subprograms
independently perform DAQ board parameter assigning, equipment initializing, A/D equipment
activating, obtaining the result of A/D converting, adjourning A/D equipment, releasing the A/D
and closing the equipment. Details of this driving program are not provided in this article.
3.2 The design of data acquiring and real-time displaying program
The data acquiring and displaying program is showed in Fig. 2 and it mainly performs the
function of data acquiring, the converting of signal voltage to conductivity value, real-time
expressing of conductivity value and so on. The voltage signal acquired from DAQ board is
converted to conductivity value by function of Formula Node in which the relation of voltage and
conductivity is pre-adjusted. The function of Case Structure performs the range choice matching
to corresponding relation of voltage and conductivity value. The graph of conductivity value Gt
and time t is real-time
presented by function of
XY graph. The outer
structure of While Loop
of program ensures the
continually running of
testing and the sampling
interval also can be set by
users.
The
above
two
Fig. 2 Program of real-time display of data acquisition
program (they are directly
called as sub-program in
following program) act as general program in this testing system. They respectively perform
driving of DAQ board and converting of analog signal to conductivity value. For the different
testing task, by adjusting the corresponding data processing program of LabVIEW to above two
general programs, the testing task can be performed conveniently.
3.3 The on-line measuring system of conductivity
The operational panel of on-line measuring system is showed in Fig. 3a and the
corresponding block program in Fig. 3b. In this program, the conductivity value acquired by
conductivity VI, the top limit and low limit of conductivity value set by the user are bundled and
are expressed by the function of Waveform Chart together. Comparing the real-time acquired
- 328 -
Fig. 3a Operating panel of on-line measurement
Fig. 3b Block program of on-line measurement
value with the top limit and low limit set by the user, if the real-time value is out of the range of
top and low limit, the warning lighter and the warning sound are switched on and the measuring
VI saves the value of conductivity automatically. This VI also saves the conductivity value
exceeding a range and the corresponding time according to the user setting in advance. At the
same time, the user can set the sampling interval for long time real-time measure continually.
3.4 The VI of determining rate constant of second-order reaction in electric conductivity
The data processing of second-order reaction rate constant is complicated, especially when
the initial concentrations of two different reactors are not equal. In accordance with the principle
of determining rate constant for second-order in electric conductivity (Fu, 2004), using the
powerful build-in function of LabVIEW data analyzing and processing, each data processing
program is developed into corresponding sub-program based on which the module of program for
determining the constant of second-order reaction is further built. Importing the module of
sub-program into the system of conductivity VI and the data acquiring and processing
automatically for determining the constant of second-order reaction with electric conductivity can
be realized. The operating panel of data acquiring is shown in Fig. 4a and the host program is in
Fig. 4b. The Event Structure of host program is associated with corresponding button of operating
panel. Clicking the button on panel and the host program will call correlative Event Structure. The
While Structure of outermost program performs the continually running until the testing ends.
Fig. 4a Operating panel of data acquisition
Fig. 4b Main program of determining rate constant
of second-order reaction
3.5 The VI for determining dissociation constant of weak monoacid by conductivity
- 329 The dissociation constant of weak monoacid is obtained by testing conductivity of different
concentration weak acid solution. As to a concentration solution, the VI system should determine
whether the testing completes and inform the user to change the testing sample. The testing panel
is shown in Fig. 5a and the block program is in Fig. 5b. The methods of determining whether the
testing has completed is to detect five times in a time interval to a concentration sample; and if
every RSD is not higher than 0.01%, the VI system will take the testing as completed and inform
the user to change testing sample with the light of change sample. The mean of five testing value
is saved as final testing value in file automatically. The concentration of solution and the
corresponding conductivity value are processed by linear fit. At last, the dissociation constant of
weak monoacid is determined by the slope of line.
Fig. 5a Operating panel of determining dissociation
Fig. 5b Block program of determining dissociation
constant of monoatomic weak acid
constant of monoatomic weak acid
3.6 The VI of conductometric titration
The conductometric titration is broadly applied in electrochemical analysis. The host
program of VI of conductometric titration based on the VI conductivity is shown in Fig. 6a, and
the data processing panel is in Fig. 6b. The two temporary files are created to save the
conductivity value and the titration volume automatically in the host program. During the data
processing, the user is informed to input the ratio of titration matter and the matter to be tested.
Fig. 6a Main program of operating panel of
Fig. 6b Data processing panel of conductivity
conductivity titration
titration
Then the volume of end point and the concentration of tested matter are obtained automatically.
- 330 4 The results of application and discussion
The VI of conductivity is applied in the detection for simulation of moving water. The
real-time conductivity value and time is shown in Fig. 3a. When the testing value is out of the
range set by the user, the conductivity value and the corresponding time will be recorded and the
system will give an alarm automatically. Obviously the VI system also can be applied to the water
detection of industrial and environmental occasion. VI stores the conductivity and time in the
format of text or binary system, which is convenient for the user to further process the data.
The VI system is applied in testing the rate constant of second-order reaction. When the
temperature is 298℃, the concentration of NaOH is 0.0104mol·dm-3 and CH3CH2OOCH2CH3 is
0.0092mol·dm-3, the conductivity and time are shown in Fig. 4a. The testing data is processed by
the built-in program and the constant of second-order reaction is 6.944mol-1·dm3·min-1.
Comparing to reference value (Wu et al, 1995), the relative error is 1.28% and the correlation
coefficient of line fitting is 0.9996. And for the same experiment, relative errors of most results
obtained by handwork are more than 5%.
This VI system is applied to determine the dissociation constant of acetic acid and to test six
samples, e.g. 0.1000 mol·dm-3、0.0500 mol·dm-3、0.0250 mol·dm-3、0.0125 mol·dm-3、0.0062
mol·dm-3 and 0.0031mol·dm-3. The real-time acquiring data is shown in Fig. 5a. Calling the
built-in program to process the testing data and the dissociation constant of Kc=1.817×10⁻⁵ is
obtained. Comparing to the reference (Wu, 2000), the relative error is 0.94% and the relative
errors of handwork are mostly more than 4%.
The VI of system is applied in the alkali (NaOH) titration with the strong acid
(0.1000mol·dm-3). Precisely taking the 2ml solution of sodium hydroxide, the titration experiment
is performed three times with the hydrochloric acid of 0.1000mol·dm-3. By the corresponding
built-in program of data processing, the three hydrochloric volume 2.02ml, 2.04ml and 2.02ml of
being expended are obtained and the RSD is 0.57%. The panel of data processing is shown in Fig.
6b. In the same experiment, the results of manual testing are 2.01ml, 2.05ml and 2.04ml. The RSD
is 1.02%.
The above applications indicate that the VI system not only has function of real-time data
acquiring, displaying, storage, but also realizes different the analyzing and processing of data,
reporting of result according to the different testing task; moreover the veracity and repeatability
of data processing result are higher than the results of manual data processing.
On the real-time acquiring panel of VI ( for example Fig. 3a, 4a, 5a), the real-time curve and
the digital value are displayed and the needle meter that real-time display the value of testing is
placed on the top left corner, which improve the lifelike and vivid image of VI. The knob of range
choice on the top right corner of VI is matched with the testing range of conductivity meter. The
emulational knob of channel choice is matched with the channel of DAQ board. When the user
chooses a channel, the operating panel of VI will real-timely display the data of corresponding
channel. This function can meet need of multi-channel determining synchronously in the research
and production (the DAQ board has 16 single channels or 8 double channels). The operation of
knob is operated only by clicking mouse and this offers the more convenience to users. The VI can
be packed as a stand-alone application by using the Application Builder of LabVIEW and the
application can run separately from the LabVIEW, just like other the executable programs. If the
- 331 conductivity meter connected with computer is different, the VI can work after just adjusting the
circuit, which improves the practical application of VI. Obviously, when the traditional
conductivity meter is used to perform the other testing task, the system can be upgraded from the
traditional apparatus to high performance VI and intelligently performs the testing task by only
changing some LabVIEW programs according to the principle of testing and special requirement.
To sum up, the conductivity VI based on LabVIEW 8.0 Express is developed with a
computer connecting to the general conductivity meter, homemade adjusting circuit, DAQ board.
The functions, such as data acquiring automatically, real-time displaying, automatically processing
of testing data and obtaining the report of result immediately are realized. The examples of
application indicate that the VI not only realizes a computer of multipurpose, but also avoids the
complication and the manual error during the recording and processing of testing data and further
improves the veracity and repeatability of testing result. At the same time, the practice shows that
using the LabVIEW 8.0 Express to develop the VI also has the advantages of high efficiency,
friendly interface, easy operating, and wide expandability of functions, etc.
5 Acknowledgment
The authors are grateful to the important research item of China West Normal
University(200201) and Sichuan provincial Department of education [(2005) 198] for financial
support.
Reference:
1
Z.R. WU, D.W. QI, Y.T. WANG, On-line Conductivity Titration Technique, Analytical Laboratory, 17(1998)
2
Y.T. WANG. W.Q. ZHANG, R.B. HOU, Measuring Rate Constant of Saponification of Ethyl Acetate with
No.5, 90-93.
On-line Electric Conductivity Instrument, Journal of Guangxi Normal University, 19(2001) No. 3, 50-54.
3
J.Y. LI, Z.R. LIU, Y.C. WANG, Virtual Instrument of Electrochemistry Based on LabVIEW 7 Express,
Computers and Applied Chemistry, 22(2005) No.10, 918-920.
4
Z.S. LEI, LabVIEW Practical and Technologic Student Edition 7.0 Express, China Railway Publishing House,
Beijing, 2004.
5
Y. ZHANG, F.L. LONG, Compare of Three Newest Software in System of Test and Control, Control and
Instruments in Chemical Industry, 25(1998) No.3, 25-27.
6
X.Y. KANG, H. LIU, Quantitative Determination of Potassium by On-line Conductivity titration Technique,
7
L. KUANG, L. WU, Studying Kinetics of Saponification of Ethyl Acetate with Computer, College Chemistry,
8
National Instruments Corporation, LabVIEW User Manual Edition.20-1, 2003.
9
Fudan University, Physical Chemistry Experiments (Third Edition), Higher Education Press, Beijing, 2004.
10
Z.S. WU, Z. YAN, Instructor of Physical Chemistry Experiments, Northeast Normal University Publishing
11
Wuhan University, Analytical Chemistry (Fourth Edition), Higher Education Press, Beijing, 2000.
Journal of shanxi Normal University, 30(2002) 140-141.
19(2004) No.4, 39-43.
House, Changchun, 1995.