1
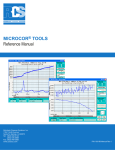
User Manual
VM5000
Automatic Video Measurement Set
071-1522-02
Test Equipment Depot - 800.517.8431 - 99 Washington Street Melrose, MA 02176 - FAX 781.665.0780 - TestEquipmentDepot.com
Table of Contents
Preface . . . . . . . . . . . . . . . . . . . . . . . . . . . . . . . . . . . . . . . . . . . . . . . . . . .
xiii
About This Manual . . . . . . . . . . . . . . . . . . . . . . . . . . . . . . . . . . . . . . . . . . . . . . .
Related Manuals and Online Documents . . . . . . . . . . . . . . . . . . . . . . . . . . . . . .
xiii
xiv
General Safety Summary . . . . . . . . . . . . . . . . . . . . . . . . . . . . . . . . . . .
Environmental Considerations . . . . . . . . . . . . . . . . . . . . . . . . . . . . . . .
xv
xvii
Product Description . . . . . . . . . . . . . . . . . . . . . . . . . . . . . . . . . . . . . . . .
1--1
Key Features . . . . . . . . . . . . . . . . . . . . . . . . . . . . . . . . . . . . . . . . . . . . . . . . . . . .
Compatibility of the VM5000 Option HD with the VM5000HD . . . . . . . . . . .
Firmware Upgrade . . . . . . . . . . . . . . . . . . . . . . . . . . . . . . . . . . . . . . . . . . . . . . .
Recommended Oscilloscope Probes . . . . . . . . . . . . . . . . . . . . . . . . . . . . . . . . .
1-- 1
1-- 3
1-- 3
1-- 3
Installation . . . . . . . . . . . . . . . . . . . . . . . . . . . . . . . . . . . . . . . . . . . . . . .
1--5
Unpacking . . . . . . . . . . . . . . . . . . . . . . . . . . . . . . . . . . . . . . . . . . . . . . . . . . . . . .
Checking the Environment Requirements . . . . . . . . . . . . . . . . . . . . . . . . . . . . .
Connecting the Mouse . . . . . . . . . . . . . . . . . . . . . . . . . . . . . . . . . . . . . . . . . . . .
Powering On the Instrument . . . . . . . . . . . . . . . . . . . . . . . . . . . . . . . . . . . . . . .
Shutting Down the Instrument . . . . . . . . . . . . . . . . . . . . . . . . . . . . . . . . . . . . .
Creating an Emergency Startup Disk . . . . . . . . . . . . . . . . . . . . . . . . . . . . . . . . .
Backing Up User Files . . . . . . . . . . . . . . . . . . . . . . . . . . . . . . . . . . . . . . . . . . . .
Installing Software . . . . . . . . . . . . . . . . . . . . . . . . . . . . . . . . . . . . . . . . . . . . . . .
Connecting to a Network . . . . . . . . . . . . . . . . . . . . . . . . . . . . . . . . . . . . . . . . . .
Adjusting Display Contrast . . . . . . . . . . . . . . . . . . . . . . . . . . . . . . . . . . . . . . . .
1-- 5
1-- 6
1-- 7
1-- 8
1-- 8
1-- 9
1-- 9
1-- 10
1-- 11
1-- 12
Incoming Inspection . . . . . . . . . . . . . . . . . . . . . . . . . . . . . . . . . . . . . . .
1--13
Self Tests . . . . . . . . . . . . . . . . . . . . . . . . . . . . . . . . . . . . . . . . . . . . . . . . . . . . . . .
Functional Test . . . . . . . . . . . . . . . . . . . . . . . . . . . . . . . . . . . . . . . . . . . . . . . . . .
1-- 13
1-- 14
Options and Accessories . . . . . . . . . . . . . . . . . . . . . . . . . . . . . . . . . . . .
1--23
Options . . . . . . . . . . . . . . . . . . . . . . . . . . . . . . . . . . . . . . . . . . . . . . . . . . . . . . . .
Accessories . . . . . . . . . . . . . . . . . . . . . . . . . . . . . . . . . . . . . . . . . . . . . . . . . . . . .
1-- 23
1-- 24
Operating Basics . . . . . . . . . . . . . . . . . . . . . . . . . . . . . . . . . . . . . . . . . .
2--1
Input Signal Connection Requirements . . . . . . . . . . . . . . . . . . . . . . . . . . . . . . .
Connecting Input Signals . . . . . . . . . . . . . . . . . . . . . . . . . . . . . . . . . . . . . . . . . .
Signal Path Compensation . . . . . . . . . . . . . . . . . . . . . . . . . . . . . . . . . . . . . . . . .
Sync Pickoff Compensation for Option SD/HD . . . . . . . . . . . . . . . . . . . . . . . .
The Matrix Test Signal . . . . . . . . . . . . . . . . . . . . . . . . . . . . . . . . . . . . . . . . . . . .
Starting the Application . . . . . . . . . . . . . . . . . . . . . . . . . . . . . . . . . . . . . . . . . . .
The VM5000 Application User Interface . . . . . . . . . . . . . . . . . . . . . . . . . . . . . .
Measurement Steps Overview . . . . . . . . . . . . . . . . . . . . . . . . . . . . . . . . . . . . . .
Setting the Input Signal Format . . . . . . . . . . . . . . . . . . . . . . . . . . . . . . . . . . . . .
Selecting the Measurements . . . . . . . . . . . . . . . . . . . . . . . . . . . . . . . . . . . . . . . .
Setting the Measurement Run Operations . . . . . . . . . . . . . . . . . . . . . . . . . . . . .
Setting the Measurement Warnings . . . . . . . . . . . . . . . . . . . . . . . . . . . . . . . . . .
Setting Reference and Limits Options . . . . . . . . . . . . . . . . . . . . . . . . . . . . . . . .
2-- 1
2-- 3
2-- 12
2-- 13
2-- 16
2-- 20
2-- 22
2-- 23
2-- 24
2-- 27
2-- 28
2-- 33
2-- 34
Getting Started
Operating Basics
VM5000 Automatic Video Measurement Set User Manual
i
Table of Contents
Displaying the Input Signal as a Picture . . . . . . . . . . . . . . . . . . . . . . . . . . . . . .
Changing Picture Display Settings . . . . . . . . . . . . . . . . . . . . . . . . . . . . . . . . . . .
Displaying the Input Signal in a Vectorscope Window for Option SD/HD . . . .
Taking and Viewing the Measurement Results . . . . . . . . . . . . . . . . . . . . . . . . .
Taking Measurements Across Multiple Lines . . . . . . . . . . . . . . . . . . . . . . . . . .
Changing Line Number or Averaging on the Results Screen . . . . . . . . . . . . . .
Saving Measurement Setups . . . . . . . . . . . . . . . . . . . . . . . . . . . . . . . . . . . . . . . .
Recalling Measurement Settings . . . . . . . . . . . . . . . . . . . . . . . . . . . . . . . . . . . .
Saving Measurement Results (Reports) . . . . . . . . . . . . . . . . . . . . . . . . . . . . . . .
2-- 36
2-- 37
2-- 39
2-- 41
2-- 44
2-- 45
2-- 47
2-- 49
2-- 51
Reference Overview . . . . . . . . . . . . . . . . . . . . . . . . . . . . . . . . . . . . . . . .
Menu Descriptions . . . . . . . . . . . . . . . . . . . . . . . . . . . . . . . . . . . . . . . . .
3--1
3--3
File Menu . . . . . . . . . . . . . . . . . . . . . . . . . . . . . . . . . . . . . . . . . . . . . . . . . . . . . .
Configuration Menu . . . . . . . . . . . . . . . . . . . . . . . . . . . . . . . . . . . . . . . . . . . . . .
Results Menu . . . . . . . . . . . . . . . . . . . . . . . . . . . . . . . . . . . . . . . . . . . . . . . . . . .
Utilities Menu . . . . . . . . . . . . . . . . . . . . . . . . . . . . . . . . . . . . . . . . . . . . . . . . . . .
Help Menu . . . . . . . . . . . . . . . . . . . . . . . . . . . . . . . . . . . . . . . . . . . . . . . . . . . . .
3-- 3
3-- 5
3-- 16
3-- 25
3-- 26
Option SD/HD Detailed Measurement Information . . . . . . . . . . . . .
3--27
Matrix Signals and Line Numbers . . . . . . . . . . . . . . . . . . . . . . . . . . . . . . . . . . .
Averaging . . . . . . . . . . . . . . . . . . . . . . . . . . . . . . . . . . . . . . . . . . . . . . . . . . . . . .
Channel Delay . . . . . . . . . . . . . . . . . . . . . . . . . . . . . . . . . . . . . . . . . . . . . . . . . .
Color Bars . . . . . . . . . . . . . . . . . . . . . . . . . . . . . . . . . . . . . . . . . . . . . . . . . . . . . .
Frequency Response . . . . . . . . . . . . . . . . . . . . . . . . . . . . . . . . . . . . . . . . . . . . . .
Multiburst . . . . . . . . . . . . . . . . . . . . . . . . . . . . . . . . . . . . . . . . . . . . . . . . . . . . . .
Noise . . . . . . . . . . . . . . . . . . . . . . . . . . . . . . . . . . . . . . . . . . . . . . . . . . . . . . . . . .
NonLinearity . . . . . . . . . . . . . . . . . . . . . . . . . . . . . . . . . . . . . . . . . . . . . . . . . . . .
Short Time Distortion . . . . . . . . . . . . . . . . . . . . . . . . . . . . . . . . . . . . . . . . . . . . .
Sync . . . . . . . . . . . . . . . . . . . . . . . . . . . . . . . . . . . . . . . . . . . . . . . . . . . . . . . . . .
3-- 27
3-- 27
3-- 28
3-- 29
3-- 30
3-- 33
3-- 34
3-- 35
3-- 35
3-- 37
Option VGA Detailed Measurement Information . . . . . . . . . . . . . . .
3--39
Matrix Signals and Line Numbers . . . . . . . . . . . . . . . . . . . . . . . . . . . . . . . . . . .
Averaging . . . . . . . . . . . . . . . . . . . . . . . . . . . . . . . . . . . . . . . . . . . . . . . . . . . . . .
Ch-Ch Mismatch Measurement . . . . . . . . . . . . . . . . . . . . . . . . . . . . . . . . . . . . .
Ch-Ch Skew Measurement . . . . . . . . . . . . . . . . . . . . . . . . . . . . . . . . . . . . . . . . .
Color Bars Measurement . . . . . . . . . . . . . . . . . . . . . . . . . . . . . . . . . . . . . . . . . .
H Sync Measurement . . . . . . . . . . . . . . . . . . . . . . . . . . . . . . . . . . . . . . . . . . . . .
H Sync Jitter Measurement . . . . . . . . . . . . . . . . . . . . . . . . . . . . . . . . . . . . . . . .
H Timing Measurement . . . . . . . . . . . . . . . . . . . . . . . . . . . . . . . . . . . . . . . . . . .
Linearity Measurement . . . . . . . . . . . . . . . . . . . . . . . . . . . . . . . . . . . . . . . . . . . .
Luma Levels Measurement . . . . . . . . . . . . . . . . . . . . . . . . . . . . . . . . . . . . . . . .
Noise Inj Ratio Measurement . . . . . . . . . . . . . . . . . . . . . . . . . . . . . . . . . . . . . . .
V Sync Measurement . . . . . . . . . . . . . . . . . . . . . . . . . . . . . . . . . . . . . . . . . . . . .
V Timing Measurement . . . . . . . . . . . . . . . . . . . . . . . . . . . . . . . . . . . . . . . . . . .
Video Transient Measurement . . . . . . . . . . . . . . . . . . . . . . . . . . . . . . . . . . . . . .
3-- 39
3-- 39
3-- 40
3-- 41
3-- 42
3-- 43
3-- 45
3-- 46
3-- 48
3-- 49
3-- 50
3-- 52
3-- 55
3-- 56
Setting Up Measurements . . . . . . . . . . . . . . . . . . . . . . . . . . . . . . . . . . .
3--59
Taking Measurements . . . . . . . . . . . . . . . . . . . . . . . . . . . . . . . . . . . . . . . . . . . . .
Taking Measurements Relative to a Reference . . . . . . . . . . . . . . . . . . . . . . . . .
Creating a Custom Reference File . . . . . . . . . . . . . . . . . . . . . . . . . . . . . . . . . . .
Taking Measurements with Limit Testing . . . . . . . . . . . . . . . . . . . . . . . . . . . . .
Customizing a Limits File . . . . . . . . . . . . . . . . . . . . . . . . . . . . . . . . . . . . . . . . .
3-- 59
3-- 60
3-- 62
3-- 64
3-- 66
Reference
ii
VM5000 Automatic Video Measurement Set User Manual
Table of Contents
Setting Up the Channel Delay Measurement . . . . . . . . . . . . . . . . . . . . . . . . . . .
Setting Up the Color Bars Measurement . . . . . . . . . . . . . . . . . . . . . . . . . . . . . .
Setting Up the Frequency Response Measurement . . . . . . . . . . . . . . . . . . . . . .
Setting Up the Multiburst Measurement . . . . . . . . . . . . . . . . . . . . . . . . . . . . . .
Setting Up the Noise Measurement . . . . . . . . . . . . . . . . . . . . . . . . . . . . . . . . . .
Setting Up the Noise Spectrum Measurement . . . . . . . . . . . . . . . . . . . . . . . . . .
Setting Up the NonLinearity Measurement . . . . . . . . . . . . . . . . . . . . . . . . . . . .
Setting Up the Short Time Distortion Measurement . . . . . . . . . . . . . . . . . . . . .
Setting Up the Sync Measurement . . . . . . . . . . . . . . . . . . . . . . . . . . . . . . . . . . .
Configuring the Device Under Test for Option VGA . . . . . . . . . . . . . . . . . . . .
Setting Up the Ch-- Ch Mismatch Measurement . . . . . . . . . . . . . . . . . . . . . . . . .
Setting Up the Ch-- Ch Skew Measurement . . . . . . . . . . . . . . . . . . . . . . . . . . . .
Setting Up the Color Bars Measurement . . . . . . . . . . . . . . . . . . . . . . . . . . . . . .
Setting Up the H Sync Measurement . . . . . . . . . . . . . . . . . . . . . . . . . . . . . . . . .
Setting Up the H Sync Jitter Measurement . . . . . . . . . . . . . . . . . . . . . . . . . . . .
Setting Up the H Timing Measurement . . . . . . . . . . . . . . . . . . . . . . . . . . . . . . .
Setting Up the Linearity Measurement . . . . . . . . . . . . . . . . . . . . . . . . . . . . . . .
Setting Up the Luma Levels Measurement . . . . . . . . . . . . . . . . . . . . . . . . . . . .
Setting Up the Noise Inj Ratio Measurement . . . . . . . . . . . . . . . . . . . . . . . . . .
Setting Up the V Sync Measurement . . . . . . . . . . . . . . . . . . . . . . . . . . . . . . . . .
Setting Up the V Timing Measurement . . . . . . . . . . . . . . . . . . . . . . . . . . . . . . .
Setting Up the Video Transient Measurement . . . . . . . . . . . . . . . . . . . . . . . . . .
3-- 68
3-- 69
3-- 70
3-- 73
3-- 74
3-- 77
3-- 77
3-- 79
3-- 80
3-- 81
3-- 84
3-- 85
3-- 86
3-- 87
3-- 88
3-- 89
3-- 90
3-- 91
3-- 93
3-- 94
3-- 95
3-- 96
Viewing Measurement Results . . . . . . . . . . . . . . . . . . . . . . . . . . . . . . .
3--99
Displaying the Results Summary . . . . . . . . . . . . . . . . . . . . . . . . . . . . . . . . . . . .
Displaying Channel Delay Measurement Results . . . . . . . . . . . . . . . . . . . . . . .
Displaying Color Bars Measurement Results . . . . . . . . . . . . . . . . . . . . . . . . . .
Displaying Frequency Response Measurement Results . . . . . . . . . . . . . . . . . . .
Displaying Multiburst Measurement Results . . . . . . . . . . . . . . . . . . . . . . . . . . .
Displaying Noise Measurement Results . . . . . . . . . . . . . . . . . . . . . . . . . . . . . . .
Displaying NonLinearity Measurement Results . . . . . . . . . . . . . . . . . . . . . . . .
Displaying Short Time Distortion Measurement Results . . . . . . . . . . . . . . . . .
Displaying Sync Measurement Results . . . . . . . . . . . . . . . . . . . . . . . . . . . . . . .
Displaying Ch-Ch Mismatch Measurement Results . . . . . . . . . . . . . . . . . . . . .
Displaying Ch-Ch Skew Measurement Results . . . . . . . . . . . . . . . . . . . . . . . . .
Displaying Color Bars Measurement Results . . . . . . . . . . . . . . . . . . . . . . . . . .
Displaying H Sync Measurement Results . . . . . . . . . . . . . . . . . . . . . . . . . . . . .
Displaying H Sync Jitter Measurement Results . . . . . . . . . . . . . . . . . . . . . . . . .
Displaying H Timing Measurement Results . . . . . . . . . . . . . . . . . . . . . . . . . . .
Displaying Linearity Measurement Results . . . . . . . . . . . . . . . . . . . . . . . . . . . .
Displaying Luma Levels Measurement Results . . . . . . . . . . . . . . . . . . . . . . . . .
Displaying Noise Inj Ratio Measurement Results . . . . . . . . . . . . . . . . . . . . . . .
Displaying V Sync Measurement Results . . . . . . . . . . . . . . . . . . . . . . . . . . . . .
Displaying V Timing Measurement Results . . . . . . . . . . . . . . . . . . . . . . . . . . .
Displaying Video Transient Measurement Results . . . . . . . . . . . . . . . . . . . . . .
Displaying Pass/Fail Results . . . . . . . . . . . . . . . . . . . . . . . . . . . . . . . . . . . . . . .
3-- 99
3-- 101
3-- 102
3-- 104
3-- 106
3-- 107
3-- 109
3-- 111
3-- 112
3-- 113
3-- 115
3-- 116
3-- 118
3-- 119
3-- 121
3-- 122
3-- 124
3-- 125
3-- 127
3-- 128
3-- 130
3-- 132
Appendices
Appendix A: Specifications . . . . . . . . . . . . . . . . . . . . . . . . . . . . . . . . . .
A--1
Option SD/HD . . . . . . . . . . . . . . . . . . . . . . . . . . . . . . . . . . . . . . . . . . . . . . . . . .
Option VGA . . . . . . . . . . . . . . . . . . . . . . . . . . . . . . . . . . . . . . . . . . . . . . . . . . . .
A-- 19
A-- 22
Appendix B: Performance Verification . . . . . . . . . . . . . . . . . . . . . . . .
B--1
VM5000 Automatic Video Measurement Set User Manual
iii
Table of Contents
Option SD/HD Performance Verification . . . . . . . . . . . . . . . . . . . . . . . . . . . . . .
Prerequisites . . . . . . . . . . . . . . . . . . . . . . . . . . . . . . . . . . . . . . . . . . . . . . . . . . . .
Required Equipment . . . . . . . . . . . . . . . . . . . . . . . . . . . . . . . . . . . . . . . . . . . . . .
Option SD/HD Procedure . . . . . . . . . . . . . . . . . . . . . . . . . . . . . . . . . . . . . . . . . .
Option VGA Performance Verification . . . . . . . . . . . . . . . . . . . . . . . . . . . . . . .
Prerequisites . . . . . . . . . . . . . . . . . . . . . . . . . . . . . . . . . . . . . . . . . . . . . . . . . . . .
Required Equipment . . . . . . . . . . . . . . . . . . . . . . . . . . . . . . . . . . . . . . . . . . . . . .
Initial Setup . . . . . . . . . . . . . . . . . . . . . . . . . . . . . . . . . . . . . . . . . . . . . . . . . . . .
Performance Verification Procedures . . . . . . . . . . . . . . . . . . . . . . . . . . . . . . . . .
B-- 1
B-- 1
B-- 1
B-- 2
B-- 15
B-- 15
B-- 15
B-- 16
B-- 17
Appendix C: Cleaning . . . . . . . . . . . . . . . . . . . . . . . . . . . . . . . . . . . . . .
C--1
Exterior Cleaning . . . . . . . . . . . . . . . . . . . . . . . . . . . . . . . . . . . . . . . . . . . . . . . .
Flat Panel Display Cleaning . . . . . . . . . . . . . . . . . . . . . . . . . . . . . . . . . . . . . . . .
C-- 1
C-- 1
Appendix D: Rebuilding the Hard Drive . . . . . . . . . . . . . . . . . . . . . .
Appendix E: Signal Sources Package Contents . . . . . . . . . . . . . . . . .
D--1
E--1
Option SD/HD Signal Source Discs . . . . . . . . . . . . . . . . . . . . . . . . . . . . . . . . . .
Baseband Test Signals CD . . . . . . . . . . . . . . . . . . . . . . . . . . . . . . . . . . . . . . . . .
ATSC Transport Stream CD . . . . . . . . . . . . . . . . . . . . . . . . . . . . . . . . . . . . . . . .
Advanced TV Elementary Streams CD
Standard Definition TV Elementary Streams CD . . . . . . . . . . . . . . . . . . . .
480 and 576 Line DVDs . . . . . . . . . . . . . . . . . . . . . . . . . . . . . . . . . . . . . . . . . . .
Option VGA Signal Source Disc . . . . . . . . . . . . . . . . . . . . . . . . . . . . . . . . . . . .
E-- 1
E-- 2
E-- 4
E-- 5
E-- 7
E-- 8
Index
iv
VM5000 Automatic Video Measurement Set User Manual
Table of Contents
List of Figures
Figure 1--1: Instrument space requirements . . . . . . . . . . . . . . . . . . . .
Figure 1--2: Locations of VM5000 Option VGA connectors . . . . . . .
Figure 1--3: On/Standby switch location . . . . . . . . . . . . . . . . . . . . . . .
Figure 1--4: Displaying measurement values in color bars
measurement . . . . . . . . . . . . . . . . . . . . . . . . . . . . . . . . . . . . . . . . . .
Figure 1--5: Format panel . . . . . . . . . . . . . . . . . . . . . . . . . . . . . . . . . . .
Figure 1--6: Results Summary display . . . . . . . . . . . . . . . . . . . . . . . . .
Figure 1--7: Color Bars measurement results display . . . . . . . . . . . .
Figure 1--8: H Sync measurement results display . . . . . . . . . . . . . . . .
Figure 1--9: V Sync measurement results display . . . . . . . . . . . . . . . .
Figure 1--10: Video Transient measurement results display . . . . . . .
Figure 2--1: Connecting the T-connector to the VM5000 . . . . . . . . . .
Figure 2--2: RGBHV Measurement Interface Unit . . . . . . . . . . . . . . .
Figure 2--3: VGA connector to 5X cable . . . . . . . . . . . . . . . . . . . . . . .
Figure 2--4: Connecting the Sync Pickoff to the instrument . . . . . . .
Figure 2--5: Connection of 3--wire video with composite sync,
Setup 1 . . . . . . . . . . . . . . . . . . . . . . . . . . . . . . . . . . . . . . . . . . . . . . .
Figure 2--6: Connection of 3-wire video with composite sync,
Setup 2 . . . . . . . . . . . . . . . . . . . . . . . . . . . . . . . . . . . . . . . . . . . . . . .
Figure 2--7: Connection of 4--wire video with separate composite
sync . . . . . . . . . . . . . . . . . . . . . . . . . . . . . . . . . . . . . . . . . . . . . . . . . .
Figure 2--8: Connection of the PC video card to the VM5000 using
RGBHV Measurement Interface Unit . . . . . . . . . . . . . . . . . . . . . .
Figure 2--9: Connection of the DUT to the RGBHV Measurement
Interface Unit . . . . . . . . . . . . . . . . . . . . . . . . . . . . . . . . . . . . . . . . . .
Figure 2--10: Connection of the RGBHV Measurement Interface Unit
to the VM5000 . . . . . . . . . . . . . . . . . . . . . . . . . . . . . . . . . . . . . . . . .
Figure 2--11: Connecting the RS-232C cable between the
Measurement Interface Unit and the VM5000 . . . . . . . . . . . . . . .
Figure 2--12: Selection of the Use MIU option on the Configuration >
Operation tab . . . . . . . . . . . . . . . . . . . . . . . . . . . . . . . . . . . . . . . . . .
Figure 2--13: Connecting the VGA to 5X cable to the input channel
Figure 2--14: Building the 2.21 kΩ and 301 Ω terminations . . . . . . .
Figure 2--15: Connecting the PC video output signals to the VM5000
Figure 2--16: Appearance of the pop-up warning when making
H Sync measurement . . . . . . . . . . . . . . . . . . . . . . . . . . . . . . . . . . .
VM5000 Automatic Video Measurement Set User Manual
1--6
1--7
1--8
1--16
1--18
1--19
1--19
1--20
1--20
1--20
2--1
2--2
2--2
2--3
2--4
2--5
2--6
2--7
2--8
2--8
2--9
2--9
2--10
2--11
2--11
2--12
v
Table of Contents
vi
Figure 2--17: Calibration instruction . . . . . . . . . . . . . . . . . . . . . . . . . .
Figure 2--18: Attaching Sync Pickoff for compensation adjustment .
Figure 2--19: Connecting to the probe compensation connector . . . .
Figure 2--20: Location of AUTOSET button . . . . . . . . . . . . . . . . . . . .
Figure 2--21: Display of waveform to determine sync pickoff
compensation . . . . . . . . . . . . . . . . . . . . . . . . . . . . . . . . . . . . . . . . . .
Figure 2--22: Adjusting the compensation . . . . . . . . . . . . . . . . . . . . . .
Figure 2--23: Option SD/HD Matrix signal . . . . . . . . . . . . . . . . . . . . .
Figure 2--24: Option VGA Matrix test signal . . . . . . . . . . . . . . . . . . .
2--13
2--14
2--14
2--15
Figure 3--1: Signal definitions (H Sync) . . . . . . . . . . . . . . . . . . . . . . . .
Figure 3--2: Jitter in H Sync period . . . . . . . . . . . . . . . . . . . . . . . . . . .
Figure 3--3: Frequency response with 500 MHz filter for Noise In
Ratio measurement . . . . . . . . . . . . . . . . . . . . . . . . . . . . . . . . . . . . .
Figure 3--4: Voltage ripple and noise . . . . . . . . . . . . . . . . . . . . . . . . . .
Figure 3--5: Signal definitions (V Sync) . . . . . . . . . . . . . . . . . . . . . . . .
Figure 3--6: Signal definitions (Video transient) . . . . . . . . . . . . . . . . .
Figure 3--7: Results of the Color Bars measurement . . . . . . . . . . . . .
Figure 3--8: Enabling relative to reference results . . . . . . . . . . . . . . .
Figure 3--9: Relative to reference results displayed (Option SD/HD)
Figure 3--10: Relative to reference results displayed (Option VGA) .
Figure 3--11: Editing a reference file . . . . . . . . . . . . . . . . . . . . . . . . . .
Figure 3--12: Enabling limit testing (Option SD/HD) . . . . . . . . . . . . .
Figure 3--13: Enabling limit testing (Option VGA) . . . . . . . . . . . . . .
Figure 3--14: Results when limit testing is available . . . . . . . . . . . . . .
Figure 3--15: Customizing a limits file . . . . . . . . . . . . . . . . . . . . . . . . .
Figure 3--16: Illustration of the BMP test signal in full screen mode
Figure 3--17: Illustration of the BMP image set as wallpaper . . . . . .
Figure 3--18: Displaying the results summary (Option SD/HD) . . . .
Figure 3--19: Displaying the results summary (Option VGA) . . . . . .
Figure 3--20: Displaying the Channel Delay measurement . . . . . . . .
Figure 3--21: Displaying limit values for the Channel Delay
measurement . . . . . . . . . . . . . . . . . . . . . . . . . . . . . . . . . . . . . . . . . .
Figure 3--22: Displaying the Color Bars measurement . . . . . . . . . . .
Figure 3--23: Displaying limit values for the Color Bars
measurement . . . . . . . . . . . . . . . . . . . . . . . . . . . . . . . . . . . . . . . . . .
Figure 3--24: Displaying the Frequency Response measurement . . .
Figure 3--25: Displaying limit values for the Frequency Response
measurement . . . . . . . . . . . . . . . . . . . . . . . . . . . . . . . . . . . . . . . . . .
3--43
3--46
2--15
2--15
2--16
2--18
3--51
3--52
3--53
3--56
3--60
3--61
3--62
3--62
3--63
3--65
3--65
3--66
3--67
3--83
3--83
3--99
3--99
3--101
3--102
3--102
3--103
3--104
3--105
VM5000 Automatic Video Measurement Set User Manual
Table of Contents
Figure 3--26: Displaying additional units for the Frequency
Response measurement . . . . . . . . . . . . . . . . . . . . . . . . . . . . . . . . . .
Figure 3--27: Displaying the Multiburst measurement . . . . . . . . . . .
Figure 3--28: Displaying limit values for the Multiburst
measurement . . . . . . . . . . . . . . . . . . . . . . . . . . . . . . . . . . . . . . . . . .
Figure 3--29: Displaying the Noise measurement . . . . . . . . . . . . . . . .
Figure 3--30: Displaying limit values for the Noise measurement . . .
Figure 3--31: Displaying the Noise Spectrum measurement . . . . . . .
Figure 3--32: Displaying the Noise Spectrum on the VM5000 video
monitor . . . . . . . . . . . . . . . . . . . . . . . . . . . . . . . . . . . . . . . . . . . . . . .
Figure 3--33: Displaying the NonLinearity measurement . . . . . . . . .
Figure 3--34: Displaying limit values for the NonLinearity
measurement . . . . . . . . . . . . . . . . . . . . . . . . . . . . . . . . . . . . . . . . . .
Figure 3--35: Displaying the Short Time Distortion measurement . .
Figure 3--36: Displaying limit values for the Short Time Distortion
measurement . . . . . . . . . . . . . . . . . . . . . . . . . . . . . . . . . . . . . . . . . .
Figure 3--37: Displaying the Sync measurement . . . . . . . . . . . . . . . . .
Figure 3--38: Displaying limit values for the Sync measurement . . .
Figure 3--39: Ch-Ch Mismatch measurement results . . . . . . . . . . . . .
Figure 3--40: Limit values for the Ch-Ch Mismatch measurement .
Figure 3--41: Ch-Ch Skew measurement results . . . . . . . . . . . . . . . . .
Figure 3--42: Limit values for the Ch-Ch Skew measurement . . . . .
Figure 3--43: Color Bars measurement results . . . . . . . . . . . . . . . . . .
Figure 3--44: Limit values for the Color Bars measurement . . . . . . .
Figure 3--45: H Sync measurement results . . . . . . . . . . . . . . . . . . . . .
Figure 3--46: Limit values for the H Sync measurement . . . . . . . . . .
Figure 3--47: H Sync Jitter measurement results . . . . . . . . . . . . . . . .
Figure 3--48: Limit values for the H Sync Jitter measurement . . . . .
Figure 3--49: H Timing measurement results . . . . . . . . . . . . . . . . . . .
Figure 3--50: Limit values for the H Timing measurement . . . . . . . .
Figure 3--51: Linearity measurement results . . . . . . . . . . . . . . . . . . . .
Figure 3--52: Limit values for the Linearity measurement . . . . . . . .
Figure 3--53: Luma Levels measurement results . . . . . . . . . . . . . . . .
Figure 3--54: Limit values for the Luma Levels measurement . . . . .
Figure 3--55: Noise Inj Ratio measurement results with MIU . . . . . .
Figure 3--56: Limit values for the Noise Inj Ratio measurement . . .
Figure 3--57: V Sync measurement results . . . . . . . . . . . . . . . . . . . . .
Figure 3--58: Limit values for the V Sync measurement . . . . . . . . . .
Figure 3--59: V Timing measurement results . . . . . . . . . . . . . . . . . . .
VM5000 Automatic Video Measurement Set User Manual
3--105
3--106
3--107
3--107
3--108
3--108
3--109
3--109
3--110
3--111
3--112
3--112
3--113
3--113
3--114
3--115
3--116
3--116
3--117
3--118
3--119
3--119
3--120
3--121
3--122
3--122
3--123
3--124
3--125
3--125
3--126
3--127
3--128
3--128
vii
Table of Contents
viii
Figure 3--60: Limit values for the V Timing measurement . . . . . . . .
Figure 3--61: Video Transient measurement results . . . . . . . . . . . . . .
Figure 3--62: Limit values for the Video Transient measurement . . .
Figure 3--63: Displaying Pass/Fail results in results summary for
Option SD/HD . . . . . . . . . . . . . . . . . . . . . . . . . . . . . . . . . . . . . . . . .
Figure 3--64: Displaying Pass/Fail results in results summary for
Option VGA . . . . . . . . . . . . . . . . . . . . . . . . . . . . . . . . . . . . . . . . . . .
Figure 3--65: Displaying Pass/Fail results (Option SD/HD) . . . . . . . .
Figure 3--66: Displaying Pass/Fail results (Option VGA) . . . . . . . . .
3--129
3--130
3--131
3--132
Figure A--1: Graph of Immunity behavior . . . . . . . . . . . . . . . . . . . . .
A--18
Figure B--1: Signal output amplitude test hookup . . . . . . . . . . . . . . .
Figure B--2: Amplitude accuracy test hookup . . . . . . . . . . . . . . . . . . .
Figure B--3: Frequency accuracy test hookup . . . . . . . . . . . . . . . . . . .
Figure B--4: Noise floor accuracy test hookup . . . . . . . . . . . . . . . . . .
Figure B--5: Channel delay match test hookup . . . . . . . . . . . . . . . . . .
Figure B--6: Setup to determine 9500B signal output amplitude . . .
Figure B--7: Setup to determine absolute amplitude measurement
accuracy . . . . . . . . . . . . . . . . . . . . . . . . . . . . . . . . . . . . . . . . . . . . . .
Figure B--8: Setup to determine the noise floor measurement
accuracy . . . . . . . . . . . . . . . . . . . . . . . . . . . . . . . . . . . . . . . . . . . . . .
Figure B--9: Setup to check channel skew match . . . . . . . . . . . . . . . .
Figure B--10: Setup to measure H Sync transient response accuracy
Figure B--11: Setup to perform Transient and Linearity
measurements . . . . . . . . . . . . . . . . . . . . . . . . . . . . . . . . . . . . . . . . .
Figure B--12: Setup to perform Linearity measurement . . . . . . . . . .
B--3
B--5
B--9
B--11
B--13
B--18
B--31
B--40
Figure E--1: Using TG700 baseband test signals . . . . . . . . . . . . . . . .
Figure E--2: Using ATSC transport stream signals . . . . . . . . . . . . . .
Figure E--3: Using elementary stream signals . . . . . . . . . . . . . . . . . . .
Figure E--4: Using DVD signals . . . . . . . . . . . . . . . . . . . . . . . . . . . . . .
E--3
E--4
E--6
E--7
3--132
3--133
3--133
B--21
B--25
B--26
B--29
VM5000 Automatic Video Measurement Set User Manual
Table of Contents
List of Tables
Table 1--1: Recommended Probes . . . . . . . . . . . . . . . . . . . . . . . . . . . .
Table 1--2: Instrument options . . . . . . . . . . . . . . . . . . . . . . . . . . . . . . .
Table 1--3: Standard Accessories . . . . . . . . . . . . . . . . . . . . . . . . . . . . .
Table 1--4: Recommended Accessories . . . . . . . . . . . . . . . . . . . . . . . .
Table 1--5: Optional Accessories . . . . . . . . . . . . . . . . . . . . . . . . . . . . .
Table 2--1: Required connections of the VGA signal, VM5000, and
the terminator . . . . . . . . . . . . . . . . . . . . . . . . . . . . . . . . . . . . . . . . .
Table 2--2: Option SD/HD Matrix signal elements . . . . . . . . . . . . . .
Table 2--3: Elements of Option VGA Matrix Signal . . . . . . . . . . . . .
Table 2--4: Resolutions and line number ranges supported at
60 Hz (DMT standard) for Option VGA . . . . . . . . . . . . . . . . . . .
1--3
1--23
1--24
1--27
1--27
2--12
2--17
2--18
2--19
Table 3--1: Overview of menu descriptions . . . . . . . . . . . . . . . . . . . .
Table 3--2: Elements of the reference file . . . . . . . . . . . . . . . . . . . . . .
Table 3--3: Matching measurements to the appropriate Full Field
test pattern . . . . . . . . . . . . . . . . . . . . . . . . . . . . . . . . . . . . . . . . . . . .
Table 3--4: Status Box Indicators in Results Summary pane . . . . . .
Table 3--5: Warning Box Indicators in Results Summary pane . . . .
3--82
3--100
3--100
Table A--1: Channel input and vertical specifications . . . . . . . . . . .
Table A--2: Horizontal and acquisition system specifications . . . . .
Table A--3: Trigger specifications . . . . . . . . . . . . . . . . . . . . . . . . . . . .
Table A--4: Display specifications . . . . . . . . . . . . . . . . . . . . . . . . . . . .
Table A--5: Input/output port specifications . . . . . . . . . . . . . . . . . . .
Table A--6: Data storage specifications . . . . . . . . . . . . . . . . . . . . . . . .
Table A--7: Power source specifications . . . . . . . . . . . . . . . . . . . . . . .
Table A--8: Mechanical specifications . . . . . . . . . . . . . . . . . . . . . . . . .
Table A--9: Environmental specifications . . . . . . . . . . . . . . . . . . . . . .
Table A--10: Certifications and compliances . . . . . . . . . . . . . . . . . . .
Table A--11: Video measurement specifications . . . . . . . . . . . . . . . . .
Table A--12: Sync Pick--Off Accessory Characteristics . . . . . . . . . . .
Table A--14: Option VGA Video Measurements . . . . . . . . . . . . . . . .
Table A--15: RGBHV Measurement Interface Unit (MIU) . . . . . . . .
A--1
A--5
A--6
A--11
A--11
A--13
A--13
A--14
A--14
A--16
A--19
A--21
A--22
A--24
VM5000 Automatic Video Measurement Set User Manual
3--1
3--63
ix
Table of Contents
x
Table B--1: Required test equipment for Option SD/HD performance
verification . . . . . . . . . . . . . . . . . . . . . . . . . . . . . . . . . . . . . . . . . . .
Table B--2: Measured blanking to white levels . . . . . . . . . . . . . . . . .
Table B--3: White bar measurement . . . . . . . . . . . . . . . . . . . . . . . . . .
Table B--4: Example white bar measurement values . . . . . . . . . . . . .
Table B--5: Delay error measurements . . . . . . . . . . . . . . . . . . . . . . . .
Table B--6: Required test equipment for Option VGA performance
verification . . . . . . . . . . . . . . . . . . . . . . . . . . . . . . . . . . . . . . . . . . .
Table B--7: Format for Luminance level measurement results . . . .
Table B--8: Example for Luminance level measurement results . . .
Table B--9: Amplitude measurement results . . . . . . . . . . . . . . . . . . . .
Table B--10: Example of Amplitude measurement results . . . . . . . .
Table B--11: Noise Floor levels of G, B and R Channels . . . . . . . . . .
Table B--12: Channel Skew results of G, B and R channels . . . . . . .
Table B--13: H Sync Transient measurement results . . . . . . . . . . . .
Table B--14: Video rise/fall time -- G Channel . . . . . . . . . . . . . . . . . .
Table B--15: Video rise/fall time -- B Channel . . . . . . . . . . . . . . . . . .
Table B--16: Video rise/fall time -- R Channel . . . . . . . . . . . . . . . . . .
Table B--17: 8-bit Linearity measurement results -- G channel . . . .
Table B--18: 8-bit Linearity measurement results -- B channel . . . .
Table B--19: 8-bit Linearity measurement results -- R channel . . . .
Table B--20: 10-bit Linearity, G Channel, Level 1 of 4 . . . . . . . . . . .
Table B--21: 10-bit Linearity, G Channel, Level 2 of 4 . . . . . . . . . . .
Table B--22: 10-bit Linearity, G Channel, Level 3 of 4 . . . . . . . . . . .
Table B--23: 10-bit Linearity, G Channel, Level 4 of 4 . . . . . . . . . . .
Table B--24: 10-bit Linearity, G Channel, All Levels . . . . . . . . . . . .
Table B--25: 10-bit Linearity, B Channel, Level 1 of 4 . . . . . . . . . . .
Table B--26: 10-bit Linearity, B Channel, Level 2 of 4 . . . . . . . . . . .
Table B--27: 10-bit Linearity, B Channel, Level 3 of 4 . . . . . . . . . . .
Table B--28: 10-bit Linearity, B Channel, Level 4 of 4 . . . . . . . . . . .
Table B--29: 10-bit Linearity, B Channel, All Levels . . . . . . . . . . . .
Table B--30: 10-bit Linearity, R Channel, Level 1 of 4 . . . . . . . . . . .
Table B--31: 10-bit Linearity, R Channel, Level 2 of 4 . . . . . . . . . . .
Table B--32: 10-bit Linearity, R Channel, Level 3 of 4 . . . . . . . . . . .
Table B--33: 10-bit Linearity, R Channel, Level 4 of 4 . . . . . . . . . . .
Table B--34: 10-bit Linearity, R Channel, All Levels . . . . . . . . . . . .
B--15
B--20
B--20
B--23
B--24
B--26
B--28
B--30
B--32
B--33
B--33
B--35
B--35
B--36
B--37
B--37
B--38
B--38
B--39
B--40
B--41
B--41
B--42
B--42
B--44
B--44
B--45
B--45
B--46
Table E--1: Signal Sources discs . . . . . . . . . . . . . . . . . . . . . . . . . . . . .
Table E--2: Test Signal Files -- File and Signal Formats . . . . . . . . . .
E--1
E--2
B--1
B--4
B--6
B--7
B--14
VM5000 Automatic Video Measurement Set User Manual
Table of Contents
Table E--3: TG700 DNL analog signal format files . . . . . . . . . . . . . .
Table E--4: TG700 DNL digital signal format files . . . . . . . . . . . . . .
Table E--5: Available MXT100 .trp signal setup files . . . . . . . . . . . .
Table E--6: Advanced TV Elementary Streams . . . . . . . . . . . . . . . . .
Table E--7: Advanced TV Bitmaps . . . . . . . . . . . . . . . . . . . . . . . . . . .
Table E--8: Standard Definition TV Elementary Streams . . . . . . . .
Table E--9: Standard Definition TV Bitmaps . . . . . . . . . . . . . . . . . . .
Table E--10: Available formats of DVD files . . . . . . . . . . . . . . . . . . . .
VM5000 Automatic Video Measurement Set User Manual
E--2
E--3
E--4
E--5
E--5
E--6
E--6
E--7
xi
Preface
This is the user manual for the VM5000 Automatic Video Measurement Set.
This manual focuses on the automatic video measurement functionality; it does
not cover the oscilloscope functionality. Refer to Related Manuals and Online
Documents to locate information about using the oscilloscope functionality.
About This Manual
This manual is composed of the following chapters:
H
Getting Started shows you how to configure and install your instrument and
provides a functional check procedure.
H
Operating Basics, using a highly-graphical approach, walks you through the
basics of using the instrument user interface.
H
Reference goes into more detail on the menu functions, understanding the
measurements, and interpreting your results.
H
Appendices provides additional information including instrument specifications, performance verification, cleaning information, and signal source
descriptions.
VM5000 Automatic Video Measurement Set User Manual
xiii
Preface
Related Manuals and Online Documents
This manual is part of a document set of manuals and online documentation. See
the following list for other documents supporting operation and service:
Manual name
Description
VM5000 Quick Start User Manual (printed,
and also available on the software CD as a
.pdf file)
The VM5000 Quick Start User Manual provides information about installation and basic
operating concepts to enable you to start using VM5000 as quickly as possible.
VM5000 Automatic Video Measurement Set
Online Help
An integrated online help system, which can be accessed from the VM5000 help menu
(located in the middle of the screen when the VM5000 application is open).
VM5000 Programmer Manual (only in PDF
format)
Documentation for GPIB commands, with syntax and description, and commands that
are specific to the VM5000.
TDS5000B Series Digital Phosphor
Oscilloscopes Quick Start User Manual
The Quick Start User Manual provides information about installation and basic
operating concepts to enable you to easily use the basic oscilloscope functionality.
TDS5000B Series Digital Phosphor
Oscilloscopes Online Help
An integrated online help system, which can be accessed from the oscilloscope
platform help menu (located at the top right of the screen).
TDS5000B Series Oscilloscope Online
Programmer Guide
A listing of the programming commands and other information related to controlling the
oscilloscope functionality over GPIB.
TDS5000B Series Digital Phosphor
Oscilloscopes Service Manual
A description of how to service the instrument to the module level. This optional
manual must be ordered separately.
xiv
VM5000 Automatic Video Measurement Set User Manual
General Safety Summary
Review the following safety precautions to avoid injury and prevent damage to
this product or any products connected to it. To avoid potential hazards, use this
product only as specified.
Only qualified personnel should perform service procedures.
While using this product, you may need to access other parts of the system. Read
the General Safety Summary in other system manuals for warnings and cautions
related to operating the system.
To Avoid Fire or
Personal Injury
Use Proper Power Cord. Use only the power cord specified for this product and
certified for the country of use.
Connect and Disconnect Properly. Do not connect or disconnect probes or test
leads while they are connected to a voltage source.
Ground the Product. This product is grounded through the grounding conductor
of the power cord. To avoid electric shock, the grounding conductor must be
connected to earth ground. Before making connections to the input or output
terminals of the product, ensure that the product is properly grounded.
Observe All Terminal Ratings. To avoid fire or shock hazard, observe all ratings
and markings on the product. Consult the product manual for further ratings
information before making connections to the product.
Do Not Operate Without Covers. Do not operate this product with metal covers or
panels removed.
Avoid Exposed Circuitry. Do not touch exposed connections and components
when power is present.
Do Not Operate With Suspected Failures. If you suspect there is damage to this
product, have it inspected by qualified service personnel.
Do Not Operate in Wet/Damp Conditions.
Do Not Operate in an Explosive Atmosphere.
Keep Product Surfaces Clean and Dry.
Provide Proper Ventilation. Refer to the manual’s installation instructions for
details on installing the product so it has proper ventilation.
VM5000 Automatic Video Measurement Set User Manual
xv
General Safety Summary
Symbols and Terms
Terms in this Manual. These terms may appear in this manual:
WARNING. Warning statements identify conditions or practices that could result
in injury or loss of life.
CAUTION. Caution statements identify conditions or practices that could result in
damage to this product or other property.
Terms on the Product. These terms may appear on the product:
DANGER indicates an injury hazard immediately accessible as you read the
marking.
WARNING indicates an injury hazard not immediately accessible as you read the
marking.
CAUTION indicates a hazard to property including the product.
Symbols on the Product. The following symbols may appear on the product:
CAUTION
Refer to Manual
xvi
WARNING
High Voltage
Protective Ground
(Earth) Terminal
VM5000 Automatic Video Measurement Set User Manual
Environmental Considerations
This section provides information about the environmental impact of the
product.
Product End-of-Life
Handling
Observe the following guidelines when recycling an instrument or component:
Equipment Recycling. Production of this equipment required the extraction and
use of natural resources. The equipment may contain substances that could be
harmful to the environment or human health if improperly handled at the
product’s end of life. In order to avoid release of such substances into the
environment and to reduce the use of natural resources, we encourage you to
recycle this product in an appropriate system that will ensure that most of the
materials are reused or recycled appropriately.
The symbol shown to the left indicates that this product
complies with the European Union’s requirements
according to Directive 2002/96/EC on waste electrical and
electronic equipment (WEEE).
Mercury Notification. This product uses an LCD backlight lamp that contains
mercury. Disposal may be regulated due to environmental considerations. Please
contact your local authorities or, within the United States, the Electronics
Industries Alliance (www.eiae.org) for disposal or recycling information.
Restriction of Hazardous
Substances
This product has been classified as Monitoring and Control equipment, and is
outside the scope of the 2002/95/EC RoHS Directive. This product is known to
contain lead, cadmium, mercury, and hexavalent chromium.
VM5000 Automatic Video Measurement Set User Manual
xvii
Getting Started
Product Description
This manual supports the VM5000 Automatic Video Measurement Set.
This chapter summarizes and highlights some of the key features of the
instrument. Following this description are three sections:
H
Installation shows you how to configure and install the instrument, as well
as how to reinstall the system software included with the product.
H
Incoming Inspection procedure verifies basic operation and functionality.
H
Accessories lists the standard and optional accessories for this product.
Key Features
The VM5000 Automatic Video Measurement Set is a high-performance,
oscilloscope-based automated video measurement system. Key features include:
H
Fast, accurate, and repeatable video measurements
H
Comprehensive component analog signal analysis
H
Support for SD, HDTV, and RGBHV component analog video formats using
options
H
Automated testing of PC and DTV consumer video devices
H
Automated VESA compliance testing for PC graphics devices
H
Picture, Vector, and Waveform Displays
H
Integrated Pass-Fail limit testing
H
Companion Test Signal Package
H
GPIB Remote Control and LAN Connectivity
H
Complete Oscilloscope Functionality
Targeted to meet the needs of video professionals developing, testing, and
manufacturing the next generation of Digital Television reception and play--out
devices, PC and play-out devices, the instrument incorporates the power,
features, and functionality needed in R&D, QA, and Production Test applications. It enables manufacturers to ensure that DTV video signal (Option SD/HD),
and PC video signal (Option VGA) quality is up to the challenge of high
performance displays, as well as enabling clear differentiation between input
signal and display device impairments.
VM5000 Automatic Video Measurement Set User Manual
1- 1
Product Description
You can use the VM5000 Automatic Video Measurement Set for the following
purposes:
H
R&D
H
Compliance and certification testing
H
Quality/Audit testing
H
Automated production test
H
Off-air video systems testing
The VM5000 automates a variety of component analog video measurements
which verify the integrity and quality of DTV video signals (Option SD/HD) and
PC video signals (Option VGA).
The VM5000 automatically assesses conformance of selected video signal
parameters to applicable EIA--770--3, SMPTE --274M, and 296M standards
(Option SD/HD), or the VESA version 1 revision 2 standard (Option VGA).
The VM5000 also automates measurement of other industry-standard video
parameters that quantify the performance of PCs or other consumer video
reception and play-out devices with component analog interfaces.
By integrating automated measurement algorithms and a high-speed, wide
bandwidth signal acquisition platform into one instrument, Tektronix offers a
reliable means to make fast, objective, and accurate video measurements.
Product verification activities that previously took hours or days to complete can
now be completed in seconds or minutes. Offering near plug-and-play video
measurement capability, even unskilled operators can reliably assess PC video
output signal quality.
As a fully integrated video analyzer, the VM5000 offers configuration menu
settings that can readily be recalled or copied, eliminating complicated oscilloscope set-ups, tedious manual measurements, and time-consuming results
correlation exercises. Product quality is enhanced because test results can be
reliably generated, easily replicated with other VM5000 instruments, and readily
communicated across a global engineering, supply, or sales organization.
The VM5000 runs the Windows operating system, which provides for easy
operation with minimal training time. A 10.4 in (264 mm) color display provides
a bright, clear, and crisp display of waveforms and measurement results.
1- 2
VM5000 Automatic Video Measurement Set User Manual
Product Description
Compatibility of the VM5000 Option HD with the VM5000HD
If you are upgrading an existing VM5000HD, some default settings have
changed. The changes are as follows:
H
The default trigger channel has changed from CH1 to CH4.
H
The Operation menu ‘Run Mode’ default setting has changed from ‘Continuously’ to ‘Once.’
H
The Report Generator Format setting now has two CSV options: ‘CSV
VM5000’ and ‘CSV Legacy.’
H
The CSV Legacy format is identical to the VM5000HD CSV format.
This is provided for customers who perform data reduction on the
CSV file. It does not include any information on new measurements.
H
The CSV VM5000 format includes information on all the new
measurements and options; for example, Relative to Reference and
Limit Testing results are included in the report.
Firmware Upgrade
Tektronix may offer firmware upgrade kits for the VM5000 instrument. Contact
your Tektronix service representative for more information (refer to Contacting
Tektronix at the beginning of the manual).
Recommended Oscilloscope Probes
Table 1--1 lists the recommended oscilloscope probes to use when using the
instrument as an oscilloscope.
Table 1- 1: Recommended Probes
Probe type
Passive, 10X, 500 MHz
Tektronix probe
P5050
Passive, 100X, 250 MHz, high voltage
P5100
Passive, 1000K, 100 MHz, high voltage
P6015A
Passive, 15 MHz, 1X
P6101B
Active, DC to 1.0 GHz, FET high speed digital,
for CMOS/TTL technology
P6243
Active, DC to 1.5 GHz, FET high speed digital,
for all technologies
P6245
Active, DC to 400 MHz, FET, high bandwidth differential
P6246
VM5000 Automatic Video Measurement Set User Manual
1- 3
Product Description
Table 1- 1: Recommended Probes (Cont.)
1- 4
Probe type
Tektronix probe
Active, DC to 1.0 GHz, FET, high bandwidth differential
P6247
Active, DC to 1.7 GHz, FET, high bandwidth differential
P6248
Active, 100 MHz, high voltage differential
P5205
Active, 50 MHz, high voltage differential
P5210
AC Current
P6021
AC Current
P6022
DC/AC Current
AM5030S
High Speed Current
CT-- 1/CT-- 2
Current, 250 KHz to 2 GHz, 50 Ω input, AC Only,
for temporary in-circuit installation
CT-6
Current, DC to 50 MHz, 15 A DC
TCP202
Low Capacitance, 20X, 3 GHz
P6158
Current Measurement
TCPA3000
Current Measurement
TCPA4000
Differential Preamp
ADA400A
High Voltage Differential
P5200
Optical/Electrical Converter
P6701B
Optical/Electrical Converter
P6703B
VM5000 Automatic Video Measurement Set User Manual
Installation
This section addresses instrument installation:
H
Unpacking on page 1--5
H
Checking the Environment Requirements on page 1--6
H
Connecting the Mouse on page 1--7
H
Powering On the Instrument on page 1--8
H
Shutting Down the Instrument on page 1--8
H
Creating an Emergency Startup Disk on page 1--9
H
Backing Up User Files on page 1--9
H
Installing Software on page 1--10
H
Connecting to a Network on page 1--11
H
Adjusting Display Contrast on page 1--12
CAUTION. Be sure to create your emergency startup disk as described on
page 1--9. You may need that disk if you ever need to reinstall Windows 2000 on
the instrument hard drive.
Unpacking
Refer to the tables beginning on page 1--23 for a list of the options and accessories shipped with this instrument. Remember to fill out and send in the customer
registration card.
VM5000 Automatic Video Measurement Set User Manual
1- 5
Installation
Checking the Environment Requirements
Read this section before starting any installation procedures. This section
describes site considerations, power requirements, and ground connections for
your instrument.
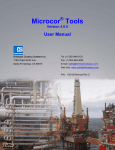
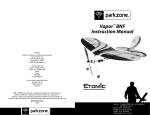
Site Considerations
The instrument is designed to operate on a bench or on a cart in the normal
position (on the bottom feet). For proper cooling, make sure that there is at least
three inches (76.20 mm) of clearance on the left side of the instrument. See
Figure 1--1. If you need to access the instrument CD-RW drive, you will also
need at least 5.1 inches (129.54 mm) of clearance on the right side of the
instrument.
76.20 mm
(3.00 in)
482.60 mm
(19.00 in)
330.20 mm
(13.00 in)
Figure 1- 1: Instrument space requirements
CAUTION. To ensure proper cooling, keep the bottom and left side of the
instrument clear of obstructions.
Operating Requirements
1- 6
The specifications in Appendix A list the power source, temperature, humidity,
and altitude operating requirements for the instrument.
VM5000 Automatic Video Measurement Set User Manual
Installation
Connecting the Mouse
The instrument includes a USB (Universal Serial Bus) mouse. You can plug the
mouse into any of the four available USB ports. The USB ports and other PC
peripheral connection points are shown in Figure 1--2. Refer to the TDS5000B
Quick Start User Manual for additional connection information.
Keyboard
PS/2 mouse
USB
PC SVGA output
Centronics printer
RS-232
USB
Microphone in
Ethernet
Audio line in
Audio line out
GPIB
Scope VGA output
Figure 1- 2: Locations of VM5000 Option VGA connectors
NOTE. For best performance, plug the USB devices directly into the USB
connectors on the instrument chassis, rather than connecting the devices serially.
You can connect or disconnect a USB mouse, keyboard, or other USB devices
with the power on. If your USB mouse locks up, disconnect and reconnect the
USB connector to restore normal operation.
CAUTION. To avoid product damage, shut down the instrument and disconnect
the power cord from the power source before connecting any accessories other
than USB devices. If the instrument front panel and/or touch screen does not
respond, press the On/Standby switch for at least five seconds to cycle power.
See Shutting Down the Instrument on page 1--8.
VM5000 Automatic Video Measurement Set User Manual
1- 7
Test Equipment Depot - 800.517.8431 - 99 Washington Street Melrose, MA 02176 - FAX 781.665.0780 - TestEquipmentDepot.com
Installation
Powering On the Instrument
Follow these steps to power on the instrument for the first time:
CAUTION. To ensure proper operation, connect the keyboard, mouse, and other
accessories before applying power to the product the first time.
1. Connect one end of the instrument power cord to the instrument and the
other end to a power source.
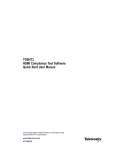
2. Push the On/Standby switch to power on the instrument (see Figure 1--3 for
the switch location).
On/Standby
switch
Figure 1- 3: On/Standby switch location
Shutting Down the Instrument
To shut down the instrument, push the front-panel On/Standby switch. The
instrument preserves settings and then starts a shutdown process (including a
Windows shutdown) to put the instrument into standby mode. Avoid disconnecting the power cord or power source to shut down the instrument.
NOTE. If you remove power instead of using the On/Standby switch to shut down
the instrument, the instrument will be in the factory Default Setup when powered
on the next time.
If the shutdown process does not start immediately after pushing the ON/Standby
switch, push and hold the On/Standby switch for up to 20 seconds to start the
shutdown process.
To completely remove power to the instrument, push the On/Standby switch and
then disconnect the power cord from the power source.
1- 8
VM5000 Automatic Video Measurement Set User Manual
Installation
Creating an Emergency Startup Disk
Now that you have completed the basic installation process, you should create an
emergency startup disk. The emergency startup disk contains basic files to restart
your instrument in case of a major hardware or software failure. The disk also
contains files that you can use to check and format the hard disk.
CAUTION. Create this disk and store it in a safe place. It may help you recover
your Windows 2000 installation without rebuilding the entire instrument hard
disk.
Follow these steps to create the emergency startup disk for a Windows 2000
instrument:
1. Minimize the instrument application by selecting Minimize in the File
menu.
2. From the Windows taskbar, select Start > Programs > Accessories >
System Tools > Backup.
3. In the Welcome display, click Emergency Repair Disk.
4. Insert a 3.5 inch disk into the disk drive, and follow the on-screen instructions to create the startup disk.
Backing Up User Files
Always back up your user files on a regular basis. Use the Windows Backup tool
to back up files stored on the hard disk. The Backup tool is located in the System
Tools folder in the Accessories folder.
Use these steps to back up your files:
1. Quit the instrument application by selecting the File menu Exit command.
2. Click the Windows Start button.
3. Select Programs > Accessories > System Tools > Backup.
4. Use the Backup Wizard to select the items you want to back up and the
destination. The destination can be the floppy drive or a third-party storage
device over one of the side-panel ports.
VM5000 Automatic Video Measurement Set User Manual
1- 9
Installation
Installing Software
The instrument system and application software is preinstalled at the factory. If
you have to reinstall the software for any reason, refer to the instructions that
accompany the CD-ROMs that are shipped with the instrument.
Software Release Notes
Read the software release notes (README.TXT) on the product software
CD-ROM before performing installation procedures. This file contains additional
information that supercedes other product documentation.
To view README.TXT, start the Windows Notepad accessory and open the file
from the VM5000 Automatic Video Measurement Set Product Software
CD-ROM.
VM5000 Remote
Command Information
The GPIB programmer information is available in the VM5000 Automatic Video
Measurement Set Programmer Manual PDF located on the VM5000 product
software CD--ROM.
Programmer information for the rest of the instrument functions is available as a
PDF file on the TDS5000B Series Product Software CD-ROM.
1- 10
VM5000 Automatic Video Measurement Set User Manual
Installation
Desktop Applications
You can install desktop application software on the instrument. The instrument
has been tested with the following software products installed:
H
Microsoft Office 98 (Word, Excel, PowerPoint)
H
MathCad (Option SD/HD only)
H
MATLAB (Option SD/HD only)
Other software products may be compatible but have not been tested by
Tektronix. If the instrument malfunctions after you install software, uninstall the
software and then reinstall the instrument software (if necessary) to restore
proper operation.
Quitting the instrument Application. Before installing other desktop applications,
quit the instrument application. To do this, select the File > Exit command.
Connecting to a Network
You can connect the instrument to a network to enable printing, file sharing,
internet access, and other communications functions. Before you make the
connection, do the following steps to enable network access to the instrument:
NOTE. If you want to disable network access for the instrument, perform the
following procedure, except substitute Disabled for the command listed in step 8.
The instrument will boot faster with network access disabled.
1. Begin with the instrument power off.
2. Attach a keyboard and mouse to the instrument.
3. Power on the instrument.
4. As the instrument begins to boot, press the keyboard F2 key repeatedly until
the “Loading SETUP” message appears.
5. In the BIOS Setup Utility, use the keyboard right-arrow key to highlight the
Advanced menu at the top of the screen.
6. Use the arrow down key to highlight Peripheral Configuration in the
Advanced screen, and then press Enter.
7. Use the arrow down key to highlight LAN Device in the Peripheral
Configuration screen, and then press Enter.
8. Use the arrow up or down key to highlight Enabled, and then press Enter.
VM5000 Automatic Video Measurement Set User Manual
1- 11
Installation
9. Press the F10 key to save and quit. Confirm Save of the configuration
changes when you are prompted on screen.
10. Use the Windows network setup utility to define the instrument as a network
client, and configure it for your network. You can find the network setup
utility in the Windows Start menu if you select Settings > Control Panel
and then double click Network. You should consult your network administrator for specific instructions to make these settings.
Adjusting Display Contrast
If you find that the instrument screen is too bright or too dark, use these steps to
adjust the LCD display contrast to your preference. You must have a mouse
attached to perform this procedure.
1. Right click the Windows desktop.
2. Select Properties.
3. Select the Settings tab.
4. Click Advanced.
5. Select the Color tab.
6. Adjust the slider control for the desired gamma setting. The screen
brightness will change as you move the slider control.
7. Click Apply.
8. Click OK.
1- 12
VM5000 Automatic Video Measurement Set User Manual
Incoming Inspection
This section contains instructions for performing a self test and functional
verification of the instrument. These procedures verify that the instrument is
operating correctly after shipment, but they do not check product specifications.
Make sure you have installed the instrument as described in Installation starting
on page 1--5.
Self Tests
This procedure uses internal routines to verify that the instrument functions and
was adjusted properly. No test equipment or hookups are required.
Equipment required
None
Prerequisites
Power on the instrument and allow a 20 minute warm-up.
Perform these substeps to verify internal diagnostics:
1. Display the system diagnostics menu as follows:
a. If the instrument is in the toolbar mode, click Menu (far right toolbar
button) to switch to menu bar mode.
b. From the Utilities menu, select Instrument Diagnostics to open the
Instrument Diagnostics control window.
c. In the Subsystem, Area, and Test lists, ensure that you select ALL.
2. Run the system diagnostics as follows:
a. Disconnect all input signals from all four channels.
b. Click Run in the Instrument Diagnostics control window.
The internal diagnostics do an exhaustive verification of proper instrument
function, taking five to fifteen minutes. When complete, the resulting status
appears in the diagnostics control window.
3. Verify that no failures are found and reported: The instrument should pass
all tests. If any failures occur, record the failure information
VM5000 Automatic Video Measurement Set User Manual
1- 13
Incoming Inspection
4. Run the signal path compensation routine as follows:
a. From the Utilities menu, select Instrument Calibration to open the
Instrument Calibration control window.
b. Click Calibrate to start the routine.
c. Confirm signal path compensation returns passed status: Signal path
compensation may take up to ten minutes to run. Verify that the word
Pass appears in the Status text box.
5. Click Close to quit the Instrument Calibration control window.
Functional Test
Option SD/HD
This procedure uses the output from a video signal generator, TG700 or
equivalent, to verify the VM5000 SD and HD video application functionality.
Two functional tests are described, one for option HD and another for option SD.
If you have both options, either test alone will verify functionality adequately.
Equipment required
VM5000
75Ω precision BNC terminations (3)
BNC “T” connectors (3)
A TG700 video generator with either a AWVG7 (for HD) or
AVG7 (for SD) (or equivalent generator)
NOTE. These procedures verify that the application features operate. They do not
verify that they operate within limits. Therefore, when the instructions in these
functional tests call for you to verify that a signal appears on screen “that is
about five divisions in amplitude” or “has a period of about six horizontal
divisions,” and so on, do not interpret the quantities given as limits.
Do not change the front-panel settings unless directed to by the procedure. If you
change front-panel settings, you may obtain invalid results. In this case, redo the
procedure from step 1.
When you are instructed to press a front-panel button or screen button, the
button may already be selected (its label is lighted). If this is the case, it is not
necessary to press the button.
1- 14
VM5000 Automatic Video Measurement Set User Manual
Incoming Inspection
1. Set the video generator to output 1080i/60 100% (for option HD) color bars,
or 480i/60 100% color bars (for option SD).
2. Connect the signal generator to the VM5000 instrument as shown in the
following diagram:
VM5000
BNC “T”
connector
TG700 with
AWVG7 module
CH1
CH2 CH3
CH4
CH3
CH2
CH1
Y/G Pb/B Pr/R
Sync
Pickoff
3. Power on the VM5000 instrument and wait for it to complete the power-on
process.
4. Select File > Run Application > VM5000 HD and SD video to display the
VM5000 application window.
5. In the application window, select File > Recall Default to load the
application default settings.
6. In the application window, select Configuration > Format to display the
Format view.
7. Select the 1080i/60 (HD) or 480i/60 (SD) button.
8. In the application window, select Configuration > Operation to display the
Operation view.
VM5000 Automatic Video Measurement Set User Manual
1- 15
Incoming Inspection
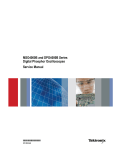
9. In the application window, select the Run button to start the application
measurement process.
The instrument begins taking measurements and displays a Color bars
measurement view listing measurement values similar to those as shown.
Figure 1- 4: Displaying measurement values in color bars measurement
10. Select the Picture button to display the VM5000 Video Monitor Window.
Verify that a color bars signal appears.
Option VGA
This procedure uses the output of a PC Display Card to verify the functionality
of the VM5000 Option VGA measurement set (comprising the VM5000
Option VGA, RGBHV Measurement Interface Unit (MIU) and associated
cables).
Equipment required
VM5000 Option VGA
RGBHV Measurement Interface Unit
VGA to 5 BNC cable, part number 174-- 5126-- XX
PC with VGA Display Card
1- 16
VM5000 Automatic Video Measurement Set User Manual
Incoming Inspection
NOTE. These procedures verify that the application features operate. They do not
verify that they operate within limits. Therefore, when the instructions in these
functional tests call for you to verify that a signal appears on screen “that is
about five divisions in amplitude” or “has a period of about six horizontal
divisions”, and so on, do not interpret the quantities given as limits.
Do not change the front-panel settings unless directed to by the procedure. If you
change front-panel settings, you may obtain invalid results. In this case, redo the
procedure from step 1.
When you are instructed to press a front-panel button or screen button, the
button may already be selected (its label is lighted). If this is the case, it is not
necessary to press the button.
1. Connect the RGBHV MIU to the VM5000 as described in Option VGA
Setup 1: RGBHV Measurement Interface Unit on page 2--7.
2. Set the VGA display card under test to any built-in format (such as
800x600@60) supported by Option VGA. This can be done in the PC by
using the Display Properties menu. Select the corresponding Matrix BMP
file (Resolution 800x600-Matrix Signal.bmp) from the PC Bitmap Graphics
CD (part number 020--2634--XX) and display the BMP file in full screen
mode.
3. Remove the PC monitor connection from the VGA display card and connect
the VGA display card output to the input channels on the MIU using the
VGA to 5 x BNC adapter cable.
4. Ensure that all four channels of the VM5000 are enabled. All four channel
buttons must be glowing.
5. Press the Autoset button on the VM5000. You should see the signals from all
four channels on the display with some visible activity.
6. Launch the VM5000 application from the TekScope menu bar by selecting
File > Run Application > VM5000 VGA Video.
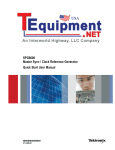
7. In the Format Panel (Configuration > Format), select the 800 x 600
resolution and 60 Hz refresh rate. Leave the Timing standard as the default
(that is, DMT). If the VGA display card generates signals using a different
Timing Standard, change the Timing selection accordingly. Refer to
Figure 1--5.
VM5000 Automatic Video Measurement Set User Manual
1- 17
Incoming Inspection
Figure 1- 5: Format panel
8. In the Measurements panel (Configuration > Measurements ), select the
following measurements:
H
Color Bars
H
H Sync
H
V Sync
H
Video Transient
Leave the settings in other configuration panels at their default values.
9. Press the Run button.
10. If the VM5000 is functioning normally, the four selected measurements will
be executed without any warning message(s). The results should be
displayed on the corresponding result panels (for example,
Results > H Sync). Because multiple measurements are selected, the Results
Summary panel will appear. Some representative screen shots are shown in
the Figures 1--6 through 1--10.
1- 18
VM5000 Automatic Video Measurement Set User Manual
Incoming Inspection
Figure 1- 6: Results Summary display
11. To view results for individual measurements, go to their respective screens.
For example, to see the results of the color bars measurement, select
Results > Color Bars.
The results shown in Figure 1--7 through Figure 1--10 are typical results.
Your results may vary.
Figure 1- 7: Color Bars measurement results display
VM5000 Automatic Video Measurement Set User Manual
1- 19
Incoming Inspection
Figure 1- 8: H Sync measurement results display
Figure 1- 9: V Sync measurement results display
Figure 1- 10: Video Transient measurement results display
1- 20
VM5000 Automatic Video Measurement Set User Manual
Incoming Inspection
Possible Errors and Troubleshooting Tips. If there is any problem associated with
the MIU or its connections, the following error message appears:
Error occurred in configuring the MIU
Perform the following steps to isolate the problem:
1. To further localize the problem, check the results display. For example, if
there is no signal on the G channel, the corresponding results will not be
displayed. So, check the G channel cables and their connection at the input
side of the MIU. Between the MIU and VM5000 check the Ch 1 cable and
its connections.
2. If expected results still do not appear, there might be some internal problem
in the MIU.
3. Other warning messages can be due to an incorrect signal or no signal. If the
warning is due to no signal, carry out the checks specified in step 1 above. If
the warning is due to an incorrect signal, ensure that the VGA card is set to
the same resolution, refresh rate, and timing standard as selected in the
Format panel of the application and that the appropriate BMP file is used.
VM5000 Automatic Video Measurement Set User Manual
1- 21
Options and Accessories
This section lists the product options, standard accessories, and optional
accessories that are available for the instrument.
Options
Table 1- 2: Instrument options
18*1
Touch-screen interface
1R
Rackmount kit
FHD
Front panel removable hard drive
1K
Scope Cart
655-- 4920-- 00
Thermal Printer - 1P
Mounting
016-- 1946-- XX
TDS5000B Series Rackmount Kit - 1R
Software
SM
Series Communications mask testing
CP2*2
TDSCPM2 - ANSI/ITU telecom pulse compliance
testing software (This requires option SM)
HD*3
HD component analog video measurements &
format support, includes test signal package
SD*3
SD component analog video measurements &
format support, excludes test signal package
VGA*3
RGBHV Video Measurements and VESA
Compliance Tests
DVD
TDSDVD - Optical storage analysis software
ET3
TDSET3 - Ethernet compliance test software
J2
TDSDDM2 - Hard disk drive measurements
software
J3E
TDSJIT3E - Jitter and timing analysis software
essentials
JA3
TDSJIT3 V2.0 Advanced-- Jitter and timing analysis
software
JT3
TDSJIT3 V2.0 Essentials-- Jitter and timing analysis
software
PW3
TDSPWR3 - Power measurements software
Hardware
VM5000 Automatic Video Measurement Set User Manual
1- 23
Accessories
Accessories
This section lists the standard and optional accessories. The accessories listed in
Table 1--3 are shipped standard with the instrument. Please specify the power
plug and the manual language option when ordering.
Table 1- 3: Standard Accessories
1- 24
Accessory
Part number
VM5000 Automatic Video Measurement Set Quick Start User Manual
in English (and a Korean, German, Spanish, Traditional Chinese, Simplified
Chinese, or Japanese translation if a language option was ordered)
071-1573-XX
VM5000 Automatic Video Measurement Set User Manual
071-1522-XX
VM5000 Automatic Video Measurement Set Programmer Manual
in PDF format on VM5000 Product Software CD
071-1574-XX
VM5000 Complete Signal Set (Option SD only)
020-2610-XX
VM5000 Signal Set (Option SD/HD Only)
020-2611-XX
VM5000 PC Graphics Test Signal Files (Option VGA only)
020-2634-XX
VM5000 Automatic Video Measurement Set User Manual
Options and Accessories
Table 1- 3: Standard Accessories (cont.)
Accessory
Part number
TDS5000B Series Digital Phosphor Oscilloscopes Quick Start User Manual
English (Option L0)
071-1355-XX
French (Option L1)
071-- 1352-- XX
German (Option L2)
071-- 1358-- XX
Japanese (Option L5)
071-- 1356-- XX
Simplified Chinese (Option L7)
071-- 1360-- XX
Traditional Chinese (Option L8)
071-- 1361-- XX
Korean (Option L9)
071-- 1359-- XX
Russian (Option L10)
071-- 1401-- XX
Oscilloscope Analysis and Connectivity Made Easy manual with software
020-2449-XX
VM5000 Product Software CD-ROM (includes VM5000 product software
with online help, VM5000 User Manual PDF, VM5000 Quick Start User
Manual PDF, and release notes)
020-2565-XX
TDS5000B Series Product Software CD-ROM that includes TDS5000B
product software including online help, TDS5000B Programmer Guide (GPIB
online help and PDF), Performance Verification PDF, release notes, VISA
information
063-3692-XX
TDS5000B Series Operating System Restore CD-ROM
063-3759-XX
TDS5000B Series Optional Applications Software CD-ROM
020-2450-XX
Getting Started
CD-ROM
with OpenChoiceTM book
and Software Developer’s Kit
020-2513-XX
30-day evaluation copy LabVIEW CD-ROM
020-2476-XX
Calibration Certificate Documenting NIST Traceability, Z540-- 1 Compliance,
and ISO9001 Registration
------
Option HD
Test signal files (ATSC transport, MPEG ES, TG700 DNL, Bitmap) on
CD-ROM
020-- 2611-- XX
Sync pick-off accessory
012-- 1680-- XX
Option SD
VM5000 DVD Signal Set
020-- 2610-- 00
VM5000 MPEG and Baseband Signal Set
020-- 2611-- 00
Sync pick-off accessory
012-- 1680-- 00
VM5000 Automatic Video Measurement Set User Manual
1- 25
Options and Accessories
Table 1- 3: Standard Accessories (cont.)
Accessory
Part number
Option VGA
PC graphics bitmap test signal files on CD-ROM
020-- 2634-- XX
VGA to 5X BNC cable (3 foot)
174-- 5126-- XX
VGA to 5X BNC cable (6 in.)
174-- 5147-- XX
RGBHV Measurement Interface Unit
012-- 1685-- XX
Termination accessory kit
BNC-to-Binding Post Adapters (2)
011-- 0183-- XX
Power Cord
North America (Option A0)
161-0104-00
Universal Euro (Option A1)
161-0104-06
United Kingdom (Option A2)
161-0104-07
Australia (Option A3)
161-0104-05
240V North America (Option A4)
161-0104-08
Switzerland (Option A5)
161-0167-00
Japan (Option A6)
161-A005-00
China (Option A10)
161-0306-00
No power cord or AC Adapter (Option A99)
1- 26
Optional Wheel Mouse
119-6936-XX
Mini-- Keyboard
118-9402-XX
Front Cover
200-4651-XX
Accessory Pouch
016-1935-XX
Optional Applications Software for Windows-- Based Oscilloscopes CD-ROM
and manuals
020-2450-XX
P5050 10X, 500 MHz, Passive Voltage Probe
P5050
Blank CDR / CDRW
020-2434-XX
Click ’N Burn Patch Floppy Disk
063-XXXX-XX
Precision 75 Ω terminations (4)
011-0102-XX
2.21 KΩ and 301 Ω Terminator Kit
020-2633-XX
BNC Female-to-Female connector
103-0028-XX
BNC Male-to-Male connector
103-0029-XX
BNC “T” connectors (4)
103-0030-XX
2.21 kΩ resistor
322-3226-00
301 Ω resistor
322-3143-00
VM5000 Automatic Video Measurement Set User Manual
Options and Accessories
Table 1- 3: Standard Accessories (cont.)
Accessory
Part number
VGA to BNC Sync Combiner cable
012-1664-XX
Table 1--4 lists the Recommended Accessories.
Table 1- 4: Recommended Accessories
Accessories
Part Number
TDS5000B Series Digital Phosphor Oscilloscopes Service
Manual
071-1362-XX
Transit Case
016-- 1937-- XX
Probe Calibration, Compensation, and Deskew Adapter
067-- 0405-- XX
Power Deskew Fixture
067-- 1478-- 00
Video Display Clamp
013-- 0278-- XX
P5050 500 MHz 10x passive probe
P5050
GPIB Cable (3.3 ft. or 1m)
012-- 0991-- 01
GPIB Cable (6.6 ft. or 2m)
012-- 0991-- 00
Centronics (printer) cable
012-- 1214-- 00
The accessories in Table 1--5 were orderable for use with the instrument at the
time this manual was published. Consult a current Tektronix catalog or the
Tektronix Web site for additions, changes, and details.
Table 1- 5: Optional Accessories
Accessories
Part Number
Transit Case
016-1937-00
Video Display Clamp
013-0278-XX
Thermal Printer Paper
016-1897-00
Probe Calibration, Compensation and Deskew Adapter
Requires a separate pulse generator
067-0405-XX
Power Deskew Fixture
067-1478-00
Extra Front Removable Hard Drive
065-0692-XX
P6101B 15 MHz 1X Passive Probe
P6101B
Extra P5050 500 MHz 10X Passive Probe
P5050
VM5000 Automatic Video Measurement Set User Manual
1- 27
Options and Accessories
Table 1- 5: Optional Accessories (Cont.)
1- 28
Accessories
Part Number
TCPA300, TCPA400 Series Current Measurement Systems
(requires TCPA300 / TCPA400 style probe)
TCPA300 / TCPA400
AMT75 1 GHz 75 W Adapter
AMT75
AFTDS Differential Signal Adapter
AFTDS
K420 Scope Cart with mouse accessory tray
436-0317-XX
TDS5000 Series, VM5000 Option HD rackmount kit
016-1887-XX
GPIB cable (3.3 frt / 1 m)
012-0991-01
GPIB cable (6.6 ft / 2m)
012-0991-00
Centronics cable
012-1250-00
VM5000 Automatic Video Measurement Set User Manual
Operating Basics
Operating Basics
This section provides basic information on how to use VM5000. More detailed
measurement information can be found in the Reference section.
Input Signal Connection Requirements
Option SD/HD
Use only 75 Ω coaxial cables to connect the video device under test to the
VM5000 instrument.
Install the included 75 Ω terminations between the end of the coaxial cables and
the instrument input channels, using the included BNC “T” connectors. See
Figure 2--1. For accurate frequency response measurements, it is important to
attach the “T” connector directly to the VM5000 input channel BNCs.
Direct connection to VM5000
input channel BNC
75 Ω precision
end-line termination
(011-0102-03)
75 Ω coaxial
cable
BNC “T” connector
(103-0030-00)
Figure 2- 1: Connecting the T-connector to the VM5000
Option VGA
The preferred method of connecting the video device under test to the VM5000
instrument is to use the RGBHV Measurement Interface Unit. The Measurement
Interface Unit contains an impedance-matching circuit to ensure the most
accurate measurement results. For some measurements, a low-frequency path is
used and for other measurements a wideband path is used.
VM5000 Automatic Video Measurement Set User Manual
2- 1
Operating Basics
The VM5000 selects which path is used through an RS-232 connection to the
Measurement Interface Unit. See Figure 2--2.
Figure 2- 2: RGBHV Measurement Interface Unit
You can also connect the video device under test to the VM5000 by using the
supplied VGA Connector to 5X cable. See Figure 2--3. If you use this method,
you will need to connect the cable to the VM5000 using the supplied precision
terminations. Depending on which measurements you take, you may need to
manually change terminations while taking measurements.
Figure 2- 3: VGA connector to 5X cable
2- 2
VM5000 Automatic Video Measurement Set User Manual
Operating Basics
Connecting Input Signals
Use the following diagrams to determine the optimum input signal setup for your
measurement needs.
3-Wire Analog Video with
Composite Sync, Setup 1
(Option SD/HD)
This is the preferred setup for testing 3-wire component analog video signals
(Y/G, Pb/B, Pr/R) with the composite sync signal on Y/G. This setup uses the
Sync Pickoff accessory to derive the trigger signal from the Y/G signal on CH1.
The triggering source is set to Channel 4. This configuration provides more
accurate low-level noise measurements (below --60 dB at 30 MHz bandwidth)
than setup 2.
Figure 2--4 shows how to connect the Sync Pickoff to the instrument. This
method of connecting to the instrument allows you to make more accurate noise
measurements on CH 1 while triggering on CH 4, without adding additional
cabling from CH1 to CH4. The additional cabling could adversely impact
frequency response and multiburst measurements.
Connect to CH1 input
Sync Pickoff
(012-1680-00)
BNC Male to Male
(103-0029-00)
BNC Female to Female
(103-0028-00)
75 Ω Precision
end-line termination
(011-0102-03)
BNC “T” connector
(103-0030-00)
Connect to CH4 for trigger
Figure 2- 4: Connecting the Sync Pickoff to the instrument
VM5000 Automatic Video Measurement Set User Manual
2- 3
Operating Basics
To achieve the best frequency response and multiburst measurements, connect
the 75 Ω terminator as close to the platform’s input connector as possible, as
shown in the Figure 2--5.
VM5000
Signal source
(Tektronix MTX100)
Set top box
BNC “T”
connector
Modulator
Y/G
Pb/B
Pr/R
CH1
CH2 CH3
CH4
Y/G Pb/B Pr/R
= BNC “T” connector
Sync
Pickoff
= 75 Ω Termination
Figure 2- 5: Connection of 3- wire video with composite sync, Setup 1
NOTE. Verify that the trigger channel is set to channel 4 (the default setting). If the trigger setting
(Configuration > Operation) is not set to channel 4, you will see signal warning messages and will
be unable to take measurements.
2- 4
VM5000 Automatic Video Measurement Set User Manual
Test Equipment Depot - 800.517.8431 - 99 Washington Street Melrose, MA 02176 - FAX 781.665.0780 - TestEquipmentDepot.com
Operating Basics
3-Wire Video with
Composite Sync, Setup 2
(Option SD/HD)
Use this setup for testing 3-wire component analog video signals (Y/G, Pb/B,
Pr/R) with the composite sync signal on Y/G. See Figure 2--6. Set the triggering
on the instrument to channel 1 (the default trigger setting is channel 4). This
setup is simpler than the others mentioned in this section, but limits noise
measurement on Y/G to --65 dB (30 MHz noise bandwidth).
VM5000
Signal source
(Tektronix MTX100)
Set top box
Modulator
Y/G
Pb/B
Pr/R
CH1 CH2 CH3 CH4
Y/G
= BNC “T” connector
Pb/B Pr/R
= 75 Ω Termination
Figure 2- 6: Connection of 3-wire video with composite sync, Setup 2
NOTE. Verify that the trigger channel is set to channel 4 (the default setting). If the trigger setting
(Configuration > Operation) is not set to channel 4, you will see signal warning messages and will
be unable to take measurements.
VM5000 Automatic Video Measurement Set User Manual
2- 5
Operating Basics
4-Wire Video with
Separate Composite Sync
(Option SD/HD)
Use this setup for testing 4-wire component analog video signals
(Y/G, Pb/B, Pr/R) with the composite sync signal on a separate output line. For
CH4, termination is optional. For CH4 only, you can use no termination or a
75 Ω termination of lower accuracy than the 75 Ω terminations that are provided
with the instrument. See Figure 2--7.
VM5000
Signal source
(Tektronix MTX100)
Video device
under test (DUT)
Modulator
Y/G
Pb/B Pr/R Sync
CH1 CH2 CH3 CH4
Y/G Pb/B Pr/R
= BNC “T” connector
Sync
= 75 Ω Termination
Figure 2- 7: Connection of 4- wire video with separate composite sync
NOTE. Verify that the trigger channel is set to channel 4 (the default setting). If the trigger setting
(Configuration > Operation) is not set to channel 4, you will see signal warning messages and will
be unable to take measurements.
2- 6
VM5000 Automatic Video Measurement Set User Manual
Operating Basics
Use the following diagrams to determine the optimum input signal setup for your
measurement needs.
Option VGA Setup 1:
RGBHV Measurement
Interface Unit
This is the preferred setup for testing PC and play-out device video. See
Figure 2--8. Use the RGBHV Measurement Interface Unit to connect the PC
video card to the VM5000. Using the RGBHV MIU provides the most accurate
measurement results.
Figure 2- 8: Connection of the PC video card to the VM5000 using RGBHV Measurement Interface Unit
VM5000 Automatic Video Measurement Set User Manual
2- 7
Operating Basics
To connect the RGBHV Measurement Interface Unit:
1. Connect the device-under-test (DUT) to the input side of the RGBHV
Measurement Interface Unit using one of the VGA-to-BNC adapter cables
supplied with your VM5000. See Figure 2--9.
Figure 2- 9: Connection of the DUT to the RGBHV Measurement Interface Unit
2. Connect the outputs (Aux, CH1--CH4) of the RGBHV Measurement
Interface Unit to same inputs on the VM5000 (that is, connect the CH1
output to the CH1 input). See Figure 2--10.
Figure 2- 10: Connection of the RGBHV Measurement Interface Unit to the VM5000
2- 8
VM5000 Automatic Video Measurement Set User Manual
Operating Basics
3. Connect the RS-232C cable between the RGBHV Measurement Interface
Unit and the COM1 port on the VM5000. See Figure 2--11.
Figure 2- 11: Connecting the RS-232C cable between the Measurement Interface
Unit and the VM5000
4. Verify that the Use MIU checkbox on the Configuration > Operation tab is
selected. See Figure 2--12.
Figure 2- 12: Selection of the Use MIU option on the Configuration > Operation tab
Option VGA Setup 2: VGA
Connector to 5X Cable
Use this setup for testing PC and play-out device video when it is not convenient
to use the RGBHV Measurement Interface Unit. To ensure accurate measurements, connect the signals to the VM5000 using the “T” connectors and
precision terminations on CH1--CH4. You must use 75 ohm terminations on
CH1--CH3 (used for GBR) and 2.21 kΩ and 301 Ω terminations on CH4 (used
for H Sync and V Sync measurements). This method requires you to change the
signal and termination connections on CH4 for certain horizontal and vertical
measurements. The VM5000 displays a dialog box prompting you to make these
changes when necessary (the RGBHV Measurement Interface Unit performs
these connection and termination changes internally).
VM5000 Automatic Video Measurement Set User Manual
2- 9
Operating Basics
To connect the DUT to the VM5000 using a 5X cable:
1. Install the included 75 Ω terminations between the end of the BNC cables
and the instrument input channels 1 through 3, using the included BNC
T-connectors. See Figure 2--13. To achieve accurate measurements, it is
important to attach the T-connectors directly to the input channel BNCs.
Figure 2- 13: Connecting the VGA to 5X cable to the input channel
2. If you will be making H Sync, V Sync, or V Timing measurements, you will
need to make 2.21 kΩ and 301 Ω terminations using the BNC--to--Binding
Post adapters and resistors supplied as standard accessories.
2- 10
VM5000 Automatic Video Measurement Set User Manual
Operating Basics
Attach each resistor to an adapter. See Figure 2--14.
Figure 2- 14: Building the 2.21 kΩ and 301 Ω terminations
3. Connect the PC video output signals to the VM5000. See Figure 2--15.
Connect the H Sync signal using the 2.21 kΩ adapter to begin with. The
VM5000 will prompt you to change it to the 301 Ω adapter if necessary.
Figure 2- 15: Connecting the PC video output signals to the VM5000
VM5000 Automatic Video Measurement Set User Manual
2- 11
Operating Basics
A pop-up warning appears to prompt you to change signal termination on CH4
when making a H Sync measurement. See Figure 2--16.
Figure 2- 16: Appearance of the pop-up warning when making H Sync measurement
Table 2--1 identifies which signal from the Device-Under-Test (DUT) should be
connected to which input connector on the VM5000 and the terminator that
should be used for each signal.
Table 2- 1: Required connections of the VGA signal, VM5000, and the terminator
VGA signal (Device Under Test)
VM5000 Input Connector
Terminator
Green
CH 1
75 Ω
Blue
CH 2
75 Ω
Red
CH 3
75 Ω
4*1
H Sync
CH
V Sync
AUX
*1
2.21 kΩ and 301 Ω
None
V Sync signal is connected to this channel only when making a V Timing or V Sync measurement. The VM5000 will prompt you for
this connection change if necessary.
Signal Path Compensation
Use this procedure if the temperature has changed more than 55°C since the last
signal path compensation. Perform the signal path compensation once a week.
Failure to do so may result in the instrument not meeting warranted performance
levels at those volts/div. settings.
1. Prerequisites: Instrument powered on for 20 minutes, and all input signals
removed.
2. Select Instrument Calibration.
2- 12
VM5000 Automatic Video Measurement Set User Manual
Operating Basics
3. If the status is Warm-up, wait until the status changes to Temp. Click
Calibrate to start the calibration. Calibration may take 10 to 15 minutes. See
Figure 2--17.
Figure 2- 17: Calibration instruction
4. If after calibration the status indicator does not display Pass, recalibrate the
instrument, or have the instrument serviced by qualified service personnel.
NOTE. Signal Path Compensation is the only calibration that is accessible to
you.
Sync Pickoff Compensation for Option SD/HD
To properly compensate the sync pickoff, follow these steps:
1. Prerequisites: instrument powered on for 20 minutes, and all input signals
removed.
2. Connect the Sync Pickoff cable to CH1 and CH4 as shown. See Figure 2--18.
VM5000 Automatic Video Measurement Set User Manual
2- 13
Operating Basics
2
Figure 2- 18: Attaching Sync Pickoff for compensation adjustment
3. Attach the Sync Pickoff BNC connector to the BNC-to-minigrabbers
connector (Pomona Electronics model number 3789). See Figure 2--19.
4
3
Figure 2- 19: Connecting to the probe compensation connector
4. Connect the minigrabbers to the Probe Compensation connector.
2- 14
VM5000 Automatic Video Measurement Set User Manual
Operating Basics
5. Push AUTOSET. See Figure 2--20.
5
Figure 2- 20: Location of AUTOSET button
6. Check the shape of the displayed waveform to determine if the sync pickoff
is compensated correctly. See Figure 2--21.
Properly compensated
Under compensated
Over compensated
Figure 2- 21: Display of waveform to determine sync pickoff compensation
7. If necessary, adjust the sync pickoff. Repeat as needed. See Figure 2--22.
Figure 2- 22: Adjusting the compensation
VM5000 Automatic Video Measurement Set User Manual
2- 15
Operating Basics
The Matrix Test Signal
The Matrix test signal incorporates all the analog video signal requirements
within one file (different files are used for Option SD/HD and Option VGA).
Using this single test file eliminates the need to change test signals when running
different measurements. The Matrix test signal is provided with the Signal
Source Disks accessory. You can select the setup file (.vmset) that matches the
format of the Matrix test signal. The default line number setting is provided for
each measurement type. You can change the line number as needed. See
Appendix E, Signal Source Set for a full description of the files in the Signal
Source Set.
Figure 2--23 shows the Option SD/HD Matrix test signal. Table 2--2 shows the
signal elements.
1
2
3
4
5
6
7
8
9
10
11
12
13
14
15
16
17
18
Figure 2- 23: Option SD/HD Matrix signal
2- 16
VM5000 Automatic Video Measurement Set User Manual
Operating Basics
Table 2- 2: Option SD/HD Matrix signal elements
Signal Name
Format
Signal Name
Format
Signal Name
Format
1. Color bars
All
7. YPbPr Sweep
Time
YPbPr
13. Valid Ramp
All
2. RGB Pulse
Bars
RGB
8. YPbPr
Multiburst
YPbPr
14. YPbPr Shallow YPbPr
Ramp
3. RGB
Frequency Sweep
RGB
9. YPbPr
Multiburst
YPbPr
15. RGB Shallow
Ramp
4. RGB Time
Sweep
RGB
10. YPbPr
Multiburst
YPbPr
16. Flat Field 7.5% YPbPr
5. RGB
Multiburst
RGB
11. RGB Crosstalk YPbPr
17. Flat Field 50%
YPbPr
6. RGB Pulse
Bars
RGB
12. YPbPr
Crosstalk
18. Flat Field
100%
YPbPr
VM5000 Automatic Video Measurement Set User Manual
YPbPr
YPbPr
2- 17
Operating Basics
Figure 2--24 shows the Option VGA Matrix test signal. Table 2--3 shows the
signal elements.
1
2
3
4
5
6
7
8
Figure 2- 24: Option VGA Matrix test signal
Table 2- 3: Elements of Option VGA Matrix Signal
Signal Name
Signal Name
1. Half White and Half Black
5. Black White Black
2. Nine Colorbars
6. Full White
3. 32 Steps
7. Ramp
4. Alternate White and Black
8. Half White and Half Black
The addressable line number pattern of the matrix signal is based on the
following equations:
Half White and Half Black Bars (1--9.5%)
Nine Color Bars (10.5--29.5%)
2- 18
VM5000 Automatic Video Measurement Set User Manual
Operating Basics
32 Steps ( 30.5--39.5%)
Alternate White and Black Bars( 40.5--49.5%)
Black--White--Black Bars (50.5--59.5%)
Full White (60.5--69.5%)
Staircase (70.5--89.5%)
Half White and Half Black Bars(90.5--100%)
The actual line number which user enters in the application is calculated based
on the following equation:
Active Line Number = Vertical Sync Time + Back Porch + Addressable Line Number according percentage
For 1280x1024 resolution, 85 Hz refresh rate, and DMT timing standard
the Vertical Sync Line is 3, Vertical Back Porch is 44.
For Half White and Half Black pattern,
The Start Active Line Number = 3 + 44 + 1 = 48
The End Active Line Number = 3 + 44 + 97 = 144
The line range for Half White and Half Black for 1280x1024 at 85 Hz would be
48 -- 144.
Table 2--4 shows an example of the resolutions and the corresponding line
number ranges the DMT timing standard supports at 60 Hz refresh rate for
Option VGA matrix signal.
Table 2- 4: Resolutions and line number ranges supported at 60 Hz (DMT standard) for Option VGA
Pattern
640x480
800x600
1024x768
1280x
1024
1600x
1200
1920x
1200
1920x
1440
1. Half White and
Half Black
28-- 73
28-- 84
36-- 108
42-- 138
50-- 163
43-- 156
60-- 196
2. Nine Colorbar
77-- 169
90-- 204
116-- 262
149-- 343
175-- 403
168-- 396
210-- 484
3. 32 Steps
173-- 217
210-- 264
269-- 338
353-- 445
415-- 523
408-- 516
498-- 628
4. Alternate White 221-- 265
and Black
270-- 324
346-- 415
456-- 548
535-- 643
528-- 636
642-- 772
5. BlackWhiteBlack
269-- 313
330-- 384
423-- 492
558-- 650
655-- 763
648-- 756
786-- 916
6. Full White
317-- 361
390-- 444
500-- 569
661-- 753
775-- 883
768-- 876
930-- 1060
7. Ramp
365-- 457
450-- 564
576-- 722
763-- 957
895-- 1123
888-- 1116
1074-- 1348
8. Half White and
Half Black
461-- 507
570-- 627
730-- 803
968-- 1065
1135-- 1249
1128-- 1242
1362-- 1499
VM5000 Automatic Video Measurement Set User Manual
2- 19
Operating Basics
For other refresh rates, the actual starting line number can be noticeably different
than the 60 Hz refresh rate. To view the active video line number location for a
specific pattern at another refresh rate, locate the Microsoft Excel file, MatrixSignals--LineNumbers.xls located on the VM5000 software CD. This file lists
the Actual Video line numbers for all supported refresh rates.
Starting the Application
Ensure that you have set up the input signal sources before running the measurements (See page 2--23).
1. Power on the instrument. The
instrument displays the default
main screen.
1
2. On the menu bar, click
File > Run Application >
VM5000 HD and SD Video.
Option SD/HD
2
or
File > Run Application >
VM5000 VGA Video.
Option VGA
2
2- 20
VM5000 Automatic Video Measurement Set User Manual
Operating Basics
3. The instrument reduces the
waveform area to the upper part
of the screen, and opens the
VM5000 application in the
lower part of the screen.
Option SD/HD
3
Option VGA
3
VM5000 Automatic Video Measurement Set User Manual
2- 21
Operating Basics
The VM5000 Application User Interface
1. Menu bar: The menu bar allows
you to configure the different
parameters of the application.
Use the menu bar to display the
results information in the
Results window.
2. Application view: The main
application window displays the
configuration controls and the
measurement results.
Option SD/HD
1
2
Option VGA
1
2
3. Run Button: Click Run to run
the selected measurements and
to display the results.
Option SD/HD
Option VGA
3
4
3
5
6
5
4. Stop button: Click Stop to stop
running the selected
measurements.
4
7
8
7
8
7
5. Picture button: Click the Picture button to display the picture of the signal.
6. Vectorscope button (Option SD/HD): Displays the signal in vectorscope format.
7. Hide button: Click Hide to restore the main screen to full-screen and hide the application
window behind the main screen.
To restore the application window after hiding it, click App on the main screen.
To access the Windows desktop, for example, to view reports, click Hide. In the main screen,
click File > Minimize, and then click Hide again.
2- 22
VM5000 Automatic Video Measurement Set User Manual
Operating Basics
8. Exit button: Click Exit to quit
the application. From the Exit
dialog box you can choose
whether to retain the settings.
The default setting for Restore
Scope Setting? is No. Click the
button to change the option to
Yes.
To quit the application, click
OK. If you don’t want to quit
the application, click Cancel.
8
8
8
Measurement Steps Overview
1. Use the Configuration > Format menu to set the input signal format standard (such as
1080i/60) and refresh rate (page 2--24).
2. Use the Configuration > Measurements menu to select one or more measurements to run
(page 2--27).
3. Use the Configuration > Operations menu to set the measurement run operations, such as run
mode and trigger channel (page 2--28).
4. Click Run to run the selected measurements and view the measurement results (page 2--41).
5. Use the Utilities > Generate Report menu to save the measurement results to a file (page 2--51).
VM5000 Automatic Video Measurement Set User Manual
2- 23
Operating Basics
Setting the Input Signal Format
1. On the menu bar, click
Configuration > Format.
Option VGA
Option SD/HD
1
2. The Format panel appears.
1
Option SD/HD
2
Option VGA
2
2- 24
VM5000 Automatic Video Measurement Set User Manual
Operating Basics
3. Select one of the standard video
formats or define your own format using the User Defined
Format option function (Option
VGA)
Option SD/HD
3
All the resolutions are selectable regardless of theselected
timing standard or refresh rate.
3
Option VGA
3
4. (Option VGA)
To add a new user-defined format, select User Defined Format and click Add. To edit a
user-defined formatselect User
Defined Format and click
Edit. The User Defined Format
window appears. Enter the appropriate values for the horizontal and vertical parameters. To
save your new format, enter a
name in the Format Name field
and click Save.
4
To delete a user defined format,
select the User Defined format
and click Delete.
VM5000 Automatic Video Measurement Set User Manual
2- 25
Operating Basics
5. Select the appropriate
Color Space (Option SD/HD)
or
Refresh Rate (Option VGA).
6. Select the appropriate timing
standard for the signal
(Option VGA).
2- 26
Option SD/HD
5
Option VGA
5
6
Option VGA
H
DMT: The Display Monitor Timing standards and guidelines are used for
lower resolutions or refresh rates that are in common industry use in lower
performance systems.
H
CVT: The Coordinated Video Timing standard is a method for generating a
consistent and coordinated set of standard format formats, display refresh
rates, and timing specifications for computer display products, both those
employing CRTs and those using other display technologies. CVT addresses
problems found in GTF.
H
CVT--R: The Coordinated Video Timing Reduced Blanking standard is
designed for use with non--CRT displays that can accept reduced horizontal
blanking times.
H
GTF: The Generalized Timing Formula standard is a method for generating
general purpose display timings and new formats. This allows much greater
flexibility in the choice of refresh rates and pixel formats than currently
available with discrete monitor timings. GTF enables new formats and
refresh rates to be developed, but is based on some set parameters to improve
the likelihood of interchange.
VM5000 Automatic Video Measurement Set User Manual
Operating Basics
If a timing standard or refresh rate is not available for the selected resolution,
then the timing standard or refresh rate is grayed out. Select the resolution,
refresh rate, and the timing standard for the signal you are measuring. If a
resolution is selected and the currently selected refresh rate is not available in the
selected resolution, the refresh rate will automatically change to the default value
of 60 Hz. A message informs of the change. If a resolution is selected and the
currently selected timing standard is not available for the selected resolution, the
timing standard will automatically change to a supported timing standard in the
order of CVT, DMT, and GTF. A message informs you of the change.
Selecting the Measurements
1. On the menu bar, click
Configuration >
Measurements.
Option SD/HD
1
2. Select from
one to eight measurements
(Option SD/HD)
Option VGA
1
Option SD/HD
2
OR
one to twelve
measurements
(Option VGA),
Option VGA
2
in any combination.
VM5000 Automatic Video Measurement Set User Manual
2- 27
Operating Basics
Setting the Measurement Run Operations
1. Select
Configuration > Operation.
1
2. The instrument displays the
Operations window. These
settings control how the
instrument sets up and acquires
measurements when you click
Run.
Option VGA
Option SD/HD
1
Option SD/HD
2
Option VGA
2
3. Select how the instrument sets
up and runs the measurements.
3
2- 28
VM5000 Automatic Video Measurement Set User Manual
Operating Basics
H
Setup & Run: Configures the instrument setting and takes a measurement, for each selected
measurement, and for each measurement acquisition. Use this when taking multiple measurements that require different instrument setups.
H
Setup Only: Configures the instrument for a measurement but does not take the measurement.
Use this to set up customized settings. Try out your settings by pressing the Run button, make
adjustments as needed (for example, change the horizontal scale), and then select the Run
button again. Once you are satisfied with your customizations, use the Run Only setting to
collect results. Setup Only is not selectable for certain measurements like H Sync, V Sync,
Noise Inj Ratio, V Timing, and Video Transient as they need multiple settings for the oscilloscope and MIU.
H
Run Only: Takes a measurement using the existing instrument configuration. Designed for
taking measurements with custom settings (see Setup Only description above).
4. Select how the application
acquires measurements (run
mode).
4
H
Once takes each selected measurement the number of times determined by the averaging
setting, then stops taking measurements.
H
Continuously continually takes measurements. You must select the Stop button to stop
measurements.
H
Once & Report takes each selected measurement the number of times determined by the
averaging setting, presents the report, and stops taking measurements.
VM5000 Automatic Video Measurement Set User Manual
2- 29
Test Equipment Depot - 800.517.8431 - 99 Washington Street Melrose, MA 02176 - FAX 781.665.0780 - TestEquipmentDepot.com
Operating Basics
5. Auto Scale fits the signal within
the available vertical scale.
Auto Scaling adjusts the
vertical scale units so that the
input signals fill the graticule as
much as possible.
Auto Scaling occurs once for
each selected measurement.
Select the Enabled checkbox to
enable waveform Auto Scale.
Clear the Enabled check box to
disable waveform autoscaling.
5
In the initial values pane, there
are three settings:
Last Meas, Last Recalled,
and Restore Default.
2- 30
H
Last Meas.: is the default. When selected, the values from the last measurement will be used at
the start of the next Auto Scale step.
H
Last Recalled: when selected, the values recalled with the last recalled setup will be used at
the start of the next Auto Scale step. If a setup (File > Recall Setup) has not been recalled since
the program was started, it will load the Auto Scale settings from the last power up.
H
Restore Default: when selected, the Factory Default Auto Scale starting points will be used at
the start of the next Auto Scale step. See page 3--7 for details.
VM5000 Automatic Video Measurement Set User Manual
Operating Basics
6. (Option SD/HD) Select which
instrument channel has the sync
signal for triggering.
6
If you use the wrong trigger
channel (and Signal Warnings is
on), you will get a signal warning. See the setup diagrams and
trigger requirements on
page 2--3.
7. (Option VGA) Choose the Line
Select setting as appropriate. In
Single Line mode, each measurement is made on a single
line (for example, line 153). In
Multi Lines mode, measurements are made across a range
of lines (for example, lines
153--185).
7
H
Single Line takes each selected measurement on the line specified in the Line Number field of
the Results window.
H
Multi Lines takes each selected measurement across a range of lines. You acquire measurements across multiple lines by specifying the starting and the ending line numbers. When Multi
Lines is selected, the Generate Report button in the Utilities > Generate Report panel is not
selectable. Also when Multi Lines is selected, in the Run Mode operation settings only Once &
Report is selectable and report is generated based on the configuration set in the Utilities >
Generate Report. The Results Summary panel is not accessible when Multi Lines is selected.
For more information, see Taking Measurements Across Multi Lines, on page 2--44.
8. (Option VGA) Select Use MIU
to automatically route H and V
signals to the CH 4 output
depending on the selected
measurements.
8
VM5000 Automatic Video Measurement Set User Manual
2- 31
Operating Basics
9. (Option VGA) The specified
polarities for the H Sync and V
Sync signals vary between the
timing standards. In the absence
of the MIU and with Auto Detect selected, the VM5000 will
prompt you to connect the H
and V Sync signals to determine the polarities. If you use
the MIU, the VM5000 will automatically determine the H and
V Sync polarities.
Once the sync signal polarities
are determined, the measurement cycle begins. This “polarity test” is performed at the beginning of every measurement
cycle. To prevent this test from
running at the beginning of every measurement cycle, take
any measurement once with
Auto Detect selected. Once a
measurement cycle has been
completed with Auto Detect
selected, you can deselect
Auto Detect. The VM5000 remembers the polarity of the
sync signals. Any time you
change the format set-up for the
device-under-test, you should
complete a measurement with
Auto Detect selected.
10.In the Report Mode pane, select
Embed Screen Capture to
include a snapshot of the
waveform display in the results
report in RTF format only.
2- 32
9
10
VM5000 Automatic Video Measurement Set User Manual
Operating Basics
Setting the Measurement Warnings
1. On the menu bar, click
Configuration > Warnings.
1
2. The instrument displays the
Warnings view. These settings
control how the instrument sets
up the Warning Types Reported
and the Control Options when
you select the Run button.
Option VGA
Option SD/HD
1
2
3. Select the warning messages to
report when a warning occurs.
See page 3--7 for more
information.
4. Select how to report warning
messages by selecting the check
boxes in the control options
pane. Messages can be
displayed in a window or
logged to a file.
3
4
If Log Warnings To File is selected, the warnings are written to the Log.txt file (Option SD/HD at
C:\VM5000TV or Option VGA at C:\VM5000PC). Warnings are appended to the Log.txt file until it
reaches 1 MB in size. At that point, it is renamed LogOld.txt and a new Log.txt file is created. If the
new file reaches 1 MB in size, it will be renamed LogOld.txt and will be written over the existing
LogOld.txt file. If you wish to save the data in the LogOld.txt file, you must save the file under a
different name before it is overwritten.
VM5000 Automatic Video Measurement Set User Manual
2- 33
Operating Basics
Setting Reference and Limits Options
When you run a measurement relative to a reference, the VM5000 (Option
SD/HD) or VM5000PC (Option VGA) runs the measurements and displays the
difference between the measurement and the reference value. The reference
values are stored in a reference file. Limit Testing provides a Pass/Fail indication
by comparing the measured value to limit values. The limit values are maximum
and minimum values that are stored in limit files.
NOTE. The default reference file (or default limits file) is provided as is without
warranty of any kind, and is intended to be used as a template only.
WARRANTIES OF MERCHANTABILITY AND FITNESS FOR A PARTICULAR
PURPOSE ARE EXPLICITLY DISCLAIMED.
1. Select Configuration >
Reference & Limits.
1
2. The instrument displays:
the Relative Result Display
and the Limit Testing in the
Configuration display view.
2- 34
Option VGA
Option SD/HD
1
2
VM5000 Automatic Video Measurement Set User Manual
Operating Basics
3. When you select Enable
Relative Result Display, the
VM5000 enables
Reference Selection to select a
reference file. For more details,
see page 3--60.
3
Capture Result as Reference
saves measurements to a
reference file using the actual
measured values as the
reference values. For more
details, see page 3--64.
4. Select Enable Limit Testing to
enable pass/fail testing. When
limit testing is enabled, the
choices under Limits Selection
are used to specify the limits
file used. By default, the
VM5000 application
automatically selects a limits
file, from a set of supplied
templates, matched to the
selected signal format. For more
details, see page 3--64.
4
When you select the
Stop on Limit Testing Failure
option, the test stops when the
limit testing fails.
VM5000 Automatic Video Measurement Set User Manual
2- 35
Operating Basics
Displaying the Input Signal as a Picture
The VM5000 will display a picture of the input signal for Options SD, HD, and
VGA.
1. Click the picture button.
2. This launches the video monitor
window. The instrument displays the picture. Click the
maximize button to expand the
picture to full screen.
1
Option SD/HD
2
Option VGA
2- 36
VM5000 Automatic Video Measurement Set User Manual
Operating Basics
Changing Picture Display Settings
Option SD/HD
You can change the settings for the Picture and Vector displays as follows:
1. Select
Configuration >
Picture & Vector.
1
2. The instrument displays the
Picture & Vector panel. These
settings control the display
parameters of the picture and
vectorscope displays.
3. Line Number sets the video line
number that is displayed in the
vectorscope display or highlighted in the picture display.
2
3
Use the line number to identify
features in the picture. To
remove the line, set the line
number to a line outside the
active video. Note that the line
number on the Picture & Vector
tab is not used to specify where
measurements are taken.
VM5000 Automatic Video Measurement Set User Manual
2- 37
Operating Basics
4. Sets the width to height ratio of
the picture display based on the
format.
4
Auto is the default. Auto
determines the aspect ratio of
the video signal and sets the
picture display accordingly
The 4x3 setting is for
SD format and
16x9 is for HD format.
5. Sets the Graticule and the Scale
of the Vector Display.
2- 38
5
5
VM5000 Automatic Video Measurement Set User Manual
Operating Basics
Displaying the Input Signal in a Vectorscope Window for Option SD/HD
The VM5000 can display the input signal in a vectorscope window so that you
can quickly see the color range of the signal.
The vectorscope displays the chrominance (coloring) portion of the video signal.
The amplitude and the phase are the two important parameters of the
chrominance signal that lead to noticeable picture problems. The phase is
relationship between the chrominance signal and the reference burst on the
video. The processing within a vectorscope and the display of the processed
signals is designed to detect and evaluate both phase and gain distortions of the
chrominance. Each bar of the video signal creates a dot on the vectorscope’s
display. The position of these dots relative to the targets, on the graticule and
phase of the burst vector are the indicators of the chrominance signal’s health.
The vectorscope’s display is created by decoding the chrominance portion of the
video signal into its two components, B--Y and R--Y. These two signals are then
plotted against each other in an X--Y fashion, with B--Y on the horizontal axis
and R--Y on the vertical axis. Three color bars signals are used with vectorscopes
75% and 100% full field color bars and the SMPTE color bars. The 100% and
75% labels refer to the amplitude of the signal.
1. Select
Configuration >
Picture & Vector.
1
2. The instrument displays the
Picture & Vector tab which
provides access to the picture
and vectorscope settings.
2
VM5000 Automatic Video Measurement Set User Manual
2- 39
Operating Basics
3. Sets the video line number that
is displayed in the vectorscope
display.
3
Note that the line number on
the Picture & Vector tab is not
used to specify where
measurements are taken.
4. Sets the Graticule and the Scale
according the video signal
format.
4
4
Auto is the default setting in
Graticule. This setting can be
either HD or SD depending on
the format selected.
5. Click the vector button.
6. This launches the video monitor
display window. Click the
maximize button to expand the
vectorscope display to full
screen.
2- 40
5
6
VM5000 Automatic Video Measurement Set User Manual
Operating Basics
Taking and Viewing the Measurement Results
Ensure that you select a signal format, select one or more measurements, and configure the run options
before you run a measurement.
1. Select the Run button.
The instrument begins taking
measurements and displays the
measurement results for the
recently taken measurement.
1
Option SD/HD
1
Option VGA
1
VM5000 Automatic Video Measurement Set User Manual
2- 41
Operating Basics
2. The instrument displays the
Results Summary window
when two or more
measurements are selected. The
results are displayed as Pass or
Fail if Limit Testing is enabled.
Option SD/HD
2
Option VGA
2
2- 42
VM5000 Automatic Video Measurement Set User Manual
Operating Basics
3. To view the detailed results for
the measurements, select the
Results menu and any one of
the selected measurements.
Option SD/HD
3
3
Option VGA
3
3
4. If you set the run operation to
Continuously, press the Stop
button to stop taking
measurements.
4
VM5000 Automatic Video Measurement Set User Manual
2- 43
Operating Basics
Taking Measurements Across Multiple Lines
Option VGA
To take measurements across multiple lines, you must set the Line Select mode
to Multiple Lines. When the Multiple Lines mode is enabled, you select the
measurements and the lines on which the measurements are taken from the
Multi Lines tab.
When Line Select is set to Multiple Lines, measurement results are automatically
saved to a file. To view the results of multiple line measurements, you must use
an external application. The Results Summary panel is not accessible when Multi
Lines is selected.
1. After setting Line Select to
Multiple Lines in the Operations panel, select
Configuration > Multi Lines
1
Select the measurements you
want to take. Enter the Start
Line and End Line values for
each measurement.
2- 44
VM5000 Automatic Video Measurement Set User Manual
Operating Basics
Changing Line Number or Averaging on the Results Screen
You can change the video signal line number and the number of measurement to
average before displaying the results. The instrument stops measuring, changes
the results to dashes, and uses the new settings at the start of its next measurement cycle. See page 3--17 for information on line numbers and averaging.
1. Select a measurement from the
Results menu. For example,
click Results > Color Bars
Option SD/HD
1
The instrument displays the
Color Bars measurement
results.
Option VGA
1
VM5000 Automatic Video Measurement Set User Manual
2- 45
Operating Basics
2. To change a value, select the
field and enter a value by keyboard. You can also change
values using one of the
methods outlined in step 3 and
step 4.
3. Select the keypad icon to the
left of the field to display a
virtual keyboard to enter values
using the touch screen.
2
4
3
3
4. Use the indicated general
purpose knob to change the
values.
2- 46
VM5000 Automatic Video Measurement Set User Manual
Operating Basics
Saving Measurement Setups
1. Select File > Save Setup.
The application displays the
Save dialog box.
1
Option SD/HD
The default save location for
Option SD/HD is
C:\VM5000TV.
Option VGA
The default save location for
Option VGA is C:\VM5000PC.
2. Select the Look in list to
navigate to a different directory
other than the default save
location.
2
VM5000 Automatic Video Measurement Set User Manual
2- 47
Operating Basics
3. Enter a file name in the File
Name box. The instrument offers an available file name
(or you can choose your own).
It automatically appends .vmset
to the file name of measurement
setup files.
3
4
4. Select Save to save the
measurement settings.
2- 48
VM5000 Automatic Video Measurement Set User Manual
Operating Basics
Recalling Measurement Settings
1. Select File > Recall.
1
2. The application displays the
Recall dialog box and lists all
the instrument setting files
present in the default directory
Option SD/HD
2
Option SD/HD default
directory:
C:\VM5000TV
Option VGA
2
Option VGA default directory:
C:\VM5000PC.
VM5000 Automatic Video Measurement Set User Manual
2- 49
Operating Basics
3. Select the Look in:
drop-down list to navigate to a
different directory other than
the default location.
3
4
4. Select a file from those listed.
5. Enter a file name in the
File name box or select a file
from the list.
5
6
6. Select Open to load the settings
file and configure the
instrument.
2- 50
VM5000 Automatic Video Measurement Set User Manual
Operating Basics
Saving Measurement Results (Reports)
You can use the Generate Report feature to save your measurement results.
1. Select
Utilities > Generate Report.
1
2. The instrument displays the
Utilities: Generate Report view.
Option SD/HD
2
Option VGA
2
3. Select a report format. Which
format you to select depends on
what you want to do with the
measurement results.
Option SD/HD
3
VM5000 Automatic Video Measurement Set User Manual
Option VGA
3
2- 51
Operating Basics
H
RTF: Use RTF (Rich Text Format) to create results data that you can incorporate into
documents.
H
PDF: Use PDF (Portable Document Format) to create files of the measurement data for
distribution and viewing.
H
CSV VM5000 (Option SD/HD) or CSV (Option VGA): Use CSV VM5000 (Comma-Separated Values), to save results in a format that contains information on all the new measurements
and options. For example, Relative to Reference and Limit Testing results are included in the
report.
H
CSV Legacy (Option SD/HD) -- Original format for Version 1 of the software. It is provided
for compatibility for customers who use a Microsoft Excel spreadsheet macro to process the
file.
4. Use the File Name box to
specify where you want to save
the report. Use the Browse
button to navigate to a specific
location. Use the Get Default
button to reset the file name to
the default location and name
for the selected format.
5. Use the Description field to add
notes into the report file. You
can enter up to 46 characters.
For example:
“Serial Number 123456789012
tested by Joe P.”
6. Use the Measurements option
button to select which
measurements to save to a
report.
2- 52
4
Option SD/HD
Option VGA
4
5
6
H
All: Creates a report with all the measurements you have run since starting the application
which have valid results in the results panels.
H
Selected: Creates a report with only the measurements that are currently selected in the
Configuration> Measurements screen and that have valid results in the results panels.
VM5000 Automatic Video Measurement Set User Manual
Operating Basics
7. Select Generate Report to save
the measurement results to the
specified format and location.
All selected measurements are
saved together in a single file;
each measurement has its own
area in the report.
7
When Multi Lines is selected,
the Generate Report button in
the Utilities > Generate Report
is not selectable.
VM5000 Automatic Video Measurement Set User Manual
2- 53
Reference
Test Equipment Depot - 800.517.8431 - 99 Washington Street Melrose, MA 02176 - FAX 781.665.0780 - TestEquipmentDepot.com
Reference Overview
This chapter provides a detailed description of the VM5000 instrument menus
and measurements.
H
Menu descriptions. Table 3--1 below lists the top level menus of the
instrument and the corresponding sections in this chapter that document
those menus. The menu descriptions include high-level descriptions of the
measurements.
H
Measurement details. In-depth descriptions of each measurement begin
page 3--27.
Table 3- 1: Overview of menu descriptions
Menu
Submenu
Function
Page
File
Recall Default Setup
Restores default settings of the application.
3-- 3
Recall Setup...
Recalls (load) application settings that have been
previously saved on the hard disk.
Save Setup...
Saves (write) current application setting to hard disk.
Minimize
Minimizes the application to the Windows task bar.
Exit
Opens the application Exit dialog box.
Format
Sets the input signal format.
Measurements
Selects the measurements.
Operations
Sets the measurement runtime options.
Warnings
Sets the type of warning reported.
Reference & Limits
Sets the Reference and the Limit Testing related
options.
Picture and Vectorscope (Option SD/HD)
Sets the settings related to the Picture and
vectorscope display of the video signal.
Multi Lines (Option VGA)
Takes each selected measurement on a range of line
numbers.
Configuration
VM5000 Automatic Video Measurement Set User Manual
3-- 5
3- 1
Reference Overview
Table 3- 1: Overview of menu descriptions (Cont.)
Overview of menu descriptions
Menu
Submenu
Function
Results
Summary
Displays the result summary for all the measurements. 3-- 16
Channel Delay, Color Bars,
Frequency Response, Multiburst, Noise,
Non Linearity, Short Time Distortion, and
Sync (Option SD/HD)
Adjusts the individual measurement settings and
display the results..
Ch-- Ch Mismatch, Ch-- Ch Skew,
Color Bars, H Sync, H Sync Jitter,
H Timing, Linearity, Luma Levels,
Noise Inj Ratio, V Sync, V Timing, and
Video Transient (Option VGA)
Adjusts the measurement specific settings and display
the results.
Utilities
Generate Report
Configures the report generation related setting and
manually generate reports to a specified file format.
3-- 25
Help
Help Topics
Opens the VM5000 online help system.
3-- 26
About VM5000...
Displays the application version number.
3- 2
Page
VM5000 Automatic Video Measurement Set User Manual
Menu Descriptions
The following tables list each menu item and its functions. Items in bold face
are the default application settings when you first start the application or after
you do a Recall Default or Recall Setup... operation.
File Menu
Recalling a setup file changes the configuration; current measurements will stop
execution and the results appear as dashes.
CAUTION. To avoid losing unsaved measurement results, generate a report before
you recall the default setup or another .vmset setup file.
Menu Item
Function
Recall Default
Setup
VM5000 recalls (loads) and applies the default settings of the application.
Setting or field
Recall Setup...
Description
Recalls (loads) and applies application settings that have been
previously saved on the hard disk.
Look in
Drop-down menu
Specifies the directory listed in the File list area.
(Option SD/HD) default location is C:\VM5000TV
(Option VGA) default location is C:\VM5000PC
File list area
Filename list field
Lists directories (folders) and setup files that are in the current
directory (as set by Look in).
File name
Text entry field
Field in which to enter an application setup file to load and apply.
You can also double-click on a file name in the File list area to
enter the name in the File Name field.
Files of type
Drop-down list box
Lists the valid setup file types. The only valid entry is .vmset.
To get valid test results, be sure to choose the appropriate setup
file for the signal source you are using.
Option SD/HD: For example, for the Matrix signal source file
Tek1080iMatrix.trp, be sure to use the Tek1080iMatrix.vmset
setup file. The correct .vmset setup file will have the correct line
numbers for each measurement as the default
Option VGA: For example, for the Matrix signal source file
Matrix.bmp, be sure to use the Matrix.vmset setup file. The
correct .vmset setup file will have the correct line numbers for
each measurement as the default..
VM5000 Automatic Video Measurement Set User Manual
3- 3
Menu Descriptions
Menu Item
Save Setup...
Function
Setting or field
Description
Open
Loads and applies the specified instrument setting file.
Cancel
Closes (exits) the Recall dialog and does not load or apply any
settings.
Saves (writes) the current application measurement settings to the specified file name and directory.
All of the Save dialog functions are the same as those for the Recall dialog except for the Save button.
Save
Saves the application measurement settings to the specified file
directory (as set by Look in) and file name (as entered in the File
name field) as file type .vmset.
Minimize
Minimizes the application to the Windows task bar.
Exit
Opens the application Exit dialog box.
3- 4
VM5000 Automatic Video Measurement Set User Manual
Menu Descriptions
Configuration Menu
Option SD/HD
In the configuration menu you can set the format of the input signal, select one
or more measurements, set the setup mode, run mode, set the warning options,
enable reference and limit testing, and set Picture and Vector display parameters.
All the selected measurement results will appear as dashes any time you change
any of the following configurations:
H
Format
H
Color Space
H
Trigger
If you change a configuration while running a measurement or a setup, the
measurement or setup will stop.
Recalling a setup file changes the configuration; current measurements will stop
and results appear as dashes.
CAUTION. To avoid losing unsaved measurement results, generate a report before
changing any configuration parameters other than selecting measurements or
turning warnings on or off.
Bold values in the Setting or field column in the following tables indicate the
default value.
Menu Item
Function
Format
Set the video input signal format. The Format setting also affects other measurement settings, such as the video
signal line number to use when taking measurements.
Format
Setting or field
SD option
480I / 60
480P / 60
576I / 50
576P / 50
Description
Set the input signal format.
HD option
720P / 50
720P / 60
1080P / 24
1080I / 60
1080I / 50
Color Space
YPbPr
RGB
VM5000 Automatic Video Measurement Set User Manual
Set the input signal color space type.
3- 5
Menu Descriptions
Menu Item
Function
Measurements
Select the video signal measurements to take. You can select from one to eight measurements, in any
combination.
Measurements
Operation
Setting or field
Channel Delay
Color Bars
Frequency Response
Multiburst
Noise
Non Linearity
Short Time Distortion
Sync.
Description
Select from one to eight measurements, in any combination.
When you click Run, the selected measurements will be taken.
The result of the selected measurements will be included in any
report that you generate. Click Utilities > Generate Report and set
Measurements to Selected.
For more information see Detailed Measurement Information on
page 3-- 27. For a high-level overview of measurements, see
Results Menu on page 3-- 16.
Set the measurement runtime options, including test run mode, input trigger channel, and warning message
display.
Setup And/Or
Run
Setup & Run
For each selected measurement, and for each measurement
acquisition, this setting automatically configures the instrument
settings and takes a measurement. Use this when taking multiple
measurements that require different instrument setups.
Setup Only
The application configures the instrument for a measurement but
does not take the measurement. Use this to set up customized
settings. Customized settings might include changes to the
instrument Horizontal or Vertical front panel controls to display
and measure a non-supported video signal standard.
Click Run to try out the settings, make adjustments as needed
(for example, change the horizontal scale), and then click Run
again. Once you are satisfied with the customizations, use the
Run Only setting to collect results.
3- 6
Run Only
This setting uses the current instrument and application settings
to take a measurement. Use this for taking measurements after
you setup the instrument by using Setup Only to create custom
settings.
Run Mode
Once
The application takes each selected measurement the number of
times required for the average you have selected, and then stops
taking measurements.
Run Mode
Continuously
This setting continually takes measurements, in the order the
measurements are listed in the Configuration > Measurements
view. Select Stop to stop measurements.
Once & Report
The application takes each selected measurement the number of
times determined by the averaging setting, then stops taking
measurements and generates a report.
VM5000 Automatic Video Measurement Set User Manual
Menu Descriptions
Menu Item
Function
Setting or field
Auto Scale
Enabled
Description
Select the Enabled check box to enable waveform autoscaling.
Deselect the Enabled check box to disable waveform autoscaling.
In the selection Initial Values, there are three settings: Last
Meas., Last Recalled, and Restore Default. Last Meas. is the
Initial Values—Last Meas, default. When selected the values from the last measurement will
be used at the start of the next Auto Scale step. Last Recalled
Last Recalled,
when selected, the values recalled with the last recalled setup will
Restore Default
be used at the start of the next Auto Scale step. If a setup (File >
Recall Setup) has not been recalled since the program was
started, it will load the Auto Scale settings from the last power up.
Restore Default when selected, the Factory Default Auto Scaling
adjusts the vertical scale units so that the input signals fill the
entire graticule as much as possible without going out of range.
Auto Scaling occurs once for each selected measurement.
If you are using custom instrument settings (for example,
changes to Vertical or Horizontal settings made from the
instrument front panel or from remote GPIB commands), you
should turn Auto Scaling Off.
If you are sure your signal is set up correctly and you want to
make further measurements in a high speed production line, set
Auto Scale to Off.
Trigger
Channel 4
Channel 1
This setting sets the input channel on which to trigger the
instrument. Refer to the setup illustrations starting on page 2-- 2
for appropriate trigger channel settings.
Warning
Types Reported
Measurement Warnings
Signal Warnings
Results Warnings
Set the warning messages to pop up dialog boxes on the
instrument screen while taking measurements. All warning
messages are selected by default. Clear them to disable warning
messages.
Measurement warnings include the most general information
about potential problems in taking the measurement. Signal
warnings appear if signals either change or are absent. If there
are some valid results, Results Warnings lets you know that
some of the displayed results may not be valid. Results Warnings
also shows you the types of test results that are included in the
report you have just generated.
If warnings are selected, message boxes may appear on screen,
requiring you to click OK. To avoid interruptions to your testing,
clear all the Warning reporting.
VM5000 Automatic Video Measurement Set User Manual
3- 7
Menu Descriptions
Menu Item
Function
Setting or field
Description
Control Options
Pop Up Warning Details
Log Warnings to File
Control Options determines whether warnings are displayed or
logged to a file. When any one of the Warning Types Reported is
selected, Control Options is enabled.
If Log Warnings to File is checked, the warnings are written to a
file named Log.txt. Warnings are appended to the Log.txt file until
it reaches 1 MB in size. At that point, it is renamed LogOld.txt
and a new Log.txt file is created. If the new file reaches 1 MB in
size, it will be renamed LogOld.txt and be written over the
existing LogOld.txt file. If you wish to save the data in the
LogOld.txt file, you must save the file under a different name
before it is overwritten.
If Pop Up Warning Details is selected, then a message box
appears on the screen. To avoid interruptions to your testing,
clear all the Warning reporting.
Reference &
Limits
Sets the measurement or measurements options to Relative Result Display, and Limit Testing.
Relative Result
Display
Reference
Selection
Enable Relative Result
Display
Selecting Enable Relative Result Display enables the Relative to
Reference testing.
Capture Results as
Reference
This is a fast and easy way to create a reference file.
Default
Select Default to automatically load the Tektronix reference file.
The only valid entry is .csv. The actual file can be a text file if it is
formatted as a comma-- separated-- value file.
To get valid test results, be sure to choose the appropriate
reference file. The correct .csv reference file will have the
appropriate values for each of the measurements.
Reference &
Limits
Limit Testing
Manual
Select Manual to enable the user defined Select Reference File.
Select Reference File...
Click Select Reference File to open the file chooser to browse
and select the file. Without selecting the reference file, the
measurement will run without producing valid relative results. A
reference file can still be loaded after a measurement completes
to produce relative results for the latest measured values.
Enable Limits Testing
Selecting Enable Limit Testing enables Pass/Fail testing.
Stop on Limit Testing Error Check the Stop on Limit Testing Error option to cause the
software to stop testing when a measured value falls outside the
defined limits.
Limit Selection
3- 8
Default
Select Default to automatically load the Tektronix limit file.
VM5000 Automatic Video Measurement Set User Manual
Menu Descriptions
Menu Item
Function
Setting or field
Description
Manual
Select Manual to enable user-- defined select limit File.
Select Limits File...
Click Select Limit File to open the file chooser to browse and
select file. Without selecting the limit file, the measurement will
run producing valid relative results during continuous mode. A
limit file can still be loaded after a measurement completes to
produce valid results for the latest measured values.
NOTE. The Default Reference file (or Default Limit file) is provided AS IS
without warranty of any kind, and is intended to be used as a template only.
WARRANTIES OF MERCHANTABILITY AND FITNESS FOR A PARTICULAR
PURPOSE ARE EXPLICITLY DISCLAIMED.
Menu Item
Function
Picture & Vector
Select the display type to either Picture, Vector, or Noise spectrum. The Picture and Vector displays will stop
measurements when they are displayed. The measurement continue to run only when Spectrum is displayed.
Setting or field
Aspect ratio
Graticule
Scale
Auto
Set the width to height ratio of the picture frame to auto mode.
Auto is the default. This setting can be either HD or SD
depending on the input format selected.
4X3
Set the width to height ratio of the picture frame to 4:3.
16X9
Set the width to height ratio of the picture frame to 16:9.
Auto
Set the graticule of the vector display to auto mode. Auto is the
default setting in Graticule. This setting can be either HD or SD
depending on the input format selected.
SD
Set the graticule of the vector display to SD colorimetry.
HD
Set the graticule of the vector display to HD colorimetry.
Auto
Set the scale of the vector display to auto mode.
75%
Set the scale of the vector display to 75% bars.
100%
Set the scale of the vector display to 100% bars.
Line Number
Option VGA
Description
Set the Line Number for the line select in the Picture display or
the one line displayed in the Vectorscope display.
All the selected measurement results will appear as dashes any time you change
any of the following configurations:
H
Resolution
H
Refresh Rate
H
Timing Standard
VM5000 Automatic Video Measurement Set User Manual
3- 9
Menu Descriptions
If you change a configuration while running a measurement or a setup, the
measurement or setup will stop.
Recalling a default setup or recalling setup using setup file changes the
configuration; current measurements will stop execution and results appear as
dashes in the Results window.
CAUTION. To avoid losing unsaved measurement results, generate a report before
you change any configuration parameters other than selecting measurements or
turning warnings on or off.
Bold values in the Setting or field column in the following tables indicate the
default value.
Command
Function
Format
Set the video input signal format. The Format setting also affects other measurement specific settings, such as the
video signal line number to use when taking measurements.
3- 10
Setting or field
Description
Resolution
640x480
800x600
1024x768
1280x1024
1600x1024
1600x1200
1920x1080
1920x1200
1920x1440
2048x1536
2048x2048
Sets the video signal resolution for the input signal you intend to
measure.
Refresh Rate
50 Hz
60 Hz
65 Hz
70 Hz
72 Hz
75 Hz
76 Hz
85 Hz
100 Hz
120 Hz
Sets the refresh rate for the signal that you intend to measure.
Note that all refresh rates are not available at all times; the
selectable refresh rate depends on the currently selected
resolution.
Timing
DMT
CVT
CVT-- R
GTF
Sets the timing standard available for the input signal that you
intend to measure.
User Defined
Format
User Defined Format
Sets the user defined formats available for the input signal that
you intend to measure.
List box
Lists the User Defined Formats available.
Add
Creates a new User Defined Format.
VM5000 Automatic Video Measurement Set User Manual
Menu Descriptions
Command
Measurements
Function
Description
Edit
Modifies the selected User Defined Format.
Delete
Deletes the selected User Defined Format.
Select the video signal measurements to take. You can select from one to twelve measurements, in any
combination.
Measurements
Operations
Setting or field
Ch–Ch Mismatch
Ch–Ch Skew
Color Bars
H Sync
H Sync Jitter
H Timing
Linearity
Luma Levels
Noise Inj Ratio
V Sync
V Timing
Video Transient
Select from one to twelve measurements, in any combination.
When you click Run, the selected measurements will be taken.
For more information see Detailed Measurement Information on
page 3-- 27.
For a high-level overview of measurements, refer to Results
Menu on page 3-- 16.
Set the measurement runtime options, including test run mode, waveform autoscaling, line select setting, using
RGBHV Measurement Interface Unit accessory, sync polarity, and embed screen captures in report mode.
Setup And/Or
Run
Run Mode
Setup & Run
For each selected measurement, and for each measurement
acquisition, this setting automatically configures the instrument
settings and takes a measurement. Use this when taking multiple
measurements that require different instrument setups.
Setup Only
The application configures the instrument for a measurement but
does not take the measurement. Use this to set up customized
settings. Customized settings might include changes to the
instrument Horizontal or Vertical front panel controls to display
and measure a non-supported video signal standard.Click Run to
try out the settings, make adjustments as needed (for example,
change the horizontal scale), and then click Run again. Once you
are satisfied with the customizations, use the Run Only setting to
collect results.
Run Only
This setting uses the current instrument and application settings
to take a measurement. Use this for taking measurements after
you setup the instrument by using Setup Only to create custom
settings.
Once
The application takes each selected measurement the number of
times required for the average you have selected, and then stops
taking measurements.
Continuously
This setting continually takes measurements, in the order the
measurements are listed in the Configuration > Measurements
view. Select Stop to stop measurements.
Once & Report
The application takes each selected measurement the number of
times determined by the averaging setting, then stops taking
measurements and generates a report.
VM5000 Automatic Video Measurement Set User Manual
3- 11
Menu Descriptions
Command
Function
Setting or field
Description
Auto Scale
Enabled
Select the Enabled check box to enable waveform autoscaling.
Deselect the Enabled check box to disable waveform autoscaling.
Initial Values—
Last Meas,
Last Recalled,
Restore Default
Initial Values
Last Meas
Last Meas. is the default. When selected the values from the last
measurement will be used at the start of the next
Auto Scale step.
Last Recalled
Last Recalled when selected, the values recalled with the last
recalled setup will be used at the start of the next Auto Scale
step. If a setup (File > Recall Setup) has not been recalled since
the program was started, it will load the Auto Scale settings from
the last power up.
Restore Default
Restore Default when selected, the Factory Default
Auto Scaling adjusts the vertical scale units so that the input
signals fill the entire graticule as much as possible without going
out of range. Auto Scaling occurs once for each selected
measurement.
Auto Scaling occurs once for each selected measurement.
Line Select
Warnings
Single Line
Sets measurements to be taken on a single line.
Multi Lines
Sets measurements to be taken across a range of lines.
RGBHV MIU
Use MIU
Uses the RGBHV Measurement Interface Unit accessory.
Sync Polarity
Auto Detect
Automatically detects the V Sync polarity.
Report Mode
Embed Screen Capture
Embeds a screen shot of the waveform display into generated
reports.
Specifies whether or not warning messages are displayed or logged to a file.
Warning
Types Reported
3- 12
Measurement Warnings
Signal Warnings
Results Warnings
Specifies the type of warnings to be reported. All warnings are
selected by default. Clear them to disable warnings. Measurement warnings include general information about potential
problems in taking the measurement.
Signal warnings appear if signals either change or are absent. If
there are some invalid results, Results Warnings lets you know
that some of the displayed results may not be valid.
Results Warnings also shows you the types of test results that
are included in the report you have just generated. If warnings are
selected, message boxes may appear on screen, requiring you to
click OK. To avoid interruptions to your testing, clear all the
Warning reporting.
VM5000 Automatic Video Measurement Set User Manual
Menu Descriptions
Command
Reference &
Limits
Function
Setting or field
Description
Control Options
Pop Up Warning Details
Log Warnings to File
Control Options determines whether warnings are displayed or
logged to a file.
When any one of the Warning Types Reported is selected,
Control Options is enabled.
If Log Warnings to File is checked, the warnings are written to a
file named Log.txt. Warnings are appended to the Log.txt file until
it reaches 1 MB in size. At that point, it is renamed LogOld.txt
and a new Log.txt file is created. If the new file reaches 1 MB in
size, it will be renamed LogOld.txt and be written over the
existing LogOld.txt file. If you wish to save the data in the
LogOld.txt file, you must save the file under a different name
before it is overwritten.
If Pop Up Warning Details is selected, then a message box
appears on the screen. To avoid interruptions to your testing,
clear all the Warning reporting.
Sets the measurement or measurements options to Relative Result Display, and Limit Testing.
Relative Result
Display
Reference
Selection
Enable Relative Result
Display
Selecting Enable Relative Result Display enables the Relative to
Reference testing.
Capture Results as
Reference
This is a fast and easy way to create a reference file. Uses
current results as the basis for a new reference file.
Default
Select Default to automatically load the Tektronix reference file.
The only valid entry is .csv. The actual file can be a text file if it is
formatted as a comma-- separated-- value file.
To get valid test results, be sure to choose the appropriate
reference file. The correct .csv reference file will have the
appropriate values for each of the measurements.
Reference &
Limits
Limit Testing
Manual
Select Manual to enable the user defined Select Reference File.
Select Reference File
Click Select Reference File to open the file chooser to browse
and select the file. Without selecting the reference file, the
measurement will run without producing valid relative results. A
reference file can still be loaded after a measurement completes
to produce relative results for the latest measured values.
Enable Limits Testing
Selecting Enable Limit Testing enables Pass/Fail testing.
Stop on Limit Testing
Failure
Check the Stop on Limit Testing Failure option to cause the
software to stop testing when a measured value falls outside the
defined limits.
VM5000 Automatic Video Measurement Set User Manual
3- 13
Menu Descriptions
Command
Function
Setting or field
Description
Limits Selection
Default
Select Default to automatically load the Tektronix limits file.
Manual
Select Manual to enable user-- defined select limits File.
Select Limits File
Click Select Limits File to open the file chooser to browse and
select file. Without selecting the limit file, the measurement will
run producing valid relative results during continuous mode. A
limit file can still be loaded after a measurement completes to
produce valid results for the latest measured values.
Select Reference File
Click Select Reference File to open the file chooser to browse
and select the file. Without selecting the reference file, the
measurement will run without producing valid relative results. A
reference file can still be loaded after a measurement completes
to produce relative results for the latest measured values.
NOTE: The Default Reference file (or Default Limit file) is provided AS IS
without warranty of any kind, and is intended to be used as a template only.
WARRANTIES OF MERCHANTABILITY AND FITNESS FOR A PARTICULAR PURPOSE ARE EXPLICITLY DISCLAIMED.
Multi Lines
Sets, runs, and writes the result report to a file across a range of lines for each of the selected measurement.
Measurements on Multi Lines tab
Ch-Ch Mismatch
Ch-Ch Skew
Color Bars
H. Sync
3- 14
Start Line
Sets the start line number for the Ch-Ch Mismatch measurement.
Note the start line number should be less than or equal to the end
line number.
End Line
Sets the end line number for the Ch-- Ch Mismatch measurement.
Note the end line number should be greater than or equal to the
start line number.
Start Line
Sets the start line number for the Ch-Ch Skew measurement.
Note the start line number should be less than or equal to the end
line number.
End Line
Sets the end line number for the Ch-Ch Skew measurement.
Note the end line number should be greater than or equal to the
start line number.
Start Line
Sets the start line number for the Color Bars measurement. Note
the start line number should be less than or equal to the end line
number.
End Line
Sets the end line number for the Color Bars measurement. Note
the end line number should be greater than or equal to the start
line number.
Start Line
Sets the start line number for the H Sync measurement. Note the
start line number should be less than or equal to the end line
number.
End Line
Sets the end line number for the H Sync measurement. Note the
end line number should be greater than or equal to the start line
number.
VM5000 Automatic Video Measurement Set User Manual
Menu Descriptions
Command
Function
Setting or field
Description
H. Timing
Start Line
Sets the start line number for the H Timing measurement. Note
the start line number should be less than or equal to the end line
number.
End Line
Sets the end line number for the H Timing measurement. Note
the end line number should be greater than or equal to the start
line number.
Start Line
Sets the start line number for the Linearity measurement. Note
the start line number should be less than or equal to the end line
number.
End Line
Sets the end line number for the Linearity measurement. Note the
end line number should be greater than or equal to the start line
number.
Start Line
Sets the end line number for the Luma Levels measurement.
Note the end line number should be greater than or equal to the
start line number.
End Line
Sets the end line number for the Luma Levels measurement.
Note the end line number should be greater than or equal to the
start line number.
Start Line
Sets the end line number for the Video Transient measurement.
Note the end line number should be greater than or equal to the
start line number.
End Line
Sets the end line number for the Video Transient measurement.
Note the end line number should be greater than or equal to the
start line number.
Linearity
Luma Levels
Video Transient
VM5000 Automatic Video Measurement Set User Manual
3- 15
Menu Descriptions
Results Menu
Option SD/HD
The Results menu enables you to display a summary of measurement results or
display detailed results for a specific measurement.
If you change the Line Number or Average values for any measurement, or if
you change the Filter configuration in the Noise measurement, then the changed
measurement will stop running and its results will change to dashes.
All the selected measurement results will be invalidated any time you change
any of the following configurations:
H
Format
H
Color Space
H
Trigger
If you change a configuration while running a measurement or a setup, the
measurement or setup will stop. The Average setting interacts with your choices
for the Run Mode. For example, if you select Once for the Run Mode and you
set the averages to 2, then when you select the Run button, each selected
measurement will run twice and then stop. On the other hand, if you select
Continuously for the Run Mode and 2 averages, then when you select the Run
button, each selected measurement will run twice, display results, and then
continue running and updating the results for every two measurements.
For a detailed discussion of measurements, refer to page 3--27.
The following table lists the measurements that appear in the Results menu and
details the values that appear on the Results page for each measurement. Bold
values in the Setting or Field column in the following tables indicate default
values.
Menu item
Function
Summary
Shows the status during and after the selected measurements are measured in the summary panel. This is useful
when multiple measurements are selected to run.
Channel Delay
Measures the time variation between the three video channels. The instrument measures the crossings of all three
channels.
Channel Delay
Measurement
Setup
3- 16
Setting or Field
Description
Line Number
Sets the video signal line number to measure. The default value
depends on the input signal format as set by
Configuration > Format, and assumes that the appropriate Matrix
image file is being used to generate the test signal.
Average: 1
Sets the number of acquisitions over which to calculate an
average measurement value.
VM5000 Automatic Video Measurement Set User Manual
Menu Descriptions
Menu item
Function
Setting or Field
Results (ns)
Color Bars
Displays the time variation, in nanoseconds, from
channel 1 to channel 2, from channel 2 to channel 3, and from
channel 3 to channel 1.
Measures all eight color levels of the three video channels. The instrument locates and measures the back porch
signal of each channel, and then measures each channel’s color values relative to that channel’s back porch level.
Color Bar
Measurement
Setup
Line Number
Sets the video signal line number to measure. The default value
depends on the input signal format as set by
Configuration > Format, and assumes that the appropriate Matrix
image file is being used to generate the test signal.
Average: 1
Sets the number of measurements acquisitions over which to
calculate an average measurement value.
Results (mV)
Frequency
Response
Description
Displays eight color values, in mV, for each channel
(24 measurements total).
Measures the amplitude at selected time or frequency location of the input signal.
Frequency
Response Setup
Meas Location
Line Number
Sets the input signal line number to measure. The default value
depends on the input signal format as set by
Configuration > Format, and assumes that the appropriate Matrix
image file is being used to generate the test signal.
Average: 1
Sets the number of measurements acquisitions over which to
calculate an average measurement value.
Dist BW(MHz)
Sets the distortion bandwidth frequency.
Freq 4:4:4
When Meas Location is set to Freq 4:4:4, the measurement uses
the same frequency for the measurement location on all three
signals (CH1 (Y/G), CH2(Pb/B), and CH3(Pr/R)). This setting is
the best option for RGB (GBR) signals.
Freq 4:2:2
When Meas Location is set to Freq 4:2:2, the measurement uses
the full frequency for CH1 and half that frequency for CH2 and
CH3. This setting is the best option for YPbPr signals.
Time
When the Meas location is set to Time, the measurement reports
the waveform frequency at that specified time.
Freq (MHz)
Sets the measurement location frequency.
Time (s)
Sets the measurement location time.
Frequency
Response
Results
VM5000 Automatic Video Measurement Set User Manual
Displays the Flag Amplitude (mV), Frequency (MHz), Amplitude
(dB) with reference to the Flag, Time Position (s), and RMS
Distortion (% of Amp) of the video signal.
3- 17
Menu Descriptions
Menu item
Function
Multiburst
Measures the video channel frequency response and amplitude. The instrument measures the flag pulse on each
channel to determine and measure the six burst frequencies with the largest amplitude.
Multiburst
Measurement
Setup
Setting or Field
Line Number
Sets the video signal line number to measure. The default value
depends on the input signal format as set by Configuration >
Format, and assumes that the appropriate Matrix image file is
being used to generate the test signal.
Average: 1
Sets the number of measurements acquisitions over which to
calculate an average measurement value.
Multiburst
Measurement
Results
Noise
Displays the flag signal value (in mV) for each channel in the first
display row. The following six rows list the frequency (in MHz)
and amplitude (in dB) of each channel, for each of the six burst
signals.
Measures video signal noise using one of three filter settings.
Noise Measurement Setup
Filter
Noise at Cursor
Position
Results
3- 18
Description
Line Number
Sets the video signal line number. The default value depends on
the input signal format as set by Configuration > Format, and
assumes that the appropriate Matrix image file is being used to
generate the test signal.
Average: 1
Sets the number of measurements acquisitions over which to
calculate an average measurement value.
Off
Disables (turns off) all noise signal filtering. Use this setting to
measure broadband noise without any filtering.
Unified Weighting
Enables (turns on) unified weighting noise signal filtering. Use
this setting to measure noise with the psychovisual weighting
established by CCIR Recommendation (Rec) 576-- 2, adjusted for
the selected video format.
Unweighted w/
Bandwidth
Enables (turns on) unweighted noise signal filtering and activates
the filter bandwidth field. Use this setting to remove high
frequency noise from your signal.
Bandwidth Hz
Sets the bandwidth filter cutoff frequency. Selecting Unweighted
activates this field. The default value depends on the input signal
format as set by Configuration > Format.
Cursor (Hz)
Sets the Cursor frequency.
Y/G
Sets the channel for the Noise Spectrum measurement.
Spectrum
Displays Noise spectrum. The Noise measurement must be
selected and running continuously to display a noise spectrum. If
the Noise measurement is not running, this button is not
selectable.
Displays the noise measurement results for each channel in dB
(relative to peak white) and mV.
VM5000 Automatic Video Measurement Set User Manual
Menu Descriptions
Menu item
Function
Non Linearity
Measures channel signal linearity based on a ramp or five-step linearity test signal. If using a ramp signal, the
instrument divides the ramp signal into five values to determine the equivalent step values. The instrument then
measures the bottom, individual step, and top values of the test signal, and compares these values to a nominal
value to determine the percent of deviation of the test signal from the nominal signal.
Non Linearity
Measurement
Setup
Setting or Field
Line Number
Sets the video signal line number to measure. The default value
depends on the input signal format as set by Configuration >
Format, and assumes that the appropriate Matrix image file is
being used to generate the test signal.
Average: 16
Sets the number of measurements acquisitions over which to
calculate an average measurement value.
Results (%)
Short Time
Distortion
Displays the percent of deviation of the test signal from a nominal
signal value, as a percentage, for each step on each channel.
Measures the short time distortion of the input signal.
Short Time
Distortion Setup
Line Number
Sets the input signal line number to measure. The default value
depends on the input signal format as set by
Configuration > Format, and assumes that the appropriate Matrix
image file is being used to generate the test signal.
Average: 1
Sets the number of measurements acquisitions over which to
calculate the average measurement value.
Short Time
Distortion Results
Sync
Description
Displays the Rise Time (ns), Fall Time (ns), Overshoot (%),
Undershoot (%), Settling Time 1 (ns), and Settling Time 2 (ns) of
the video signal.
Measures the sync signal timing and voltage values. The instrument measures the sync signal rise and fall times
(at the 10% and 90% signal amplitude levels) and the sync pulse width (at the 50% signal amplitude level) to
determine the signal timing values.
Sync Measurement Setup
Line Number
Sets the video signal line number to measure. The default value
depends on the input signal format as set by
Configuration > Format, and assumes that the appropriate Matrix
image file is being used to generate the test signal.
Average: 1
Sets the number of measurements acquisitions over which to
calculate the average measurement value.
Measured on CH1
Results in better measurement accuracy when triggering on CH4.
Tri-Level
Sync Results
VM5000 Automatic Video Measurement Set User Manual
Displays the sync signal timing values in ns, and the signal levels
in mV. Results that are meaningless for bi-- level sync appear as
dashes.
3- 19
Menu Descriptions
Option VGA
If you change the Line Number or Average values for any measurement, then the
changed measurement will stop execution and its results will change to dashes.
All the selected measurement results will be invalidated any time you change the
following configurations:
H
Resolution
H
Refresh Rate
H
Timing
If you change a configuration that is recall a setup while running a measurement,
the measurement will stop execution.
The Average setting interacts with your choices for the Run Mode. For example,
if you select Once for the Run Mode and you set the averages to 2, then when
you select the Run button, each selected measurement will run twice and then
stop. On the other hand, if you select Continuously for the Run Mode and 2
averages, then when you select the Run button, each selected measurement will
run twice, display results, and then continue running and updating the results for
every two measurements.
For a detailed discussion of measurements, refer to page 3--27.
Values in bold text in the Setting or field column in the following tables indicate
default values.
Command
Function
Summary
The Summary window displays the status of the selected measurements when they are run. It also displays the
warnings, if any. The Summary window is useful when you run multiple measurements.
Ch–Ch Mismatch
The Ch-- Ch Mismatch is the difference in any steady-- state voltage amplitude between R,G, and B video outputs.
Ch–Ch Mismatch
Measurement
Setup
Ch–Ch Mismatch
Results
3- 20
Setting or field
Description
Line Number
Sets the video signal line number to measure. The default value
depends on the input signal format as set by
Configuration > Format, and assumes that the appropriate Matrix
image file is being used to generate the test signal.
Average
Sets the number of acquisitions over which to calculate an
average measurement value.
Displays the Ch–Ch mismatch between G to B, G to R, and
B to R channels of the video signal values in (mV) and in
(%)Peak-- Peak. Results are reported on the Measured tab, and if
enabled, on the Relative, Reference, and Limits tabs.
VM5000 Automatic Video Measurement Set User Manual
Menu Descriptions
Command
Function
Ch-- Ch Skew
Ch-- Ch Skew is the phase relationship (time delay) among R, G, and B video outputs of the graphics subsystem.
Ch-- Ch Skew
Measurement
Setup
Setting or field
Line Number
Sets the video signal line number to measure. The default value
depends on the input signal format as set by
Configuration > Format, and assumes that the appropriate Matrix
image file is being used to generate the test signal.
Average
Sets the number of acquisitions over which to calculate an
average measurement value.
Ch-- Ch Skew
Results
Color Bars
Displays the Ch-- Ch Skew for G to B, G to R, and B to R
channels values in (ns) and in (%) Pixel Clock. Results are
reported on the Measured tab, and if enabled, on the Relative,
Reference, and Limits tabs.
Color Bars measurement measures the GBR color bars of a VGA card in a PC. The Color Bars measurement
measures the amplitude level (relative to back porch) of each of the eight colors, that is, white, yellow, cyan, green,
magenta, red, blue, and black for each active channel.
Color Bars
Measurement
Setup
Line Number
Sets the video signal line number to measure. The default value
depends on the input signal format as set by
Configuration > Format, and assumes that the appropriate Matrix
image file is being used to generate the test signal.
Average
Sets the number of acquisitions over which to calculate an
average measurement value.
Color Bars
Results in mV
H Sync
Description
Displays the amplitude for the White, Yellow, Cyan, Green,
Magenta, Red, Blue, and Black colors on the G, B, and R
channels (24 measurements total). Results are reported on the
Measured tab, and if enabled, on the Relative, Reference, and
Limits tabs.
Sync is the pulse occurring from 2.4 V to 5.5 V at the beginning of each line. This pulse signal causes the monitor
to go back to the left side of the display and trace another horizontal line of picture information. This measurement
measures rise time, fall time, overshoot, undershoot, settling time, and monotonicity. This measurement measures
the steady-- state voltage and current amplitudes of logic levels ‘1’ and ‘0’ at 2.21 kΩ and 301 Ω termination.
H Sync
Measurement
Setup
Line Number
Sets the video signal line number to measure. The default value
depends on the input signal format as set by
Configuration > Format, and assumes that the appropriate Matrix
image file is being used to generate the test signal.
Average
Sets the number of acquisitions over which to calculate an
average measurement value.
H Sync
Results
VM5000 Automatic Video Measurement Set User Manual
Displays the Polarity (Pos/Neg), Pulse Width (μs),
Sync Period (μs), Frequency (kHz), Rise Time (ns),
Fall Time (ns), Overshoot (%), Undershoot (%),
Overshoot S.T. (ns), Undershoot S.T. (ns), Monotonic Rise (Y/N),
Monotonic Fall (Y/N), Logic Level “1” (mV) @2.21 kΩ and
±8 mA, and Logic Level “0” (mV) @2.21 kΩ and ±8 mA. Results
are reported on the Measured tab, and if enabled, on the
Relative, Reference, and Limits tabs.
3- 21
Menu Descriptions
Command
Function
H Sync Jitter
H Sync Jitter is the time superimposed image of the second sync pulse over the first, or triggered edge.
H Sync Jitter
Measurement
Setup
Setting or field
No. of Lines
H Sync Jitter
Results
H Timing
Displays the H Sync Jitter in (ns) and in (%) Pixel Clock. Results
are reported on the Measured tab, and if enabled, on the
Relative, Reference, and Limits tabs.
Line Number
Sets the video signal line number to measure. The default value
depends on the input signal format as set by
Configuration > Format, and assumes that the appropriate Matrix
image file is being used to generate the test signal.
Average
Sets the number of acquisitions over which to calculate an
average measurement value.
H Timing
Results
Displays the Back Porch (μs), Left Border (μs),
Addressable Video (μs), Right Border (μs), Front Porch (μs) on
the G, B, and R channels, and Sync Pulse Width (μs),
Pixel Clock (MHz). Results are reported on the Measured tab,
and if enabled, on the Relative, Reference, and Limits tabs.
Linearity is a measure of how well the device-- under-- test performs analog to digital and digital to analog
conversions. Linearity consists of the Resolution, Integral linearity, Differential linearity, and Monotonic
measurements.
Linearity
Measurement
Setup
Linearity
Results
3- 22
Sets the number of lines to measure.
H Timing comprises of the horizontal sync pulse, the back porch, the addressable video signal, the front porch, the
left border, and the right border.
H Timing
Measurement
Setup
Linearity
Description
Line Number
Sets the video signal line number to measure. The default value
depends on the input signal format as set by
Configuration > Format, and assumes that the appropriate Matrix
image file is being used to generate the test signal.
Average
Sets the number of acquisitions over which to calculate an
average measurement value.
Displays the Resolution (Bits), Max INL (LSB), @ Step No,
Max DNL (LSB), @ Step No, Monotonic (Y/N), and
@ Step No on the G, B, and R channels. Results are reported on
the Measured tab, and if enabled, on the Relative, Reference,
and Limits tabs.
VM5000 Automatic Video Measurement Set User Manual
Menu Descriptions
Command
Function
Luma Levels
Luma corresponds to the sensitivity of human vision to each of the RGB primaries standardized for video. The
Luma Levels measurement reports the minimum and maximum level from the five white and black bars of the
active video for each of the three channels.
Luma Levels
Measurement
Setup
Setting or field
Line Number
Sets the video signal line number to measure. The default value
depends on the input signal format as set by
Configuration > Format, and assumes that the appropriate Matrix
image file is being used to generate the test signal.
Average
Sets the number of acquisitions over which to calculate an
average measurement value.
Luma Levels
Results in mV
Noise Inj Ratio
Displays the Max and the Min luminance of the displayed image
on the G, B, and R channels. Results are reported on the
Measured tab, and if enabled, on the Relative, Reference, and
Limits tabs.
Noise Injection Ratio is the noise injected in the VGA output for the Device Under Test. It is the amount of noise
relative to the signal amplitude rather than the absolute amount of noise that tends to cause problems.
Noise Inj Ratio measures the signal-- to-- noise ratio of the three channels simultaneously.
Noise Inj Ratio
Measurement
Setup
Line Number
Sets the video signal line number to measure. The default value
depends on the input signal format as set by
Configuration > Format, and assumes that the appropriate Matrix
image file is being used to generate the test signal.
Average
Sets the number of acquisitions over which to calculate an
average measurement value.
Noise Inj Ratio
Results
V Sync
Description
Displays the Noise mV, dB, and Inj Ratio (%) on the G, B, and R
channels of the video signal. Results are reported on the
Measured tab, and if enabled, on the Relative, Reference, and
Limits tabs.
This measurement measures the steady-- state voltage and current amplitudes of logic levels ‘1’ and ‘0’ at 2.21 kΩ
and ±8 mA termination. It also measures rise time, fall time, overshoot, undershoot, settling time, and monotonicity.
V Sync
Measurement
Setup
Average
V Sync
Results
VM5000 Automatic Video Measurement Set User Manual
Sets the number of acquisitions over which to calculate an
average measurement value.
Displays the Polarity (Pos/Neg), Pulse Width (μs),
Sync Period (ms), Frequency (Hz), Rise Time (ns),
Fall Time (ns), Overshoot (%), Undershoot (%),
Overshoot S.T. (ns), Undershoot S.T. (ns), Monotonic Rise (Y/N),
Monotonic Fall (Y/N), Logic Level “1” (mV) @2.2k and ±8 mA,
and Logic Level “0” (mV) @2.2k and ±8 mA. Results are reported
on the Measured tab, and if enabled, on the Relative, Reference,
and Limits tabs.
3- 23
Menu Descriptions
Command
Function
V Timing
V Timing comprises of the vertical sync pulse, the back porch, the addressable lines, the front porch, top border,
and bottom border.
V Timing
Measurement
Setup
Setting or field
Average
V Timing
Results
Video Transient
Sets the number of acquisitions over which to calculate an
average measurement value.
Displays the Back Porch (Line), Top Border (Line),
Addressable Lines (Line), Bottom Border (Line), and
Front Porch (Line) on the G, B, and R channels and the
Sync Pulse Width (Line). Results are reported on the Measured
tab, and if enabled, on the Relative, Reference, and Limits tabs.
Video Transients are the video signals that endure for a brief time. Use the Video Transient measurement to check
synchronization signal timing and amplitude. It also measures video rise time, fall time, overshoot, undershoot, and
settling time.
Video Transient
Measurement
Setup
Video Transient
Results
3- 24
Description
Line Number
Sets the video signal line number to measure. The default value
depends on the input signal format as set by
Configuration > Format, and assumes that the appropriate Matrix
image file is being used to generate the test signal.
Average
Sets the number of acquisitions over which to calculate an
average measurement value.
Displays the Video Rise Time (ns), Video Fall Time (ns),
Video Rise Time (%), Video Fall Time (%), Overshoot (%),
Undershoot (%), Overshoot Settling Time (ns), and
Undershoot Settling Time (ns) on the G, B, and R channels.
Results are reported on the Measured tab, and if enabled, on the
Relative, Reference, and Limits tabs.
VM5000 Automatic Video Measurement Set User Manual
Menu Descriptions
Utilities Menu
CAUTION. To avoid losing unsaved measurement results, generate a report before
you recall a setup file or change any configuration parameters other than
selecting measurements or turning warnings on or off.
Command
Function
Generate Report
You can save measurement results in three popular data formats.
Format
File Name
Setting or field
Description
RTF
Use RTF (Rich Text Format) to create results data that you can
incorporate into documents.
PDF
Use PDF (Portable Document Format) to create PDF files of the
measurement data for distribution and viewing.
CSV VM5000 (Option
SD/HD)
or
CSV (Option VGA)
CSV VM5000 - contains measurement results and some more
information. The Legacy format includes only the information on
measurements that were available in the VM5000HD software.
Results for newer measurements only appears in the CSV
VM5000 format.
CSV Legacy
(Option SD/HD)
CSV Legacy - Original format for VM5000. It is provided for
compatibility for customers that use an Excel spreadsheet macro
to process the file.
Text entry field
Field in which to enter the report file name.
(Option SD/HD) C:\VM5000TV\Tek0.rtf
(Option VGA) C:\VM5000PC\Reports\Tek0.rtf
Browse
Selects the location to which to write (save) the report.
Get Default
Sets the report write directory to the default location and name
(Option SD/HD) C:\VM5000TV\Tek0.rtf
(Option VGA) C:\VM5000PC\Reports\Tek0.rtf
(Option SD/HD)
Report Heading
Text entry field
Adds a brief note into the report file. You can enter up to
46 characters.
All
Creates a report with all the measurements that you have run
since starting the application.
Selected
Creates a report with only the measurements that are currently
selected in the Configuration > Measurements screen.
Generate Report
Writes the specified measurement data in the selected report
format to the specified location.
(Option VGA)
Description
Measurements
Generation
VM5000 Automatic Video Measurement Set User Manual
3- 25
Test Equipment Depot - 800.517.8431 - 99 Washington Street Melrose, MA 02176 - FAX 781.665.0780 - TestEquipmentDepot.com
Menu Descriptions
Help Menu
Command
Function
Help Topics
Opens the VM5000 online help window that provides you with application information on your instrument screen.
About VM5000
Displays a VM5000 dialog that contains the application software version number.
3- 26
Setting or field
Description
VM5000 Automatic Video Measurement Set User Manual
Option SD/HD Detailed Measurement Information
For a high-level procedure on how to take a measurement, refer to page 2--23.
For a high-level overview of all the measurements, refer to the table beginning
on page 3--16.
The following information applies to all the measurements.
Matrix Signals and Line Numbers
The matrix signals that are included with the Signal Source Set (refer to
page E--1) provide appropriate signals for all the measurements. Refer to the
Readme.txt files on the Signal Source Set for extensive information about the
files provided.
Averaging
The higher the average, the lower the variance of the measurement in the
presence of noise or other transient signal components. Set the average higher if
you would like to reduce the fluctuations in the measurement results.
The instrument averages results, not input waveforms. (If, on the other hand, the
Noise waveforms were averaged instead of the Noise results, the noise results
would appear lower than they should. Because of the instrument average results,
this problem is avoided.)
VM5000 Automatic Video Measurement Set User Manual
3- 27
Option SD/HD Detailed Measurement Information
Channel Delay
The channel delay measurement is used to verify relative timing of the three
channels of video. Nominal channel delay is zero between all channels.
Deviations from zero correspond to decreased video quality. For example, the
greater the delay between channels, the more likely the edges in video will be
perceived as distorted. Using a narrow band signal, the delay at a particular
frequency band can be measured and thus group delay can be obtained.
In addition, channel delay is a function of relative cable lengths for each of the
channels. Thus, if a splitter is used at the video source output, delay due to cable
length mismatch can be measured.
Signal Source
Interpreting Results
You can use the matrix signal, or you can use a signal with high cross-correlation
between each pair of channels to be tested. The default signal is the multiburst
signal used for multiburst measurement, but many other types of signals can be
used, including sweeps and even some live program material. If the cross-correlation is high enough for at least one pair of channels, the measurement results
will display. Otherwise, running the measurement will result in ‘------’ for each
channel. If warnings are enabled, low correlation between channels will result in
associated warnings.
A positive number indicates that the first signal arrives later than the second
signal. For example, Y to Pb delay of 4.03 ns means that the signal in the Y
channel is delayed 4.03 ns relative to Pb. However, the signals may contain
distortions, which create different delays for different portions of the video line.
In such a case, the measurement result is the delay compensation required to
maximize the cross-correlation of the second channel with the first, generally
giving a weighted average of the various delays. For narrow band signals, the
delays at a particular frequency band may be measured. An ensemble of such
measurements may be collected to develop a portrait of group delay.
If the signals of the three channels are highly mutually correlated (which is the
case if the signals are reconstructed well and free of distortions other than delay),
the ‘loop’ delay will be approximately zero:
Delay1 -- Delay2 + Delay3 = 0, where
Delay1 is Y to Pb or G to B
Delay2 is Y to Pr or G to R
Delay3 is Pb to Pr or B to R
The more the loop delay deviates from zero, the less the three signals mutually
correlate. High loop delay corresponds to different types of signals among the
three channels, because of differences either in distortions or in the inherent
source signal (as in some live program material, for example). Loop delay
greater than 5ns will generate a warning if warnings are enabled.
3- 28
VM5000 Automatic Video Measurement Set User Manual
Option SD/HD Detailed Measurement Information
How Results are
Calculated
The maximum cross-correlation of transitions is found between each pair of
channels. The location of the maximum is the delay in time. Generally, one may
think of the calculation of the delay as the average match of transitions, weighted
by the amplitude of each transition.
The Channel Delay relative to reference value is calculated as follows:
Result = (measured value − reference value)
Color Bars
Measuring GBR color bars from a set-top-box can be used to verify the correct
colorimetry conversion. Likewise, conversion from 1080i/720p to 480p
colorimetry in YPbPr can be verified. The Color Bars measurement also can be
used to check individual channel gain. In addition, it can be used as a crude
check of linearity since severe clipping or other non-linear distortions will alter
the measurement results from the ideal.
Signal Source
Interpreting Results
You can use the matrix signal, or you can use a signal with all eight valid color
bars on the line. There is no requirement for the order of the bars except for the
bias that black will be searched after (to the right of) blue. Each of the bars
should be at least 1/24 of the active line time in duration.
The Color Bars measurement measures the amplitude level (relative to back
porch) of each of the eight colors (white, yellow, cyan, green, magenta, red, blue,
black) for each active channel. Therefore, this measurement makes eight
measurements on three channels for 24 total measurements. The software
assumes Y is on Channel 1, Pb is on Channel 2, and Pr is on Channel 3.
NOTE. Some signals intentionally reverse or change the order from the traditional color bar test signal order. Because the bars are measured regardless of order,
if channel inputs are swapped, especially in the case of RGB, the resulting input
will consist of ‘valid’ color levels for all eight bars, but the order will be
incorrect.
How Results are
Calculated
First, the bars are identified using the relative amplitudes of the three channels
and the specification for the selected format and colorimetry.
The amplitudes are calculated using waveform averaged values within each
identified bar relative to back porch. Thus, it is important to ensure that the sync
signal is within the captured data window for valid measurements. For example,
if a manual setup is performed, not only are all eight bars required on the
waveform display, but the entire horizontal blanking area to the right of the
VM5000 Automatic Video Measurement Set User Manual
3- 29
Option SD/HD Detailed Measurement Information
signal being measured is also required to locate the sync signal and the associated back porch.
The Color Bars relative to reference values are calculated as follows:
mV : Result = (measured value − reference value)
%: Result =
value − reference value
Ꮛmeasured reference
Ꮠ × 100
value
Frequency Response
The Frequency Response measurement technique provides the most accurate
representation of display performance. Frequency response is measured on a
sweep signal, not a burst. This measurement evaluates a system ability to
uniformly transfer signal components of different frequencies without affecting
their amplitudes. The amplitude variation can be expressed in dB or percent. The
reference amplitude (0dB, 100%) is typically the flag. Frequency response
problems can cause a wide variety of aberrations in the picture.
The flag amplitude measurement is a reference signal amplitude. Amplitude is
measured with reference to the flag amplitude.
3- 30
Signal Source
Use a sweep signal with a flag on the front of the signal. You can also use the
matrix signal, or any multiburst signal with a reference flag preceding the bursts.
The more cycles present in each burst, the more robust and generally more
accurate the measurement will be. A burst with less than two cycles is not
recommended.
Interpreting Results
Frequency Response measurements are made with a sweep signal by measuring
the peak-to-peak amplitude of the sweep signal at a specified point. The sweep
input must begin with a reference flag. The point at which the measurement is
made is selectable as Freq 4:4:4, Freq 4:2:2, or Time. If Time is selected, the
measurement is made on all three channels of the sweep signal at the specified
time. If Frequency 4:4:4 is selected, the specified Frequency is found on all three
channels. If Frequency 4:2:2 is selected, the specified Frequency is found on
Channel 1 and one--half the specified frequency is found on Channels 2 and 3.
This is the same for both formats YPbPr and RGB. After the specified point is
found on the input sweep signal, five results are
measured:
H
The frequency is measured at the specified time if time is selected; otherwise
the specified frequency is found and displayed in MHz.
H
The time is measured at the specified frequency if frequency is selected;
otherwise the input time is displayed in s.
VM5000 Automatic Video Measurement Set User Manual
Option SD/HD Detailed Measurement Information
How Results are
Calculated
H
The amplitude of the input signal is measured relative to the flag on the input
signal and the result is displayed in dB.
H
The flag amplitude is measured and displayed in mV.
H
The RMS Distortion is measured as the vector sum of all additional
sinusoidal components normalized by the amplitude of the fundamental
sinusoid at the specified time location.
If a time is specified, the instantaneous frequency (within the context of a 3 s
raised cosine window centered at this time) is measured along with frequencies
and amplitudes of nonlinear distortion.
If a frequency is specified, the same algorithm used in the multiburst
measurement is used for measuring flag amplitude and relative sinusoidal signal
amplitude along with frequencies and amplitudes of nonlinear distortion. If
Freq 4:4:4 is specified, the specified frequency is used for all channels. If
Freq 4:2:2 is specified, the specified frequency is used for Y and 1/2 the input
frequency is used for Pb and Pr.
The Flag Amplitude (mV) is calculated as the peak to peak amplitude of the
flag signal.
Freq (MHz) calculated is the frequency specified in the Meas Location (MHz).
Time (s) is calculated at the Meas Location (MHz).
The frequency response distortion result is calculated as the percent ratio of the
square root of the sum of the squares of the additional spectral components
above the noise floor.
Relative to Reference Calculation
The Relative to Reference values for mV | Hz | s units are calculated as follows:
Frequency: Result = Frequency measured -- Frequency reference
Time: Result = Time measured -- time reference
Flag: Result = Flag measured -- flag reference
Amplitude: Result = Amplitude measured (in dB) -- Amplitude reference (in dB)
RMS Distortion: Result = RMS distortion measured -- RMS distortion reference
The Relative to Reference values for the % display are calculated as follows:
Frequency =
− reference frequency
Ꮛmeasured frequency
Ꮠ × 100
reference frequency
VM5000 Automatic Video Measurement Set User Manual
3- 31
Option SD/HD Detailed Measurement Information
time − reference time
Ꮛmeasuredreference
Ꮠ × 100
time
Time =
Flag =
flag − reference flag
Ꮛmeasuredreference
Ꮠ × 100
flag
Flag = 20 log
Ꮛ
measured amplitude
reference flag
RMS Distortion =
Ꮠ
− reference amplitude
reference amplitude
× 100
− reference distortion
Ꮛmeasured distortion
Ꮠ × 100
reference distortion
Measured Calculation
The measured values appear in the Results panel when Measured tab is selected.
These values are calculated as follows:
Frequency = Frequency measured
Time = Time measured
Flag = Measured flag amplitude in mV
Amplitude = Amplitude of signal at the time or frequency input
Result = 20 log
measured amplitude
Ꮛmeasured
Ꮠ
flag amplitude
Amplitude (note that attenuated signals give results in --dB)
Result =
3- 32
distortion amplitude
ᏋRMS correlated
Ꮠ × 100
RMS signal amplitude
VM5000 Automatic Video Measurement Set User Manual
Option SD/HD Detailed Measurement Information
Multiburst
The Multiburst measurement is used to verify frequencies and corresponding
amplitudes of sinusoidal bursts. It can be used to verify the proper reconstruction
of a band-limited video signal across the frequency spectrum. For example, a
frequency roll-off (decrease in amplitude with increasing frequency) is seen with
video from an analog-to-digital converter that lacks a reconstruction filter with
sin(x)/x correction. In this example, quality is reduced by things like loss of
detail in the video or color shifts in details.
Deviations in frequency from the reference test signal frequency (for example, a
30 MHz burst is rendered as a 20 MHz burst) may indicate things such as a
frequency shift due to format change, frequency aliasing due to digital and/or
analog re-sampling, and/or frequency aliasing due to the lack of a proper
reconstruction filter.
The flag amplitude measurement can be used to verify the channel gain across a
wider frequency range than each burst. Burst amplitudes are measured relative to
the flag amplitude.
Signal Source
You can use the matrix signal, or you can use any multiburst signal with a
reference flag preceding the bursts. The more cycles present in each burst, the
more robust and generally more accurate the measurement will be. A burst with
less than 2 cycles is not recommended.
The frequencies are always displayed from lowest to highest regardless of the
order of burst frequencies in the multiburst signal. To avoid confusion regarding
the correspondence between the results burst numbering and the signal burst
ordering, a signal with increasing burst frequencies (from left to right) is
recommended.
Interpreting Results
For multiburst signals free of non-linear distortion and with increasing burst
frequencies, the ‘Frq(MHz)’ column displays the fundamental frequency of burst
specified in each row. The “Amp(dB)” column has the magnitude of the
corresponding burst.
However, if non-linear distortion is present, interpreting results may be less
straight forward.
In many consumer set-top boxes, lack of a reconstruction filter (with out-of-band
rejection plus sin(x)/x correction) leads to roll-off in the fundamental frequency
component of the bursts even though the envelope of the bursts may be flat on
average. In this case, the amplitude results for the highest frequency may be low
by a few dB even though the waveform shows the same burst with peak-to-peak
amplitude closer to 0 dB. This indicates that the burst is no longer a pure
windowed sinusoid, but has other spectral content (at least one alias frequency in
VM5000 Automatic Video Measurement Set User Manual
3- 33
Option SD/HD Detailed Measurement Information
this example). If the extra spectral content is removed by filtering, the resulting
sinusoid will have the amplitude shown in the results.
Generally, if the signal has undergone processing without a required anti-alias
filter (as in re-sampling for format conversion, or signal reconstruction), each
burst may contain one or several frequency aliases. In such cases, burst
frequencies that increase with each burst of the input signal may contain burst
frequencies in nearly any order in the output of the device under test.
For example, in the 480p rendering of an ATSC 1080i multiburst signal, 5 MHz
is rescaled to 4.85 MHz, 10 MHz to 9.71, but 15 MHz, 20 MHz, 25 MHz, and
30 MHz become any number of frequencies (including 12.44 MHz, 7.58 MHz,
2.73 MHz, and 2.12 MHz respectively). These frequency aliases and respective
amplitudes are measured and displayed in order: 2.12 MHz, 2.73 MHz,
4.85 MHz, 7.58 MHz, 9.71 MHz, 12.44 MHz.
How Results are
Calculated
The six largest peaks are found in the spectrum of signal on the pedestal. These
frequencies are displayed in order from lowest to highest. For each of these
frequencies, the maximum magnitude of the cross-correlation between the signal
within the pedestal area and a windowed complex sinusoid is found. This gives
the amplitude.
Noise
The unweighted noise within the nominal bandwidth of the video signal is
measured to ensure that the video quality is not reduced by random errors such
as those that cause ‘snow’.
Signal Source
You can use the matrix signal, or you can use any flat line or line pedestal signal.
Interpreting Results
As a rule of thumb, errors generally become visible when the signal-to-noise dB
measurement ranges in the low 40s. However, the degree of visibility depends on
many factors, including spectral distribution of the noise. In standard definition
television, noise weighting filters such as the CCIR Recommendation (Rec)
576--2 unified weighting filter are used to weight the noise spectrum to better
match the visibility of noise in typical viewing conditions. The unified weighting
filter has been modified to exactly match the ‘visibility of noise characteristics’
of 576--2 on the screen for each selected video format.
How Results are
Calculated
3- 34
After line tilt and other low frequency distortions are removed from the signal,
all AC signal content is spectrally weighted by the selected filter, if any, and the
resulting RMS voltage is calculated along with the signal-to-noise ratio in dB
using a 700 mV peak signal value.
VM5000 Automatic Video Measurement Set User Manual
Option SD/HD Detailed Measurement Information
The Noise relative to reference value is calculated as follows:
Result = (measured value − reference value)
NonLinearity
This measurement is used to measure deviations from a straight line ramp test
signal. Deviations can be caused by such things as soft-limiting from analog
amplifiers and digital processing errors. Problems in linearity can reduce video
quality by, for example, reducing contrast at various average luminance levels, or
creating color shifts.
Signal Source
Interpreting Results
How Results are
Calculated
You can use the matrix signal, or you can use either a ramp or step signal.
However, a ramp signal will give the best accuracy.
The measurement shows deviations from linear increase in the test signal as a
percentage of the largest increase per time found.
In the case of steps, results are deviations in step amplitudes in the test signal as
a percentage of the largest step found.
In the case of ramps, using six equal time intervals across the ramp, results are
deviations from linear increase in the test signal as a percentage of the largest
increase per time found.
The Non Linearity relative to reference value is calculated as follows:
Result = (measured value − reference value)
Short Time Distortion
The Short Time Distortion measurement measures the rise and fall time,
overshoot and undershoot, settling time on the rising edge, and the settling time
on the falling edge. Short time distortions produce fuzzy vertical edges.
Signal Source
Short time distortion can be measured with any signal that has a T rise time
white bar and pulse section of the matrix signal. The pulse is used for the K2T
measurement; the bar is used for the other measurements. A T rise time bar has a
10% to 90% rise time of nominally 100 ns. Many common test signals have 2T
rather than T rise times and are not suitable for this measurement. Also note that
T rise time signals will suffer significant distortion when passed through a
TV transmitter as they contain spectral components that will be removed by the
transmitter 5 or 6 MHz lowpass filter. Short time distortion measurements made
VM5000 Automatic Video Measurement Set User Manual
3- 35
Option SD/HD Detailed Measurement Information
on transmitted signals will therefore evaluate only those components in
approximately the 200 ns to 1 s range.
Interpreting Results
The affected signal components range in duration from 0.100 s to 1 s. Short
time distortions are most often characterized by measuring K2T.
The rise and fall times are calculated on the bar using the 10% and 90% points.
The result is displayed in ns. The overshoot is calculated as the highest excursion
of the signal on the positive edge relative to the Vmax steady state. The
undershoot is calculated as the lowest excursion of the signal on the negative
edge relative to Vmin steady state. These two results are displayed in % using
the steady state value as a reference. The Settling time on the rising edge is
measured from the end of the overshoot to the point where the amplitude of the
video ringing is down to ± 5% of the final steady state value. The Settling time
on the falling edge is measured from the end of the undershoot to the point
where the amplitude of the video ringing is down to ± 5% of the final steady
state value. The K2T measurement is an indicator of the quality of the video
signal as perceived by a human viewer.
How Results are
Calculated
K2T is an estimate of the degradation of subjective quality due to linear
distortions of the video signal. Linear distortions include any linear combination
of the original pulse such as repeated pulses (from reflections, for example),
ringing, etc. Ideally, the signal beyond 2T before and after the center of the pulse
is practically zero. Linear distortions can cause deviations from zero. The
greatest perceptual deviation from zero is used as the K2T measurement.
Perceptually, a low amplitude pulse far from the original pulse is more noticeable
than the same pulse very close to the original. Therefore, signal amplitude
deviations are weighted accordingly. A reference signal deviation far from the
pulse is used. CCIR specifies 4% of the test pulse amplitude as the reference
deviation amplitude (K = .04).
Measurements of the undershoot, and overshoot at the edge of a T rise bar are
not generally calculated as a percent of the transition amplitude but in terms of
an amplitude weighing system that yields results in percent SD. This weighing is
necessary because the amount of distortion depends not only on the distortion
amplitude but also on the time the distortion occurs with respect to the transition.
The Short Time Distortion relative to reference value is calculated as follows:
Result = (measured value − reference value)
3- 36
VM5000 Automatic Video Measurement Set User Manual
Option SD/HD Detailed Measurement Information
Sync
This measurement is used to check synchronization signal timing and amplitude,
including the relative position of the start and end of active video (interpreted by
looking at front and back porch times).
Signal Source
Interpreting Results
You can use the matrix signal, or you can use a signal with signal amplitude
greater than 7.5% at the beginning and end of active video in order to measure
front porch and back porch times.
The amplitudes are measured relative to back porch.
Selecting either 1080 or 720 formats will display the tri-level sync results.
Selecting either 480 or 576 will display the bi-level sync results.
How Results are
Calculated
The amplitudes are measured relative to back porch.
The times are taken as the time between half amplitudes of adjacent transitions.
For example, “Neg. Sync Width” is the measured time between the half
amplitude of the falling or leading edge of negative sync and the half amplitude
of the rising or trailing edge of negative sync.
In the absence of sufficiently large (greater than 7.5%) video signal, the width of
front porch and back porch may not be found. In this case, the measurement of
the respective porch widths will not be valid.
The Sync relative to reference value is calculated as follows:
Result = (measured value − reference value)
VM5000 Automatic Video Measurement Set User Manual
3- 37
Option VGA Detailed Measurement Information
For a high-level procedure on how to take a measurement, refer to page 2--23.
For a high-level overview of all the measurements, refer to the table beginning
on page 3--16.
The following information applies to all the measurements.
Matrix Signals and Line Numbers
The matrix signals that are included with the Signal Source Set (refer to
page E--1) provide appropriate signals for all the measurements. Refer to the
Readme.txt files on the Signal Source Set for extensive information about the
files provided.
When using Tektronix supplied matrix test signals, if a .vmset file is provided
for that format of matrix test signal, be sure to use the default line numbers in the
associated .vmset file (File > Recall). Otherwise, under most circumstances, use
the instrument default line numbers (File > Recall Defaults).
For example, click File > Recall, and then navigate to where you have saved the
setup file:
Tek.vmset
The line numbers in this setup file may be used for all formats, such as
640X480, 800X600, 1024X768, 1280X1024, 1600X1200, and 1920X1200 @60,
75, and 85 Hz in RGB.
For the equivalent matrix test signal, the Signal Sources disk supplies .bmp files.
The device under test generates the signal that the VM5000 analyzes.
Averaging
The higher the average, the lower the variance of the measurement in the
presence of noise or other transient signal components. Set the average higher if
you would like to reduce the fluctuations in the measurement results.
The instrument averages results, not input waveforms. (If, on the other hand, the
Noise waveforms were averaged instead of the Noise results, the noise results
would appear lower than they should. Because of the instrument average results,
this problem is avoided). The maximum average value you can set in the Results
screen is 64.
VM5000 Automatic Video Measurement Set User Manual
3- 39
Option VGA Detailed Measurement Information
Ch-Ch Mismatch Measurement
The Ch-Ch Mismatch measurement measures the difference in any steady-state
voltage amplitude between R, G, and B video outputs. The amplitude difference
of all the 32 steps is measured between two channels. The maximum amplitude
difference is shown as the result.
Signal Source
The test signal used for Ch-Ch Mismatch measurement is a 32 Step Staircase
(required to test for compliance with the VESA Test procedure), which is located
on the Test Signal Files CD-ROM.
The 32 Step Staircase test signal contains a pattern where each step is equal to
1/32 of the maximum input voltage (700 mV) for R, G, and B channels. The PC
color setting must be set to True Color mode.
If you plan to take only Ch-Ch Mismatch measurement, use a 32-Step Staircase
Full Field test pattern. Select the bitmap file that matches the format and the
refresh rate of the test. For example, look for the 640x480--32Steps.bmp file to
test a 640x480 resolution format.
You can also use a Matrix signal as a test signal. For more information on the
Matrix signal refer to page 2--16. For example, look for the 640x480--Matrix.bmp. This file has a 32 Step Staircase which is suited to the Ch-Ch
Mismatch measurement.
Interpreting Results
The maximum limit for the Ch-Ch Mismatch is 6% of any voltage over the full
range in accordance with the VESA specifications.
The ideal value of Ch-Ch mismatch result should be 0 mV. A positive value
indicates that the step voltage of the first channel is greater than that of the
second channel. A negative value indicates that the step voltage of the first
channel is less than that of the second channel.
For example, --8.923 mV mismatch between G to B channel indicates that the
step voltage of the G channel is less than the step voltage of the B channel.
How Results are
Calculated
3- 40
For a given step, the voltage amplitude is measured with reference to the back
porch. The amplitude is measured for two channels (say G and B). The
amplitude difference of two channels is calculated and displayed as the result.
The results are reported as a percentage by dividing the calculated result by
Vmax steady state (typically 700 mV).
VM5000 Automatic Video Measurement Set User Manual
Option VGA Detailed Measurement Information
Ch-Ch Skew Measurement
Ch-Ch Skew is the phase relationship (time delay) among R, G, and B video
outputs of the graphics subsystem. In addition, Ch-Ch Skew is a function of the
relative cable lengths for each of the channels.
The Ch-Ch Skew measurement is used to verify the relative timing of the three
video channels. Nominal Ch-Ch Skew is zero between all the channels. The
Ch-Ch Skew measurement also displays the pixel clock (%) in the Results
window that is the channel-to-channel delay as a percentage of the pixel clock
period.
Ch-Ch Skew incurs a slight color shift at the edge of the white bar. Visually, it
appears as a focus error.
Signal Source
The test signal used for the Ch-Ch Skew measurement is the Alternate White and
Black Bars (required to test for compliance with the VESA Test procedure),
which is located on the Test Signal Files CD-ROM.
There are nine bars in the Alternate White and Black bars test signal.
If you plan to take only Ch-Ch Skew measurement, use an Alternate White and
Black bars Full Field test pattern. Select the bitmap file that matches the format
and the refresh rate of the device under test. For example, look for an
640x480--AlternateWhite&BlackBars.bmp file to test a 640x480 resolution
format.
You can also use a Matrix signal as a test signal. For more information on the
Matrix signal refer to page 2--16. For example, look for a 640X480--Matrix.bmp
file to test a 640x480 resolution format.
Interpreting Results
The ideal value of Ch-Ch skew is 0 ns. A positive number indicates that the first
signal arrives later than the second signal. For example, G to B delay of 4.03 ns
means that the signal in the G channel is delayed 4.03 ns relative to B.
If the signals of the three channels are highly correlated, the “loop” delay will be
approximately zero:
Delay1 -- Delay2 + Delay3 = 0,
where
Delay1 is between channels G to B
Delay2 is between channels G to R
Delay3 is between channels B to R
VM5000 Automatic Video Measurement Set User Manual
3- 41
Option VGA Detailed Measurement Information
How Results are
Calculated
The leading edge position of the second white bar is determined for all three
video channels. For each pair of channels, the difference in the above values is
computed and reported. The result is also reported as a percentage of the pixel
clock period.
Color Bars Measurement
The Color Bars measurement measures the GBR color bars of a VGA card in a
PC. The Color Bars measurement measures the amplitude level (relative to back
porch) of each of the eight colors, that is, white, yellow, cyan, green, magenta,
red, blue, and black for each active channel. Therefore, this measurement makes
eight measurements on three channels for 24 total measurements. The software
assumes that G is on Channel 1, B is on Channel 2, and R is on Channel 3.
The Color Bars measurement is also used to check individual channel gain. In
addition, it can be used as a crude check of linearity because severe clipping or
other non-linear distortions will alter the measurement results from the ideal.
Signal Source
The test signal used for the Color Bars measurement is the color bars pattern
located on the Test Signal Files CD--ROM.
The color bars test signal used has nine colors. They are white, yellow, cyan,
green, magenta, red, blue, black, and white. If you generate your own color bars
test signal, it should have the first and the last bar white and the remaining seven
color bars in any order. Each of the bars should be at least 1/24 of the active line
time in duration.
If you plan to take only Color Bars measurements, use a Full Field test pattern of
the type Color Bars. Select the bitmap file that matches the format and the
refresh rate of the test. For example, use the 640x480--ColorBars.bmp file to test
a 640x480 resolution format.
You can also use a Matrix signal as a test signal. For more information on the
Matrix signal refer to page 2--16. For example, look for a 640x480--Matrix.bmp
file to test a 640x480 resolution format.
Interpreting Results
The reference value of the amplitude level relative to the back porch of each of
the colors is either 0 mV or 700 mV for G, B, and R channels.
For example, relative value of 15 mV for yellow (G channel) indicates that the
measured value of the signal is greater than the reference value of the signal.
How Results are
Calculated
First, the bars are identified using the relative amplitudes of the three channels
and the specification for the selected format and colorimetry.
The amplitudes are calculated using waveform averaged values within each
identified bar relative to the back porch. Thus, it is important to ensure that the
3- 42
VM5000 Automatic Video Measurement Set User Manual
Option VGA Detailed Measurement Information
sync signal is within the captured data window for valid measurements. For
example, if a manual setup is performed, all eight bars are required on the
waveform display.
The Color Bars relative to reference values are calculated as follows:
mV : Result = (measured value − reference value)
%: Result =
value − reference value
Ꮛmeasured reference
Ꮠ × 100
value
H Sync Measurement
Horizontal Sync is the pulse occurring from 2.4 V to 5.5 V at the beginning of
each line. This pulse causes the electronic beam of a CRT to go back to the left
side of the display and trace another horizontal line of picture information. This
measurement characterizes the rise time, fall time, overshoot, undershoot, and
settling time shown in the Figure 3--1.
Amplitude
Vmax
c
Vmax
steady
state
90%
90%
Vmin
steady
state
10%
VMin
10%
g
a
Time
d
b
f
e
Figure 3- 1: Signal definitions (H Sync)
VM5000 Automatic Video Measurement Set User Manual
3- 43
Option VGA Detailed Measurement Information
where a -- Vmin steady state amplitude before transition
b -- Rise Time
c -- Overshoot
d -- Settling time
e -- Fall time
f -- Settling time
g -- Undershoot
This measurement also characterizes monotonicity and steady-state voltage
amplitude at logic levels ‘1’ and ‘0’. When the MIU is present, a current source
inside the MIU automatically presents the required load. So no manual intervention is required. In the absence of the MIU, external 2.21 kilo ohms and 301
ohms terminations have to be manually presented. The user is prompted to
change the termination from 2.21 kilo ohms to a 301 ohms termination for
measuring the level when drawing maximum current.
Variations in the sync pulse voltage may cause instability in the displayed image
or for extreme cases may even prevent the monitor from locking on to the correct
scan frequency.
Rise time is measured from the 10% to the 90% amplitude points of a positivegoing transition.
Fall time is measured from the 90% to the 10% amplitude points of a negativegoing transition.
Overshoot refers to rise above the steady state value in a positive-going
transition. Undershoot refers to fall below the steady state value in a negative-going transition.
Settling time is measured from the end of the overshoot or undershoot to the
point where the amplitude of the video ringing is down to ±5% of the final
steady state value.
Monotonicity is the property whether or not the video signal is continuously
rising or falling without any inflection points. Monotonicity is decided by
determining the progression of the successive gray levels.
When measuring transients (rise time, fall time, overshoot, etc.), the MIU is set
to use the Sync Wide bandwidth path. When measuring amplitude levels, the
MIU is set to use the Sync low bandwidth path.
3- 44
Signal Source
The H Sync measurement does not require a specific test pattern. It can be taken
with any of the patterns in the Matrix signal (located on the Test Signal Files
CD-ROM).
Interpreting Results
Horizontal Sync polarity is detected by looking at the signal level after skipping
a nominal pulse width duration. It is considered to be positive if the signal level
VM5000 Automatic Video Measurement Set User Manual
Option VGA Detailed Measurement Information
is less than one volt. If not, the polarity is negative. H Sync edge and corner
characteristics are determined by detecting the edge of the H sync signal. A
smaller rise/fall time value indicates a higher quality signal. The overshoot and
undershoot amplitude, and settling time should be zero under ideal conditions.
When H Sync monotonicity is Yes in the results panel, it indicates that the
incoming signal does not change its sign during the rise/fall period.
How Results are
Calculated
The Scope trace is triggered by the trailing edge of the H Sync pulse. Transient
and pulse width measurements are made on the H Sync pulse at the end of the
specified line.
Sync levels are measured with reference to oscilloscope ground and reported at
two different conditions:
H
When the H Sync signal or channel is terminated by a 2.21 kΩ resistor
H
When the H Sync signal or channel is connected to a current source of
±8 mA (+8 mA is connected when H Sync level is high, --8 mA when
H Sync level is low)
Horizontal Sync amplitude is determined by averaging the points that lie
between 30% and 90% of the pulse width. Sync pulse width is determined by
detecting the edges of the sync signal. The position difference between the two
edges is shown as the result.
Rise time is the time taken for the signal to rise from 10% to 90% of steady state
level.
Overshoot/Undershoot settling time is the time taken for the signal to reach 5%
of its steady state value.
H Sync frequency is derived from pulse time value.
H Sync Jitter Measurement
Horizontal Sync Jitter is the time between the superimposed image of the second
sync pulse over the first, or triggered edge. Jitter is the variation of a digital
signal’s significant instants, such as transition points from the ideal positions in
time. Use the H Sync Jitter measurement to measure the Horizontal Sync Jitter.
See Figure 3--2.
VM5000 Automatic Video Measurement Set User Manual
3- 45
Option VGA Detailed Measurement Information
Max period
Min period
Jitter
Figure 3- 2: Jitter in H Sync period
Signal Source
The test signal used for the H Sync Jitter measurement can be any of the
available patterns in the Matrix signal, which is located on the Test Signal Files
CD-ROM.
Interpreting Results
A low numeric value of the H Sync jitter indicates a higher quality of incoming
signal.
How Results are
Calculated
The peak to peak H Sync Jitter is calculated as follows:
Jitter (peak − peak) =
Jitter(%) =
ᏋMax. SyncPeriod value −2 Min. SyncPeriod valueᏐ
Jitter (peak − peak)
pixel clock period
The H Sync Jitter is calculated for N consecutive lines of video frames. N is
entered by the user.
Half of the difference between the minimum and maximum is reported as the H
Sync period jitter. This value is also quantified as a percentage of the pixel clock
period.
H Timing Measurement
The Horizontal Timing measurement consists of the following measurements:
the horizontal sync pulse, the back porch, the addressable video signal, the front
porch, the left border, and the right border.
3- 46
VM5000 Automatic Video Measurement Set User Manual
Option VGA Detailed Measurement Information
Back porch is the portion of the video signal that lies between the trailing edge
of the horizontal sync pulse and the start of the active picture.
Border is the period during which a background colored border is displayed in
order to allow the image to extend beyond the limits of the surrounding bezel on
overscan type monitors. The duration of the left border or the right border in the
active video constitute one-tenth of the total time.
Addressable video is the period during which active video image information is
transmitted.
Front porch is the portion of the video signal between the end of the active
picture and the leading edge of the horizontal sync.
Sync pulse width is the period of the active sync pulse.
Signal Source
The test signal used for the H Timing measurement is Black White Black
(required to test for compliance with the VESA Test procedure), which is located
on the Test Signal Files CD-ROM.
The Black White Black test signal contains a black pattern (10%) followed by a
white pattern (80%), and this is again followed by a black pattern (10%).
Because some graphics cards insert a border around the picture, this test signal
facilitates border detection.
If you plan to take only H Timing measurements, use a Black White Black Full
Field test pattern. Select the bitmap file that matches the format and the refresh
rate of the test. For example, use the 640x480--BlackWhiteBlackBars.bmp file to
test a 640x480 resolution format.
You can also use a Matrix signal as a test signal. For more information on the
Matrix signal refer to page 2--16. For example, use the 640x480--Matrix.bmp file
to test a 640x480 resolution format.
Interpreting Results
How Results are
Calculated
The H Timing Results must match the values specified by the standards
depending on the timing standard selected.
In H Timing, if any borders are detected, their width is measured. A border is
considered present if there are pulses around SAV or EAV with heights of at least
15% of the white level. Edges of the white band are detected and addressable
video width is estimated by considering the white band is 80% of the addressable
portion of the H sync pulse width. Sync period is measured by detecting the
edges in the sync signal.
VM5000 Automatic Video Measurement Set User Manual
3- 47
Option VGA Detailed Measurement Information
Linearity Measurement
Linearity is a measure of how well the device-under-test performs analog to
digital and digital to analog conversions.
Linearity consists of the Resolution, Integral linearity, Differential linearity, and
Monotonic measurements.
The integral linearity is the actual nth value compared to the ideal nth value,
normalized to the ideal LSB command voltage (LSBc).
Differential linearity is the difference between the DAC output voltage measured
in the nth value and that of the previous value (n-1) normalized to the ideal LSB
command voltage (LSBc).
Resolution refers to the number of distinct vertical levels in the video signal
based on the steps. Resolution is represented as a bit.
For a 256 level DAC, the resolution is reported as eight bits. For levels greater
than 128 and less than 256, the resolution reported is eight bits.
Monotonicity is the property whether or not the video signal is continuously
rising or falling without any inflection points. Monotonicity is decided by
determining the progression of the successive gray levels.
Signal Source
The test signal used for the Linearity measurement is the Staircase, which is
located on the Test Signal Files CD-ROM.
The Staircase test signal contains a pattern ranging from black to white. The file
is available in BMP format for an 8-bit staircase test signal and in PNG format
for a 10-bit staircase test signal.
If you plan to take only Linearity measurements, use a Staircase Full-Field test
pattern. Select the bitmap file that matches the format and the refresh rate of the
test. For example, look for a 640x480--Staircase.bmp file to test a 640x480
resolution format.
You can also use a Matrix signal as a test signal. For more information on the
Matrix signal refer to page 2--16. For example, look for a 640x480--Matrix.bmp
file to test a 640x480 resolution format.
3- 48
Interpreting Results
By using a staircase signal, the bit resolution of the device under test can be
determined. The integral and differential linearity values should be close to zero
under ideal conditions.
How Results are
Calculated
The Linearity of an input signal is calculated by using the RGB wide bandwidth
signal path of the MIU.
VM5000 Automatic Video Measurement Set User Manual
Option VGA Detailed Measurement Information
Normalized Integral Linearity Error is calculated as follows:
NormIntegLinErr =
− V idealvalᏐ
ᏋV actval LSBc
where
NormIntegLinErr is the Normalized Integral Linearity Error
V actval is the actual voltage amplitude of the step
V idealval is the ideal voltage amplitude of the step
LSBc (for an 8-bit DAC) is given by
ᏋVoltage amplitude of 255th step255− Voltage amplitude of 0th stepᏐ
Normalized Differential Linearity Error is calculated as follows:
NormDiffLinErr =
− V actvalnprestep
ᏋV actvalnstep LSBc
Ꮠ
where
NormDiffLinErr is the Normalized Differential Linearity Error
actvalnstep is the actual voltage amplitude of the Nth step
V actvalnprestep is the actual voltage amplitude of the previous (N-1)th step
The Normalized Integral Linearity Error and the Normalized Differential
Linearity Error are calculated for each step. The step at which the maximum
Normalized Integral Linearity Error and the Normalized Differential Linearity
Error observed is displayed in the Linearity results window.
Luma Levels Measurement
Luma corresponds to the sensitivity of human vision to each of the RGB
primaries standardized for video.
The Luma Levels measurement reports the minimum and maximum level from
the five white and black bars of the active video for each of the three channels.
Signal Source
The test signal used for the Luma Levels measurement is Alternate White and
Black Bars (required to test for compliance with the VESA Test procedure),
which is located on the Test Signal Files CD-ROM.
VM5000 Automatic Video Measurement Set User Manual
3- 49
Option VGA Detailed Measurement Information
The Alternate White and Black bars test signal contains alternating white and
black bars. There are five white and black bars in this pattern.
If you plan to take only Luma Levels measurements, use the Alternate White and
Black Bars Full Field test pattern. Select the bitmap file that matches the format
and the refresh rate setting of the test device. For example, use the 640x480--AlternateWhite&BlackBars.bmp file to test a 640x480 resolution format.
You can also use a Matrix signal as a test signal. For more information on the
Matrix signal refer to page 2--16. For example, use a 640x480--Matrix.bmp file
to test a 640x480 resolution format.
Interpreting Results
How Results are
Calculated
The Luma Levels measurement results indicate the purity of the signal on the
selected channel.
The results are calculated with reference to the oscilloscope ground by taking an
average of 100,000 points between the 20% and 80% regions of the addressable
video range. The selected line from consecutive frames will be used to get the
required number of points. The maximum and minimum amplitude values are
shown as the result.
Noise Inj Ratio Measurement
Noise Injection Ratio is the ratio of the peak-peak noise amplitude injected to the
maximum signal amplitude in the video signal.
To make use of the instrument’s full bandwidth and get the highest sampling
rate, each channel is acquired separately at 5 GS/s (gigasamples per second). The
minimum bandwidth as specified by the VESA specification for Noise Injection
Ratio measurement is 500 MHz. There can be minor variations in the Noise floor
of different instruments, which can result in different results for the same DUT,
therefore a filter option is provided to limit the bandwidth to a pre--defined value.
By using a 500 MHz filter, more accurately measured values are obtained for the
signal noise regardless of bandwidth of the measurement devices.
With the 500 MHz Filter option selected, the data is low--pass filtered with a
single pole filtered with the response shown. See Figure 3--3.
3- 50
VM5000 Automatic Video Measurement Set User Manual
Option VGA Detailed Measurement Information
Figure 3- 3: Frequency response with 500 MHz filter for Noise In Ratio measurement
Signal Source
The test signal used for the Noise Injection Ratio measurement is Full White,
which is located on the Test Signal Files CD-ROM.
If you plan to take only Noise Inj Ratio measurements, use a Full White Full
Field test pattern. Select the bitmap file that matches the format and refresh rate
of the test. For example, use the 640x480--FullWhite.bmp file to test a 640x480
resolution format.
You can also use a Matrix signal as a test signal. For more information on the
Matrix signal refer to page 2--16. For example, use the 640x480--Matrix.bmp file
to test a 640x480 resolution format.
Interpreting Results
How Results are
Calculated
When the injection ratio is below a certain threshold, noise will not be perceived.
With the injection ratio greater than the threshold, perceived image quality is
degraded as a function of noise injection ratio. Noise Injection Ratio in dB is less
negative when the noise amplitude increases.
Using a Full White signal, the peak-to-peak fluctuation in luminance voltage (of
at least 100,000 samples) is measured. The noise amplitude is measured with
reference to oscilloscope ground. The Noise Injection Ratio measurement uses
the video wide bandwidth signal path of the MIU. The maximum value of the
fluctuation is used for computing the Noise Injection Ratio as shown in the
Figure 3--4.
VM5000 Automatic Video Measurement Set User Manual
3- 51
Test Equipment Depot - 800.517.8431 - 99 Washington Street Melrose, MA 02176 - FAX 781.665.0780 - TestEquipmentDepot.com
Option VGA Detailed Measurement Information
Voltage ripple and noise
Signal
Figure 3- 4: Voltage ripple and noise
The noise amplitude is calculated as follows:
n
Noise amplitude (mV) = Ꭹ
(Vpeak − peak)2 − (NF)2
where
Vpeak-peak is the peak to peak fluctuation in the input signal
NF is the peak to peak fluctuation observed with oscilloscope channel coupling
set to ground
Injection ratio (%) =
amplitude (mV)
ᏋNoise
Ꮠ × 100
Vsignal amplitude
The signal-to-noise ratio in dB is calculated using the average signal amplitude.
V Sync Measurement
The Vertical Sync measurement is used to check synchronization signal timing.
This measurement measures the steady-state voltage amplitudes of logic levels
‘1’ and ‘0’. When the MIU is present, a current source inside the MIU automatically presents the required load, so no manual intervention is required. In the
absence of the MIU, external 2.21 kilo ohms and 301 ohms terminations have to
be manually presented. The user is prompted to change the termination from
2.21 kilo ohms to a 301 ohms termination for measuring the level when drawing
maximum current. This measurement characterizes the rise time, fall time,
overshoot, undershoot, and settling time shown in the Figure 3--5.
3- 52
VM5000 Automatic Video Measurement Set User Manual
Option VGA Detailed Measurement Information
Amplitude
Vmax
c
Vmax
steady
state
90%
90%
Vmin
steady
state
10%
VMin
10%
g
a
Time
d
b
f
e
Figure 3- 5: Signal definitions (V Sync)
where a -- Vmin steady state amplitude before transition
b -- Rise Time
c -- Overshoot
d -- Settling time
e -- Fall time
f -- Settling time
g -- Undershoot
The measurement also characterizes the Monotonicity of the H Sync pulse.
Variations in the sync pulse voltage may cause instability in the displayed image
or for extreme cases may even prevent the monitor from locking on to the correct
scan frequency.
Rise time is measured from the 10% to the 90% amplitude points of a positivegoing transition.
Fall time is measured from the 90% to the 10% amplitude points of a negativegoing transition.
Overshoot refers to the rise above the steady state value in a positive-going
transition. Undershoot refers to the fall below the steady state value in a
negative-going transition.
Settling time is measured from the end of the overshoot or undershoot to the
point where the amplitude of the video ringing is less than or equal to ±5% of the
final steady state value.
VM5000 Automatic Video Measurement Set User Manual
3- 53
Option VGA Detailed Measurement Information
Monotonicity is the property whether or not the video signal is continuously
rising or falling without any inflection points. Monotonicity of the signal is
decided by determining the progression of the successive gray levels.
When measuring transients, the MIU is set to use the Sync wide bandwidth path.
When measuring amplitude levels, the MIU is set to use the Sync low bandwidth
path.
For V Sync Period, the scope horizontal scale is adjusted to be able to see at least
two V sync pulses and the duration between the leading edges of the two sync
pulses is measured.
Signal Source
Interpreting Results
The test signal used for the V Sync measurement can be any of the available
patterns in the Matrix signal, which is located on the Test Signal Files CD-ROM.
Vertical Sync polarity is detected by looking at the signal level after skipping a
nominal pulse width duration. It is considered to be positive if the signal level is
less than one volt. If not, the polarity is negative.
V Sync edge and corner characteristics are determined by detecting the edge of
the V sync signal. A numerically smaller rise/fall time value indicates a higher
quality signal. The overshoot and undershoot amplitude, and settling time should
be zero under ideal conditions. When V Sync monotonicity is Yes in the results
panel, it indicates that the incoming signal does not change its polarity during the
rise/fall period.
How Results are
Calculated
The Scope trace is triggered by the leading edge of the V Sync pulse. Sync levels
are measured with reference to oscilloscope ground and reported at two different
conditions:
H
When V Sync is terminated by a 2.21 kΩ resistor
H
When V Sync is connected to a current source of ± 8 mA (+8 mA is
connected when the voltage level is high, --8 mA when the voltage level is
low).
Vertical Sync amplitude is determined by averaging the points that lie between
30% and 90% of the pulse width. Sync pulse width is determined by detecting
the edges of the sync signal. The position difference between the two edges is
shown as the result. Rise time is the time taken for the signal to rise from 10% to
90% of the steady state level. Overshoot/Undershoot settling time is the time
taken for the signal to reach 5% of its steady state value. V Sync frequency is
derived from pulse time value.
3- 54
VM5000 Automatic Video Measurement Set User Manual
Option VGA Detailed Measurement Information
V Timing Measurement
V Timing consists of the measurements: the vertical sync pulse, the back porch,
the addressable lines, the front porch, top border, and bottom border.
Back porch is the portion of the video signal that lies between the trailing edge
of the vertical sync pulse and the start of the active picture.
Border is the period during which a background colored border is displayed in
order to allow the image to extend beyond the limits.
Addressable Lines is the period during which active video image information is
transmitted.
Front porch is the portion of the video signal between the end of the active
picture and the leading edge of the horizontal sync.
Sync pulse width is the period of the active sync pulse.
Signal Source
The test signal used for the V Timing measurement is Half White & Half Black
Bars (required to test for compliance with the VESA Test procedure), which is
located on the Test Signal Files CD-ROM.
The Half White & Half Black bars test signal contains a white bar and a black
bar.
If you plan to take only V Timing measurements, use the Half White & Half
Black Full Field test pattern. Select the bitmap file that matches the format and
the refresh rate of the test. For example, use the 640x480--HalfWhiteHalfBlack.bmp file to test a 640x480 resolution format.
You can also use a Matrix signal as a test signal. For more information on the
Matrix signal, refer to page 2--16. For example, use the 640x480--Matrix.bmp
file to test a 640x480 resolution format.
Interpreting Results
How Results are
Calculated
The V Timing Results must match the values specified by the timing standard
selected.
The V Timing measurement requires a test pattern with lines that are half white
and half black. The first and the last addressable lines are required to be in this
pattern and they indicate the beginning and end of the addressable video. If any
non-black lines are detected before the beginning of the addressable video or
after the end of it, they are considered part of the top or bottom border respectively.
Beginning five lines before the first addressable line (as per the standard), 15
lines are scanned to detect the first addressable line. With the start of addressable
video, the scan begins again at five lines before the nominal end of the address-
VM5000 Automatic Video Measurement Set User Manual
3- 55
Option VGA Detailed Measurement Information
able video and continues on for 15 lines. The MIU is set to use the low
bandwidth path for Video and Sync.
Video Transient Measurement
Use the Video Transient measurement to check the transient characteristics of the
video. The measurement characterizes the video rise time, fall time, overshoot,
undershoot, and settling time as shown in the Figure 3--6.
Amplitude
Vmax
c
Vmax
steady
state
90%
90%
Vmin
steady
state
10%
VMin
10%
g
a
Time
d
b
f
e
Figure 3- 6: Signal definitions (Video transient)
where a -- Vmin steady state amplitude before transition
b -- Rise Time
c -- Overshoot
d -- Settling time
e -- Fall time
f -- Settling time
g -- Undershoot
Video Transient measurement reports the result of the middle bar (the third white
bar).
Rise time is measured from the 10% to the 90% amplitude points of a
positive-going transition.
Fall time is measured from the 90% to the 10% amplitude points of a
negative-going transition.
3- 56
VM5000 Automatic Video Measurement Set User Manual
Option VGA Detailed Measurement Information
Overshoot refers to the rise above the steady state value in a positive-going
transition. Undershoot refers to the fall below the steady state value in a
negative-going transition.
Settling time measured from the end of the overshoot or undershoot to the point
where the amplitude of the video ringing is down to ±5% of the final steady state
value.
To make use of the full bandwidth and get highest sampling rate with the
instrument, each channel is acquired separately at 5 gigasamples per second.
Signal Source
The test signal used for the Video Transient measurement is Alternate White and
Black bars (required to test for compliance with the VESA Test procedure),
which is located on the Test Signal Files CD-ROM.
The Alternate White and Black bars test signal contains a series of alternating
white and black bars. There are nine bars in this test signal.
If you plan to take only the Video Transient measurement, use the Alternate
White and Black bars Full Field test pattern. Select the bitmap file that matches
the format and the refresh rate of the test. For example, use the
640x480--AlternateWhite&BlackBars.bmp file to test a 640x480 resolution
format.
You can also use a Matrix signal as a test signal. For more information on the
Matrix signal refer to page 2--16. For example, use the 640x480--Matrix.bmp file
to test a 640x480 resolution format.
Interpreting Results
A numerically smaller rise/fall time value indicates a higher quality signal. The
overshoot and undershoot amplitude, and settling time should be zero under ideal
conditions.
How Results are
Calculated
The MIU is set to the high-bandwidth path for Video. The Alternate White and
Black bar pattern is used for measuring video transients. Measurements are made
on the middle white bar. . The results are compensated for the MIU transient
characteristics. Rise time is the time taken for the signal to rise from 10% to 90%
of steady state level. Overshoot/Undershoot settling time is the time taken for the
signal to reach 5% of its steady state value.
VM5000 Automatic Video Measurement Set User Manual
3- 57
Setting Up Measurements
There are three ways set up the VM5000 to take measurements: taking measurements, taking measurements relative to a reference, and taking measurements
with limit testing. The differences between the three ways of taking measurements are:
H
Taking measurements displays only the results of the measurements.
H
Taking measurements relative to a reference displays the results of the
measurements taken and the difference between the measured value and a
reference value.
H
Taking measurements with limit testing displays the results of the measurements taken and a Pass/Fail indication of whether the taken measurement
falls within (pass) or outside (fail) specified maximum and minimum values.
You can choose to take measurements relative to a reference and with limit
testing concurrently.
Taking Measurements
The procedure for taking measurements is:
1. Option SD/HD: Select the appropriate format and the color space for the
input signal.
or
Option VGA: Select the appropriate resolution, the refresh rate and the
timing standard for the input signal.
2. Select one or more measurements to take.
3. Select Configuration > Operations.
4. Set the Setup And/Or Run, Run Mode, and Auto Scaling setting for
controlling the operation.
5. Select the Run button to take and view the measurements.
6. Views the measurement results by selecting the corresponding menu item in
the results panel of the measurement.
VM5000 Automatic Video Measurement Set User Manual
3- 59
Setting Up Measurements
Figure 3--7 shows the results of the Color Bars measurement.
Note that you can select only the Measured tab
when relative results display and limit testing
options are disabled
Figure 3- 7: Results of the Color Bars measurement
Taking Measurements Relative to a Reference
The procedure to take measurements relative to a reference is:
1. Option SD/HD: Select the appropriate format and the color space for the
input signal. or
Option VGA: Select the appropriate resolution, the refresh rate, and the
timing standard for the input signal.
2. Select one or more measurements to take.
3. Set the measurement run operation.
4. Select Configuration > Reference & Limits.
3- 60
VM5000 Automatic Video Measurement Set User Manual
Setting Up Measurements
5. Select Enable Relative Result Display. See Figure 3--8.
Figure 3- 8: Enabling relative to reference results
By default, the software selects a reference file appropriate to the specified
signal format. However, you can specify a different reference file by
selecting Manual in the Reference Selection pane.
6. To specify a reference file, click Manual under Reference Selection. Click
Select Reference File and navigate to the required reference file and select
it.
7. After you have selected the reference file, click the Run button to take and
view the measurements.
8. Views the measurement results by selecting the corresponding menu item in
the results panel of the measurement.
VM5000 Automatic Video Measurement Set User Manual
3- 61
Setting Up Measurements
In Figure 3--9 (and Figure 3--10 for Option VGA), note that the Measured,
Relative, and Reference tabs are selectable. To display the value of the
measurements relative to the reference value, select the Relative tab in the
Results display.
To display the relative results,
click the Relative tab
Figure 3- 9: Relative to reference results displayed (Option SD/HD)
To display the relative results,
click the Relative tab
Figure 3- 10: Relative to reference results displayed (Option VGA)
Creating a Custom Reference File
Reference files are used as the source of comparison for calculating the Relative
to Reference values for the measurements. The VM5000 includes a set of
reference files that you can use as a starting point to create reference files to suit
your needs.
3- 62
VM5000 Automatic Video Measurement Set User Manual
Setting Up Measurements
Option SD/HD: There is a different file for each signal format and color space or
Option VGA: There is a different file for each signal resolution, refresh rate, and
timing standard.
The reference files are saved in CSV format. The VM5000 includes a set of
default reference files and you can create your own reference file. Reference
values for all measurements are in one file. Each format has its own reference
file. The reference file contains the details shown in Table 3--2.
Table 3- 2: Elements of the reference file
Option SD/HD
Option VGA
Format
Resolution
Color Space type
Refresh Rate type
H
Name of the measurement, parameters measured with the nominal values
There are two ways to create a custom reference file: edit an existing reference
file and capture a set of measurement results to create a new reference file.
Using an Existing
Reference File to Create a
New Reference File
One way to create a custom reference file is to edit an existing reference file. The
easiest way to edit a reference file is to use a spreadsheet program, such as
Microsoft Excel or OpenOffice.org. See Figure 3--11. Because the files are in
plain ASCII format, you can also edit the files with a text editor. If you choose to
edit files with a text editor, make sure that the CSV format is maintained.
Figure 3- 11: Editing a reference file
VM5000 Automatic Video Measurement Set User Manual
3- 63
Setting Up Measurements
To customize an existing reference file:
1. Open a reference file for the appropriate input signal format standard by
using a spreadsheet program (or a text editor).
2. Change the values in the file to those that suit your needs.
3. Save the file under a new name. Remember to save the file in CSV format.
Capturing Measurement
Results to Create a New
Reference File
A second way to create a reference file is to use the Capture Results as
Reference button. The Capture Results as Reference function saves measurements to a reference file using the actual measured values as the reference values.
To create a new reference file:
1. Select Configuration > Reference & Limits.
2. Select Enable Relative Result Display.
3. Configure and run the measurements to save the result values in the
reference file.
4. Select Configuration > Reference & Limits.
5. Select Capture Results as Reference....
6. Save the file to the desired location by using the Save dialog box.
Taking Measurements with Limit Testing
The procedure to take measurements with limit testing is:
1. Option SD/HD: Select the appropriate format and the color space for the
input signal or
Option VGA: Select the appropriate resolution, the refresh rate, and the
timing standard for the input signal.
2. Select one or more measurements to take.
3. Set the measurement run operation.
4. Select Configuration > Reference & Limits.
3- 64
VM5000 Automatic Video Measurement Set User Manual
Setting Up Measurements
5. Select Enable Limit Testing. See Figure 3--12 or Figure 3--13.
Figure 3- 12: Enabling limit testing (Option SD/HD)
Figure 3- 13: Enabling limit testing (Option VGA)
By default, the software selects a limit file appropriate to the specified
signal. However, you can specify a different reference file by selecting
Manual in the Limits Selection area.
6. To specify a non-default limits file, select Manual under Limits Selection.
Click Select Limits File and navigate to the desired limits file and select it.
VM5000 Automatic Video Measurement Set User Manual
3- 65
Setting Up Measurements
7. After you have selected the limits file, select the run button to take and view
the measurements.
8. Views the measurement results by selecting the corresponding menu item in
the results panel of the measurement. See Figure 3--14.
Note that you can select the Limits tab
Figure 3- 14: Results when limit testing is available
Customizing a Limits File
A limits file defines the maximum and minimum acceptable values for measurements. Limits files are used as the source of comparison for Limit Testing
measurements. The VM5000 includes a set of limits files which you can use as a
starting point to create limits files to suit your needs. There is a different file for
each signal (Option SD/HD) format and color space or (Option VGA) resolution,
refresh rate, and timing standard.
The limits file is in Comma--Separated--Value (CSV) format. The limit values for
all measurements are in one file. The reference file contains the following
details:
3- 66
H
Format
H
(Option SD/HD) Color Space type or (Option VGA) Refresh Rate
H
Name of the measurement with maximum and minimum acceptable values
VM5000 Automatic Video Measurement Set User Manual
Setting Up Measurements
The easiest way to edit a limits file is to use a spreadsheet program, such as
Microsoft Excel or OpenOffice.org. See Figure 3--15. Because the files are in
plain ASCII format, you can also edit the files with a text editor. If you do edit
files with a text editor, be certain to maintain the CSV format.
Figure 3- 15: Customizing a limits file
To customize a limits file:
1. Open a reference file for the appropriate format and color space using a
spreadsheet program (or a text editor).
2. Change the values in the file to those that suit your needs. Use columns
C and D for the min. and max values.
3. Save the file under a new name; remember to save the file in CSV format.
VM5000 Automatic Video Measurement Set User Manual
3- 67
Setting Up Measurements
Setting Up the Channel Delay Measurement
Option SD/HD
To set up the channel delay measurements, select Results > Channel Delay to
display the result panel. The results panel for the measurement shows the
settings that can be changed for the measurement. For channel delay, you can
choose the line on which the measurement is made and the number of times the
measurement is averaged.
To change settings for the Channel Delay measurements:
1. Select Results > Channel Delay.
2. To change the setting for Line Number, click the Line Number box.
There are three ways to change the number:
H
Turn the top knob on the front panel to change the number. When it is set to
the correct number, click outside the box to enter the change.
H
Click the keypad button to the left of the number entry box. Use the pop-up
keypad to enter a setting for the line number.
H
Using the keyboard to directly input the desired value.
3. Click the Average box to change the number of times the measurement is
averaged.
3- 68
VM5000 Automatic Video Measurement Set User Manual
Setting Up Measurements
There are three ways to change the average:
H
Turn the top knob on the front panel to change the number of averages.
When it is set to the correct number, click outside the box to enter the
change.
H
Click the keypad button to the left of the number entry box. Use the pop-up
keypad to enter a setting for the number of averages to perform.
H
Using the keyboard to directly input the desired value.
The next time the Channel Delay measurement is run, it will run with the newly
entered numbers.
Setting Up the Color Bars Measurement
Option SD/HD
To set up the Color Bars measurements, select Results > Color Bars to display
the result panel. The results pane for the measurement shows the settings that can
be changed for the measurement. For color bars, you can choose the line on
which the measurement is made and the number of times the measurement is
averaged. To change settings for the Color Bars measurements:
1. Select Results > Color Bars.
2. To change the setting for Line Number, click the Line number box.
There are three ways to change the number:
H
Turn the top knob on the front panel to change the number. When it is set to
the correct number, click outside the box to enter the change.
H
Click the keypad button to the left of the number entry box. Use the pop-up
keypad to enter a setting for the line number.
H
Using the keyboard to directly input the desired value.
VM5000 Automatic Video Measurement Set User Manual
3- 69
Setting Up Measurements
3. Click the Average box to change the number of times the measurement is
averaged.
There are three ways to change the average:
H
Turn the top knob on the front panel to change the number of averages.
When it is set to the correct number, click outside the box to enter the
change.
H
Click the keypad button to the left of the number entry box. Use the pop-up
keypad to enter a setting for the number of averages to perform.
H
Using the keyboard to directly input the desired value.
The next time the Color Bars measurement is run, it will run with the newly
entered numbers.
Setting Up the Frequency Response Measurement
Option SD/HD
To set up the Frequency Response measurements, select Results > Frequency
Response to display the result panel. The results pane for the measurement
shows the settings that can be changed for the measurement. For frequency
response, you can choose the line on which the measurement is made, and the
number of times the measurement is averaged. You can set the measurement
location to either Frequency or Time, specify a value, and set the filter bandwidth frequency.
To change settings for the Frequency Response measurements:
1. Select Results > Frequency Response.
3- 70
VM5000 Automatic Video Measurement Set User Manual
Setting Up Measurements
2. To change the setting for Line Number, click the Line Number box.
There are three ways to change the number:
H
Turn the top knob on the front panel to change the number. When it is set to
the correct number, click outside the box to enter the change.
H
Click the keypad button to the left of the number entry box. Use the pop-up
keypad to enter a setting for the line number.
H
Using the keyboard to directly input the desired value.
3. Click the Average box to change the number of times the measurement is
averaged.
There are three ways to change the average:
H
Turn the top knob on the front panel to change the number of averages.
When it is set to the correct number, click outside the box to enter the
change.
H
Click the keypad button to the left of the number entry box. Use the pop-up
keypad to enter a setting for the number of averages to perform.
H
Using the keyboard to directly input the desired value.
When Meas Location is set to Freq 4:4:4, the measurement uses the same
frequency for the measurement location on all three signals (CH1 (Y/G),
CH2 (Pb/B), and CH3 (Pr/R)).
VM5000 Automatic Video Measurement Set User Manual
3- 71
Setting Up Measurements
This setting is the best option for RGB (GBR) signals.
When Meas Location is set to Freq 4:2:2, the measurement uses the full
frequency for CH1 and half that frequency for CH2 and CH3.
Click the Freq (MHz) box to change the measurement location to a particular
frequency.
There are three ways to change the frequency:
H
Turn the top knob on the front panel to change the frequency location. When
it is set to the correct number, click outside the box to enter the change.
H
Click the keypad button to the left of the number entry box. Use the pop-up
keypad to enter a setting for the frequency location to perform.
H
Using the keyboard to directly input the desired value.
When Meas Location is set to Time, the measurement reports the waveform
frequency at that specified time.
Click the Time (s) box to change the measurement location to a particular time.
3- 72
VM5000 Automatic Video Measurement Set User Manual
Setting Up Measurements
There are three ways to change the time:
H
Turn the top knob on the front panel to change the time location. When it is
set to the correct number, click outside the box to enter the change.
H
Click the keypad button to the left of the number entry box. Use the pop-up
keypad to enter a setting for the time location to perform.
H
Using the keyboard to directly input the desired value.
Click the Dist BW(MHz) box to change the distortion bandwidth frequency. This
setting applies only to the RMS Distortion measurement.
There are three ways to change the frequency:
H
Turn the top knob on the front panel to change the frequency location. When
it is set to the correct number, click outside the box to enter the change.
H
Click the keypad button to the left of the number entry box. Use the pop-up
keypad to enter a setting for the frequency location to perform.
H
Using the keyboard to directly input the desired value.
The next time the Frequency Response measurement is run, it will run with the
newly entered numbers.
Setting Up the Multiburst Measurement
Option SD/HD
To set up the Multiburst measurements, select Results > Multiburst to display the
result panel. The results panel for the measurement shows the settings that can be
changed for the measurement. For Multiburst, you can choose the line on which
the measurement is made, and the number of times the measurement is averaged.
To change settings for the Multiburst measurements:
1. Select Results > Multiburst.
2. To change the setting for Line Number, click the Line Number box.
VM5000 Automatic Video Measurement Set User Manual
3- 73
Setting Up Measurements
There are three ways to change the number:
H
Turn the top knob on the front panel to change the number. When it is set to
the correct number, click outside the box to enter the change.
H
Click the keypad button to the left of the number entry box. Use the keypad
to enter a setting for the line number.
H
Using the keyboard to directly input the desired value.
3. Click the Average box to change the number of times the measurement is
averaged.
There are three ways to change the average:
H
Turn the top knob on the front panel to change the number of averages.
When it is set to the correct number, click outside the box to enter the
change.
H
Click the keypad button to the left of the number entry box. Use the pop-up
keypad to enter a setting for the number of averages to perform.
H
Using the keyboard to directly input the desired value.
The next time the Multiburst measurement is run, it will run with the newly
entered numbers.
Setting Up the Noise Measurement
Option SD/HD
To set up the Noise measurements, select Results > Noise to display the result
panel. The results panel for the measurement shows the settings that can be
changed for the measurement. For noise, you can choose the line on which the
measurement is made, and the number of times the measurement is averaged.
You can specify the filter type and the cut--off frequency of bandwidth filter.
To change settings for the Noise measurements:
3- 74
VM5000 Automatic Video Measurement Set User Manual
Setting Up Measurements
1. Select Results > Noise.
2. To change the setting for Line Number, click the Line Number box.
There are three ways to change the number:
H
Turn the top knob on the front panel to change the number. When it is set to
the correct number, click outside the box to enter the change.
H
Click the keypad button to the left of the number entry box. Use the pop-up
keypad to enter a setting for the line number.
H
Using the keyboard to directly input the desired value.
3. Click the Average box to change the number of times the measurement is
averaged.
There are three ways to change the average:
H
Turn the top knob on the front panel to change the number of averages.
When it is set to the correct number, click outside the box to enter the
change.
H
Click the keypad button to the left of the number entry box. Use the pop-up
keypad to enter a setting for the number of averages to perform.
H
Using the keyboard to directly input the desired value.
VM5000 Automatic Video Measurement Set User Manual
3- 75
Setting Up Measurements
To change the Filter type and the cut-off frequency of the bandwidth filter,
change the settings under Filter.
Select a Filter type from the three available options Off, Unified Weighting, and
Unweighted Bandwidth.
H
Set the Filter option to Off to measure the broadband noise without any
filter.
H
Set the Filter option to Unified Weighting to measure the noise using the
psychovisual weighting established by CCIR Recommendation (Rec.)
576--2, adjusted for the selected video format.
H
Set the Filter option to Unweighted Bandwidth to remove high frequency
noise from your signal.
To change the cut--off frequency of the filter bandwidth (this option is available
only if the filter type selected is Unweighted Bandwidth).
Click the box below Bandwidth (Hz). There are three ways to change the
number:
H
Turn the top knob on the front panel to change the number of averages.
When it is set to the correct number, click outside the box to enter the
change.
H
Click the keypad button to the left of the number entry box. Use the pop-up
keypad to enter a setting for the number of averages to perform.
H
Using the keyboard to directly input the desired value.
The next time the Noise measurement is run, it will run with the newly entered
numbers.
3- 76
VM5000 Automatic Video Measurement Set User Manual
Setting Up Measurements
Setting Up the Noise Spectrum Measurement
Option SD/HD
To set up the Noise Spectrum measurement, select Results > Noise to display the
result panel. The results panel for the measurement shows the settings that can be
changed for the measurement. For noise spectrum, you can choose the Cursor
and select a channel (G, B, or R).
To change settings for the Noise Spectrum measurements:
1. Select Results > Noise.
2. To change the setting for the Cursor, click the Cursor (Hz) box.
There are three ways to change the number:
H
Turn the top knob on the front panel to change the number. When it is set to
the correct number, click outside the box to enter the change.
H
Click the keypad button to the left of the number entry box. Use the pop-up
keypad to enter a setting for the line number.
H
Using the keyboard to directly input the desired value.
Select one of the channels (G, B, or R) in the list box to change the channel for
the noise spectrum measurement.
The next time the Noise Spectrum measurement is run, it will run with the newly
entered numbers.
Setting Up the NonLinearity Measurement
Option SD/HD
To set up the NonLinearity measurements, select Results > NonLinearity to
display the result panel. The results panel for the measurement shows the
settings that can be changed for the measurement. For NonLinearity, you can
choose the line on which the measurement is made, and the number of times the
measurement is averaged.
VM5000 Automatic Video Measurement Set User Manual
3- 77
Setting Up Measurements
To change settings for the NonLinearity measurements:
1. Select Results > NonLinearity.
2. To change the setting for Line Number, click the Line Number box.
There are three ways to change the number:
H
Turn the top knob on the front panel to change the number. When it is set to
the correct number, click outside the box to enter the change.
H
Click the keypad button to the left of the number entry box. Use the pop-up
keypad to enter a setting for the line number.
H
Using the keyboard to directly input the desired value.
3. Click the Average box to change the number of times the measurement is
averaged.
There are three ways to change the average:
H
Turn the top knob on the front panel to change the number of averages.
When it is set to the correct number, click outside the box to enter the
change.
H
Click the keypad button to the left of the number entry box. Use the pop-up
keypad to enter a setting for the number of averages to perform.
H
Using the keyboard to directly input the desired value.
The next time the Non Linearity measurement is run, it will run with the newly
entered numbers.
3- 78
VM5000 Automatic Video Measurement Set User Manual
Setting Up Measurements
Setting Up the Short Time Distortion Measurement
Option SD/HD
To set up the Short Time Distortion measurements, select Results > Short Time
Distortion to display the result panel. The results panel for the measurement
shows the settings that can be changed for the measurement. For Short time
Distortion, you can choose the line on which the measurement is made, and the
number of times the measurement is averaged.
To change settings for the Short Time Distortion measurements:
1. Select Results > Short Time Distortion.
2. To change the setting for Line Number, click the Line Number box.
There are three ways to change the number:
H
Turn the top knob on the front panel to change the number. When it is set to
the correct number, click outside the box to enter the change.
H
Click the keypad button to the left of the number entry box. Use the pop-up
keypad to enter a setting for the line number.
H
Using the keyboard to directly input the desired value.
3. Click the Average box to change the number of times the measurement is
averaged.
There are three ways to change the average:
H
Turn the top knob on the front panel to change the number of averages.
When it is set to the correct number, click outside the box to enter the
change.
H
Click the keypad button to the left of the number entry box. Use the pop-up
keypad to enter a setting for the number of averages to perform.
H
Using the keyboard to directly input the desired value.
VM5000 Automatic Video Measurement Set User Manual
3- 79
Setting Up Measurements
The next time the Short Time Distortion measurement is run, it will run with the
newly entered numbers.
Setting Up the Sync Measurement
Option SD/HD
To set up the Sync measurements, select Results > Sync to display the result
panel. The results panel for the measurement shows the settings that can be
changed for the measurement. For Sync, you can choose the line on which the
measurement is made and the number of times the measurement is averaged.
To change settings for the Sync measurements:
1. Select Results > Sync.
2. To change the setting for Line Number, click the Line Number box.
There are three ways to change the number:
H
Turn the top knob on the front panel to change the number. When it is set to
the correct number, click outside the box to enter the change.
H
Click the keypad button to the left of the number entry box. Use the pop-up
keypad to enter a setting for the line number.
H
Using the keyboard to directly input the desired value.
3. Click the Average box to change the number of times the measurement is
averaged.
3- 80
VM5000 Automatic Video Measurement Set User Manual
Setting Up Measurements
There are three ways to change the average:
H
Turn the top knob on the front panel to change the number of averages.
When it is set to the correct number, click outside the box to enter the
change.
H
Click the keypad button to the left of the number entry box. Use the pop-up
keypad to enter a setting for the number of averages to perform.
H
Using the keyboard to directly input the desired value.
Select the Measured on CH1 check box to take the measurements on channel
CH1 for better measurement accuracy. This option is available only if triggering
on CH4, which is the default.
When the triggering is set to channel CH1, the Measured on CH1 check box is
not available.
The next time the Sync measurement is run, it will run with the newly entered
numbers.
Configuring the Device Under Test for Option VGA
To perform measurements on the DUT, you must provide an appropriate video
signal to the VM5000. You accomplish this by displaying a bitmap file on the
PC in which the DUT is operating. The preferred bitmap file, when taking
multiple measurements, is the Matrix signal. All the necessary Matrix signal and
full-field test pattern bitmaps required to test for compliance to the VESA Test
Procedure -- Evaluation of Display Graphics Subsystems (Version 1 Rev. 1), are
located on the Test Signal Files CD-ROM.
1. Set the resolution, refresh rate, and timing standard of the DUT to the
required values corresponding to the selected matrix signal.
2. On the PC containing the DUT, display the contents of the Test Signal Files
CD-ROM.
3. Display the contents of either the Matrix or Full Field folder.
H
If you plan to take multiple measurements, open the Matrix folder.
H
If you plan to take only one measurement, open the Full Field folder and
select the appropriate test pattern using Table 3--3.
VM5000 Automatic Video Measurement Set User Manual
3- 81
Setting Up Measurements
Table 3- 3: Matching measurements to the appropriate Full Field test pattern
Measurement
Test Pattern
Ch-Ch Mismatch
32-step Staircase
Ch-Ch Skew
Alternate White and Black
Color Bars
Nine Color Bars
H Sync
Any pattern
H Sync Jitter
Any pattern
H Timing
Black-- White-- Black
Linearity
Staircase
Luma Levels
Alternate White and Black
Noise Inj Ratio
Full White
V Sync
Any pattern
V Timing
Half White and Half Black
Video Transient
Alternate White and Black
Whether you choose a single test pattern or take multiple measurements, you
must select the appropriate file that you will use to generate the video test
signal. The file you select depends on the format you want to test and for
some patterns, refresh rate must also be considered. Suppose you want to test
a 1280x1024 resolution format. Within the appropriate folder, look for a file
that matches the format of the test you want to perform. If you want to test
Linearity, you would need to choose either full-field Staircase test pattern or
use the Matrix test pattern. Within the Staircase folder, you would look for a
file named 1280x1024--Matrix.bmp (refresh rate is important for the Matrix
pattern).
4. Select the bitmap file that fits your requirements and open the file with a
program such as Paint Shop Pro. If you set up the DUT to drive a second
display, you can set the background of the second display to the bitmap file
rather than opening the file with a bitmap editor. This displays the bmp file
in full screen mode without any borders (applied for Single Monitor mode).
3- 82
VM5000 Automatic Video Measurement Set User Manual
Setting Up Measurements
Figure 3- 16: Illustration of the BMP test signal in full screen mode
5. From the File menu, select File > Set as Wallpaper (centered).
Figure 3- 17: Illustration of the BMP image set as wallpaper
6. Disconnect the output of the DUT from the monitor and connect the output
of the DUT to the VM5000.
VM5000 Automatic Video Measurement Set User Manual
3- 83
Setting Up Measurements
Setting Up the Ch- Ch Mismatch Measurement
Option VGA
To set up the Ch--Ch Mismatch measurement, select Results > Ch--Ch Mismatch
to display the result panel. The results panel for the measurement shows the
settings that can be changed for the measurement. For Ch--Ch Mismatch, you can
choose the line on which the measurement is made and the number of times the
measurement is averaged.
To change the settings for the Ch--Ch Mismatch measurements:
1. Click Results > Ch--Ch Mismatch.
2. To change the line number, click the Line Number box.
There are three ways to change the line number:
H
Turn the top knob on the front panel to change the number. When it is set to
the correct number, click outside the box to enter the change.
H
Click the keypad button to the left of the number entry box. Use the pop-up
keypad to enter a setting for the line number.
H
Using the keyboard to directly input the desired value.
3. Click the Average box to change the number of times the measurement is
averaged.
There are three ways to change the average:
3- 84
H
Turn the top knob on the front panel to change the number of averages.
When it is set to the correct number, click outside the box to enter the
change.
H
Click the keypad button to the left of the number entry box. Use the pop-up
keypad to enter a setting for the number of averages to perform.
H
Using the keyboard to directly input the desired value.
VM5000 Automatic Video Measurement Set User Manual
Setting Up Measurements
The next time the Ch--Ch Mismatch measurement is run, it will run with the
newly entered numbers.
Setting Up the Ch- Ch Skew Measurement
Option VGA
To set up the Ch--Ch Skew measurement, select Results > Ch--Ch Skew to
display the result panel. The results panel for the measurement shows the
settings that you can change for the measurement. For Ch--Ch Skew, you can
choose the line on which the measurement is made and the number of times the
measurement is averaged.
To change the settings for the Ch--Ch Skew measurement:
1. On the menu bar, click Results > Ch--Ch Skew.
2. To change the line number, click the Line Number box.
There are three ways to change the line number:
H
Turn the top knob on the front panel to change the number. When it is set to
the correct number, click outside the box to enter the change.
H
Click the keypad button to the left of the number entry box. Use the pop-up
keypad to enter a setting for the line number.
H
Using the keyboard to directly input the desired value.
3. Click the Average box to change the number of times the measurement is
averaged.
VM5000 Automatic Video Measurement Set User Manual
3- 85
Setting Up Measurements
There are three ways to change the number:
H
Turn the top knob on the front panel to change the number of averages.
When it is set to the correct number, click outside the box to enter the
change.
H
Click the keypad button to the left of the number entry box. Use the pop-up
keypad to enter a setting for the number of averages to perform.
H
Using the keyboard to directly input the desired value.
The next time the Ch--Ch Skew measurement is run, it will run with the newly
entered numbers.
Setting Up the Color Bars Measurement
Option VGA
To set up the Color Bars measurement, select Results > Color Bars to display the
result panel. The results panel for the measurement shows the settings that you
can change for the measurement. For Color Bars, you can choose the line on
which the measurement is made and the number of times the measurement is
averaged.
To change the settings for the Color Bars measurement:
1. On the menu bar, click Results > Color Bars.
2. To change the line number, click the Line Number box.
There are three ways to change the line number:
3- 86
H
Turn the top knob on the front panel to change the number. When it is set to
the correct number, click outside the box to enter the change.
H
Click the keypad button to the left of the number entry box. Use the pop-up
keypad to enter a setting for the line number.
H
Using the keyboard to directly input the desired value.
VM5000 Automatic Video Measurement Set User Manual
Setting Up Measurements
3. Click the Average box to change the number of times the measurement is
averaged.
There are three ways to change the average:
H
Turn the top knob on the front panel to change the number of averages.
When it is set to the correct number, click outside the box to enter the
change.
H
Click the keypad button to the left of the number entry box. Use the pop-up
keypad to enter a setting for the number of averages to perform.
H
Using the keyboard to directly input the desired value.
The next time the Color Bars measurement is run, it will run with the newly
entered numbers.
Setting Up the H Sync Measurement
Option VGA
To set up the H Sync measurement, select Results > H Sync to display the result
panel. The results panel for the measurement shows the settings that you can
change for the measurement. For H Sync, you can choose the line on which the
measurement is made and the number of times the measurement is averaged.
To change the settings for the H Sync measurement:
1. On the menu bar, click Results > H Sync.
2. To change the line number, click the Line Number box.
There are three ways to change the line number:
H
Turn the top knob on the front panel to change the number. When it is set to
the correct number, click outside the box to enter the change.
VM5000 Automatic Video Measurement Set User Manual
3- 87
Setting Up Measurements
H
Click the keypad button to the left of the number entry box. Use the pop-up
keypad to enter a setting for the line number.
H
Using the keyboard to directly input the desired value.
3. Click the Average box to change the number of times the measurement is
averaged.
There are three ways to change the average:
H
Turn the top knob on the front panel to change the number of averages.
When it is set to the correct number, click outside the box to enter the
change.
H
Click the keypad button to the left of the number entry box. Use the pop-up
keypad to enter a setting for the number of averages to perform.
H
Using the keyboard to directly input the desired value.
The next time the H Sync measurement is run, it will run with the newly entered
numbers.
Setting Up the H Sync Jitter Measurement
Option VGA
To set up the H Sync Jitter measurement, select Results > H Sync Jitter to
display the result panel. The results panel for the measurement shows the
settings that you can change for the measurement. For H Sync Jitter, you can
choose the number of lines on which the measurement is made.
To change the settings for the H Sync Jitter measurement:
1. On the menu bar, click Results > H Sync Jitter.
2. To change the number of lines, click the No. of Lines box.
There are three ways to change the number of lines:
3- 88
VM5000 Automatic Video Measurement Set User Manual
Setting Up Measurements
H
Turn the top knob on the front panel to change the number. When it is set to
the correct number, click outside the box to save the change.
H
Click the keypad button to the left of the Line Number box to open the
virtual keyboard. Use the pop-up keypad to enter the new value for the line
number.
H
Using the keyboard to directly input the desired value.
The next time the H Sync Jitter measurement is run, it will run with the newly
entered numbers.
Setting Up the H Timing Measurement
Option VGA
To set up the H Timing measurement, select Results > H Timing to display the
result panel. The results panel for the measurement shows the settings that you
can change for the measurement. For H Timing, you can choose the line on
which the measurement is made and the number of times the measurement is
averaged.
To change the settings for the H Timing measurement:
1. On the menu bar, click Results > H Timing.
2. To change the line number, click the Line Number box.
There are three ways to change the line number:
H
Turn the top knob on the front panel to change the number. When it is set to
the correct number, click outside the box to enter the change.
H
Click the keypad button to the left of the number entry box. Use the pop-up
keypad to enter a setting for the line number.
H
Using the keyboard to directly input the desired value.
3. Click the Average box to change the number of times the measurement is
averaged.
VM5000 Automatic Video Measurement Set User Manual
3- 89
Setting Up Measurements
There are three ways to change the average:
H
Turn the top knob on the front panel to change the number of averages.
When it is set to the correct number, click outside the box to enter the
change.
H
Click the keypad button to the left of the number entry box. Use the pop-up
keypad to enter a setting for the number of averages to perform.
H
Using the keyboard to directly input the desired value.
The next time the H Timing measurement is run, it will run with the newly
entered numbers.
Setting Up the Linearity Measurement
Option VGA
To set up the Linearity measurement, you must display the Results > Linearity
pane. The results panel for the measurement shows the settings that you can
change for the measurement. For Linearity, you can choose the line on which the
measurement is made and the number of times the measurement is averaged.
To change the settings for the Linearity measurement:
1. On the menu bar, click Results > Linearity.
2. To change the line number, click the Line Number box.
There are three ways to change the line number:
3- 90
H
Turn the top knob on the front panel to change the number. When it is set to
the correct number, click outside the box to enter the change.
H
Click the keypad button to the left of the number entry box. Use the pop-up
keypad to enter a setting for the line number.
H
Using the keyboard to directly input the desired value.
VM5000 Automatic Video Measurement Set User Manual
Setting Up Measurements
3. Click the Average box to change the number of times the measurement is
averaged.
There are three ways to change the average:
H
Turn the top knob on the front panel to change the number of averages.
When it is set to the correct number, click outside the box to enter the
change.
H
Click the keypad button to the left of the number entry box. Use the pop-up
keypad to enter a setting for the number of averages to perform.
H
Using the keyboard to directly input the desired value.
The next time the Linearity measurement is run, it will run with the newly
entered numbers.
Setting Up the Luma Levels Measurement
Option VGA
To set up the Luma Levels measurement, select Results > Luma Levels to
display the result panel. The results panel for the measurement shows the
settings that you can change for the measurement. For Luma Levels, you can
choose the line on which the measurement is made and the number of times the
measurement is averaged.
To change the settings for the Luma Levels measurement:
1. On the menu bar, click Results > Luma Levels.
2. To change the line number, click the Line Number box.
There are three ways to change the line number:
H
Turn the top knob on the front panel to change the number. When it is set to
the correct number, click outside the box to enter the change.
VM5000 Automatic Video Measurement Set User Manual
3- 91
Setting Up Measurements
H
Click the keypad button to the left of the number entry box. Use the pop-up
keypad to enter a setting for the line number.
H
Using the keyboard to directly input the desired value.
3. Click the Average box to change the number of times the measurement is
averaged.
3- 92
VM5000 Automatic Video Measurement Set User Manual
Setting Up Measurements
There are three ways to change the average:
H
Turn the top knob on the front panel to change the number of averages.
When it is set to the correct number, click outside the box to enter the
change.
H
Click the keypad button to the left of the number entry box. Use the pop-up
keypad to enter a setting for the number of averages to perform.
H
Using the keyboard to directly input the desired value.
The next time the Luma Levels measurement is run, it will run with the newly
entered numbers.
Setting Up the Noise Inj Ratio Measurement
Option VGA
To set up the Noise Inj Ratio measurement, select Results > Noise Inj Ratio to
display the result panel. The results panel for the measurement shows the
settings that you can change for the measurement. For Noise Inj Ratio, you can
choose the line on which the measurement is made and the number of times the
measurement is averaged.
To change the settings for the Noise Inj Ratio measurement:
1. On the menu bar, click Results > Noise Inj Ratio.
2. To change the line number, click the Line Number box.
There are three ways to change the line number:
H
Turn the top knob on the front panel to change the number. When it is set to
the correct number, click outside the box to enter the change.
H
Click the keypad button to the left of the number entry box. Use the pop-up
keypad to enter a setting for the line number.
H
Using the keyboard to directly input the desired value.
VM5000 Automatic Video Measurement Set User Manual
3- 93
Setting Up Measurements
3. Click the Average box to change the number of times the measurement is
averaged.
There are three ways to change the average:
H
Turn the top knob on the front panel to change the number of averages.
When it is set to the correct number, click outside the box to enter the
change.
H
Click the keypad button to the left of the number entry box. Use the pop-up
keypad to enter a setting for the number of averages to perform.
H
Using the keyboard to directly input the desired value.
4. Select the 500 MHz Filter, to ensure accuracy and compliance with VESA
specifications. With the filter off, you can run the measurement over a
bandwidth greater than 500 MHz.
The next time the Noise Inj ratio measurement is run, it will run with the newly
entered numbers.
Setting Up the V Sync Measurement
Option VGA
To set up the V Sync measurement, select Results > V Sync to display the result
panel. The results panel for the measurement shows the settings that you can
change for the measurement. For V Sync, you can choose the number of times
the measurement is averaged.
To change the settings for the V Sync measurement:
1. On the menu bar, click Results > V Sync.
3- 94
VM5000 Automatic Video Measurement Set User Manual
Setting Up Measurements
2. Click the Average box to change the number of times the measurement is
averaged.
There are three ways to change the average:
H
Turn the top knob on the front panel to change the number of averages.
When it is set to the correct number, click outside the box to enter the
change.
H
Click the keypad button to the left of the number entry box. Use the pop-up
keypad to enter a setting for the number of averages to perform.
H
Using the keyboard to directly input the desired value.
The next time the V Sync measurement is run, it will run with the newly entered
numbers.
Setting Up the V Timing Measurement
Option VGA
To set up the V Timing measurement, select Results > V Timing to display the
result panel. The results panel for the measurement shows the settings that you
can change for the measurement. For V Timing, you can choose the number of
times the measurement is averaged.
To change the settings for the V Timing measurement:
1. On the menu bar, click Results > V Timing.
2. Click the Average box to change the number of times the measurement is
averaged.
There are three ways to change the average:
H
Turn the top knob on the front panel to change the number of averages.
When it is set to the correct number, click outside the box to enter the
change.
VM5000 Automatic Video Measurement Set User Manual
3- 95
Setting Up Measurements
H
Click the keypad button to the left of the number entry box. Use the pop-up
keypad to enter a setting for the number of averages to perform.
H
Using the keyboard to directly input the desired value.
The next time the V Timing measurement is run, it will run with the newly
entered numbers.
Setting Up the Video Transient Measurement
Option VGA
To set up the Video Transient measurement, select Results > Video Transient to
display the result panel. The results panel for the measurement shows the
settings that you can change for the measurement. For Video Transient, you can
choose the line on which the measurement is made and the number of times the
measurement is averaged.
To change the settings for the Video Transient measurement:
1. On the menu bar, click Results > Video Transient.
2. To change the line number, click the Line Number box.
There are three ways to change the line number:
H
Turn the top knob on the front panel to change the number. When it is set to
the correct number, click outside the box to enter the change.
H
Click the keypad button to the left of the number entry box. Use the pop-up
keypad to enter a setting for the line number.
H
Using the keyboard to directly input the desired value.
3. Click the Average box to change the number of times the measurement is
averaged.
There are three ways to change the average:
3- 96
VM5000 Automatic Video Measurement Set User Manual
Setting Up Measurements
H
Turn the top knob on the front panel to change the number of averages.
When it is set to the correct number, click outside the box to enter the
change.
H
Click the keypad button to the left of the number entry box. Use the pop-up
keypad to enter a setting for the number of averages to perform.
H
Using the keyboard to directly input the desired value.
The next time the Video Transient measurement is run, it will run with the newly
entered numbers.
VM5000 Automatic Video Measurement Set User Manual
3- 97
Viewing Measurement Results
Use the Results menu to select the measurement results you want to display. You
can choose to display a summary of all results or select a single measurement to
see complete results for that measurement.
Displaying the Results Summary
The results summary panel is displayed automatically if more than one measurement has been selected for execution. When only a single measurement is
selected, the results panel corresponding to the selected measurement gets
displayed automatically. However, the results summary can be manually selected
at any point of time by selecting Results > Summary. With the Multi Line
measurements enabled, the results summary is not available.
A Results Summary window displays the Status and Warnings for the selected
measurements, and the status for unselected measurements is displayed as ‘------’.
Refer to Figure 3--18 for Option SD/HD. Refer to Figure 3--19 for Option VGA.
Figure 3- 18: Displaying the results summary (Option SD/HD)
Figure 3- 19: Displaying the results summary (Option VGA)
VM5000 Automatic Video Measurement Set User Manual
3- 99
Viewing Measurement Results
The Results Summary displays the current status of the measurements. If no
measurements have been taken, ------ is displayed in all the boxes in the summary
table. Once measurements have been taken, the contents vary depending on
whether limit testing was enabled, and whether warnings were generated.
Tables 3--4 and 3--5 describe the indicators that can appear in the Results
Summary.
Table 3- 4: Status Box Indicators in Results Summary pane
Status box
Description
------
No measurements taken
Done
Measurement completed
Fail
Measurement completed with Limit testing enabled and Failed
Pass
Measurement completed with Limit testing enabled and Passed
Stopped
Measurement halted before completion
Table 3- 5: Warning Box Indicators in Results Summary pane
3- 100
Warning box
Description
------ (gray)
No warnings; no measurements taken
------ (white)
Measurements completed with no warnings
Yes
Measurements completed with warnings
VM5000 Automatic Video Measurement Set User Manual
Viewing Measurement Results
Displaying Channel Delay Measurement Results
Option SD/HD
Configure the Channel Delay measurements as explained in Setting Up the
Channel Delay Measurement on page 3--68. Take the measurement by clicking
the Run button. Click Results > Channel Delay. Refer to Figure 3--20.
Figure 3- 20: Displaying the Channel Delay measurement
Measured Values
Click the Measured tab to display the measured channel delay in ns in the
Results Channel Delay panel for the channel delay measurement.
Relative Values
If Relative to Reference testing is enabled (see Taking Measurements Relative to
a Reference, on page 3--60), you can display the calculated relative values by
clicking the Relative tab.
Reference Values
If Relative to Reference testing is enabled you can display the reference values
by clicking the Reference tab. (To create a custom reference file, see Creating a
Custom Reference File on page 3--62).
Limit Values
If Limit testing is enabled (see Taking Measurements with Limit Testing on
page 3--64), you can display the Limit values by clicking the Limits tab. The
minimum and maximum values are set in the limits file for each signal format
and color space.
VM5000 Automatic Video Measurement Set User Manual
3- 101
Viewing Measurement Results
Select the min option to display the minimum channel delay values. Select the
max option to display the maximum channel delay values. Refer to Figure 3--21.
Figure 3- 21: Displaying limit values for the Channel Delay measurement
Displaying Color Bars Measurement Results
Option SD/HD
Configure the Color Bars measurements as explained in Setting Up the Color
Bars Measurement on page 3--69. Take the measurement by clicking the Run
button. Click Results > Color Bars. Refer to Figure 3--22.
Figure 3- 22: Displaying the Color Bars measurement
3- 102
Measured Values
Click the Measured tab to display the measured amplitude levels for each of the
eight colors for the color bars measurement.
Relative Values
If Relative to Reference testing is enabled (see Taking Measurements Relative to
a Reference on page 3--60), you can display the calculated relative values by
clicking the Relative tab.
VM5000 Automatic Video Measurement Set User Manual
Viewing Measurement Results
Reference Values
If Relative to Reference testing is enabled you can display the reference values
by clicking the Reference tab (To create a custom reference file see Creating a
Custom Reference File on page 3--62).
Limit Values
If Limit testing is enabled (see Taking Measurements with Limit Testing on
page 3--64), you can display the Limit values by clicking the Limits tab. The
minimum and maximum values are set in the limits file for each signal format
and color space. Select the min option to display the minimum limit values.
Select the max option to display the maximum limit values. Refer to
Figure 3--23.
Figure 3- 23: Displaying limit values for the Color Bars measurement
Additional Units
The only additional unit available in the Results panel for the Color Bars
measurement is % under the Relative tab.
VM5000 Automatic Video Measurement Set User Manual
3- 103
Test Equipment Depot - 800.517.8431 - 99 Washington Street Melrose, MA 02176 - FAX 781.665.0780 - TestEquipmentDepot.com
Viewing Measurement Results
Displaying Frequency Response Measurement Results
Option SD/HD
Configure the Frequency Response measurements as explained in Setting Up the
Frequency Response Measurement on page 3--70. Take the measurement by
clicking the Run button. Click Results > Frequency Response. Refer to
Figure 3--24.
Figure 3- 24: Displaying the Frequency Response measurement
3- 104
Measured Values
Click the Measured tab to display the Flag amplitude (mV), Frequency (MHz),
Amplitude (dB), Time Position (s), and RMS Distortion (% of Amp) measured
values.
Relative Values
If Relative to Reference testing is enabled (see Taking Measurements Relative to
a Reference, on page 3--60), you can display the calculated relative values by
clicking the Relative tab.
Reference Values
If Relative to Reference testing is enabled you can display the reference values
by clicking the Reference tab (To create a custom reference file see Creating a
Custom Reference File, on page 3--62).
Limit Values
If Limit testing is enabled (see Taking Measurements with Limit Testing, on
page 3--64), you can display the Limit values by clicking the Limits tab. The
minimum and maximum values are set in the limits file for each signal format
and color space.
VM5000 Automatic Video Measurement Set User Manual
Viewing Measurement Results
Select the min option to display the minimum values specified for the measurement. Select the max option to display the maximum values specified for the
measurement. Refer to Figure 3--25.
Figure 3- 25: Displaying limit values for the Frequency Response measurement
Additional Units
The only additional unit in the Results panel for Frequency Response measurements is % under the Relative tab. In the results display, the readout ‘--Infinity’
indicates that there was an attempt to divide a result by zero, and ‘NaN’ indicates
that there was an attempt to divide zero by zero. Refer to Figure 3--26.
Figure 3- 26: Displaying additional units for the Frequency Response measurement
VM5000 Automatic Video Measurement Set User Manual
3- 105
Viewing Measurement Results
Displaying Multiburst Measurement Results
Option SD/HD
Configure the Multiburst measurements as explained in Setting Up the
Multiburst measurement on page 3--73. Take the measurement by clicking the
Run button. Click Results > Multiburst. Refer to Figure 3--27.
Figure 3- 27: Displaying the Multiburst measurement
Measured Values
Relative Values
3- 106
Click the Measured tab to display the Flag (mV), Burst1, Burst2, Burst3,
Burst4, Burst5, and Burst6 values.
If Relative to Reference testing is enabled (see Taking Measurements Relative to
a Reference, on page 3--60), you can display the calculated relative values by
clicking the Relative tab.
Reference Values
If Relative to Reference testing is enabled you can display the reference values
by clicking the Reference tab (To create a custom reference file see Creating a
Custom Reference File, on page 3--62).
Limit Values
If Limit testing is enabled (see Taking Measurements with Limit Testing, on
page 3--64), you can display the Limit values by clicking the Limits tab. The
minimum and maximum values are set in the limits file for each signal format
and color space.
VM5000 Automatic Video Measurement Set User Manual
Viewing Measurement Results
Select the min option to display the minimum values for the measurement.
Select the max option to display the maximum values for the measurement.
Refer to Figure 3--28.
Figure 3- 28: Displaying limit values for the Multiburst measurement
Additional Units
The only additional unit in the Results pane for Multiburst measurement is %
under the Measured tab and Relative tab.
Displaying Noise Measurement Results
Option SD/HD
Configure the Noise measurements as explained in Setting Up the Noise
Measurement on page 3--74. Take the measurement by clicking the Run button.
Click Results > Noise. Refer to Figure 3--29.
Figure 3- 29: Displaying the Noise measurement
Measured Values
Click the Measured tab to display the measured amplitude level values.
VM5000 Automatic Video Measurement Set User Manual
3- 107
Viewing Measurement Results
Relative Values
If Relative to Reference testing is enabled (see Taking Measurements Relative to
a Reference, on page 3--60), you can display the calculated relative values by
clicking the Relative tab.
Reference Values
If Relative to Reference testing is enabled you can display the reference values
by clicking the Reference tab (To create a custom reference file see Creating a
Custom Reference File, on page 3--62).
Limit Values
If Limit testing is enabled (see Taking Measurements with Limit Testing, on
page 3--64), you can display the Limit values by clicking the Limits tab. The
minimum and maximum values are set in the limits file for each signal format
and color space. Select the min option to display the minimum amplitude level
values. Select the max option to display the maximum amplitude level values.
Refer to Figure 3--30.
Figure 3- 30: Displaying limit values for the Noise measurement
Displaying Noise
Spectrum
Configure the Noise Spectrum measurements as explained in Setting up for
Noise Spectrum measurements on page 3--77. Take the measurement by clicking
the Run button. Refer to Figure 3--31.
Figure 3- 31: Displaying the Noise Spectrum measurement
3- 108
VM5000 Automatic Video Measurement Set User Manual
Viewing Measurement Results
Click the Spectrum box to get the noise spectrum display on the VM5000 video
monitor; refer to Figure 3--32.
Figure 3- 32: Displaying the Noise Spectrum on the VM5000 video monitor
Displaying NonLinearity Measurement Results
Option SD/HD
Configure the NonLinearity measurements as explained in Setting Up the
NonLinearity Measurement on page 3--77. Take the measurement by clicking the
Run button. Click Results > NonLinearity. Refer to Figure 3--33.
Figure 3- 33: Displaying the NonLinearity measurement
Measured Values
Click the Measured tab to display the measured NonLinearity values.
VM5000 Automatic Video Measurement Set User Manual
3- 109
Viewing Measurement Results
Relative Values
If Relative to Reference testing is enabled you can display the calculated relative
values by clicking the Relative tab (see Taking Measurements Relative to a
Reference, on page 3--60).
Reference Values
If Relative to Reference testing is enabled you can display the reference values
by clicking the Reference tab (To create a custom reference file see Creating a
Custom Reference File, on page 3--62).
Limit Values
If Limit testing is enabled (see Taking Measurements with Limit Testing, on
page 3--64), you can display the Limit values by clicking the Limits tab. The
minimum and maximum values are set in the limits file for each signal format
and color space. Select the min option to display the minimum Non Linearity
values. Select the max option to display the maximum Non Linearity values.
Refer to Figure 3--34.
Figure 3- 34: Displaying limit values for the NonLinearity measurement
3- 110
VM5000 Automatic Video Measurement Set User Manual
Viewing Measurement Results
Displaying Short Time Distortion Measurement Results
Option SD/HD
Configure the Short Time Distortion measurements as explained in Setting Up
the Short Time Distortion Measurement on page 3--79. Take the measurement by
clicking the Run button. Click Results > Short Time Distortion. Refer to
Figure 3--35.
Figure 3- 35: Displaying the Short Time Distortion measurement
Measured Values
Relative Values
Click the Measured tab to display the Rise Time, Fall time, Overshoot,
Undershoot, and Settling Time.
If Relative to Reference testing is enabled (see Taking Measurements Relative to
a Reference, on page 3--60), you can display the calculated relative values by
clicking the Relative tab.
Reference Values
If Relative to Reference testing is enabled you can display the reference values
by clicking the Reference tab (To create a custom reference file see Creating a
Custom Reference File, on page 3--62).
Limit Values
If Limit testing is enabled, you can display the Limit values by clicking the
Limits tab (see Taking Measurements with Limit Testing, on page 3--64). The
minimum and maximum values are set in the limits file for each signal format
and color space.
VM5000 Automatic Video Measurement Set User Manual
3- 111
Viewing Measurement Results
Select the min option to display the minimum values. Select the max option to
display the maximum values. Refer to Figure 3--36.
Figure 3- 36: Displaying limit values for the Short Time Distortion measurement
Displaying Sync Measurement Results
Option SD/HD
Configure the Sync measurements as explained in Setting Up the Sync Measurement on page 3--80. Take the measurement by clicking the Run button. Refer to
Figure 3--37.
Figure 3- 37: Displaying the Sync measurement
Measured Values
Relative Values
3- 112
Click the Measured tab to display the measured Sync values.
If Relative to Reference testing is enabled (see Taking Measurements Relative to
a Reference, on page 3--60), you can display the calculated relative values by
clicking the Relative tab.
VM5000 Automatic Video Measurement Set User Manual
Viewing Measurement Results
Reference Values
Limit Values
If Relative to Reference testing is enabled you can display the reference values
by clicking the Reference tab (To create a custom reference file see Creating a
Custom Reference File, on page 3--62).
If Limit testing is enabled (see Taking Measurements with Limit Testing, on
page 3--64), you can display the Limit values by clicking the Limits tab. The
minimum and maximum values are set in the limits file for each signal format
and color space. Select the min option to display the minimum values. Select the
max option to display the maximum values. Refer to Figure 3--38.
Figure 3- 38: Displaying limit values for the Sync measurement
Displaying Ch-Ch Mismatch Measurement Results
Option VGA
Configure the Ch-Ch Mismatch measurement as explained in Setting Up the
Ch-Ch Mismatch Measurement on page 3--84. Take the measurement by clicking
the Run button. Click Results > Ch-Ch Mismatch. Refer to Figure 3--39.
Figure 3- 39: Ch-Ch Mismatch measurement results
VM5000 Automatic Video Measurement Set User Manual
3- 113
Viewing Measurement Results
Measured Values
Click the Measured tab to display the measured values in mV and %Peak--Peak.
Relative Values
If Relative to Reference testing is enabled you can display the calculated relative
values by clicking the Relative tab (see Taking Measurements Relative to a
Reference, on page 3--60).
Reference Values
Limit Values
If Relative to Reference testing is enabled, you can display the reference values
by clicking the Reference tab (see Creating a Custom Reference File, onpage 3--62).
If Limit testing is enabled, you can display the Limit values by clicking the
Limits tab (see Taking Measurements with Limit Testing, on page 3--64). The
minimum and maximum values are set in the limits file for the supported
combination of resolution, refresh rate, and timing standard. Select the min
option to display the minimum limit values. Select the max option to display the
maximum limit values. Refer to Figure 3--40.
Figure 3- 40: Limit values for the Ch-Ch Mismatch measurement
3- 114
VM5000 Automatic Video Measurement Set User Manual
Viewing Measurement Results
Displaying Ch-Ch Skew Measurement Results
Option VGA
Configure the Ch-Ch Skew measurement as explained in Setting Up the Ch-Ch
Skew Measurement on page 3--85. Take the measurement by clicking the Run
button. Click Results > Ch-Ch Skew. Refer to Figure 3--41.
Figure 3- 41: Ch-Ch Skew measurement results
Measured Values
Relative Values
Reference Values
Limit Values
Click the Measured tab to display the measured values in ns and (%)Pixel
Clock.
If Relative to Reference testing is enabled, you can display the calculated relative
values by clicking the Relative tab (see Taking Measurements Relative to a
Reference on page 3--60).
If Relative to Reference testing is enabled, you can display the reference values
by clicking the Reference tab (see Creating a Custom Reference File on
page 3--62).
If Limit testing is enabled, you can display the Limit values by clicking the
Limits tab (see Taking Measurements with Limit Testing on page 3--64). The
minimum and maximum values are set in the limits file for the supported
combination of resolution, refresh rate, and timing standard.
VM5000 Automatic Video Measurement Set User Manual
3- 115
Viewing Measurement Results
Select the min option to display the minimum limit values. Select the max
option to display the maximum limit values. Refer to Figure 3--42.
Figure 3- 42: Limit values for the Ch-Ch Skew measurement
Displaying Color Bars Measurement Results
Option VGA
Configure the Color Bars measurements as explained in Setting Up the Color
Bars Measurements on page 3--86. Take the measurement by clicking the Run
button. Click Results > Color Bars. Refer to Figure 3--43.
Figure 3- 43: Color Bars measurement results
Measured Values
Relative Values
3- 116
Click the Measured tab to display the measured amplitude levels for each of the
eight colors for the Color Bars measurement.
If Relative to Reference testing is enabled, you can display the calculated relative
values by clicking the Relative tab (see Taking Measurements Relative to a
Reference on page 3--60).
VM5000 Automatic Video Measurement Set User Manual
Viewing Measurement Results
Reference Values
Limit Values
If Relative to Reference testing is enabled, you can display the reference values
by clicking the Reference tab (see Creating a Custom Reference File on
page 3--64).
If Limit testing is enabled, you can display the Limit values by clicking the
Limits tab (see Taking Measurements with Limit Testing on page 3--64). The
minimum and maximum values are set in the limits file for the supported
combination of resolution, refresh rate, and timing standard. Select the min
option to display the minimum limit values. Select the max option to display the
maximum limit values. Refer to Figure 3--44.
Figure 3- 44: Limit values for the Color Bars measurement
Additional Units
The only additional unit available in the Results window for the Color Bars
measurement is % in the Relative tab.
VM5000 Automatic Video Measurement Set User Manual
3- 117
Viewing Measurement Results
Displaying H Sync Measurement Results
Option VGA
Configure the H Sync measurements as explained in Setting Up the H Sync
Measurement on page 3--87. Take the measurement by clicking the Run button.
Click Results > H Sync. Refer to Figure 3--45.
Figure 3- 45: H Sync measurement results
Measured Values
Relative Values
Reference Values
Limit Values
3- 118
Click the Measured tab to display the measured values.
If Relative to Reference testing is enabled, you can display the calculated relative
values by clicking the Relative tab (see Taking Measurements Relative to a
Reference on page 3--60).
If Relative to Reference testing is enabled, you can display the reference values
by clicking the Reference tab (see Creating a Custom Reference File on
page 3--62).
If Limit testing is enabled, (see Taking Measurements with Limit Testing on page
3--64) you can display the Limit values by clicking the Limits tab. The
minimum and maximum values are set in the limits file for the supported
combination of resolution, refresh rate, and timing standard.
VM5000 Automatic Video Measurement Set User Manual
Viewing Measurement Results
Select the min option to display the minimum limit values specified for the
measurement. Select the max option to display the maximum limit values
specified for the measurement. Refer to Figure 3--46.
Figure 3- 46: Limit values for the H Sync measurement
In the Result panel of the H Sync measurement, the parameters are different in
the absence of MIU.
Additional Units
The only additional unit available in the Results window for the H Sync
measurement is % in the Relative tab.
Displaying H Sync Jitter Measurement Results
Option VGA
Configure the H Sync Jitter measurements as explained in Setting Up the H Sync
Jitter Measurement on page 3--88. Take the measurement by clicking the Run
button. Click Results > H Sync Jitter. Refer to Figure 3--47.
Figure 3- 47: H Sync Jitter measurement results
VM5000 Automatic Video Measurement Set User Manual
3- 119
Viewing Measurement Results
Measured Values
Relative Values
Reference Values
Limit Values
Click the Measured tab to display the measured values.
If Relative to Reference testing is enabled, you can display the calculated relative
values by clicking the Relative tab (see Taking Measurements Relative to a
Reference on page 3--60).
If Relative to Reference testing is enabled, you can display the reference values
by clicking the Reference tab (see Creating a Custom Reference File on
page 3--62).
If Limit testing is enabled (see Taking Measurements with Limit Testing on
page 3--64), you can display the Limit values by clicking the Limits tab. The
minimum and maximum values are set in the limits file for the supported
combination of resolution, refresh rate, and timing standard. Select the min
option to display the minimum limit values for the measurement. Select the max
option to display the maximum limit values for the measurement. Refer to
Figure 3--48.
Figure 3- 48: Limit values for the H Sync Jitter measurement
Additional Units
3- 120
The only additional unit available in the Results window for the H Sync Jitter
measurement is % in the Measured tab and the Relative tab.
VM5000 Automatic Video Measurement Set User Manual
Viewing Measurement Results
Displaying H Timing Measurement Results
Option VGA
Configure the H Timing measurements as explained in Setting Up the H Timing
Measurement on page 3--89. Take the measurement by clicking the Run button.
Click Results > H Timing. Refer to Figure 3--49.
Figure 3- 49: H Timing measurement results
Measured Values
Relative Values
Reference Values
Limit Values
Click the Measured tab to display the measured values.
If Relative to Reference testing is enabled, you can display the calculated relative
values by clicking the Relative tab (see Taking Measurements Relative to a
Reference on page 3--60).
If Relative to Reference testing is enabled, you can display the reference values
by clicking the Reference tab (see Creating a Custom Reference File on
page 3--62).
If Limit testing is enabled (see Taking Measurements with Limit Testing on
page 3--64), you can display the Limit values by clicking the Limits tab. The
minimum and maximum values are set in the limits file for the supported
combination of resolution, refresh rate, and timing standard.
VM5000 Automatic Video Measurement Set User Manual
3- 121
Viewing Measurement Results
Select the min option to display the minimum limit values for the measurement.
Select the max option to display the maximum limit values for the measurement.
Refer to Figure 3--50.
Figure 3- 50: Limit values for the H Timing measurement
Displaying Linearity Measurement Results
Option VGA
Configure the Linearity measurements as explained in Setting Up the Linearity
Measurement on page 3--90. Take the measurement by clicking the Run button.
Click Results > Linearity. Refer to Figure 3--51.
Figure 3- 51: Linearity measurement results
Measured Values
Relative Values
3- 122
Click the Measured tab to display the measured values.
If Relative to Reference testing is enabled, you can display the calculated relative
values by clicking the Relative tab (see Taking Measurements Relative to a
Reference on page 3--60).
VM5000 Automatic Video Measurement Set User Manual
Viewing Measurement Results
Reference Values
Limit Values
If Relative to Reference testing is enabled, you can display the reference values
by clicking the Reference tab (see Creating a Custom Reference File on
page 3--62).
If Limit testing is enabled, you can display the Limit values by clicking the
Limits tab (see Taking Measurements with Limit Testing on page 3--64). The
minimum and maximum values are set in the limits file for the supported
combination of resolution, refresh rate, and timing standard. Select the min
option to display the minimum limit values for the measurement. Select the max
option to display the maximum limit values for the measurement. Refer to
Figure 3--52.
Figure 3- 52: Limit values for the Linearity measurement
VM5000 Automatic Video Measurement Set User Manual
3- 123
Viewing Measurement Results
Displaying Luma Levels Measurement Results
Option VGA
Configure the Luma Levels measurements as explained in Setting Up the Luma
Levels Measurement on page 3--91. Take the measurement by clicking the Run
button. Click Results > Luma Levels. Refer to Figure 3--53.
Figure 3- 53: Luma Levels measurement results
Measured Values
Relative Values
Reference Values
Limit Values
3- 124
Click the Measured tab to display the measured values.
If Relative to Reference testing is enabled, you can display the calculated relative
values by clicking the Relative tab (see Taking Measurements Relative to a
Reference on page 3--60).
If Relative to Reference testing is enabled, you can display the reference values
by clicking the Reference tab (see Creating a Custom Reference File on
page 3--62).
If Limit testing is enabled, you can display the Limit values by clicking the
Limits tab (see Taking Measurements with Limit Testing on page 3--64). The
minimum and maximum values are set in the limits file for the supported
combination of resolution, refresh rate, and timing standard.
VM5000 Automatic Video Measurement Set User Manual
Viewing Measurement Results
Select the min option to display the minimum limit values for the measurement.
Select the max option to display the maximum limit values for the measurement.
Refer to Figure 3--54.
Figure 3- 54: Limit values for the Luma Levels measurement
Additional Units
The only additional unit available in the Results window for the Luma Levels
measurement is % in the Relative tab.
Displaying Noise Inj Ratio Measurement Results
Option VGA
Configure the Noise Inj Ratio measurements as explained in Setting Up the
Noise Inj Ratio Measurement on page 3--93. Take the measurement by clicking
the Run button. Click Results > Noise Inj Ratio. Refer to Figure 3--55.
Figure 3- 55: Noise Inj Ratio measurement results with MIU
Measured Values
Click the Measured tab to display the measured values in mV, dB, and Inj Ratio
(%). When the MIU is used, the measured values of Noise (in mV) less than
1 mV are displayed as <1. When the MIU is not used, the measured values of
Noise (in mV) less than 0.1 mV are displayed as <.1.
VM5000 Automatic Video Measurement Set User Manual
3- 125
Viewing Measurement Results
Relative Values
Reference Values
Limit Values
If Relative to Reference testing is enabled, you can display the calculated relative
values by clicking the Relative tab (see Taking Measurements Relative to a
Reference on page 3--60).
If Relative to Reference testing is enabled, you can display the reference values
by clicking the Reference tab (see Creating a Custom Reference File on
page 3--62).
If Limit testing is enabled, you can display the Limit values by clicking the
Limits tab (see Taking Measurements with Limit Testing on page 3--64). The
minimum and maximum values are set in the limits file for the supported
combination of resolution, refresh rate, and timing standard. Select the min
option to display the minimum limit values. Select the max option to display the
maximum limit values. Refer to Figure 3--56.
Figure 3- 56: Limit values for the Noise Inj Ratio measurement
3- 126
VM5000 Automatic Video Measurement Set User Manual
Viewing Measurement Results
Displaying V Sync Measurement Results
Option VGA
Configure the V Sync measurements as explained in Setting Up the V Sync
Measurement on page 3--94. Take the measurement by clicking the Run button.
Click Results > V Sync. Refer to Figure 3--57.
Figure 3- 57: V Sync measurement results
Measured Values
Relative Values
Reference Values
Limit Values
Click the Measured tab to display the measured values.
If Relative to Reference testing is enabled, you can display the calculated relative
values by clicking the Relative tab (see Taking Measurements Relative to a
Reference on page 3--60).
If Relative to Reference testing is enabled, you can display the reference values
by clicking the Reference tab (see Creating a Custom Reference File on
page 3--62.)
If Limit testing is enabled, you can display the Limit values by clicking the
Limits tab (see Taking Measurements with Limit Testing on page 3--64). The
minimum and maximum values are set in the limits file for the supported
combination of resolution, refresh rate, and timing standard.
VM5000 Automatic Video Measurement Set User Manual
3- 127
Viewing Measurement Results
Select the min option to display the minimum limit values. Select the max
option to display the maximum limit values. Refer to Figure 3--58.
Figure 3- 58: Limit values for the V Sync measurement
In the Result panel of the V Sync measurement, the parameters are different in
the absence of MIU.
Displaying V Timing Measurement Results
Option VGA
Configure the V Timing measurements as explained in Setting Up the V Timing
Measurement on page 3--95. Take the measurement by clicking the Run button.
Click Results > V Timing. Refer to Figure 3--59.
Figure 3- 59: V Timing measurement results
3- 128
VM5000 Automatic Video Measurement Set User Manual
Test Equipment Depot - 800.517.8431 - 99 Washington Street Melrose, MA 02176 - FAX 781.665.0780 - TestEquipmentDepot.com
Viewing Measurement Results
Measured Values
Relative Values
Reference Values
Limit Values
Click the Measured tab to display the measured values.
If Relative to Reference testing is enabled, you can display the calculated relative
values by clicking the Relative tab (see Taking Measurements Relative to a
Reference on page 3--60).
If Relative to Reference testing is enabled, you can display the reference values
by clicking the Reference tab (see Creating a Custom Reference File on
page 3--62).
If Limit testing is enabled, you can display the Limit values by clicking the
Limits tab (see Taking Measurements with Limit Testing on page 3--64). The
minimum and maximum values are set in the limits file for the supported
combination of resolution, refresh rate, and timing standard. Select the min
option to display the minimum limit values for the measurement. Select the max
option to display the maximum limit values for the measurement. Refer to
Figure 3--60.
Figure 3- 60: Limit values for the V Timing measurement
VM5000 Automatic Video Measurement Set User Manual
3- 129
Viewing Measurement Results
Displaying Video Transient Measurement Results
Option VGA
Configure the Video Transient measurements as explained in Setting Up the
Video Transient Measurement on page 3--96. Take the measurement by clicking
the Run button. Click Results > Video Transient. Refer to Figure 3--61.
Figure 3- 61: Video Transient measurement results
Measured Values
Relative Values
Reference Values
Limit Values
3- 130
Click the Measured tab to display the measured values.
If Relative to Reference testing is enabled, you can display the calculated relative
values by clicking the Relative tab (see Taking Measurements Relative to a
Reference on page 3--60).
If Relative to Reference testing is enabled, you can display the reference values
by clicking the Reference tab (see Creating a Custom Reference File on
page 3--62.)
If Limit testing is enabled, you can display the Limit values by clicking the
Limits tab (see Taking Measurements with Limit Testing on page 3--64). The
minimum and maximum values are set in the limits file for the supported
combination of resolution, refresh rate, and timing standard.
VM5000 Automatic Video Measurement Set User Manual
Viewing Measurement Results
Select the min option to display the minimum limit values. Select the max
option to display the maximum limit values. Refer to Figure 3--62.
Figure 3- 62: Limit values for the Video Transient measurement
VM5000 Automatic Video Measurement Set User Manual
3- 131
Viewing Measurement Results
Displaying Pass/Fail Results
To display Pass/Fail results, the user must enable Limit Testing. Note that results
that Pass appear in green and results that Fail appear in red. You can display the
Pass/Fail results for more than one measurement in the results summary. Refer to
Figure 3--63 for Option SD/HD. Refer to Figure 3--64 for Option VGA.
Figure 3- 63: Displaying Pass/Fail results in results summary for Option SD/HD
Figure 3- 64: Displaying Pass/Fail results in results summary for Option VGA
3- 132
VM5000 Automatic Video Measurement Set User Manual
Viewing Measurement Results
To display the pass/fail results for a specific measurement, select it from the
Results menu. After selecting a measurement, the results display for that
measurement appears where you can view the pass/fail status of individual
measurements. Refer to Figure 3--65 for Option SD/HD. Refer to Figure 3--66 for
Option VGA.
Figure 3- 65: Displaying Pass/Fail results (Option SD/HD)
Figure 3- 66: Displaying Pass/Fail results (Option VGA)
To display Pass/Fail results for an individual measurement:
1. Enable limit testing as described on page 3--64.
2. Select Configure > Measurements. Select the measurements you wish to
run.
3. Click the Run button to take the measurements.
4. Select the measurement you wish to view from the Results menu.
Results appear in green text if the measurement falls between the maximum and
minimum limits. Results appear in red text if the measurement falls above the
maximum limit or below the minimum limit.
VM5000 Automatic Video Measurement Set User Manual
3- 133
Appendices
Appendix A: Specifications
All specifications are guaranteed unless labeled “typical.” Typical specifications
are provided for your convenience but are not guaranteed.
H
The instrument must have been calibrated in an ambient temperature
between 20 °C and 30 °C (68 °F and 86 °F).
H
The instrument must be operating within the environmental limits listed in
Table A--9 on page A--15.
H
The instrument must be powered from a source that meets the specifications
listed in Table A--7 on page A--14.
H
The instrument must have been operating continuously for at least 20
minutes within the specified operating temperature range.
H
You must perform the Signal Path Compensation procedure (Option SD/HD
only) after the 20-minute warm-up period. If the ambient temperature
changes more than 5 °C (10 °F) you must restart the procedure. See Signal
Path Compensation for Option SD/HD on page 2--13.
The specifications listed in Tables A--1 through A--10 apply to all options. The
specifications specific to Option SD/HD begin on page A--19. The specifications
specific to Option VGA begin on page A--22.
Table A- 1: Channel input and vertical specifications
Characteristic
Description
Input coupling
AC, DC, and GND
Input channels
Four identical channels
Input impedance selection
50 Ω or 1 MΩ
Bandwidth limited to 500 MHz, 1 MΩ selected
Input impedance,
impedance DC coupled
50 Ω ±2.5%,
±2 5% typical
1 MΩ ±1.0% in parallel with 18 pF ±2 pF
VSWR ≤1.5:1,
1 5:1 typical
typical, from DC to 1 GHz
Maximum voltage at input BNC
1 MΩ
AC, DC, or GND coupled
150 VRMS CAT I, and ≤400 peak
For steady state sinusoidal waveforms, derate at
20 dB/decade above 200 kHz to 9 VRMS at ≥3 MHz
50 Ω
<1 Vrms for settings below 100mV/div
<5 Vrms for 100 mV/div settings and above
VM5000 Automatic Video Measurement Set User Manual
A- 1
Appendix A: Specifications
Table A- 1: Channel input and vertical specifications (Cont.)
Characteristic
Description
Differential delay, DC 50 Ω input
≤100 ps between any two channels with DC input
coupling and the same V/div scale settings at or above
10 mV/div
Deskew range, typical
±75.0 ns
Channel-to-channel crosstalk
≥100:1 at ≤100 MHz
≥30:1 at >100 MHz up to the rated bandwidth for any two
channels with equal V/div settings
Digitizers
8-bit resolution
F separate
Four
t di
digitizers,
iti
eachh channel
h
l sampled
l d
simultaneously
Fine adjustment available with ≤1% resolution
Sensitivity range
1 MΩ
1 mV/div to 10 V/div, in a 1-2-5 sequence
50 Ω
1 mV/div to 1 V/div, in a 1-2-5 sequence
Analog bandwidth
SCALE range
Bandwidth
1 mV/div to 1.99 mV/div
DC to 175 MHz
2 mV/div to 1 V/div
DC to 1 GHz
DC 50 Ω coupling; bandwidth limit set to Full; operating
ambient ≤30 °C; derated by 5 MHz/°C above 30 °C
Analog bandwidth selections
20 MHz, 150 MHz, or Full
Analog Bandwidth Limit
Low frequency, AC coupled 50 Ω: <200 kHz
1 MΩ: <10 Hz, reduced by a factor of ten when using a
10X probe
High frequency, typical
20 MHz: with 20 MHz bandwidth limit turned on
150 MHz: with 150 MHz bandwidth limit turned on
Calculated rise time, typical
Step response settling errors,
t i l
typical
≤2 V step amplitude
DC 50 Ω coupling, bandwidth limit set to Full
SCALE range
Rise time
1 mV/div to 1.99 mV/div
2.29 ns
2 mV/div to 1 V/div
300 ps
Bandwidth limit set to Full
SCALE range
Settling error at time after
step
1 mV/div to 99.5 mV/div
20 ns: ≤0.5%
100 ns: ≤0.2%
20 ms: ≤0.1%
A- 2
VM5000 Automatic Video Measurement Set User Manual
Appendix A: Specifications
Table A- 1: Channel input and vertical specifications (Cont.)
Characteristic
≤20 V step amplitude
Description
100 mV/div to 1.0 V/div
20 ns: ≤1.0%
100 ns: ≤0.5%
20 ms: ≤0.2%
≤200 V step amplitude
1.01 V/div to 10 V/div
20 ns: ≤1.0%
100 ns: ≤0.5%
20 ms: ≤0.2%
Position range
±5 divisions
Peak Detect or Envelope Mode
Pulse Response
Capture of single event pulses
Offset range
1 MΩ coupling
50 Ω coupling
Offset accuracy
VM5000 Automatic Video Measurement Set User Manual
Number of channels
Minimum pulse width
1 or 2
400 ps
3 or 4
800 ps
User-adjustable input offset voltages
SCALE range
Offset range
1 mV/div to 99.5 mV/div
±1 V
100 mV/div to 1 V/div
±10 V
1.01 V/div to 10 V/div
±100 V
1 mV/div to 50 mV/div
±0.5 V
50.5 mV/div to 99.5 mV/div
±0.25 V
100 mV/div to 500 mV/div
±5 V
505 mV/div to 1 V/div
±2.5 V
SCALE range
Offset range
1 mV/div to 9.95 mV/div
±[(0.2% ×| net offset |) +
1.5 mV + (0.1 div ×V/div
setting)]
10 mV/div to 99.5 mV/div
±[(0.35% ×| net offset |) +
1.5 mV + (0.1 div ×V/div
setting)]
100 mV/div to 1.0 V/div
±[(0.35% ×| net offset |) +
15 mV + (0.1 div ×V/div
setting)]
1.01 V/div to 10 V/div
±[(0.25% ×| net offset |) +
150 mV + (0.1 div ×V/div
setting]
A- 3
Appendix A: Specifications
Table A- 1: Channel input and vertical specifications (Cont.)
Characteristic
Description
Temperatures >40 °C
±[(0.75% ×| net offset |) +
150 mV + (0.1 div ×V/div
setting)]
where, net offset = offset - (position × volts/division)
DC gain accuracy, Sample or
Average acquisition mode
±3% + 1.0% × |net offset /offset range| for 2 mV/div 3.98 mV/div
DC voltage measurement accuracy
Measurement type
DC accuracy (in volts)
Any sample
2 mV/div - 3.98 mV/div
±[(1.5% + 3.0% × |net
offset /offset range|)×
|reading - net offset| +
offset accuracy + 0.13 div
×V/div setting + 0.6 mV]
Delta voltage measurement
between any two points
acquired under the same
setup and ambient conditions
2 mV/div - 3.98 mV/div
±[1.5% + 3.0% × |net
offset /offset range|×
|reading - net offset| + 0.26
div ×V/div setting
+ 1.2 mV]
Sample acquisition mode,
typical
Where, net offset = offset - (position × volts/division)
Average acquisition mode
Average of ≥16 waveforms
2 mV/div - 3.98 mV/div
±[1.5% + 3.0% ×
|net offset /offset range|×
|reading - net offset| +
offset accuracy + 0.06 div
× V/div]
Delta voltage measurement
between any two averages
of ≥16 waveforms acquired
under the same setup and
ambient conditions
2 mV/div - 3.98 mV/div
±[1.5% + 3.0% × |net
offset /offset range|×
|reading - net offset|
+ 0.1 div × V/div
+ 0.3 mV]
Where, net offset = offset - (position × volts/division)
Nonlinearity, typical
A- 4
<1 LSB differential, <1 LSB integral, independently
based
VM5000 Automatic Video Measurement Set User Manual
Appendix A: Specifications
Table A- 1: Channel input and vertical specifications (Cont.)
Characteristic
Description
Effective bits,
bits typical
Signal and input conditions
Sine wave input at the indicated fre- 1 MHz, 9.2 div, 5 GS/s
quency and pk-pk amplitude,
sample rate, Sample
50 mV/div and 25 °C
acquisition mode
Signal and input conditions
6.6 bits
1 MHz, 9.2 div, 10 MS/s
9.0 bits
sample rate, HiRes acquisition mode
1 GHz, 6.5 div, 5 GS/s
sample rate, Sample
acquisition mode
4.7 bits
Table A- 2: Horizontal and acquisition system specifications
Characteristic
Description
Acquisition modes
Sample, Peak detect, Hi Res, Average, and Envelope
Fast acquisition rate
Up to 100,000 waveforms-per-second with Fast
Acquisition mode on
Up to 130 waveforms-per-second with Fast Acquisition
mode off
Minimum record length
500 points
Maximum record length
Depends on number of active channels and amount of
memory installed
Standard
2,000,000 points (3 or 4 channels)
4,000,000 points (2 channels)
8,000,000 points (1 channel)
Option 3M installed
4,000,000 points (3 or 4 channels)
8,000,000 points (2 channels)
16,000,000 points (1 channel)
Sample rate range, real-time
VM5000 Automatic Video Measurement Set User Manual
Number acquired channels
Sample rate range
1
1.25 S/s to 5 GS/s
2
1.25 S/s to 2.5 GS/s
3 or 4
1.25 S/s to 1.25 GS/s
A- 5
Appendix A: Specifications
Table A- 2: Horizontal and acquisition system specifications (Cont.)
Characteristic
Description
Equivalent-time sample rate or
interpolated waveform rate range
2.5 GS/s to 250 GS/s
Listed values depend on the number of channels in use,
horizontal scale, and resolution settings.
Equivalent-time acquisition can be enabled or disabled.
When disabled, waveforms are interpolated at the fastest
time base settings.
Seconds/division range
(s/div x 10) to 1,000 s
Horizontal delay range
16 ns to 250 s
Long term sample rate and delay
time accuracy
±15 ppm over any ≥1 ms interval
RMS aperture uncertainty, typical
≤ [3 ps + (0.1 ppm × record duration)] for real-time or
interpolated records with a duration ≥1 minute
Delta time measurement
accuracy
For a single channel, with signal amplitude > 5 div,
reference level set at 50%, interpolation set to sin(x)/x,
volts/division set to ≥ 5 mV/div, with (displayed
risetime)/(sample interval) ratio between 1.4 and 4, where
sample interval = 1/(real-time sample rate)
Conditions
Accuracy
Single shot signal, Sample, ± (15 ppm × | reading | +
or Hi Res acquisition mode, 0.3 sample intervals)
Full bandwidth
Average acquisition mode,
≥100 averages, Full bandwidth
± (15 ppm × | reading | +
20 ps)
Table A- 3: Trigger specifications
A- 6
Characteristic
Description
Auxiliary trigger input resistance,
typical
≥1.5 kΩ
Maximum trigger input voltage,
typical
±20 V (DC or peak AC)
Edge trigger sensitivity, Main and
D l d ttrigger
Delayed
i
Trigger Source
Sensitivity
Any channel, DC coupled
0.35 div from DC to
50 MHz, increasing to 1 div
at 1 GHz
Auxiliary input
400 mV from DC to
50 MHz, increasing to
750 mV at 100 MHz
VM5000 Automatic Video Measurement Set User Manual
Appendix A: Specifications
Table A- 3: Trigger specifications (Cont.)
Characteristic
Description
Edge trigger sensitivity, typical
All sources, for vertical scale settings ≥10 mV/div and
≤1 V/div
Advanced trigger sensitivity, typical
Trigger coupling
Sensitivity
NOISE REJ
3 × the DC-coupled limits
AC
Same as DC-coupled limits
for frequencies ≥60 Hz;
attenuates signals <60 Hz
HF REJ
1.5 × the DC-coupled
limits from DC to 30 kHz;
attenuates signals >30 kHz
LF REJ
1.5 × the DC-coupled
limits for frequencies
≥80 kHz; attenuates signals
<80 kHz
For all trigger types except Edge, with vertical scale
settings ≥10 mV/div and ≤1 V/div
1.0 div from DC to 500 MHz
Event count sensitivity, typical
For sequential trigger delayed by events, with vertical
scale settings ≥10 mV/div and ≤1 V/div
1.0 div, from DC to 500 MHz
Video trigger sensitivity, typical
For delayed and main triggers, with vertical scale settings
≥10 mV/div and ≤1 V/div
Any channel
Video Trigger Format
0.6 to 2.5 divisions of video
sync tip
Triggers from negative sync composite video, field 1 or
field 2 for interlaced systems, any field, specific line, or
any line for interlaced or noninterlaced systems
Supported systems include NTSC, PAL, SECAM, and
analog HDTV
Trigger level or threshold range
VM5000 Automatic Video Measurement Set User Manual
Trigger Source
Sensitivity
Any channel
±10 divisions from center of
screen
Auxiliary input
±8 V
Line
Fixed at zero volts
A- 7
Appendix A: Specifications
Table A- 3: Trigger specifications (Cont.)
Characteristic
Description
Trigger level or threshold accuracy,
typical
Edge trigger, DC coupling, for signals having rise and fall
times ≤20 ns
Trigger Source
Accuracy
Any channel
± [(2% ×| setting - net
offset |) + (0.3 div × volts/
div setting) +
offset accuracy]
Auxiliary
Not calibrated or specified
Where, net offset = offset - (position × volts/division)
Set level to 50% function, typical
Operates with signals ≥30 Hz
Trigger position error, typical
Edge trigger, DC coupling, for signals having a slew rate
at the trigger point of ≤0.5 div/ns
Acquisition mode
Error
Sample, Average
± (1 displayed pt + 1 ns)
Envelope
± (2 displayed pts + 1 ns)
Trigger jitter, typical
σ = 8 ps RMS
B Event (Delayed) trigger
Trigger After Time
Trigger on n th Event
Delay time = 16 ns to
250 s
Event count = 1 to 107
Range
Minimum time between arm 2 ns from the end of the
(A Event) and trigger
time period to the B trigger
(B Event), typical
event
2 ns between the A trigger
event and the first B trigger
event
Minimum pulse width,
typical
B event width ≥1 ns
—
Maximum frequency, typical —
For vertical scale settings ≥10 mV/div and ≤1 V/div
Advanced trigger timing
Minimum recognizable
event width or time
A- 8
B event frequency
≤500 MHz
Minimum rearm time to
recognize next event
Glitch type
Minimum glitch width = 1 ns 2 ns + 5% of glitch width
setting
Runt or window type
Minimum runt width = 2 ns
2 ns
Runt or window type (time
qualified)
Minimum runt width = 2 ns
8.5 ns + 5% of runt width
setting
Runt or window type (logic
qualified)
Minimum runt width = 2 ns
8.5 ns + 5% of runt width
setting
VM5000 Automatic Video Measurement Set User Manual
Appendix A: Specifications
Table A- 3: Trigger specifications (Cont.)
Characteristic
Description
Width type
Minimum difference
between upper and lower
limits = 1 ns
2 ns + 5% of upper limit
setting
Timeout type
Minimum timeout time =
1 ns
2 ns + 5% of timeout setting
Transition type
Minimum transition time =
600 ps
8.5 ns + 5% of transition
time setting
Pattern type, typical
Minimum time the pattern is 1 ns
true = 1 ns
Logic
Not applicable
1 ns
Events Delay
1 ns (single channel)
Not applicable
State type, typical
Minimum true time before
clock edge = 1 ns
1 ns
Minimum true time after
clock edge = 1 ns
Setup/Hold type, typical
Minimum clock pulse width Minimum clock pulse width
from active edge to inactive from inactive edge to active
edge
edge
3 ns + hold time setting
2 ns
Setup and Hold parameters Limits
Advanced trigger timer ranges
Setup time (time from data
transition to clock edge)
- 100 ns minimum
+100 ns maximum
Hold time (time from clock
edge to data transition)
- 1 ns minimum
+102 ns maximum
Setup time + Hold time
(algebraic sum of the two
settings)
+2 ns minimum
+202 ns maximum
Limits
Glitch type
1 ns to 1 s
Runt or window type, wider
than
1 ns to 1 s
Runt or window type, time
qualified
1 ns to 1 s
Width type
1 ns to 1 s
Timeout type
1 ns to 1 s
Transition type
1 ns to 1 s
Pattern type
1 ns to 1 s
Setup/Hold type
Setup and Hold timers
VM5000 Automatic Video Measurement Set User Manual
Limits
A- 9
Appendix A: Specifications
Table A- 3: Trigger specifications (Cont.)
Characteristic
Description
Advanced trigger timer accuracy
Trigger holdoff range
A- 10
Setup time (time from data
transition to clock edge)
- 100 ns to +100 ns
Hold time (time from clock
edge to data transition)
- 1 ns to +100 ns
Setup time + Hold time
(algebraic sum of the two
settings)
+2 ns to +200 ns
For Glitch, Timeout, or Width types
Time range
Accuracy
1 ns to 500 ns
±(20% of setting + 0.5 ns)
520 ns to 1 s
±(0.01% of setting +
100 ns)
1.5 s to 12 s, minimum resolution is 8 s for settings
≤1.2 ms
VM5000 Automatic Video Measurement Set User Manual
Appendix A: Specifications
Table A- 4: Display specifications
Characteristic
Description
Display Type
264 mm (10.4 in) diagonal, liquid crystal active-matrix
color display
Width: 211.2 mm (8.3 in)
Length: 158.4 mm (6.2 in)
Display resolution
640 horizontal × 480 vertical pixels
Pixel pitch
0.33 mm horizontal, 0.33 mm vertical
Contrast ratio, typical
150:1
Response time, typical
50 ms, black to white
Display refresh rate
59.94 frames per second
Display Format
YT, XY, XYZ
Displayed intensity levels
Supports Windows SVGA high-color mode
(16-bit or 24-bit)
Waveform Styles
Vectors, Dots, Intensified Samples, Variable Persistence,
Infinite Persistence.
Table A- 5: Input/output port specifications
Characteristic
Description
Probe Compensator Output
Front-panel terminals
Analog Signal Output
Output voltage
Frequency
1.0 V (from base to top)
±1.0% into a ≥ 10 kΩ load
1 kHz ±5%
Rear-panel BNC connector, provides a buffered version of
the signal that is attached to the channel 3 signal input
50 mV/div ±20% into a 1 MΩ load
25 mV/div ±20% into a 50 Ω load
Bandwidth, typical
Auxiliary Output levels
100 MHz into a 50 Ω load
Rear-panel BNC connector, provides a TTL-compatible,
negative-polarity pulse for each A or B trigger (selectable)
Vout high
Vout low (true)
≥2.5 V into open circuit,
≥1.0 V into 50 Ω load
≤0.7 V with ≤4 mA sink,
≤0.25 V into 50 Ω load
Auxiliary Output pulse width, typical Pulse width varies, 1 s minimum
VM5000 Automatic Video Measurement Set User Manual
A- 11
Appendix A: Specifications
Table A- 5: Input/output port specifications (Cont.)
Characteristic
Description
External Reference Input
Rear-panel BNC connector
9.8 MHz to 10.2 MHz
200 mVp-p to 7 Vp-p
<1.5 kΩ in series with ~10 nF DC blocking capacitor
Side-panel I/O ports
Ports located on the side panel
Parallel port (IEEE 1284)
DB-25 connector, supports the following modes:
Standard, output only
Bidirectional, PS-2 compatible
Bidirectional Enhanced Parallel Port (IEEE 1284
standard, mode 1 or mode 2, v 1.7)
Bidirectional High-speed Extended Capabilities Port
Audio ports
Miniature phone jacks for stereo microphone input and
stereo line output
USB port (2)
Allows connection or disconnection of USB keyboard
and/or mouse while oscilloscope power is on
Supports USB 2.0 protocol
Keyboard port
PS-2 compatible, oscilloscope power must be off to make
connection
Mouse port
PS-2 compatible, oscilloscope power must be off to make
connection
LAN port
RJ-45 connector, supports 10 base-T and 100 base-T
Serial port (COM1)
DB-9 connector, uses NS16C550-compatible UARTS,
transfer speeds up to 115.2 kb/s
SVGA video port
Upper video port, DB-15 female connector, connect a
second monitor to use dual-monitor display mode,
supports Basic requirements of PC99 specifications
Display resolutions up to 1,920 X 1,440
GPIB port
IEEE 488.2 standard interface
Can be configured for talk/listen or controller mode
Scope VGA video port
Video Input
Lower video port, DB-15 female connector, 31.6 kHz
sync, EIA RS-343A compliant, connect to show the
oscilloscope display, including live waveforms, on an
external monitor or projector
Front-panel BNC connectors ( 3 ) for 3-- wire CAV.
A fourth BNC for separate composite sync or H sync on
RGBHV signals.
A- 12
VM5000 Automatic Video Measurement Set User Manual
Appendix A: Specifications
Table A- 5: Input/output port specifications (Cont.)
Characteristic
Description
Video Input
A fifth BNC (auxiliary input ) for V sync on RGBHV
signals.
Trigger level range is adjustable from +8 V to - 8 V. The
maximum input voltage is ±20 V (DC + peak AC) and
input resistance is ≥1.5 kΩ
Table A- 6: Data storage specifications
Characteristic
Description
CD-ROM
Side-panel CD-R/W drive; reads CD/CD-ROM, CD-R, and
CD-R/W disks
24X read speed; 24X write speed
Floppy disk
Front-panel 3.5 in USB floppy disk drive, 1.44 MB
capacity
Hard disk
Standard internal hard disk capacity: 80 GB
External hard disk capacity: refer to added options
Table A- 7: Power source specifications
Characteristic
Description
Source voltage and frequency
100 to 240 VRMS ±10%, 47 Hz to 63 Hz
CAT II, or 115 VRMS ±10%, 360 to 440 Hz
Power consumption
≤220 Watts
Fuse rating
Internal to power supply; not serviceable by user
Nonvolatile memory retention
CMOS settings stored for a period of 3 years without
instrument connection to power mains
Calibration settings and error log entries stored for
1 million cycles or 20 years
Overvoltage Category
VM5000 Automatic Video Measurement Set User Manual
Overvoltage Category II (as defined in IEC61010-1/A2)
A- 13
Appendix A: Specifications
Table A- 8: Mechanical specifications
Characteristic
Description
Weight
Benchtop configuration
24.75 lbs (10.2 kg) oscilloscope only
56.5 lbs (25.6 kg) when packaged for domestic shipment
Rackmount kit
5 lbs (2.3 kg) rackmount conversion kit
8 lbs (3.6 kg) kit packaged for domestic shipment
Dimensions
Benchtop configuration
Height: 14.2 in (360.7 mm)
Height:, feet extended:14.25 in (362 mm)
Width: 17.6 in (447 mm)
Depth: 11.35 in (288.3 mm)
Rackmount configuration
(Option 1R)
Height: 10.5 in (267 mm)
Width: 19 in (483 mm)
Depth: 9.1 in (231 mm)
Cooling
Fan-forced air circulation with no air filter
Required clearances
Construction material
Top
0 in (0 mm)
Bottom
0.25 in minimum or
0 in (0 mm) when standing
on the feet
Left side
3 in (76 mm)
Right side
0 in [5 in (126 mm) required
to access CD-ROM]
Front
0 in (0 mm)
Rear
0 in (0 mm)
Chassis parts constructed of aluminum alloy; front-panel
constructed of plastic laminate; circuit boards constructed
of glass laminate; outer shell molded and textured from a
polycarbonate/ABS blend
Table A- 9: Environmental specifications
Characteristic
Description
Temperature
A- 14
Operating
+5 °C to +45 °C (+41 °F to +113 °F)
Nonoperating
- 20 °C to +60 °C (-- 4 °F to +140 °F) without diskette in
floppy drive
VM5000 Automatic Video Measurement Set User Manual
Appendix A: Specifications
Table A- 9: Environmental specifications (Cont.)
Characteristic
Description
Humidity
Operating
20% to 80% relative humidity with a maximum wet bulb
temperature of +29 °C (84.2 °F) at or below +45 °C
(113 °F), noncondensing
Upper limit derated to 30% relative humidity at +45 °C
(113 °F)
Nonoperating
With no diskette in floppy disk drive
5% to 90% relative humidity with a maximum wet bulb
temperature of +29 °C (84.2 °F) at or below +60 °C
(+140 °F), noncondensing
Upper limit derated to 20% relative humidity at +60 °C
(+140 °F)
Altitude
Operating
10,000 ft (3,048 m)
Nonoperating
40,000 ft (12, 190 m)
Random vibration
Operating
0.1 GRMS from 5 Hz to 500 Hz, 10 minutes on each axis,
3-- axes, 30 minutes total
Nonoperating
2.0 GRMS from 5 Hz to 500 Hz, 10 minutes on each axis,
3-- axes, 30 minutes total
Shock, nonoperating
VM5000 Automatic Video Measurement Set User Manual
30 g (11 ms half-sine wave) or less
A- 15
Appendix A: Specifications
Table A- 10: Certifications and compliances
Category
Standards or description
EC Declaration of Conformity EMC
Meets intent of Directive 89/336/EEC for Electromagnetic Compatibility. Compliance was
demonstrated to the following specifications as listed in the Official Journal of the European Union:
EN 61326 Emissions 1, 3, 4
EN 61326 Immunity 1, 4
IEC 61000-4-2
IEC 61000-4-3
IEC 61000-4-4
IEC 61000-4-5
IEC 61000-4-6
IEC 61000-4-11
FCC
A- 16
Class A Radiated and Conducted Emissions
Electrostatic Discharge Immunity
±4 kV contact discharge, ±8 kV air discharge
RF field immunity
3 V/m, 80 MHz to 1 GHz,
80% amplitude modulated with a 1 kHz sinewave 2
Electrical Fast Transient/Burst Immunity
1 kV on AC mains, 500 V on I/O
AC Surge Immunity
500 V differential mode, 1 kV common mode
RF Conducted Immunity
3 V, 150 kHz to 80 MHz, amplitude modulated with a
1 kHz sinewave 2
AC Mains Voltage Dips and Interruption Immunity
100% reduction for one cycle
EN 61000-3-2
Power Harmonic Current Emissions
EN 61000-3-3
Voltage Changes, Fluctuations, and Flicker
1
Use low-EMI shielded interconnect cables, equivalent to the following Tektronix cables:
GPIB cable: 012-0991-01, 012-0991-02, or 012-0991-03.
RS-232 cable: 012-1213-00 or CA part number 0294-9.
Centronics Cable: 012-1214-00 or LCOM part number CTL3VGAMM-5 VGA Cable.
2
Under theses conditions, the specifications are amended as follows:
1 mV/division to 1 V/division: ≤0.2 division waveform displacement or ≤0.4 division increase
in peak-to-peak noise.
3
Radiated emissions may exceed the levels specified in EN 61326 when this instrument is
connected to a test object.
4
Tested in accordance with EN 61326 Annex D.
Radiated and conducted emissions do not exceed the levels specified in FCC47 CFR, Part 15,
Subpart B, for Class A equipment.
VM5000 Automatic Video Measurement Set User Manual
Appendix A: Specifications
Table A- 10: Certifications and compliances (cont.)
Category
Standards or description
EC Declaration of Conformity Low Voltage
Compliance was demonstrated to the following specification as listed in the Official Journal of the
European Union:
Low Voltage Directive 73/23/EEC, amended by 93/68/EEC
EN 61010-1/A2:1995
Safety requirements for electrical equipment for measurement
control and laboratory use.
U.S. Nationally Recognized
Testing Laboratory Listing
UL3111-1, First Edition
Standard for electrical measuring and test equipment.
Canadian Certification
CAN/CSA C22.2,
No. 1010.1-92
Safety requirements for electrical equipment for measurement,
control, and laboratory use.
Additional Compliance
IEC61010-1/A2
Installation (Overvoltage)
Category
Terminals on this product may have different installation (overvoltage) category designations. The
installation categories are:
Pollution Degree Descriptions
Pollution Degree
Safety requirements for electrical equipment for measurement,
control, and laboratory use.
CAT III
Distribution-level mains (usually permanently connected). Equipment at this level is
typically in a fixed industrial location.
CAT II
Local-level mains (wall sockets). Equipment at this level includes appliances, portable
tools, and similar products. Equipment is usually cord-connected.
CAT I
Secondary (signal level) or battery operated circuits of electronic equipment.
A measure of the contaminates that could occur in the environment around and within a product.
Typically the internal environment inside a product is considered to be the same as the external.
Products should be used only in the environment for which they are rated.
Pollution Degree 1
No pollution or only dry, nonconductive pollution occurs. Products in
this category are generally encapsulated, hermetically sealed, or
located in clean rooms.
Pollution Degree 2
Normally only dry, nonconductive pollution occurs. Occasionally a
temporary conductivity that is caused by condensation must be
expected. This location is a typical office/home environment.
Temporary condensation occurs only when the product is out of
service.
Pollution Degree 3
Conductive pollution, or dry, nonconductive pollution that becomes
conductive due to condensation. These are sheltered locations where
neither temperature nor humidity is controlled. The area is protected
from direct sunshine, rain, or direct wind.
Pollution Degree 4
Pollution that generates persistent conductivity through conductive
dust, rain, or snow. Typical outdoor locations.
Pollution Degree 2 as defined in IEC 61010-1/A2
Rated for indoor use only
VM5000 Automatic Video Measurement Set User Manual
A- 17
Appendix A: Specifications
Table A- 10: Certifications and compliances (cont.)
Category
Standards or description
Safety Certification Compliance
Equipment Type
Test and measuring
Safety Class
UL61010, CSA-- 22.2 No. 1010.1, EN61010-- 1, Class 1 (as defined in IEC 61010-1/A2) - grounded
product
IEC 1000-- 4-- 3
RF field immunity
3 V/m, 80 MHz to 1 GHz
80% amplitude modulated with a 1 kHz sinewave
Performance criteria: The noise floor of the VM5000 with MIU is degraded up to 30dB while
exposed to 3 V/m electric fields. This degradation is a function of both the electric field frequency
and polarization; see Figure A-- 1 for a graph of typical behavior. For critical VM5000 Noise
measurements in an environment where electric field levels are unknown it is recommended that
the VM5000 Noise Floor be determined. This will show if any impairment is present for Noise
measurements. See the VM5000 Option VGA Performance Verification for this procedure on
page B-- 24.
Figure A- 1: Graph of Immunity behavior
A- 18
VM5000 Automatic Video Measurement Set User Manual
Appendix A: Specifications
Option SD/HD
Tables A--11 and A--12 provide characteristics specific to Option SD/HD.
Table A- 11: Video measurement specifications
Characteristic
Description
Color bar measurement accuracy
±2.0 mV ±1.5 %
of reading
Noise measurement
Range and Accuracy
Unweighted
- 20 to - 60 dB, ±1 dB
(30 MHz measurement
bandwidth)
- 60 to - 70 dB, ±2 dB
(30 MHz measurement
bandwidth)
Weighted
Noise floor
Multiburst measurement
- 20 to - 60 dB, ±1 dB
Noise measurement bandwidth selectable, 200 KHz
to 250 MHz. Trigger on
CH 4 required for measure
measurements below - 60 dB
(30 MHz BW).
- 60 to - 70 dB, ±2 dB
Unified Weighting Filter.
Trigger on CH 4 required
for measurements below
- 60 dB.
< - 76 dB, 30 MHz noise
bandwidth
Typical < - 80 dB, 30 MHz
noise bandwidth
Accuracy
Flag amplitude
±2 mV ±1.5% of reading
1 MHz to 10 MHz packets
±0.5 dB
10 to 30 MHz packets
±0.75 dB
Frequency readout
±0.1 MHz
VM5000 Automatic Video Measurement Set User Manual
Measurement of all 8 bar
levels, displayed in absolute (mV) values. YPbPr or
RGB formats.
Measurement relative to
reference
f
fl amplitude
flag
lit d
Multiburst packet frequency
is measured and displayed.
A- 19
Test Equipment Depot - 800.517.8431 - 99 Washington Street Melrose, MA 02176 - FAX 781.665.0780 - TestEquipmentDepot.com
Appendix A: Specifications
Table A- 11: Video measurement specifications (Cont.)
Characteristic
Description
Frequency Response Measurement Accuracy
Flag Amplitude
±2 mV ±1.5% of reading
Amp: 10 MHz to 30 MHz
frequency range
±0.75 dB
Measurement relative to
reference flag amplitude
Frequency readout
<5 MHz: 0.25 MHz
≥5 MHz: ±0.1 MHz
Selected frequency is measured and displayed.
Distortion
< 10%: ± 2%
Correlated distortion relative to amplitude of fundamental frequency sinusoid.
Effective Filter BW
resolution is approximately
0.3 MHz or sweep BW
within 3 S, whichever is
greater.
Non-linearity measurement
accuracy
±1.5%
Non-linearity measurement
using a ramp test signal.
Incremental linearity reported over five equally
spaced intervals, as well as
an overall linearity figure for
each channel.
Transient Response Measurement
Accuracy
Rise Time & Fall Time
±5 ns
K2T
±1.0%
Overshoot & Undershoot
±1.5% of reading
Rise & Fall Settle Times
±5 ns
Sync measurement
Accuracy
±2 mV ±1.5% of reading
Sync Amplitude
Sync Timing
Rise Time and Fall time
Channel delay
A- 20
Better than ±0.5% typical
Blanking interval measurements,
t iincluding
l di sync am(0.06/sample rate + 15 ppm plitude, width, and rise
x (Reading)) rms
time.
±5 ns
CH 1 to CH 2, CH 1 to CH 3, CH 2 to CH 3;
readouts in ns.
Range
Accuracy
Measurement
±35 ns
±5 ns
Delay Match Error
Less than 1 ns
Any two channels
VM5000 Automatic Video Measurement Set User Manual
Appendix A: Specifications
Table A- 12: Sync Pick- Off Accessory Characteristics
Characteristic
Description
Reference Information
Trigger Path
DC Attenuation
10X ± 0.7%, typi- Termination is 1.00 MΩ ±0%
cal
10X ± 1.5%, typi- Termination is 1.00 MΩ 1%. This
cal
specification will be met if the 10X
±0.7% specification above is met.
DC Attenuation Temperature
Coefficient
±0.1% / 10°C, typical
Load on Main Signal
Path
10 MΩ in parallel with 6 pF, typical
Minimum
compensation range
12 pF to 24 pF,
typical
18 pF is nominal
Main Signal Path
50 kHz to 30
MHz ±1%, typical
Measured in 50 or 75 Ω system
Trigger Path
50 kHz to 30
MHz ±5%, typical
Terminated in 1 MΩ, 18 pF with
compensation properly adjusted at 25
°C. Main path is driven by 50 or 75 Ω
system
Operating
Temperature
+5 °C to +45 °C,
typical
Operating Humidity
20% to 80% RH,
non-- condensing
Frequency
Response
VM5000 Automatic Video Measurement Set User Manual
A- 21
Appendix A: Specifications
Option VGA
Tables A--14 and A--13 describe characteristics specific to Option VGA.
Table A- 14: Option VGA Video Measurements
Characteristic
Accuracy
Description
Luma Level, Max and Min (mV)
±8 mV ±2.0%
VESA 6.1
Color Bars (mV)
±3 mV ±1.8%
Relative to back porch
H and V sync Logic “0” and “1” (mV)
±[8mV ±(0.0085)*(p-- p VESA 7.1; (p-- p sync
sync amplitude)]
amplitude)=(logic 1
±1.8%
voltage)-- (logic 0 voltage)
Ch-- Ch Mismatch (mV)
±3 mV ±3.6% of read- 32-- step staircase siging
nal. VESA Sec 6.5
Ch-- Ch Mismatch (%)
±0.4% ±(3.6%)*(Luma Channel voltage levels
Level)/(Max Luma
measured relative to
Level;); maximum
back porch
±4%
Amplitude Measurements
Linearity, Resolution, Monotonicity Measurement
Integral Linearity (%)
±2%
VESA 6.4
Differential Linearity
±0.25 LSB (8 bit)
±0.5 LSB (10 bit)
Requires step re
response compliant to
VESA limits for overshoot/undershoot,
amplitude and settle
time
±0.25 LSB (8 bit)
Monotonicity checks
every step on the ramp
to ensure signal is
always rising.
RGB Video Monotonicity
±0.5 LSB (10 bit)
A- 22
Resolution Measurement Range
5 to 10 bits
Resolution measured
in bits
HV Sync Monotonic Rise and Fall
Detects monotonicity
errors as small as 1%
of p-p sync amplitude
Checks sync for always rising and always-falling characteristic. Requires VESA
compliant amplitude,
noise, rise and fall.
VM5000 Automatic Video Measurement Set User Manual
Appendix A: Specifications
Table A- 14: Option VGA Video Measurements (Cont.)
Characteristic
Accuracy
Description
Noise (mV) Measurement Range 8-- 15 mV
±5.25 mV
Noise (mV) Measurement Range 15-- 25 mV
The lesser of ±7 mV
or ±35%
Noise Injection Ratio (%) Measurement
Range 1.1% to 2.1%
±0.75%
Noise Injection Ratio (%) Measurement
Range 2.1% to 3.6%
±1%
Measurement of RGB
noise on constant ppedestal,l 0 to 700 mV.
V
Output in mV Pk-- Pk,
dB below 700 mV,
VESA Sec 6.6.
6 6 Displayed value corrected
for instrument noise.
Specification applies
with 500 MHz bandwidth filter and 10
averages selected.
Noise Measurement
Timing Measurement
Channel Skew Measurement range ±35 ns
±500 ps
H Timing (ns) - Front and Back Porch, Left
and Right Border, Addressable Video
360 ps ±15 ppm x
reading
H Sync Period, H and V Sync Pulse width
(ns)
80 ps ±15 ppm x reading
V Sync Period (μs)
20 ns ±15 ppm x read- Read out (precision) is
ing
1 μs
V Timing (lines)-- Front and Back Porch, Top
and Bottom Border, Addressable Lines
Alternate implementation of VESA 6.7; Any
two channels
Read out (precision) is
1 line. Functions within
± 10 lines of VESA
reference value
Frequency Measurement
H and V sync Frequency and Pixel Clock
Frequency
±0.01% of reading
Transient Response
Video Rise and Fall time Measurement range ±5% of reading
> 1.3 ns
Video Rise and Fall time Measurement range ±10% of reading
800 ps to 1.3 ns
Video Rise and Fall time Measurement range ±20% of reading
450 ps to 800 ps
RGB System Rise Time
VM5000 Automatic Video Measurement Set User Manual
VESA 6.8 Video Transient Response: Utilizes Course grille
grille,
VESA Section 6.2,
6.3, 6.8 Asymmetrical
specification incorpo
incorporates acquisition system rise time.
350 ps (typical)
A- 23
Appendix A: Specifications
Table A- 14: Option VGA Video Measurements (Cont.)
Characteristic
Accuracy
Description
Sync Rise and Fall time Measurement range
> 5 ns
±5%
Sync Rise and Fall time Measurement range
2 ns to 5 ns
±11%
VESA Section 7.1-- 7.4
Displayed results corrected for H/V measurement system
bandwidth limitations
RGB and HV Sync Overshoot and Undershoot Amplitude %, Settle time: 0-- 1 ns
±2% of reading (typical)
RGB and HV Sync Overshoot and Undershoot Amplitude %, Settle time: 1-- 10 ns
±1% of reading (typical)
RGB and HV Sync Overshoot & Undershoot
Settling Time, Amplitude > 5%
±T rise (typical)
VESA 6.3
H Sync Jitter (ns)
100 ps ±15 ppm *H-Sync period ±14% of
reading
H Sync Jitter (% of Pixel Clock Period)
Measurement Range: < 200 MHz PCF
< 4%
VESA 7.5 Requires
VESA compliant amplitude, noise, rise and
fall characteristics
H Sync Jitter (% of Pixel Clock Period)
Measurement Range: 200 to 400 MHz PCF
< 7.5%
Jitter Measurement
Table A- 15: RGBHV Measurement Interface Unit (MIU)
Specification
Wideband Mode
Specification Precision LF Mode
Reference Information
RGB Channels
0.1 ±3% (typical)
1.0 ±0.002%
VM5000 automatically compensates for
Wideband mode attenuation
HV Channels
0.01 ±5% (typical)
1.0 ±0.002%
RGB Channels
75 Ω nominal
75 Ω ±0.3%
HV Channels
2.2 kΩ ±3%
2.2 kΩ ±1.5%
RGB Channels
< 3 dB down at
1,500 MHz
DC to 10 MHz (typical)
HV Channels
< 3 dB down at
320 MHz
DC to 10 MHz (typical)
Characteristic
DC Gain
DC Termination
Bandwidth
A- 24
VM5000 Automatic Video Measurement Set User Manual
Appendix A: Specifications
Table A- 15: RGBHV Measurement Interface Unit (MIU) (Cont.)
Characteristic
Specification
Wideband Mode
Specification Precision LF Mode
Reference Information
RGB Channels Input
Return Loss
1MHz to 100MHz
> 27 dB
27 dB RL is equivalent to ±7.5 Ω variation from 75 Ω
100MHz to 250MHz
> 21 dB
21dB RL is equivalent to ±15 Ω variation from 75 Ω
HV channels Input
Capacitance
3 pF (typical)
Current Source
Loads (HV Channels)
VM5000 Automatic Video Measurement Set User Manual
+8mA ±2.5%
- 8mA ±2.5%
Current sources provide loads for Voh
and Vol testing of H
and V sync signals
A- 25
Appendix B: Performance Verification
Use the procedures in this appendix to verify that your VM5000 meets it
warranted characterics. There are two major sections to this appendix. The first
section contains the performance verification for Option SD/HD. The second
section contains the performace verification for Option VGA.
Option SD/HD Performance Verification
This Performance Verification checks that the VM5000 meets its video measurement specifications (Table A--11 in Appendix A, Specifications).
Prerequisites
The prerequisites for the performance verification are:
H
The test signal generator and VM5000 instrument require a minimum
20 minute warm-up time before doing any performance verification tests.
H
Perform the VM5000 instrument internal system diagnostics in the Utilities
menu. The instrument must pass the diagnostics before you can verify
performance.
H
Perform the VM5000 instrument Signal Path Calibration (SPC) procedure.
The instrument must pass the SPC before you can verify performance.
Required Equipment
The Option SD/HD performance verification requires the equpiment shown in
Table B--1.
Table B- 1: Required test equipment for Option SD/HD performance verification
Item number and
description
Minimum requirements
HD CAV Television Test Signal
generator (one required)
Example
Purpose
Tektronix TG700 with AWVG7
module
All tests
Digital Multimeter
(one required)
5-1/2 digits, better than 0.1%
DC accuracy 0 - 1 V
Fluke 8842A or
Fluke model 45
AWVG7 signal output test
75 Ω BNC Cable
(four required)
42 inches (106.68 cm) long
Tektronix part number
012-0074-00
All tests
VM5000 Automatic Video Measurement Set User Manual
B- 1
Appendix B: Performance Verification
Table B- 1: Required test equipment for Option SD/HD performance verification (Cont.)
Item number and
description
Minimum requirements
Example
Purpose
75 Ω precision BNC
terminations (four required)
0.025% Accuracy
Tektronix part number
011-0102-03
All tests
Connector, Dual-Banana
(one required)
Female BNC-to-dual banana
Tektronix part number
103-0090-00
AWVG7 signal output test
Connector, BNC ‘T’
(four required)
Male BNC-to-dual female BNC
Tektronix part number
103-0030-00
All tests
Coupler, Dual-Input BNC ‘T’
cable assembly (one required)
Female BNC-to-dual male BNC
Tektronix part number
067-0525-02
Channel delay match test
Option SD/HD Procedure
Determine the AWVG7
Signal Output Amplitude
This procedure determines the test signal generator output signal amplitude. You
will need this value for calculating measurements. This procedure assumes you
are using a Tektronix TG700 test signal generator with an AWVG7 module. If
you are using a different test signal source, modify the steps according to your
particular setup.
Required
equipment
HD CAV Television Test Signal generator (Tektronix TG700 with
AWVG7 module)
Digital multimeter
75 Ω BNC Cable (1)
75 Ω precision BNC terminations (1)
Connector, Dual-Banana (1)
Connector, BNC ‘T’ (1)
Prerequisites
The test signal generator and multimeter must warm up for at least 20
minutes before doing this test.
NOTE. Make sure that the AWVG7 generator module and the multimeter have
had a warm up period of at least 20 minutes.
1. Connect the digital multimeter to the test signal source. Refer to Figure B--1
while doing the following steps:
a. Connect one end of a 75 Ω BNC cable to the upper CH1 connector on
the AWVG7 generator module.
B- 2
VM5000 Automatic Video Measurement Set User Manual
Appendix B: Performance Verification
b. Connect the other cable end to the digital multimeter with a BNC ‘T’
connector, 75 Ω precision termination, and BNC female-to-dual banana
adapter.
DMM
BNC to Dual banana
TG700 with
AWVG7 module
75 Ω Termination
CH3
CH2
CH1
BNC “T”
connector
Figure B- 1: Signal output amplitude test hookup
2. On the TG700, press the MODULE, FORMAT, and FRONT PANEL
ENABLE buttons simultaneously, and then release the MODULE and
FORMAT buttons. Continue to hold the FRONT PANEL ENABLE button
to display Factory Startup Mode.
3. Enable the DAC Gain (GBR) : 0 mV calibration signal as follows:
a. Press the MODULE button to display the AWVG7 main menu.
b. Press the up or down arrow button to select CALIBRATION.
c. Press the left or right arrow button to select DAC Gain (GBR).
d. Press the ENTER button.
e. Press the left or right arrow button to select 0 mV.
f.
Press the ENTER button.
4. Enter the digital multimeter reading in Table B--2, row DC0, column CH1.
5. Move the BNC cable from the upper CH1 connector to the upper CH 2
connector on the AWVG7 generator module.
6. Enter the digital multimeter reading in Table B--2, row DC0, column CH 2.
VM5000 Automatic Video Measurement Set User Manual
B- 3
Appendix B: Performance Verification
7. Move the BNC cable from the upper CH2 connector to the upper CH 3
connector on the AWVG7 generator module.
8. Enter the digital multimeter reading in Table B--2, row DC0, column CH 3.
9. On the TG700, press the left or right arrow button to select 700.397 mV.
10. Press the ENTER button.
11. Enter the digital multimeter reading in Table B--2, row DC700, column
CH 3.
12. Move the BNC cable from the upper CH3 connector to the upper CH 2
connector on the AWVG7 generator module.
13. Enter the digital multimeter reading in Table B--2, row DC700, column
CH 2.
14. Move the BNC cable from the upper CH2 connector to the upper CH 1
connector on the AWVG7 generator module.
15. Enter the digital multimeter reading in Table B--2, row DC700, column
CH 1.
16. Subtract the DC0 values from the DC700 values, for each of the three
channels in Table B--2. The resulting three numbers are the Blanking-toWhite levels for each channel.
Table B- 2: Measured blanking to white levels
CH1
CH2
CH3
DC700 (measured)
DC0 (measured)
Blanking-to-white level
(DC700 minus DC0)
Check Absolute
Amplitude Measurement
Accuracy
B- 4
This test verifies the measurement amplitude accuracy of the three video input
channels (CH1, CH2, CH3) and digitizers. This checks the accuracy
specification for the Color Bars measurement, Multiburst Flag amplitude, and
Sync Amplitude. The accuracy specification for all three is ±2mV ±1.5% of
reading.
VM5000 Automatic Video Measurement Set User Manual
Appendix B: Performance Verification
Required
equipment
HD CAV Television Test Signal generator (Tektronix TG700 with
AWVG7 module)
75 Ω BNC cables (4)
75 Ω precision BNC terminations (4)
Connector, BNC ‘T’ (4)
Prerequisites
The test signal generator must warm up for at least 20 minutes before
doing this test. You must have completed the Determine the AWVG7
Signal Outlet Amplitude procedure on page B-- 2.
1. Connect the instrument to the test signal source. Refer to Figure B--2 while
doing the following steps:
a. Connect a 75 Ω BNC cables to each of the upper CH1, CH2, and CH3
AWVG7 outputs.
b. Connect the other end of each cable to a BNC ‘T’ connector and a
precision 75 Ω termination.
c. Connect the BNC ‘T’ connector to the VM5000, so that the cable from
the AWVG7 CH1 output goes to the VM5000 CH1 input.
d. Connect the CH2 cable to the VM5000 CH2 input and the CH3 cable to
the VM5000 CH3 input.
VM5000
75 Ω Termination
TG700 with
AWVG7 module
BNC “T” connector
CH3
CH2
CH1
CH1
CH2
CH3
CH4
Figure B- 2: Amplitude accuracy test hookup
VM5000 Automatic Video Measurement Set User Manual
B- 5
Appendix B: Performance Verification
e. Connect a fourth 75 Ω BNC cable to the lower AWVG7 CH1 output.
f.
Connect the other end of this cable to a BNC ‘T’ connector and a 75 Ω
termination.
g. Connect the BNC ‘T’ connector to the VM5000 CH4 input.
2. On the TG700, press the MODULE, FORMAT, and FRONT PANEL
ENABLE buttons simultaneously to return the generator to normal operating
mode.
3. After it is finished loading, press MODULE repeatedly to display AWVG7.
4. Press FORMAT repeatedly to display 1080 59i GBR.
5. Press ENTER.
NOTE. Press and hold the FRONT PANEL ENABLE button to unlock the front
panel.
6. Press COLOR BAR repeatedly to display 100% Color Bars.
7. Start the VM5000 application (File > Applications > VM5000).
8. Select File > Recall Default.
9. Select Configuration > Format, and select RGB Color Space.
10. Select Configuration > Operation, and select Channel 4 as the trigger.
Select <b>Configuration<b> > <b>Warnings<b> and then deselect
<b>Measurement Warnings<b>.
11. In the Color bar measurements view, change the Averages setting to 64.
12. Select the VM5000 Run button. The color bar measurement results table
should appear with continuously updated measurements.
13. Record the VM5000 measurement value for the white bar measurement, for
each of the three channels, in row 4 of Table B--3.
Table B- 3: White bar measurement
CH1 (Y/G)
CH2 (B/Pb)
CH3 (R/Pr)
AWVG7 Blanking-to-White level
(DC700-- DC0) (from Table B-- 2)
Lower white limit value (equation 1)
Upper white limit value (equation 2)
White measurement
B- 6
VM5000 Automatic Video Measurement Set User Manual
Appendix B: Performance Verification
Table B- 3: White bar measurement (Cont.)
CH1 (Y/G)
CH2 (B/Pb)
CH3 (R/Pr)
Equation 1: Lower White limit value = (DC700-- DC0) X (0.985) - 2 mV
Equation 2: Upper White limit value = (DC700-- DC0) X (1.015) + 2 mV
14. Calculate the instrument white bar measurement as follows:
a. Copy the AWVG7 Blanking-to-White level values (from Table B--2, row
3) for each channel in row 1 of Table B--3.
b. For each channel, calculate the Lower VM5000 white limit, using
equation 1, and enter the values in row 2, Table B--3.
c. For each channel, calculate the Upper VM5000 white limit, using
equation 2, and enter the values in row 3, Table B--3.
15. Check that the VM5000 white measurement (row 4) falls between the Lower
(Line 2) and Upper (Line 3) limit values, for all three channels.
Table B--4 is an example of typical measurements and the calculation results.
Table B- 4: Example white bar measurement values
CH1 (Y/G)
CH2 (B/Pb)
CH3 (R/Pr)
AWVG7 Blanking-to-White level
(DC700-- DC0) (from Table B-- 2)
700.05 mV
700.00 mV
701.04 mV
Lower white limit value (equation 1)
687.55 mV
687.50 mV
688.52 mV
Upper white limit value (equation 2)
712.55 mV
712.50 mV
713.56 mV
White measurement
696.55 mV
700.25 mV
695.01 mV
Equation 1: Lower White limit value = (DC700-- DC0) X (0.985) - 2 mV
Equation 2: Upper White limit value = (DC700-- DC0) X (1.015) + 2 mV
The calculated VM5000 white measurements in row 4 are between the LOWER
and UPPER limit values (rows 2 and 3), so the measurements are within
specification for all channels.
VM5000 Automatic Video Measurement Set User Manual
B- 7
Appendix B: Performance Verification
Check Frequency
Response Measurement
Accuracy
This test verifies the frequency response accuracy of the three VM5000 video
input channels (CH1, CH2, CH3) and digitizers. This directly checks the
Multiburst measurement accuracy, and indirectly the Noise measurement up
through 30 MHz. The Multiburst accuracy specification is ±0.5dB up through
10MHz, and ±0.75dB from 10 to 30 MHz.
Required
equipment
HD CAV Television Test Signal generator (Tektronix TG700 with
AWVG7 module)
75 Ω BNC cables (4)
75 Ω precision BNC terminations (4)
Connector, BNC ‘T’ (4)
Prerequisites
The test signal generator must warm up for at least 20 minutes before
doing this test.
NOTE. The AWVG7 must meet its frequency response specification of
±1%(0.09 dB) to 20 MHz, ±2%(0.17dB) to 28 MHz, and ±3%(0.26dB) to
30 MHz. If you are uncertain about the test signal generator calibration status,
perform the AWVG7 frequency response performance verification described in
the AWVG7 Service Manual.
1. Connect the instrument to the test signal source. Refer to Figure B--3 while
doing the following steps:
a. Connect 75 Ω BNC cables to the upper CH1, CH2, and CH3 AWVG7
outputs.
b. Connect the other end of each cable to a BNC T connector and a 75 Ω
termination.
c. Connect the BNC T connector to the VM5000, so that the cable from the
AWVG7 CH1 output goes to the VM5000 CH1 input.
d. Connect the CH2 cable to the VM5000 CH2 input and the CH3 cable to
the VM5000 CH3 input.
e. Connect a fourth 75 Ω BNC cable to the lower AWVG7 CH1 output.
f.
Connect the other end of this cable to a BNC T connector and a 75 Ω
termination.
g. Connect the BNC T connector to the VM5000 CH4 input.
B- 8
VM5000 Automatic Video Measurement Set User Manual
Appendix B: Performance Verification
VM5000
75 Ω Termination
TG700 with
AWVG7 module
BNC “T” connector
CH3
CH2
CH1
CH1
CH2
CH3
CH4
Figure B- 3: Frequency accuracy test hookup
2. On the TG700, press Module repeatedly to display AWVG7.
3. Press FORMAT repeatedly to display 1080 59i GBR.
4. Press ENTER.
5. Press Multiburst repeatedly to display Multiburst 1--10 MHz.
NOTE. Press and hold the FRONT PANEL ENABLE button to unlock the front
panel.
6. Start the VM5000 application (File > Applications > VM5000).
7. Select File > Recall Default.
8. Select Configuration > Format.
9. Select RGB Color Space.
10. Select Configuration > Measurements.
11. Select the Multiburst check box and deselect the Color Bars check box.
12. Select Configuration > Operation, and select Channel 4 as the trigger.
13. Select Results > Multiburst.
14. Select the VM5000 Run button. The Multiburst measurement results table
should display with continuously updated measurements.
VM5000 Automatic Video Measurement Set User Manual
B- 9
Appendix B: Performance Verification
15. Change the Averages setting to 64.
16. Check the following:
a. The six Multiburst packet Amp(dB) readings (1, 2, 4, 6, 8, and 10 MHz)
should be less than ±0.5 dB, for each of the three channels (G, B, R).
b. The flag amplitude for each channel should be 420.0 mV ±8.3 mV.
c. The frequency, “Frq” (MHz) should be within ±0.05 MHz of the nominal
( 1, 2, 4, 6, 8, 10 MHz).
17. Select the VM5000 Stop button to halt measurement.
18. Press the TG700 Multiburst button repeatedly to display Multiburst 10--20 MHz.
19. Select the VM5000 Run button.
20. Check the following:
a. The six Multiburst packet Amp(dB) readings (10, 12, 14, 16, 18, and 20
MHz) should be less than ±0.5 dB, for each of the three channels
(G, B, R).
b. The flag amplitude for each channel should be 420.0 mV ±8.3 mV.
c. The frequency, “Frq” (MHz) should be within ±0.05 MHz of the nominal
(10, 12, 14, 16, 18, 20 MHz).
21. Select the VM5000 Stop button to halt measurement.
22. Press the TG700 Multiburst button repeatedly to display Multiburst
20--30 MHz.
23. Select the VM5000 Run button.
24. Check the following:
a. The six Multiburst (20, 22, 24, 26, 28, and 30 MHz) packet Amp(dB)
readings are less than ±0.5 dB, for each of the three channels (G, B, R).
b. The flag amplitude for each channel should be 420.0 mV ±8.3 mV.
c. The frequency, “Frq” (MHz) should be within ±0.05 MHz of the nominal
( 20, 22, 24, 26, 28, and 30 MHz).
Check Noise Floor
Measurement Accuracy
B- 10
This test verifies the noise floor of the three VM5000 video input channels
(CH1, CH2, CH3) and digitizers. Noise floor affects the linearity of the noise
measurement between --60 and --70 dB. The --76 dB Noise Floor specification
ensures a noise floor error contribution of less than 1 dB for a --70 dB noise
measurement. Together with the Amplitude Accuracy (Check A) and Frequency
VM5000 Automatic Video Measurement Set User Manual
Appendix B: Performance Verification
Response (Check B) checks, this indirectly checks the Noise measurement
accuracy.
Required
equipment
HD CAV Television Test Signal generator (Tektronix TG700 with
AWVG7 module)
75 Ω BNC cable (1)
75 Ω precision BNC terminations (4)
Connector, BNC ‘T’ (1)
Prerequisites
The test signal generator must warm up for at least 20 minutes before
doing this test.
1. Connect the instrument to the test signal source. Refer to Figure B--4 while
doing the following steps:
a. Connect a 75 Ω BNC cable to the CH1 AWVG7 outputs.
b. Connect the other end of the cable to the VM5000 CH 4 input and a
75 Ω termination using a BNC ‘T’ connector.
c. Place 75 Ω terminations on the VM5000 CH1, CH2, and CH3 inputs.
VM5000
TG700 with
AWVG7 module
75 Ω Termination
CH1
CH2
CH3
CH4
BNC “T” connector
CH3
CH2
CH1
Figure B- 4: Noise floor accuracy test hookup
2. Start the VM5000 application (File > Applications > VM5000).
3. Select File > Recall Default.
4. Select Configuration > Format and select RGB Color Space.
VM5000 Automatic Video Measurement Set User Manual
B- 11
Appendix B: Performance Verification
5. Select Configuration > Measurements.
6. Select the Noise check box and deselect the Color Bars check box.
7. Select Configuration > Operation, and select Channel 4 as the trigger.
8. Select Results > Noise.
9. Select Unweighted BW in the Filter area.
10. Adjust the Bandwidth Hz setting to 30.0 MHz.
11. Change the Averages setting to 64.
12. Select the VM5000 Run button. The Noise measurement results table should
appear with continuously updating measurements.
13. Check that the noise measurement dB values are greater than 76 dB for all
three channels.
For example, a 78 dB reading passes. A 74 dB reading fails.
Check Channel Delay
Match
This check verifies the delay match between the VM5000 CH1, CH2, and CH3
measurement channels. Delay match error affects Ch-Ch Skew measurement
accuracy. The specification for delay match error between any two channels is
less than 1 ns.
Required
equipment
HD CAV Television Test Signal generator (Tektronix TG700 with
AWVG7 module)
75 Ω BNC cables (2)
75 Ω precision BNC terminations (2)
Connector, BNC ‘T’ (2)
Coupler, Dual-Input BNC ‘T’ cable assembly (1)
Prerequisites
The test signal generator must warm up for at least 20 minutes before
doing this test.
1. Connect the instrument to the test signal source. Refer to Figure B--5 while
doing the following steps:
a. Connect a 75 Ω BNC cable to the upper CH1 AWVG7 output.
b. Connect the other end of the cable to a BNC ‘T’ connector, BNC ‘T’
Cable Assembly, and 75 Ω termination.
B- 12
VM5000 Automatic Video Measurement Set User Manual
Appendix B: Performance Verification
c. Connect the BNC ‘T’ Cable Assembly to the VM5000 CH1 and CH 2
inputs.
d. Connect a second 75 Ω BNC cable to the lower CH1 AWVG7 output.
e. Connect the other end of the cable to the VM5000 CH 4 input and a
75 Ω termination using a BNC ‘T’ connector.
VM5000
75 Ω Termination
TG700 with
AWVG7 module
BNC “T” connector
CH3
CH2
CH1
CH1
CH2
CH3
CH4
BNC “T” cable assembly
BNC “T” connector
75 Ω Termination
Figure B- 5: Channel delay match test hookup
2. On the TG700, press the Module button repeatedly to display AWVG7.
3. Press FORMAT repeatedly to display 1080 59i GBR.
4. Press ENTER.
5. Press Multiburst repeatedly to display Multiburst 10--20 MHz.
NOTE. Press and hold the FRONT PANEL ENABLE button to unlock the front
panel.
6. Start the VM5000 application (File > Applications > VM5000).
7. Select File > Recall Default.
8. Select Configuration > Format and select RGB Color Space.
VM5000 Automatic Video Measurement Set User Manual
B- 13
Appendix B: Performance Verification
9. While still in Configuration > Measurements, select the Channel Delay
check box and deselect the Color Bars check box.
10. Select Configuration > Operation:
a. Deselect all the Warning Reporting boxes.
b. Select Channel 4 as the trigger.
11. Select Results > Channel Delay.
12. Change the Averages setting to 64.
13. Select the VM5000 Run button. The Channel Delay measurement results
table should appear with continuously updating measurements.
14. Note the G-B measurement results (including sign) in row 1 of Table B--5.
15. Reverse the BNC ‘T’ Cable connections on CH1 and CH2.
16. Note the G-B measurement results (including sign) in row 2 of Table B--5.
17. Subtract line 2 from line 1 in Table B--5. Divide this result by 2 and enter it
in row 3 of Table B--5.
Table B- 5: Delay error measurements
G-B (ns)
G-R (ns)
B-R (ns)
Connection 1
Connection 2
Net delay error (equation 3)
Equation 3: [(Connection 1) - (Connection 2)] ÷ 2
18. Connect the BNC ‘T’ Cable to the VM5000 CH1 and CH3 inputs. Repeat
the procedure in steps 14 through 17 for the G-R measurement.
19. Connect the BNC ‘T’ Cable to the VM5000 CH2 and CH3 inputs. Repeat
the procedure in steps 14 through 17 for the B-R measurement.
20. Check that the net delay error (row 3) is less than ±1 ns for G-B, G-R,
and B-R.
This completes the VM5000 Option SD/HD performance verification.
B- 14
VM5000 Automatic Video Measurement Set User Manual
Appendix B: Performance Verification
Option VGA Performance Verification
This procedure verifies that the measured signal characteristics meet the
warranted specifications of the product (Table A--14 in Appendix A, Specifications).
The System Performance Verification procedure does the following:
H
Establish a reference point for the test equipment being used before
proceeding with the measurements.
H
Look at worst case (warranted) transient and amplitude characteristics of
Video and Sync signals. This will cover Video Transient, H Sync, V Sync
and Luma Levels measurements.
H
Characterize Noise, Linearity and inter-channel measurements.
Prerequisites
The prerequisites for the performance verification are:
H
The Oscilloscope Calibrator (Fluke/Wavetek 9500B), VM5000 instrument
and Arbitrary Waveform Generator AWG710B require a minimum 20 minute
warm-up time before doing any performance verification tests.
H
Perform the VM5000 instrument internal system diagnostics in the Utilities
menu. The instrument must pass the diagnostics before you can verify
performance.
H
Perform the VM5000 instrument Signal Path Compensation (SPC) procedure. The instrument must pass the SPC before you can verify performance.
Required Equipment
The Option VGA performance verification requires the equpiment shown in
Table B--6.
Table B- 6: Required test equipment for Option VGA performance verification
Description
VM5000 with MIU, Test
Signal CD, cables, mouse
and keyboard
Quantity
Required
1
Arbitrary Waveform Gener- 1
ator
Recommended Equipment
Where Used
Tektronix VM5000HD or
TDS5104x
Tektronix VM5000
All checks
2 GHz Analog bandwidth; rise
time better than 300 ps
Tektronix AWG710B with
Option 02
Transient and Linearity
tests
Minimum Requirement
VM5000 Automatic Video Measurement Set User Manual
B- 15
Appendix B: Performance Verification
Table B- 6: Required test equipment for Option VGA performance verification (Cont.)
Description
Quantity
Required
Digital Multimeter
1
4-1/2 digits, better than 0.1% DC Keithley Model 2000
accuracy, 0 to 2.5 volts
9500B signal output test
Oscilloscope Calibrator
1
Amplitude accuracy ±1 mV
Fluke/Wavetek model
9500B
Amplitude tests
Active Head
1
3 GHz bandwidth
Fluke/Wavetek model
9530
Amplitude tests
50 ohms coaxial cable
1
Tektronix part number
012-0057-01
Amplitude tests
75 ohms Terminators
3
Tektronix part number
011-0102-03
9500B signal output test,
Noise Floor measurement
BNC T-Connector
1
Tektronix part number
103-0030-00
9500B signal output test
3 feet VGA to 5x BNC
cable
1
Tektronix part number
174-5126-00
Noise floor measurement,
Channel skew match
Min Loss Pad
1
50 to 75 ohms
Tektronix part number
011-0057-01
Amplitude tests, Transient, Linearity
Windows based PC
1
Pentium P4, 1.8 GHz, 20 GB
HDD, VGA, NI PCI-GPIB IEEE
488.2 interface card
6 dB Attenuators
2
±0.3 dB DC - 1000 MHz, and
±0.5 dB 1000 - 2000 MHz
Connector, Dual Banana
1
BNC adapter-Female to
Female
1
50 Ω SMA cable (male
both ends) co-axial cable
3
Minimum Requirement
2 V max, ±0.025%
Recommended Equipment
Where Used
Sync Absolute Amplitude
measurement, Channel
skew match, Noise floor
measurement accuracy
Tektronix part number
011-0069-03
10-bit Linearity
Tektronix part number
103-0090-00
9500B signal output amplitude test
Luminance level measurement accuracy
1 GHz bandwidth
Tektronix part number
174-1480-00
Transient Response
Tests, Linearity Test
Initial Setup
VM5000
The steps to set up the VM5000 for the performance verification are:
1. From the TekScope application, select File > Run Applications > VM5000
VGA Video.
2. Ensure that Option VGA application is launched.
3. From the VM5000 VGA Video application, select File > Recall Default
setup. This ensures that the configuration parameters are in the default state.
B- 16
VM5000 Automatic Video Measurement Set User Manual
Appendix B: Performance Verification
Windows-based PC
To perform measurements on the VM5000, you must provide an appropriate
video signal to the VM5000. You accomplish this by displaying a bitmap file on
the PC in which the DUT is operating. The preferred bitmap file, when taking
multiple measurements, is the Matrix signal. If you need to take only one
measurement, you can use a full-field test pattern rather than the Matrix signal.
All the necessary Matrix signals and full-field test pattern bitmaps for performance verification are located on the Test Signal Files CD-ROM.
1. Set the resolution to 1024x768 and refresh rate to 60 Hz.
2. Copy the following files from the Test Signal Files CD-ROM to a floppy
disk:
pvvidtranssetup.set
pvlinearltysetup.set
pvhsyncsetup.set
LinearityNoStepsOrSyncVolts2kx1p5kat85HzDoubled.wfm
2kx1p5kx85TransientPvVoltsOffset200mVDoubled.wfm
2kx1p5kx85HsyncTransientTestVoltsPosDoubled.wfm
Performance Verification Procedures
Check Luminance Level
Measurement Accuracy
This test verifies the amplitude measurement accuracy of the three video input
channels (CH1/G, CH2/B, CH3/R), checking the specification for the Color Bar
and Luma Level measurements. The accuracy is checked at the nominal White
and Black level points, 700 mV and 0 V, respectively. The specification is
±3 mV ±1.5% of the reading.
Required
equipment
Fluke/Wavetek model 9500B
Oscilloscope Calibrator
9530 Active head
Keithley Model 2000 multimeter
50 Ω co-axial cable
75 Ω precision BNC termination
Connector, Dual Banana
BNC Adapter, Female/Female
BNC T connector
Min loss pad 50 to 75 Ω
Prerequisites
The oscilloscope calibrator and multimeter must warm up for at least
20 minutes before doing this test
Part 1: Determine the 9500B signal output amplitude. The MIU G, B, and R inputs
are specified for a 75 Ω source. To adapt the 50 Ω output of the 9500B calibrator, a 50 to 75 Ω minimum loss (min-loss) pad is used. The min-loss pad inserts
loss between the calibrator and 75 Ω MIU inputs. The Part 1 procedure
VM5000 Automatic Video Measurement Set User Manual
B- 17
Appendix B: Performance Verification
determines the proper calibrator voltage setting to produce 700 mV across a
precision 75 Ω load. You will need this information for Part 2. This procedure
assumes that you are using a Fluke/Wavetek 9500B Oscilloscope Calibrator. If
you are using a different test signal source, modify the steps according to your
particular setup.
NOTE. Make sure that the 9500B Oscilloscope Calibrator and the multimeter
have had a warm up period of at least 20 minutes.
1. Connect the equipment as shown in Figure B--6.
Fluke/Wavetek
9500B Oscilloscope
Calibrator
CH1
9530 Active head
Female to
female BNC
adapter
DMM
50 Ω co--ax
cable
BNC to dual
banana adapter
75 Ω
terminations
50 to 75 Ω
Min loss pad
BNC
T-- connector
Figure B- 6: Setup to determine 9500B signal output amplitude
a. Connect the 9530 Active head to channel 1 of the 9500B Oscilloscope
Calibrator.
b. Connect a female/female BNC adapter to the 9530 head output. Connect
a 50 Ω coaxial cable to the other end of the BNC adapter.
c. Connect a 50 Ω to 75 Ω min-loss pad to the open end of the coaxial
cable.
B- 18
VM5000 Automatic Video Measurement Set User Manual
Appendix B: Performance Verification
NOTE. The female side of the min-loss pad must be the 50 Ω side.
d. Connect the other end of the min-loss pad to the BNC “T” adapter.
e. Connect a 75 Ω precision terminator and the BNC female to dual banana
adapter to the other ends of the BNC “T” adapter.
f.
Connect the dual banana adapter to the Volts input of the multimeter.
Check that the adapter is oriented so that the coaxial shield is connected
to the “low” side of the Volts input. On most adapters, this is marked
with a small tab labeled “GND”.
2. Configure the 9500B for 50 Ω output, Positive DC waveform, Direct Entry
mode, and 1.10 volt amplitude:
a. On the 9500B, press the CHANNEL SELECT button.
b. Press the LOAD button to select 50 Ω output impedance.
c. Press the EXIT button.
d. Press WAVEFORM.
e. Select POSITIVE DC. On the 9500B, this is the fourth waveform from
the top.
f.
Using the bottom right-most soft key, select DIRECT entry mode
(symbol is “1.0” with up/down arrows).
g. Using the keypad, enter “1.1” volts and press ENTER (ENTER is large
oval-shaped key with an arrow on it, just to the right of the keypad).
3. If you are using the Keithley 2000 multimeter, set it to AUTO range.
Otherwise, select the 1 V scale.
4. Select the 9500B OUTPUT ON button and ensure that the corresponding red
LED glows. The multimeter should read approximately 700 mV.
5. Adjust the 9500B output amplitude until the multimeter reads as close as
possible to 700 mV. Use the “<” and “>” keys to select the digit and the “∧”
and “∨” keys to adjust. Your final reading on the multimeter should be
between 699.9 mV and 700.1 mV.
6. Enter both the multimeter reading (to the nearest 0.1 mV) and the 9500B
amplitude setting in Table B--7, row DC700.
7. On the 9500B, select “ground” mode by pressing the bottom soft key below
the ground symbol. The multimeter should read approximately 0 V.
8. If you are using the Keithley 2000 multimeter, leave it in AUTO range.
Otherwise, select the 100 mV scale.
VM5000 Automatic Video Measurement Set User Manual
B- 19
Test Equipment Depot - 800.517.8431 - 99 Washington Street Melrose, MA 02176 - FAX 781.665.0780 - TestEquipmentDepot.com
Appendix B: Performance Verification
9. Enter the multimeter reading in Table B--7, row DC0. Record the voltage to
the nearest 0.1 mV. Take care to notice the dimensional units reported on the
multimeter readout; for the 700 mV reading the unit is probably Volts while
the ground reading is probably in millivolts.
10. Select OUTPUT OFF. Disconnect the min-loss pad from the BNC “T”
adapter, leaving the other end of the pad connected to the coaxial cable.
This completes the 9500B signal output amplitude determination.
Table B- 7: Format for Luminance level measurement results
9500B Amplitude Setting
Multimeter reading
DC700
DC0
GND
Table B- 8: Example for Luminance level measurement results
9500B Amplitude Setting
Multimeter reading
DC700
1.1056V
700.1 mV
DC0
GND
0.0 mV
Part 2: Check Amplitude Measurement Accuracy. The perform the initial set up of
the VM5000 as follows:
1. The Part 1 procedure should have been performed just before this portion.
This will minimize errors from potential thermal drift in the 9500B
Oscilloscope Calibrator and min-loss pad. You must use the same Calibrator
and min-loss pad from Part 1, and the ambient temperature must be within
5 °C of that during Part 1.
2. Ensure that the MIU is fully connected (CH1--4, AUX, RS-232) to the
VM5000. Nothing should be connected to the five MIU input BNCs.
3. If the VM5000 VGA Video application is not already running, start it now:
from the TekScope menu bar, select File > Run Application > VM5000
VGA Video.
4. In the VM5000 VGA Video application, select the default setup: from the
VM5000 VGA Video application menu bar, select File > Recall Default
Setup.
5. Enable only the Luma Levels measurement. From the VM5000 menu bar,
select Configuration > Measurements. Press Clear All to de-select all
measurements, and select “Luma Levels”.
B- 20
VM5000 Automatic Video Measurement Set User Manual
Appendix B: Performance Verification
6. Run the Luma Levels measurement by clicking the Run button. After about
40 seconds, a Signal Warning message “Luma Levels: Acquisition Problem”
will appear. This is normal, as no video signal has been applied. Click “OK”
to clear the warning message. The measurement will then stop. No values
will be reported in “Results”.
NOTE. The purpose of this step is to properly set the channel gains and offsets.
From Part 1, the 9500B Oscilloscope Calibrator should already have a coaxial
cable connected to its output, with a min-loss pad on the other end of the cable.
7. Connect the open (male) end of the min-loss pad to the MIU G input. See
Figure B--7.
Fluke/Wavetek
9500B Oscilloscope
Calibrator
9530 Active head
Female to
female BNC
adapter
50 Ω co-ax
cable
Min loss pad
50 to 75 Ω
G
B
MIU
R
RS 232
VM5000
Figure B- 7: Setup to determine absolute amplitude measurement accuracy
8. On the VM5000 front panel, under TRIGGER, press the MODE button to
change from NORM to AUTO.
9. From Part 1, the 9500B Amplitude should already be set to produce 700 mV
at the MIU input. Check that the 9500B Amplitude setting matches the entry
recorded in Table B--7 on page B--20, 9500B Amplitude Setting, DC700.
VM5000 Automatic Video Measurement Set User Manual
B- 21
Appendix B: Performance Verification
10. On the 9500B, turn off “ground” mode and select OUTPUT ON. The CH1
oscilloscope trace should move from approximately 1.5 div. below graticule
center to 3.5 div. above.
11. Now select the CH1 Mean voltage measurement:
a. From the Tekscope menu bar, select Measure > Measurement Setup. The
measurement menu appears.
b. A listing of enabled measurements appears in the Measurements table.
Press the Clear button as needed until no measurements are listed.
c. Under Source, Ch tab, select Channel 1. Under the Ampl tab, select
Mean. “Mean-Ch1” should appear in the Measurements table.
d. Under “Setup”, press the Statistics button. Under “Measurement
Statistics” press Mean. Press Close to clear the menu. The TekScope
graticule should appear full screen, with a “Mean (C1)” voltage readout
on the right. The entry preceded by the ”μ” symbol is the Average Mean
voltage measurement for CH1 (G channel).
12. Record the Average Mean measurement value to the nearest 0.1 mV. In Table
B--9, “Measured White level”, in the “G” column.
13. Temporarily turn off the measurement statistics: Measure > Statistics > Off.
14. Select “ground” on the 9500B. The scope trace will drop down to approximately 1.5 div. below graticule center.
15. Turn Mean measurement statistics back on: Measure > Statistics > Mean.
16. Record the Average Mean measurement value, to the nearest 0.1mV, in
Table B--9, “Measured Black level”, in the “G” column.
NOTE. The oscilloscope readout may be in micro-volts (μV) if the value is near
zero.
17. Move the min-loss pad and cable from the MIU “G” input to the MIU “B”
input.
18. Repeat steps 10 through 16 for the B channel.
NOTE. Settings are for “CH2” rather than “CH1”, and “B” in place of “G”.
19. Move the min-loss pad and cable from the MIU “B” input to the MIU “R”
input.
20. Repeat steps 10 through 16 for the R channel.
B- 22
VM5000 Automatic Video Measurement Set User Manual
Appendix B: Performance Verification
NOTE. Settings are for “CH3” rather than “CH1”, and “R” in place of “G”.
21. In Table B--9, subtract the Measured Black Levels (row 2) from the
Measured White Levels (row 1) and enter the results in row 3. These are the
Measured White-to-Black Amplitude values for each channel.
22. Calculate the Upper and Lower White limit values and the Upper and Lower
Black limit values, using the equations shown in Table B--9.
NOTE. The equations reference the DC700 and DC0 multimeter values from
Table B--8 on page B--20. For these calculations, make sure you use the
multimeter values from Table B--7 on page B--20, not the 9500B Amplitude
Setting values.
23. Check that the Measured White and Black levels for each channel fall within
the corresponding Upper and Lower limit vales.
24. Check that the Measured White-to-Black Amplitudes for each channel fall
within the corresponding Upper and Lower limit values.
25. Turn the 9500B OUTPUT OFF and disconnect the min-loss pad and cable
from the MIU input.
Table B- 9: Amplitude measurement results
Characteristic
G
B
R
Measured White level
Measured Black level
Lower White limit value
{(DC700) x (0.980)} - 8 mV
Upper White limit value
{(DC700) x (1.020)} + 8 mV
Lower Black limit value
(DC0) - 8 mV
Upper Black limit value
(DC0) + 8 mV
Lower White-to-Black limit
value
{[(DC700) x (DC0)] x (0.982)} - 3 mV
Upper White-to-Black limit
value
{[(DC700) x (DC0)] x (1.018)} + 3 mV
VM5000 Automatic Video Measurement Set User Manual
B- 23
Appendix B: Performance Verification
Table B--10 uses the values of DC700 DC0 from the example Table B--9 on
page B--23.
Table B- 10: Example of Amplitude measurement results
Characteristic
G
B
R
Measured White level
699.0 mV
696.2 mV
698.3 mV
Measured Black level
0.0 mV
- 1.7 mV
- 0.5 mV
Measured White-to-Black
Amplitude (MWL-- MBL)
699.0 mV
697.9 mV
698.8 mV
Lower White limit value
{(700.1 mV) x (0.980)} - 8 mV = 678.1 mV
Upper White limit value
{(700.1 mV) x (1.020)} + 8 mV = 722.1 mV
Lower Black limit value
(0.0 mV) - (8 mV) = - 8.0 mV
Upper Black limit value
(0.0 mV) + (8 mV) = +8.0 mV
Lower White-to-Black limit
value
{[(700.1 mV) x (0.0 mV)] x (0.982)} - (3 mV) = 684.5 mV
Upper White-to-Black limit
value
{[(700.1 mV) x (0.0 mV)] x (1.018)} + (3 mV) = 715.7 mV
In this example, all three channels meet their White, Black, and White-to-Black
specifications.
Check Noise Floor
Measurement Accuracy
This test verifies the noise floor of the three VM5000 channels (CH1/G, CH2/B,
CH3/R) and digitizers. Noise floor affects the linearity of the noise measurement
between --56 dB and --32 dB.
Required
equipment
A standard PC
VGA to 5 BNC cable
75 Ω precision BNC terminations (3)
Prerequisites
The VM5000 (including MIU) must warm up for at least 20 minutes
before doing this test.
1. If the VM5000 Option VGA application is not already running, start it now:
from the Tekscope menu bar, select File > Run Application > VM5000
VGA Video.
2. In the VM5000 application, select the default setup: from the VM5000 menu
bar, select File > Recall Default Setup.
B- 24
VM5000 Automatic Video Measurement Set User Manual
Appendix B: Performance Verification
3. Set the Test PC VGA output to 1024x768, 60 Hz refresh frequency:
a. Right click on the desktop. The window that appears is labeled Display
Properties.
b. Select the Settings tab in the Display Properties window.
c. Under Screen Area choose 1024x768 pixels. Click the Advanced
button, choose the Monitor tab, and select 60 Hz refresh rate. Select OK
for the new setting to take effect.
4. Disconnect the monitor cable from the Test PC VGA output jack. In its
place, connect the 3 foot VGA to 5 BNC cable between the PC and H and V
inputs of the MIU. Connect the H and V BNCs to the MIU H and V inputs.
The gray BNC is “H” and the black BNC is “V”. If the distance from the test
PC to the MIU is greater than 3 feet, these cables may be extended.
5. Connect three 75 Ω terminators to G, B, and R inputs of the MIU as shown
in Figure B--8.
PC
VGA to 5 BNC
H
V
G B
MIU
75 Ω
terminators
R
RS 232
VM5000
Figure B- 8: Setup to determine the noise floor measurement accuracy
6. In the VM5000 VGA Video application, select Configuration > Measurements. Press Clear All button, then select Noise Inj Ratio.
7. Select Results > Noise Inj Ratio. Set the number of result averages to 10
and ensure that the 500 MHz filter is enabled.
8. Take the Noise Injection Ratio measurement by clicking the run button.
9. Write down the mV results for G, B and R channels in Table B--11. Ignore
the dB and Noise Injection Ratio % reading.
10. Verify that the measured value for each channel is less than 22 mV.
VM5000 Automatic Video Measurement Set User Manual
B- 25
Appendix B: Performance Verification
11. Disconnect the 3-foot VGA to BNC cable from the Test PC VGA output and
reconnect the monitor cable.
Table B- 11: Noise Floor levels of G, B, and R Channels
Characteristic
G
B
R
5.25 mV
5.25 mV
5.25 mV
Measured Noise value (mV)
Lower Limit
Check Channel Skew
Match
Setup the Channel Skew Match as shown in Figure B--9.
PC
G
CH1
B
R H V
MIU
CH2 CH3 CH4
RS
RS232
232
VM5000
Figure B- 9: Setup to check channel skew match
Required
equipment
A standard PC
3-foot VGA to 5 BNC cable
Test Signal CD
Prerequisites
VM5000 (including MIU) must warm up for at least 20 minutes before
doing this test.
1. Generate a test signal using the test PC as follows:
a. Display the contents of either the Matrix or Full Field folder.
Whether you choose a single test pattern or take multiple measurements,
you must select the bitmap file that you will display to generate the
video test signal. The file you select depends on the format you want to
test.
B- 26
VM5000 Automatic Video Measurement Set User Manual
Appendix B: Performance Verification
Suppose you want to test a 1280X1024 resolution format (the refresh
rate is not considered when selecting a bitmap file). Within the appropriate folder, look for a filename that matches the format of the test you
want to perform. If you want to test Linearity, you would need to choose
either full-field Staircase test pattern or use the Matrix test pattern.
Within the Staircase folder, you would look for a file named
STEP1280X1024.bmp. Within the Matrix folder, look for a file named
Matrix1024x768.bmp.
b. Select the bitmap file that fits your requirements and open the file with a
program such as Paint Shop Pro. If you set up the DUT to drive a second
display, you can set the background of the second display to the bitmap
file rather than opening the file.
2. If the VM5000 Option VGA application is not already running, start it now:
from the Tekscope menu bar, select File > Run Application > VM5000 VGA
Video.
3. In the VM5000 application, select the default setup:
from the VM5000 menu bar, select File > Recall Default Setup
4. Set the Test PC display properties to 1024x768 with a 60 Hz refresh rate:
a. Right click on the desktop, the window that appears is labeled Display
Properties.
b. Select the Settings tab in the Display Properties window.
c. Under Screen Area choose 1024x768 pixels. Click on the Advanced
button, choose the Monitor tab, and select 60 Hz refresh rate. Select OK
for the new setting to take effect.
5. Place the Test Signals CD into the Test PC. View the directory contents and
locate the 1024x768 matrix bit-map signal: “MAT1024x768.bmp”.
Double-click to open the file with the MS Paint program. The matrix test
signal should appear on the Test PC monitor screen.
6. Make the signal full-screen by selecting View > View Bitmap from the MS
Paint menu bar. Move the mouse pointer to the upper left screen edge.
7. Disconnect the monitor cable from the Test PC VGA output jack. In its place
connect the 3-foot VGA to 5 BNC cable. Connect the 5 BNCs to the five
MIU input BNCs. The gray BNC is “H” and the black BNC is “V”. If the
distance from the test PC to the MIU is greater than 3 feet, these cables may
be extended.
8. In the VM5000 VGA Video application, select Configuration > Measurements. Press Clear All, then select Ch-Ch Skew.
VM5000 Automatic Video Measurement Set User Manual
B- 27
Appendix B: Performance Verification
9. Run the measurement. Note the “G to B” measurement result (including
sign) in row 1 of Table B--12.
10. Reverse the G and B cable connections at the MIU and re-run the measurement.
11. Note the G to B measurement result (including sign) in row 2 of Table B--12.
12. Subtract line 2 from line 1 in Table B--12. Divide this result by 2 and enter it
in row 3 of Table B--12.
13. Reverse the G and B cable connections again to restore the original MIU
connections (G to G, B to B).
14. Repeat the procedure in steps 9 through 12 for the G to R measurement.
15. Repeat the procedure in steps 9 through 12 for the B to R measurement.
16. Check that the net delay error (row 3) is less than 2 ns for G to B, G to R and
B to R.
17. Remove the 3-foot VGA cable and reconnect the monitor to the Test PC.
Close the Microsoft Paint program.
Table B- 12: Channel Skew results of G, B, and R channels
G to B
G to R
B to R
Connection 1
Connection 2
Net skew error (Equation 3)
Equation 3 = (Connection 1 - Connection 2) + 2
Check Transient
Response Measurement
Accuracy
This test verifies the Transient Response of VM5000. The Transient Response
determines the bandwidth of the test system. Tektronix specifies the bandwidth
at the probe tip when the recommended accessories are used. The specification
for sync and video transient measurements is shown in the following table for
reference.
Characteristic
Range
Accuracy
Video Rise and Fall time
measurement
>1.3 ns
±5% of reading
800 ps to 1.3 ns
±10% of reading
450 ps to 800 ps
±20% of reading
>5 ns
±5% of reading
2 ns to 5 ns
±11% of reading
Sync Rise and Fall measurement
B- 28
VM5000 Automatic Video Measurement Set User Manual
Appendix B: Performance Verification
Required
equipment
AWG710B Arbitrary Waveform Generator
50 Ω SMA cables (2)
SMA to BNC adapters (2)
Prerequisites
AWG710B and VM5000 (including MIU) must warm up for at least 20
minutes before doing this test.
H Sync Measurement. The steps to perform H Sync measurements are as follows:
AWG710B
CH1
G
MKR 1 /MKR 1
B
R
MIU
H
V
RS 232
VM5000
Figure B- 10: Setup to measure H Sync transient response accuracy
1. Make connections as shown in Figure B--10.
a. Connect Channel 1 of the AWG710B to the H input of the MIU.
b. Connect /MRK 1 of the AWG710B to the V input of the MIU.
2. If the VM5000 Option VGA application is not already running, launch it by
selecting File > Run Application > VM5000 VGA Video.
3. From the VM5000 application menu bar, select File > Recall Default Setup.
4. From the VM5000 application menu bar, select Configuration > Pull down
menu: Format. Select 2048 x 1536 resolution and 85 Hz refresh rate.
VM5000 Automatic Video Measurement Set User Manual
B- 29
Appendix B: Performance Verification
5. From the VM5000 application menu bar, select Configuration > Measurement > Clear All.
6. From the VM5000 application menu bar, select Configuration > Measurement > H Sync.
7. On the AWG710B: Load the H sync test file and setup from the floppy drive
by following these steps:
a. Load the floppy disk containing the AWG710B .set and .wfm files into
the AWG710B.
b. Load the pvhsyncsetup.set setup file. Press buttons in the following
sequence: setup (button) > Save/Restore (bottom) > restore setup (right)
> drive (right) > floppy (center) > OK (right) > pvhsyncsetup.set
(middle) > OK (right).
8. On the AWG710B: Output the test signal from AWG710B by following
these steps:
a. Press the CH1 button and enable signal output from Channel 1.
b. Press the MARKER OUT button and enable signal output from /MKR 1.
c. Press the Run button to start generating the signal.
9. From the VM5000 application menu bar, run H Sync measurement: Click
the Run button to take the measurement (to autoscale).
10. From the VM5000 application menu bar, deselect (disable) Auto Scale:
select Configuration > Operations > Auto Scale > deselect/disable.
11. From the VM5000 application menu bar, run the H Sync measurement:
Click the Run button to take the measurement.
12. Enter the results in Table B--13 and verify that the measured values are
within the lower and upper limits.
Table B- 13: H Sync Transient measurement results
B- 30
H-Sync parameter
Lower Limit
Measured result
Upper limit
Pulse Width (μs)
0.576
0.578
Sync Period (μs)
7.297
7.299
Rise Time (ns)
1.840
2.300
Fall Time (ns)
1.840
2.300
VM5000 Automatic Video Measurement Set User Manual
Appendix B: Performance Verification
Video Transient
Measurement
Required
equipment
AWG710B Arbitrary Waveform Generator
50 Ω SMA cables (3)
SMA to BNC adapters (3)
50 - 75 Ω min loss pad (1)
Prerequisites
AWG710B and VM5000 (including MIU) must warm up for at least 20
minutes before doing this test.
AWG710B
CH1
MKR 1 /MKR 1
CH1
Min loss pad
50 to 75 Ω
G
B
R
MIU
H
V
RS 232
VM5000
Figure B- 11: Setup to perform Transient and Linearity measurements
The steps for checking the Video Transient measurement are as follows:
1. Make connections as shown in Figure B--11.
a. Connect Channel 1 of the AWG710B to the G input of the MIU (through
50 Ω to 75 Ω min loss pad).
b. Connect the MRK 1 output from the AWG710B to the H input of the
MIU.
c. Connect the /MRK 1 output from the AWG710B to the V input of the
MIU.
2. If the VM5000 Option VGA application is not already running, launch by
selecting File > Run Application > VM5000 VGA Video.
3. From the VM5000 application menu bar, select File > Recall Default Setup.
VM5000 Automatic Video Measurement Set User Manual
B- 31
Appendix B: Performance Verification
4. From the VM5000 application menu bar, select Configuration > Format
panel, select 2048 x 1536 resolution and 85 Hz refresh rate (click OK in case
a warning message pops up regarding this format selection).
5. From the VM5000 application menu bar, select Configuration > Measurement > Clear All.
6. From the VM5000 application menu bar, select Configuration > Measurement > Video Transient.
7. From the VM5000 application menu bar, deselect (Disable) Configuration >
Operations panel > Sync polarity > Auto Detect.
8. From the VM5000 application menu bar, deselect (Disable) Configuration >
Warnings > Pop Up Warning Details.
9. On the AWG710B: Load the H sync test file and setup from the floppy drive
as follows:
Load the pvvidtranssetup.set setup file: Press buttons in the following
sequence: setup (button) > Save/Restore (bottom) > restore setup (right) >
drive (right) > floppy (center) > OK (right) > pvvidtranssetup.set (middle) >
OK (right). Wait for file loading to complete.
10. On the AWG710B: Generate a test signal by using the following steps:
a. Press the CH1 button to enable signal output from Channel 1.
b. Press the MARKER OUT button to enable signal output from MKR 1
and /MKR 1.
c. Press the Run button to start generating the signal.
11. From the VM5000 application menu bar, run the Video Transient measurement. Click the Run button to take the measurement.
12. Enter the results in Table B--14 and verify that the measured values are
within the lower and upper limits.
Table B- 14: Video rise/fall time - G Channel
G Channel parameters
Lower limit
Measured result
Upper limit
Video Rise Time (ns)
0.360
0.540
Video Fall Time (ns)
0.360
0.540
13. Move AWG710B CH1 output and min loss pad from MIU “G” to MIU “B”
input.
B- 32
VM5000 Automatic Video Measurement Set User Manual
Appendix B: Performance Verification
14. From the VM5000 application menu bar, run Video Transient measurement.
Click the Run button to take the measurement.
15. Enter the results in Table B--15 and ensure that the measured values are
within the lower and upper limits.
Table B- 15: Video rise/fall time - B Channel
B Channel parameters
Lower limit
Measured result
Upper limit
Video Rise Time (ns)
0.360
0.540
Video Fall Time (ns)
0.360
0.540
16. Move the AWG710B CH1 output and min loss pad from the MIU “B” input
to the MIU “R” input.
17. From the VM5000 application menu bar, take the Video Transient measurement: Click the Run button to take the measurement.
18. Enter the results in Table B--16 and verify that the measured values are
within the lower and upper limits.
19. At this point the AWG710B may be disconnected and turned off unless
further verification tests are desired.
Table B- 16: Video rise/fall time - R Channel
Check Linearity
Measurement Accuracy
R Channel parameters
Lower limit
Measured result
Upper limit
Video Rise Time (ns)
0.360
0.540
Video Fall Time (ns)
0.360
0.540
This test verifies the accuracy of the vertical resolution, monotonicity, integral
and differential linearity of the test system.
Required
equipment
AWG710B Arbitrary Waveform Generator
50 Ω SMA cables (3)
SMA to BNC adapters (3)
50 - 75 Ω min loss pad (1)
6 dB Attenuators (2) - Tek part number 011-0069-03
Prerequisites
The AWG710B and VM5000 (including MIU) must warm
up for at least 20 minutes before doing this test.
VM5000 Automatic Video Measurement Set User Manual
B- 33
Appendix B: Performance Verification
Linearity Measurement The steps for checking the Linearity measurement are as
follows:
1. Make connections as shown in Figure B--11 on page B--31.
a. Connect the AWG710B CH1 to the G input of the MIU through the
50 Ω to 75 Ω min loss pad.
b. Connect the MRK 1 output of the AWG710B to the H input of the MIU.
c. Connect the /MRK 1 output of the AWG710B to the V input of the MIU.
2. If the VM5000 Option VGA application is not already running, launch by
selecting File > Run Application > VM5000 VGA Video.
3. From the VM5000 application menu bar, select File > Recall Default Setup.
4. From the VM5000 application menu bar, select Configuration > Format to
display the Format panel. Select 2048 x 1536 resolution and 85 Hz refresh
rate.
5. From the VM5000 application menu bar, select Configuration > Measurement > Clear All.
6. From the VM5000 application menu bar, select Configuration > Measurement > Linearity.
7. From the VM5000 application menu bar, deselect (Disable) Configuration >
Operations panel > Sync polarity > Auto Detect.
8. From the VM5000 application menu bar, deselect (Disable) Configuration >
Warnings > Pop Up Warning Details.
9. On the AWG710B: Load the H sync test file and setup from the floppy drive
by following these steps:
Load the pvlinearltysetup.set setup file: Press buttons in the following
sequence: setup (button) > Save/Restore (bottom) > restore setup (right) >
drive (right) > floppy (center) > OK (right) > pvlinearltysetup.set (middle) >
OK (right). Wait for file loading to complete.
10. On the AWG710B: Generate the test signal on the AWG710B by following
these steps:
a. Press the CH1 button to enable signal output from Channel 1.
b.
Press the MARKER OUT button to enable signal output from /MKR 1.
c. Press the Run button to start generating the signal.
B- 34
VM5000 Automatic Video Measurement Set User Manual
Appendix B: Performance Verification
8-bit INL, DNL, Monotonicity, and Resolution measurement. The steps for checking
the 8-bit INL, DNL, Monotonicity, and Resolution measurement are as follows:
11. From the VM5000 application menu bar, click the Run button to take the
linearity measurement.
12. Record the measured result in Table B--17.
13. Check that the results are within the upper and lower limit.
Table B- 17: 8-bit Linearity measurement results - G channel
Linearity
Lower limit
G
Upper limit
Resolution (Bits)
8
8
Max INL (LSB)
- 5.12
5.12
Max DNL (LSB)
- 0.25
0.25
Monotonic (Y/N)
Yes
Yes
14. Connect the AWG710B CH1 output to the B input of the MIU.
15. From the VM5000 application menu bar, click the Run button to take the
linearity measurement.
16. Record the measured result in Table B--18.
17. Check that the results are within the upper and lower limit.
Table B- 18: 8-bit Linearity measurement results - B channel
Linearity
Lower limit
B
Upper limit
Resolution (Bits)
8
8
Max INL (LSB)
- 5.12
5.12
Max DNL (LSB)
- 0.25
0.25
Monotonic (Y/N)
Yes
Yes
18. Connect the AWG710B CH1 output to the R input of the MIU.
19. From the VM5000 application menu bar, click the Run button to take the
linearity measurement.
20. Record the measured result in Table B--19.
21. Check that the results are within the upper and lower limit.
VM5000 Automatic Video Measurement Set User Manual
B- 35
Appendix B: Performance Verification
Table B- 19: 8-bit Linearity measurement results - R channel
Linearity
Lower limit
R
Upper limit
Resolution (Bits)
8
8
Max INL (LSB)
- 5.12
5.12
Max DNL (LSB)
- 0.25
0.25
Monotonic (Y/N)
Yes
Yes
10-bit DNL, Monotonicity and Resolution measurement: G Channel. The steps for
checking the 10-bit DNL, Monotonicity, and Resolution measurement are as
follows:
22. Make connections as shown in Figure B--11 on page B--31.
a. Connect the CH1 output of the AWG710B to the G input of the MIU
(through the 50 Ω to 75 Ω min loss pad).
b. Connect the MRK 1 output of the AWG710B to the H input of the MIU.
c. Connect the /MRK 1 output of the AWG710B to the V input of the MIU.
23. On the VM5000: Click the Run button to take the linearity measurement. It
may take a few minutes for the measurement to complete.
24. Connect the AWG710B CH1 output to the G input of the MIU with the two
6 dB (2x) attenuators and min loss pad added as shown in Figure B--12 on
page B--40.
25. From the VM5000 application menu bar, select Configuration > Operation >
Setup And/Or Run > Run Only.
26. From the TekScope application menu bar, select Vertical > Offset > Select
Ch1 > enter 0.350 (Volts) in Offset box.
27. From the TekScope application menu bar, Click on App software button.
28. From the VM5000 application menu bar, click the Run button to take the
linearity measurement.
29. Record the results in Table B--20.
30. Check that the results are within the upper and lower limits (Resolution
should read 8-bit).
B- 36
VM5000 Automatic Video Measurement Set User Manual
Appendix B: Performance Verification
Table B- 20: 10-bit Linearity, G Channel, Level 1 of 4
Linearity
Lower limit
G
Upper limit
Resolution (Bits)
8
8
Max INL (LSB)
- 5.12
5.12
Max DNL (LSB)
- 0.5
0.5
Monotonic (Y/N)
Yes
Yes
31. From the TekScope application menu bar, select Vertical > Offset > Select
Ch1 > enter 0.175 (Volts) in Offset box.
32. From the TekScope application menu bar, click on App software button.
33. From the VM5000 application menu bar, click the Run button to take the
linearity measurement.
34. Record the results in Table B--21.
35. Check that the results are within the upper and lower limits (Resolution
should read 8-bit).
Table B- 21: 10-bit Linearity, G Channel, Level 2 of 4
Linearity
Lower limit
G
Upper limit
Resolution (Bits)
8
8
Max INL (LSB)
- 5.12
5.12
Max DNL (LSB)
- 0.5
0.5
Monotonic (Y/N)
Yes
Yes
36. From the TekScope application menu bar, select Vertical > Offset > Ch1 >
enter 0 (Volts) in Offset box.
37. From the TekScope application menu bar, click on App software button.
38. From the VM5000 application menu bar, click the Run button to take the
linearity measurement.
39. Record the results in Table B--22.
40. Check that the results are within the upper and lower limits (Resolution
should read 8-bit).
VM5000 Automatic Video Measurement Set User Manual
B- 37
Appendix B: Performance Verification
Table B- 22: 10-bit Linearity, G Channel, Level 3 of 4
Linearity
Lower limit
G
Upper limit
Resolution (Bits)
8
8
Max INL (LSB)
- 20.48
20.48
Max DNL (LSB)
- 0.5
0.5
Monotonic (Y/N)
Yes
Yes
41. From the TekScope application menu bar, select Top menu: Vertical > Offset
> Select Ch1 > enter --0.175 (Volts) in Offset box.
42. From the TekScope application menu bar, click on App software button.
43. From the VM5000 application menu bar, click the Run button to take the
linearity measurement.
44. Record the results in Table B--23.
45. Check that the results are within the upper and lower limits (Resolution
should read 8-bit).
Table B- 23: 10-bit Linearity, G Channel, Level 4 of 4
Linearity
Lower limit
G
Upper limit
Resolution (Bits)
8
8
Max INL (LSB)
- 5.12
5.12
Max DNL (LSB)
- 0.5
0.5
Monotonic (Y/N)
Yes
Yes
46. Compute composite resolution: If the Resolution (bits) value in Tables B--20
through B--23 is the same, add 2 to the value and enter this value under
“Resolution (Bits)” in Table B--24. If the value for Resolution (bits) is not
the same for all tables, the Resolution portion of the performance verification
for this channel has failed.
47. Determine maximum INL: find the worst case (extreme) INL value from
Table B--20 to Table B--23 and enter the resulting value, or this value plus
the INL value from Table B--17, which ever has the largest absolute value,
under ”Max INL (LSB)” in Table B--24 on page B--39.
48. Compute maximum DNL: find the worst case (extreme) DNL value from
Table B--20 to Table B--23 and enter the resulting value under “Max DNL
(LSB)” in Table B--24 on page B--39.
B- 38
VM5000 Automatic Video Measurement Set User Manual
Appendix B: Performance Verification
49. Determine monotonicity: enter “Yes” under “Monotonic (Y/N)” if and only
if the corresponding values in Table B--20 through Table B--23 are “Yes.”
Otherwise enter “No” in Table B--23 on page B--38.
50. Check that the results are within the upper and lower limits.
Table B- 24: 10-bit Linearity, G Channel, All Levels
Linearity
Lower limit
G
Upper limit
Resolution (Bits)
10
10
Max INL (LSB)
- 5.12
5.12
Max DNL (LSB)
- 0.5
0.5
Monotonic (Y/N)
Yes
Yes
10-bit DNL, Monotonicity and Resolution measurement: B Channel. The steps for
checking the 10-bit DNL, Monotonicity and Resolution measurement: B
Channel are as follows:
51. Make connections as shown in Figure B--11 on page B--31. Use the MIU “B”
input instead of “G”:
a. Connect the Channel 1 output of the AWG710B to B input of the MIU
(through the 50 Ω to 75 Ω min loss pad).
b. Connect the MRK 1 output of the AWG710B to the H input of the MIU.
c. Connect the /MRK 1 output of the AWG710B to the V input of the MIU.
52. From the VM5000 application menu bar, select Configuration > Operation >
Setup And/Or Run > Setup And Run.
53. From the VM5000 application menu bar, click the Run button to take the
linearity measurement. It may take a few minutes for the measurement to
complete.
54. Connect the AWG710B CH1 output to B input of the MIU with the two
6 dB (2x) attenuators and the min loss pad added as shown in Figure B--12
on page B--40.
55. From the VM5000 application menu bar, select Configuration > Operation >
Setup And/Or Run > Run Only.
56. From the TekScope application menu bar, select Vertical > Offset > Select
Ch2 > enter 0.350 (Volts) in Offset box.
57. From the TekScope application menu bar, click the App software button.
VM5000 Automatic Video Measurement Set User Manual
B- 39
Appendix B: Performance Verification
58. From the VM5000 application menu bar, click the Run button to take the
linearity measurement.
AWG710B
CH 1
MKR 1 /MKR 1
50 Ω 6 dB
attenuator
50 Ω 6 dB
attenuator
Min loss pad
50 to 75 Ω
G
B
R
MIU
H
V
RS 232
VM5000
Figure B- 12: Setup to perform Linearity measurement
59. Record the results in Table B--25.
60. Check that the results are within the upper and lower limits (Resolution
should read 8-bit).
Table B- 25: 10-bit Linearity, B Channel, Level 1 of 4
Linearity
B- 40
Lower limit
B
Upper limit
Resolution (Bits)
8
8
Max INL (LSB)
- 5.12
5.12
Max DNL (LSB)
- 0.5
0.5
Monotonic (Y/N)
Yes
Yes
VM5000 Automatic Video Measurement Set User Manual
Appendix B: Performance Verification
61. From the TekScope application menu bar, select Vertical > Offset > Select
Ch2 > enter 0.175 (Volts) in Offset box.
62. From the TekScope application menu bar, click the App software button.
63. From the VM5000 application menu bar, click the Run button to take the
linearity measurement.
64. Record the results in Table B--26.
65. Check that the results are within the upper and lower limits (Resolution
should read 8-bit).
Table B- 26: 10-bit Linearity, B Channel, Level 2 of 4
Linearity
Lower limit
B
Upper limit
Resolution (Bits)
8
8
Max INL (LSB)
- 5.12
5.12
Max DNL (LSB)
- 0.5
0.5
Monotonic (Y/N)
Yes
Yes
66. From the TekScope application menu bar, select Vertical > Offset > Select
Ch2 > enter 0 (Volts) in Offset box.
67. From the TekScope application menu bar, click the App software button.
68. From the VM5000 application menu bar, click the Run button to take the
linearity measurement.
69. Record the results in Table B--27.
70. Check that the results are within the upper and lower limits (Resolution
should read 8-bit).
Table B- 27: 10-bit Linearity, B Channel, Level 3 of 4
Linearity
Lower limit
B
Upper limit
Resolution (Bits)
8
8
8
Max INL (LSB)
- 5.12
5.12
Max DNL (LSB)
- 0.5
0.5
Monotonic (Y/N)
Yes
Yes
71. From the TekScope application menu bar, select Vertical > Offset > Select
Ch2 > enter --0.175 (Volts) in Offset box.
VM5000 Automatic Video Measurement Set User Manual
B- 41
Appendix B: Performance Verification
72. From the VM5000 application menu bar, click the App software button.
73. From the VM5000 application menu bar, click the Run button to take the
linearity measurement.
74. Record the results in Table B--28.
75. Check that the results are within the upper and lower limits (Resolution
should read 8-bit).
Table B- 28: 10-bit Linearity, B Channel, Level 4 of 4
Linearity
Lower limit
B
Upper limit
Resolution (Bits)
8
8
Max INL (LSB)
- 5.12
5.12
Max DNL (LSB)
- 0.5
0.5
Monotonic (Y/N)
Yes
Yes
76. Compute composite resolution: If the Resolution (bits) value in Tables B--25
through B--28 is the same, add 2 to the value and enter this value under
“Resolution (Bits)” in Table B--29. If the value for Resolution (bits) is not
the same for all tables, the Resolution portion of the performance verification
for this channel has failed.
77. Determine maximum INL: find the worst case INL value from Table B--25 to
Table B--28 and enter the resulting value, or this value plus the INL value
from Table B--12 on page B--28, which ever has the largest absolute value
under ”Max INL (LSB)” in Table B--29 on page B--42.
78. Determine maximum DNL: find the worst case DNL value from Table B--25
to Table B--28 and enter the resulting value under “Max DNL (LSB)” in
Table B--29 on page B--42.
79. Determine monotonicity: enter “Yes” under Monotonic (Y/N) if and only if
the corresponding values in Table B--25 through Table B--28 are “Yes.”
Otherwise enter “No” in Table B--28 on page B--42.
80. Check that the results are within the upper and lower limits.
Table B- 29: 10-bit Linearity, B Channel, All Levels
B- 42
Linearity
Lower limit
B
Upper limit
Resolution (Bits)
10
10
Max INL (LSB)
- 5.12
5.12
VM5000 Automatic Video Measurement Set User Manual
Appendix B: Performance Verification
Table B- 29: 10-bit Linearity, B Channel, All Levels (Cont.)
Linearity
Lower limit
B
Upper limit
Max DNL (LSB)
- 0.5
0.5
Monotonic (Y/N)
Yes
Yes
10-bit DNL, Monotonicity and Resolution measurement: R Channel. The steps for
checking the 10-bit DNL, Monotonicity and Resolution measurement: R
Channel are as follows:
81. Make connections as shown in Figure B--11 on page B--31: Setup to perform
Transient and Linearity measurements. Use the MIU “R” input instead of
“G”:
a. Connect the Channel 1 output of the AWG710B to the R input of the
MIU (through the 50 Ω to 75 Ω min loss pad).
b. Connect the MRK 1 output of the AWG710B to the H input of the MIU.
c. Connect the /MRK 1 output of the AWG710B to the V input of the MIU.
82. From the VM5000 application menu bar, select Configuration > Operation >
Setup And/Or Run > Setup And Run.
83. From the VM5000 application menu bar, click the Run button to take the
linearity measurement. It may take a few minutes for the measurement to
complete.
84. Connect the AWG710B CH1 output to the R input of the MIU with the two
6 dB attenuators and min loss pad added as shown in Figure B--12 on
page B--40.
85. From the VM5000 application menu bar, select Configuration > Operation >
Setup And/Or Run > Run Only.
86. From the TekScope application menu bar, select Top menu: Vertical > Offset
> Select Ch3 > enter 0.350 (Volts) in Offset box.
87. From the TekScope application menu bar, click the App software button.
88. From the VM5000 application menu bar, click the Run button to take the
linearity measurement.
89. Record the results in Table B--30.
90. Check that the results are within the upper and lower limits (Resolution
should read 8-bit).
VM5000 Automatic Video Measurement Set User Manual
B- 43
Appendix B: Performance Verification
Table B- 30: 10-bit Linearity, R Channel, Level 1 of 4
Linearity
Lower limit
R
Upper limit
Resolution (Bits)
8
8
Max INL (LSB)
- 5.12
5.12
Max DNL (LSB)
- 0.5
0.5
Monotonic (Y/N)
Yes
Yes
91. From the TekScope application menu bar, select Vertical > Offset > Select
Ch3 > enter 0.175 (Volts) in Offset box.
92. From the TekScope application menu bar, click the App software button.
93. From the VM5000 application menu bar, click the Run button to take the
linearity measurement.
94. Record the results in Table B--31.
95. Check that the results are within the upper and lower limits (Resolution
should read 8-bit).
Table B- 31: 10-bit Linearity, R Channel, Level 2 of 4
Linearity
Lower limit
R
Upper limit
Resolution (Bits)
8
8
Max INL (LSB)
- 5.12
5.12
Max DNL (LSB)
- 0.5
0.5
Monotonic (Y/N)
Yes
Yes
96. From the TekScope application menu bar, select Vertical > Offset > Select
Ch3 > enter 0 (Volts) in Offset box.
97. From the TekScope application menu bar, click the App software button.
98. From the VM5000 application menu bar, click the Run button to take the
linearity measurement.
99. Record the results in Table B--32.
100. Check that the results are within the upper and lower limits (Resolution
should read 8-bit).
B- 44
VM5000 Automatic Video Measurement Set User Manual
Test Equipment Depot - 800.517.8431 - 99 Washington Street Melrose, MA 02176 - FAX 781.665.0780 - TestEquipmentDepot.com
Appendix B: Performance Verification
Table B- 32: 10-bit Linearity, R Channel, Level 3 of 4
Linearity
Lower limit
R
Upper limit
Resolution (Bits)
8
8
Max INL (LSB)
- 5.12
5.12
Max DNL (LSB)
- 0.5
0.5
Monotonic (Y/N)
Yes
Yes
101. From the TekScope application menu bar, select Vertical > Offset > Select
Ch3 > enter --0.175 (Volts) in Offset box.
102. From the TekScope application menu bar, click the App software button.
103. From the VM5000 application menu bar, click the Run button to take the
linearity measurement.
104. Record the results in Table B--33.
105. Check that the results are within the upper and lower limits (Resolution
should read 8-bit).
Table B- 33: 10-bit Linearity, R Channel, Level 4 of 4
Linearity
Lower limit
R
Upper limit
Resolution (Bits)
8
8
8
Max INL (LSB)
- 5.12
5.12
Max DNL (LSB)
- 0.5
0.5
Monotonic (Y/N)
Yes
Yes
106. Compute composite resolution: If the Resolution (bits) value in
Tables B--30 through B--33 is the same, add 2 to the value and enter this
value under “Resolution (Bits)” in Table B--34. If the value for Resolution
(bits) is not the same for all tables, the Resolution portion of the performance
verification for this channel has failed.
107. Determine maximum INL: find the worst case INL value from Table B--30
to Table B--33 and enter the resulting value, or this value plus the INL value
from Table B--18 on page B--35, whichever has the largest absolute value,
under Max INL (LSB) in Table B--34 on page B--46.
108. Determine maximum DNL: find the worst case DNL value from
Table B--30 to Table B--33 and enter the resulting value under Max DNL
(LSB) in Table B--34 on page B--46.
VM5000 Automatic Video Measurement Set User Manual
B- 45
Appendix B: Performance Verification
109. Determine monotonicity: enter “Yes” in under Monotonic (Y/N) if and
only if the corresponding values of each of Table B--30 to Table B--33 are
“Yes.” Otherwise enter “No” in Table B--34 on page B--46.
110. Check that the results are within the upper and lower limits.
Table B- 34: 10-bit Linearity, R Channel, All Levels
Linearity
Lower limit
R
Upper limit
Resolution (Bits)
10
10
Max INL (LSB)
- 5.12
5.12
Max DNL (LSB)
- 0.5
0.5
Monotonic (Y/N)
Yes
Yes
This completes the VM5000 Option VGA performance verification.
B- 46
VM5000 Automatic Video Measurement Set User Manual
Appendix C: Cleaning
Use these procedures to clean your instrument. If additional cleaning is required,
have your instrument serviced by qualified service personnel.
Exterior Cleaning
Clean the exterior surfaces of the chassis with a dry lint-free cloth or a softbristle brush. If any dirt remains, use a cloth or swab dipped in a 75% isopropyl
alcohol solution. Use a swab to clean narrow spaces around controls and
connectors. Do not use abrasive compounds on any part of the chassis.
Clean the On/Standby switch using a dampened cleaning towel. Do not spray or
wet the switch directly.
CAUTION. Do not use chemical cleaning agents that might damage the plastics
used in this instrument. Use only deionized water when cleaning the
front-panel buttons. Use a 75% isopropyl alcohol solution as a cleaner and rinse
with deionized water. Before using any other type of cleaner, consult your
Tektronix Service Center or representative.
To prevent getting moisture inside the instrument during external cleaning, use
only enough liquid to dampen the cloth or applicator.
Flat Panel Display Cleaning
The display is soft plastic and must be treated with care during cleaning.
CAUTION. Improper cleaning agents or methods can damage the flat panel
display.
Do not use abrasive cleaners or commercial glass cleaners to clean the display
surface.
Do not spray liquids directly on the display surface.
Do not scrub the display with excessive force.
VM5000 Automatic Video Measurement Set User Manual
C- 1
Appendix C: Cleaning
Clean the flat panel display surface by gently rubbing the display with a
clean-room wipe (such as Wypall Medium Duty Wipes, #05701, available from
Kimberly-Clark Corporation).
CAUTION. To prevent getting moisture inside the instrument during external
cleaning, use only enough liquid to dampen the cloth or applicator.
If the display is very dirty, moisten the wipe with distilled water or a 75%
isopropyl alcohol solution and gently rub the display surface. Avoid using excess
force or you may damage the plastic display surface.
C- 2
VM5000 Automatic Video Measurement Set User Manual
Appendix D: Rebuilding the Hard Drive
If you need to rebuild the hard drive, you must install software from three CDs
in the following order:
1. Follow the directions in the CD jewelcase booklet to install the operating
system restore CD, 063-3693-XX.
2. Follow the directions in the CD jewelcase booklet to install the TDS5000
product software CD, 063-3692-XX.
3. Install the VM5000 application CD, 063-3768-XX.
4. Follow the online instructions.
When asked, enter your option key information from the sticker on the back
of your instrument.
VM5000 Automatic Video Measurement Set User Manual
D- 1
Appendix E: Signal Sources Package Contents
There are two versions of the Signal Sources package. One version for Option SD/HD and one version for Option VGA. The version for Option SD/HD is
described below. The description of the Option VGA version begins on
page E--8.
Option SD/HD Signal Source Discs
The Signal Sources package (Option SS in upgrade kits) is a collection of DVDs
and CDs that contain Matrix test pattern signal source files in a number of video
formats. See page 2--16 for information on the Matrix test pattern. The Signal
Sources package can contain one or two kits. One kit contains four CDs. This kit
is a standard accessory for Option HD instruments. The second kit contains two
DVDs. The second kit is a standard accessory with both Options HD and SD.
Table E--1 lists the Signal Source discs.
Table E- 1: Signal Sources discs
Title
Tektronix part
number
Included with
Option
Baseband Test Signals, Version 2.0
063-3794-XX
HD
ATSC Transport Streams, Version 2.0
063-3806-XX
HD
Standard Definition TV Elementary Streams,
Version 2.0
063-3819-XX
HD
Advanced TV Elementary Streams, Version 2.0
063-3820-XX
HD
480 Line DVD, Version 2.0
063-3664-XX
SD, HD
576 Line DVD, Version 2.0
063-3665-XX
SD, HD
Table E--2 provides an overview of the test signal formats that can be generated
using files located on the Signal Sources discs. The table also lists which TG700
modules are required to generate test signals with the TG700 using the DNL files
supplied with the Signal Sources discs.
VM5000 Automatic Video Measurement Set User Manual
E- 1
Appendix E: Signal Sources Package Contents
Table E- 2: Test Signal Files - File and Signal Formats
TG700 DNL
Test Signal Format
Bitmap
File
AVG7
480i/59.94
X
X
X
576i/50
X
X
X
480p/59.94
X
X
X
576p/50
X
X
X
720p/59.94
X
X
X
1080i/50
X
X
X
1080i/59.94
X
X
X
X
X
1080p/24
X
X
X
X
X
AWVG7
DVG7
HDVG7
ATSC Transport Stream
Compressed MPEG
Elementary Stream
DVD
X
X
X
X
X
X
X
X
X
X
X
Baseband Test Signals CD
The Baseband Test Signals disc (Tektronix part number 063-3794-XX) contains
files for generating baseband test signals. There is one directory:
H
The TG700 directory contains setup (.dnl) files for generating Matrix test
signals using the Tektronix TG700 TV Signal Generator Platform. Table E--3
lists the analog image format standard .dnl setup files. Table E--4 lists the
digital image format standard .dnl setup files.
Table E- 3: TG700 DNL analog signal format files
Image signal format
Field rate
TG700 module
Color space
Signal file name
480 (525 total lines)
59.94
AVG7
RGB
525I59G.DNL
YPbPr
525I59Y.DNL
RGB
525P59G.DNL
YPbPr
525P59Y.DNL
RGB
625i50G.DNL
YPbPr
625i50Y.DNL
RGB
625p50G.DNL
YPbPr
625p50Y.DNL
RGB
720p50G.DNL
YPbPr
720p50Y.DNL
RGB
720p59G.DNL
YPbPr
720p59Y.DNL
576 (625 total lines)
720p
720p
E- 2
50
50
59.94
AVG7
AWVG7
AWVG7
VM5000 Automatic Video Measurement Set User Manual
Appendix E: Signal Sources Package Contents
Table E- 3: TG700 DNL analog signal format files (Cont.)
Image signal format
Field rate
TG700 module
Color space
Signal file name
1080i
50
AWVG7
RGB
1080i50G.DNL
YPbPr
1080i50Y.DNL
RGB
1080i59G.DNL
YPbPr
1080i59Y.DNL
RGB
1080p24G.DNL
YPbPr
1080p24Y.DNL
59.94
1080p
AWVG7
24
AWVG7
Table E- 4: TG700 DNL digital signal format files
Image signal format
Field rate
TG700 module
Color space
Signal file name
720p
50
HDVG7
YPbPr
720P50D.DNL
59.94
HDVG7
YPbPr
720P59D.DNL
50
HDVG7
YPbPr
1080I50D.DNL
59.94
HDVG7
YPbPr
1080I59D.DNL
24
HDVG7
YPbPr
1080P24D.DNL
1080i
1080p
To use the TG700 .dnl setup files, copy the required file or files to a PC. Then
use the communication program that came with the TG700 to move the setup
files over your network from the PC to the TG700 instrument. Figure E--1 shows
a typical test signal setup using the TG700 instrument as the signal source.
TG700 DNL
baseband files
TG700
Y
Pb
Pr
MPEG
Compression
MPEG
transport
stream
Modulator
RF
DUT
Y
Pb
Pr
CH1
CH2
VM5000
CH3
Figure E- 1: Using TG700 baseband test signals
VM5000 Automatic Video Measurement Set User Manual
E- 3
Appendix E: Signal Sources Package Contents
ATSC Transport Stream CD
The ATSC Transport Streams disc (Tektronix part number 063-3806-XX)
contains files for playout on an MPEG player (such as the Tektronix MTX100
MPEG Recorder and Player) to generate Matrix pattern compressed ATSC
transport stream test signals for 480, 720, and 1080 standards. Table E--5 lists the
available image format standard .trp setup files.
Table E- 5: Available MXT100 .trp signal setup files
Image format
Field rate
MTX100 setup file(s)
480i
59.94
M480i4x3A.trp
M480i16x9A.trp
480p
59.94
M480p4x3.trp
M480p16x9.trp
720p
59.94
M720p59.trp
1080p
24
M1080p24.trp
1080i
59.94
M1080i59.trp
The disc also has WFMS directory that contains .bmp-format screen captures
from the Tektronix WFMNLE Software Waveform Monitor, showing individual
lines and channels of the Matrix test signal 1 minute video loop, for a particular
format.
To use the MTX100 .trp setup files, insert the disc into the MTX00. Refer to the
MTX100 MPEG Recorder and Player User manual for information on loading
instrument setup files. Figure E--2 shows a typical test signal setup using the
MTX100 instrument as the signal source.
Transport Stream files on CD
MTX100
MPEG
transport
stream
Modulator
RF
DUT
Y
Pb
Pr
CH1
CH2
VM5000
CH3
Figure E- 2: Using ATSC transport stream signals
E- 4
VM5000 Automatic Video Measurement Set User Manual
Appendix E: Signal Sources Package Contents
Advanced TV Elementary Streams CD
Standard Definition TV Elementary Streams CD
The Advanced TV Elementary Streams disc (Tektronix part number
063-3820-XX) and the Standard Definition TV Elementary Streams disc
(Tektronix part number 063-3819-XX) contain MPEG2-compressed elementary
stream files. You use these files with a transport stream multiplexor to build
advanced TV or standard definition TV transport streams. Tables E--6 and E--8
list the elementary stream formats. Each disc also contains bitmap images (in
BMP format) that you can display on a PC to see what a good signal should look
like when displayed on a TV monitor. Tables E--7 and E--9 list the bitmap files.
The RGB .bmp files with the XT suffix have been been processed with an
anti-alias filter applied to the Pb and Pr portion for 4:2:2 or 4:0:0 representation
such as in the .mpg and .trp files. Use the XT files for any compression, for
example MPEG2, which requires subsampling of the color difference signals.
Table E- 6: Advanced TV Elementary Streams
Image format
Field rate
File
Ratio
720p
50
M720p50.mpg
16:9
59.94
M720p59.mpg
16:9
1080p
24
M1080p24.mpg
16:9
1080i
50
M1080i50.mpg
16:9
59.94
M1080i59.mpg
16:9
Table E- 7: Advanced TV Bitmaps
Image format
File name
720
M720.BMP
M720XT.BMP
1080
M1080.BMP
M1080XT.BMP
VM5000 Automatic Video Measurement Set User Manual
E- 5
Appendix E: Signal Sources Package Contents
Table E- 8: Standard Definition TV Elementary Streams
Image format
Field rate
File
Ratio
480i
59.94
M480i4x3A.mpg
4:3
M480i4x3D.mpg
4:3
M480i16x9A.mpg
16:9
M480i16x9D.mpg
16:9
M480p4x3.mpg
4:3
M480p16x9.mpg
16:9
M576i4x3.mpg
4:3
M576i16x9.mpg
16:9
M576p4x3.mpg
4:3
M576p16x9.mpg
16:9
480p
59.94
576i
59.94
576p
59.94
Table E- 9: Standard Definition TV Bitmaps
Image format
File name
480
M480.BMP
M480XT.BMP
576
M576.BMP
M576XT.BMP
To use the elementary stream files, copy the appropriate files into your transport
stream multiplexor. Figure E--3 shows a typical elementary stream test setup.
Elementary Stream
files on CD
Transport
Stream
Multiplexor
MPEG
transport
stream
Modulator
RF
DUT
Y
Pb
Pr
CH1
CH2
VM5000
CH3
Figure E- 3: Using elementary stream signals
E- 6
VM5000 Automatic Video Measurement Set User Manual
Appendix E: Signal Sources Package Contents
480 and 576 Line DVDs
The 480 Line DVD (Tektronix part number 063-3795-XX) and 576 Line DVD
(Tektronix part number 063-3795-XX), both generate 60-second Matrix pattern
test signals for use with the VM5000 instrument. The DVD files are available in
the formats listed in Table E--10.
Table E- 10: Available formats of DVD files
DVD
Image format
Field rate
Program/Track
Ratio
480 Line
480i
59.94
1
16:9
2
4:3
1
16:9
2
4:3
576 Line
576i
50
To use the DVD, insert the appropriate DVD into the player, then select the
appropriate program/track for the ratio. Figure E--4 shows the typical setup for
testing DVD players.
Files on DVD
DVD
Player
Y
Pb
Pr
CH1
CH2
VM5000
CH3
Figure E- 4: Using DVD signals
NOTE. The DVD files are in interlace format. The playback device must be set to
progressive mode (480p or 576p) before sending signals to the VM5000
instrument.
VM5000 Automatic Video Measurement Set User Manual
E- 7
Appendix E: Signal Sources Package Contents
Option VGA Signal Source Disc
The Option VGA Signal Source package consists of one CD that contains Full
Field/Matrix test pattern signal source files in BMP format for all the measurements except the 10-bit Linearity measurement which are in PNG format. See
page 2--16 for more information on the Matrix test pattern.
PC Bitmap Graphics Test
Signal Files CD-ROM
E- 8
The Test Signals disc ( Tektronix part number 020--2634--XX) contains files for
generating test signals. The disc contains the following:
H
The FullFieldSignals folder that contains a set of test pattern sub-directories
to take a measurement. Select the pattern depending on the measurement
selected. Once the pattern sub-directory is opened, you can see a list of files
in BMP format. Select the file depending on the video format set. You can
open the file with Microsoft Paint and display the test pattern in full screen
mode (for a single monitor setup) or set as Wallpaper Centered (for a
dual--monitor setup).
H
The MatrixSignals folder that contains a set of test pattern sub-directories
that contain images and takes one or more measurements. Select the pattern
depending on the measurement selected. Once the pattern sub-directory is
opened, you can see a list of files in BMP format. Select the file depending
on the video format set. You can open the file with Microsoft Paint and
display the test pattern in full screen mode (for a single monitor setup) or set
as Wallpaper Centered (for a dual-monitor setup).
VM5000 Automatic Video Measurement Set User Manual
Index
Index
Numbers
picture, 2-- 22
refresh rate, 2-- 26
RTF, 3-- 25
Run, 2-- 22
Run Only, 3-- 6
Save (measurement settings), 2-- 48
Selected, 3-- 25
Setup & Run, 3-- 6, 3-- 8
Setup Only, 3-- 6, 3-- 8
Stop, 2-- 22
sync signal trigger channel select, 2-- 31
3-- wire composite sync setup, 2-- 3, 2-- 5
4-- wire with separate sync setup, 2-- 6
75 Ohm termination, CH4, 2-- 6
A
Access the Windows desktop, 2-- 22
Accessories, 1-- 23
connecting peripherals, 1-- 7
optional, 1-- 27
probes, 1-- 3–1-- 4
recommended, 1-- 27
standard, 1-- 24
Adjusting display contrast, 1-- 12
Algorithm descriptions. See Measurements, detailed
information
All Button, 2-- 52
All button, 3-- 25
Ambient temperature, A-- 1
App button, 2-- 22
Application display, default, 2-- 21
Application software version number, 3-- 26
Application view area, 2-- 22
Applications, Microsoft, 1-- 11
Auto Scale
buttons, 3-- 7, 3-- 12
options, 2-- 30
Average, 3-- 27, 3-- 39
Averages
interactions with results, 3-- 16, 3-- 20
interactions with Run Mode, 3-- 16, 3-- 20
B
Backing up user files, 1-- 9
Baseband files, Matrix test pattern, E-- 2
Buttons
All, 3-- 25
App (restore hidden application), 2-- 22
Auto Scale On/Off, 3-- 7, 3-- 12
CSV, 3-- 25
exit, 2-- 23
Generate Report, 2-- 52, 2-- 53
hide, 2-- 22
input signal format, 2-- 25
Open (load measurement settings), 2-- 50
PDF, 3-- 25
VM5000 Automatic Video Measurement Set User Manual
C
Calibration, 2-- 12
CD-- ROMs, product software, 1-- 10
Ch-- Ch Mismatch
displaying, 3-- 113
setting up, 3-- 84
Ch-- Ch Mismatch , detailed measurement information,
3-- 40
Ch-- Ch Skew
detailed measurement information, 3-- 41
displaying, 3-- 115
setting up, 3-- 85
Changing Measurement Settings, 2-- 45
Channel Delay
detailed measurement information, 3-- 28
displaying, 3-- 101
setting up, 3-- 68
Cleaning
exterior, C-- 1
flat panel display, C-- 1
Color Bars
detailed measurement information, 3-- 29, 3-- 42
displaying, 3-- 102, 3-- 116
setting up, 3-- 69, 3-- 86
Compatibility of the VM5000 option HD to the
VM5000HD, 1-- 3
compensating sync pickoff, Option SD/HD, 2-- 13
Compressed elementary stream files, E-- 5
Compressed transport stream files, E-- 4
Configuration menu, 3-- 5
Connecting input signals, 2-- 3
Connecting peripherals, 1-- 7
Connecting to a network, 1-- 11
Control Message Reporting, Log Warning to File, 2-- 33
Creating an emergency startup disk, 1-- 9
CSV, 3-- 25
Index- 1
Index
D
Default application display, 2-- 21
Description
key features, 1-- 1
product, 1-- 1
Desktop, accessing windows, 2-- 22
Display Frequency Response
measured values, 3-- 104, 3-- 118
reference values, 3-- 104, 3-- 118
relative values, 3-- 104, 3-- 118
DNL files, Matrix test pattern, E-- 2
Documentation, related, xiv
DVD files, Matrix test pattern, E-- 7
Dynamic range, maximize by autoscaling, 3-- 7, 3-- 12
E
Elementary stream files, Matrix test pattern, E-- 5
Environment requirements, 1-- 6
Exit button, 2-- 22
Exiting the application, 1-- 11
Exterior cleaning, C-- 1
F
File menu, 3-- 3
Files
.vmset, 3-- 3
Matrix test pattern signal source, E-- 1
Filter settings, 3-- 16
Firmware, upgrade, 1-- 3
Flat panel display cleaning, C-- 1
Format, Input Signal, 2-- 24
Frequency Response
detailed measurement information, 3-- 30
displaying, 3-- 104
setting up, 3-- 70
Function reference, 3-- 3
H Timing
detailed measurement information, 3-- 46
displaying, 3-- 121
setting up, 3-- 89
Help, 3-- 26
Hide button, 2-- 22
How to Run the Measurements, 2-- 44
How to Select the Measurements, 2-- 27
How to Set the Measurement Run Operations, 2-- 28
How to Start the Application, 2-- 20
How to View the Measurement Results, 2-- 44
I
Input Matrix test pattern files
for a DVD player, E-- 7
for MTX100, E-- 4
for TG700, E-- 2
for transport stream multiplexor, E-- 5
Input signal. See Matrix test pattern; Measurements,
detailed information
Input signal connection requirements, 2-- 1
Input Signal Format, 2-- 24
Input Signal Format View, 2-- 24
Input signal setups Option SD/HD
3-- wire composite sync, 2-- 3, 2-- 5
4-- wire with separate sync, 2-- 6
Input signal setups Option VGA
RGBHV measurement interface unit, 2-- 7
VGA connector to 5X cable, 2-- 9
Installation, 1-- 5
incoming inspection procedure, 1-- 13
software installation, 1-- 10
Installing system software, D-- 1
Interpreting results. See Measurements, detailed
information
Introduction, to this manual, xiii
K
H
Key features, 1-- 1
H Sync
detailed measurement information, 3-- 43
displaying, 3-- 118
setting up, 3-- 87
H Sync Jitter
detailed measurement information, 3-- 45
displaying, 3-- 119
setting up, 3-- 88
L
Index- 2
LCD display contrast, 1-- 12
Limits, 2-- 34
Line Number, 3-- 16, 3-- 20
Line Number defaults in .vmset file, 3-- 3
VM5000 Automatic Video Measurement Set User Manual
Index
Linearity
detailed measurement information, 3-- 48
displaying, 3-- 122
setting up, 3-- 90
Loading saved measurement setups, 2-- 49
Luma Levels
detailed measurement information, 3-- 49
displaying, 3-- 124
setting up, 3-- 91
Minimizing the application and main display, 2-- 22
MTX100 files, Matrix test pattern, E-- 4
Multiburst
detailed measurement information, 3-- 33
displaying, 3-- 106
setting up, 3-- 73
Multiplexor files, Matrix test pattern, E-- 5
M
Network access, 1-- 11
Noise
detailed measurement information, 3-- 34
displaying, 3-- 107
setting up, 3-- 74
Noise Inj Ratio
detailed measurement information, 3-- 50
displaying, 3-- 125
setting up, 3-- 93
NoiseSpectrum, setting up, 3-- 77
Non Linearity
detailed measurement information, 3-- 35
displaying, 3-- 109
setting up, 3-- 77
Manuals
part numbers, 1-- 24, 1-- 27
related, xiv
Matrix signal line numbers, 3-- 27, 3-- 39
Matrix test pattern
formats, E-- 1
picture, 2-- 16
Matrix test signal, matching setup file, 3-- 3
Measurement Result Display, 3-- 99
Pass/Fail Results, 3-- 132
Measurement Results Display, result summary display,
3-- 99
Measurement Settings, Changing, 2-- 45
Measurement Setups
recall, 2-- 49
save, 2-- 47
Measurement steps overview, 2-- 23
Measurements, 2-- 36
detailed information, 3-- 27, 3-- 39
how to set the measurement warnings, 2-- 33
how to set the run operations, 2-- 28
measurements to report, 2-- 52, 3-- 25
overview, 3-- 16
report formats, 3-- 25
reports, 2-- 51
saving results (reports) to a file, 2-- 51
select, 2-- 27
set, 2-- 34
Measurements Setup, 3-- 59
capture measurements to create new reference file,
3-- 64
create custom reference file, 3-- 62
customizing limit file, 3-- 66
take just measurements, 3-- 59
take measurements with limit testing, 3-- 64
take relative to reference measurements, 3-- 60
use existing reference file to create new reference
file, 3-- 63
Menu bar, 2-- 22
Menu descriptions, 3-- 3
VM5000 Automatic Video Measurement Set User Manual
N
O
On/Standby switch, 1-- 8
Online help, 3-- 26
Open (Load Measurement Settings) Button, 2-- 50
Opening, .vmset files, 3-- 3
Operating requirements, 1-- 6
Optimizing for production line testing, auto scale Off,
3-- 7
Option SS, E-- 1
Optional accessories, 1-- 27
Options, 1-- 23
All, 2-- 52
Auto Scale enabled, 2-- 30
Continuously, 2-- 29, 3-- 12
CSV Legacy, 2-- 52
CSV VM5000, 2-- 52
Last Meas., 2-- 30
Last Recalled, 2-- 30
Line Select, 2-- 31
Multi Lines, 2-- 31
Once, 2-- 29, 3-- 11
Once & Report, 2-- 29
PDF, 2-- 52
Restore Default, 2-- 30
RTF, 2-- 52
Index- 3
Index
Run Mode, 2-- 29
Run Only, 2-- 29, 3-- 11
Selected, 2-- 52
Setup & Run, 2-- 29, 3-- 11
Setup Only, 2-- 29, 3-- 11
Single Line, 2-- 31
Out of range, preventing by autoscaling, 3-- 7, 3-- 12
P
PDF, 2-- 52, 3-- 25
Performance verification
functional tests, 1-- 14
self tests, 1-- 13
Peripherals, connecting, 1-- 7
Picture, 2-- 36
Powering off, 1-- 8
Powering on, 1-- 8
Probes, supported, 1-- 3
Product
accessories. See Accessories
description, 1-- 1
models, 1-- 1
unpacking, 1-- 5
Product features, 1-- 1
Q
Quitting the application, 1-- 11
R
Rebuilding the Hard Drive, D-- 1
Recall Measurement Setups, 2-- 49
Recommended accessories, 1-- 27
Reference, 2-- 34
Reinstalling the system software, D-- 1
Related documentation, xiv
Release notes, 1-- 10
Report Mode, 2-- 32
Reports, viewing on the MS Windows desktop, 2-- 22
Restore the application when hidden, 2-- 22
Results appear as dashes, 3-- 5, 3-- 9
Results menu, 3-- 16
RTF, 2-- 52, 3-- 25
Run button, 2-- 22
Run Mode
interactions with Average setting, 3-- 16, 3-- 20
option, 2-- 29
Run Only, 3-- 11
Run Only button, 3-- 6
Index- 4
Run Only Option, 2-- 29
Running Measurements Overview, 2-- 23
S
Saving measurement setups, 2-- 47
Selected button, generating reports, 3-- 25
Selected Option, generating reports, 2-- 52
Selecting Measurement, 2-- 36
Set Measurements, 2-- 34
Setup & Run, 3-- 11
Setup & Run button, 3-- 6, 3-- 8
Setup & Run Option, 2-- 29
Setup Only, 3-- 11
Setup Only button, 3-- 6, 3-- 8
Setup Only Option, 2-- 29
Short Time Distortion
detailed measurement information, 3-- 35
displaying, 3-- 111
setting up, 3-- 79
Show the application when hidden, 2-- 22
Shutdown, 1-- 8
Signal path compensation, 1-- 14, A-- 1
Signal sources
matrix files, E-- 1
non-- matrix. See Measurements, detailed information
Site considerations, 1-- 6
Software, reinstallation, D-- 1
Software installation, 1-- 10
Software version number, 3-- 26
Space requirements, 1-- 6
Specifications, A-- 1
video measurements, A-- 19
Standard accessories, 1-- 24
Startup disk, creating, 1-- 9
Stop button, 2-- 22
Switch Accessory, options, 2-- 31
Sync
detailed measurement information, 3-- 37
displaying, 3-- 112
setting up, 3-- 80
sync pickoff, compensation, 2-- 13
Sync Polarity Mode, 2-- 32
Sync signal trigger channel buttons, 2-- 31
System diagnostics menu, 1-- 13
T
Taking a measurement, 2-- 41
Termination, 75 Ohm, CH4, 2-- 6
Test signal. See Matrix test pattern
VM5000 Automatic Video Measurement Set User Manual
Index
TG700 DNL files, Matrix test pattern, E-- 2
Timing Standard
CVT, 2-- 26
CVT-- R, 2-- 26
DMT, 2-- 26
Tming Standard, GTF, 2-- 26
Transport stream files, Matrix test pattern, E-- 4
U
Unhiding hidden application, 2-- 22
Upgrade, firmware, 1-- 3
USB devices, 1-- 7
User files, backing up, 1-- 9
User interface description, 2-- 22
Using Custom Instrument Settings, 3-- 7
Utilities menu
Generate Report, 3-- 25
Instrument Calibration, 1-- 14
Instrument Diagnostics, 1-- 13
V
V Sync
detailed measurement information, 3-- 52
VM5000 Automatic Video Measurement Set User Manual
displaying, 3-- 127
setting up, 3-- 94
V Timing
detailed measurement information, 3-- 55
displaying, 3-- 128
setting up, 3-- 95
Vectorscope, 2-- 39
Verification, incoming inspection procedure, 1-- 13
Version number, 3-- 26
Vertical scale autoscaling, 3-- 7, 3-- 12
Video specifications, A-- 19
Video Transient
detailed measurement information, 3-- 56
displaying, 3-- 130
setting up, 3-- 96
Viewing measurement results, 2-- 41
Viewing reports on the desktop, 2-- 22
VMSET files, recalling, 3-- 3
W
Warning Message Reporting, 2-- 33
Warnings, 2-- 33
Windows desktop, accessing, 2-- 22
Windows operating system, backup tool, 1-- 9
Index- 5
Read This First
VM5000
Automatic Video Measurement Set
Option VGA
071-1855-00
Read This First
This following procedure was inadvertently left out of the VM5000 printed user
manual (Tek part number 071--1522--02). Future editions of the manual will
include this procedure.
Measurement Interface Unit Performance Verification
This performance verification can be used to establish that the RGBHV
Measurement Interface Unit (MIU) meets its warranted performance specifications.
Prerequisites
H
Before running this procedure, verify that the host VM5000 passes internal
system diagnostics (VM5000 Utilities menu).
H
Running Signal Path Calibration is not required.
H
Both the host VM5000 and the MIU should have a minimum 20 minutes
warm-up time.
H
Associated test equipment should also be warmed up according to the
manufacturer’s instructions, prior to making measurements.
H
This procedure assumes measurements are conducted at an ambient
temperature between 18 _C and 28 _C.
The seven checks below are independent of one another, so if only some
specifications are of interest, then only those sections of the procedure need be
performed.
VM5000 Automatic Video Measurement Set Option VGA Read This First
1
Read This First
Required Equipment
Table 1: Equipment required for performance verification
Description
Quantity
required
Minimum requirement
Recommended
equipment
Tektronix VM5000 with
119-- 6298-- XX Mouse and
119-- 6633-- XX Keyboard
VM5000 with mouse
and keyboard
1
Tektronix VM5000, TDS5104x, or
TDS5054x oscilloscope (provides power
and mode control)
Digital Multimeter
1
At least 5 1/2 digits, with a 4-wire Ohms
Keithley model 2000
mode and DC current mode. Ohms accuracy
better than 0.02% at 75 Ω, 0.1% at 2200 Ω,
and 2% at 15 Ω. DC current accuracy better
than 0.1% at 8 mA.
Where used
All tests
Tests B, C, D, E
Spectrum Analyzer with 1
Tracking Generator
50 Ω, minimum frequency range
1-- 1800 MHz, minimum Reference Level
range 0dBm to –65 dBm, 0.3 dB Reference
Level accuracy –20 dBm to –60 dBm,
1 dB/div and 10 dB/div display modes,
response normalization mode, displayed
noise floor less than –120 dBm (100 Hz
RBW), minimum RBW range 300 kHz to
3 MHz, marker and center frequency
accuracy better than 0.02%. Tracking
generator 50 Ω, output level 0 dBm, output
flatness +2 dB or better, 1 to 1500 MHz.
Agilent Technologies model Tests F, G, H
E4403B option BTG
Return Loss Bridge
1
75 Ω test port. Minimum directivity 40dB,
1-- 300 MHz. 50 Ω RF input/output ports
(BNC female); 75 Ω test port (BNC male)
Wide Band Engineering Co. Test F
models A57TGAC or
A57TUC, with options:
75 Ohm conversion, 75 Ω
male BNC test port, 50 Ω
female BNC RF in/out ports
75/50 Min-loss pad
2
BNC Male on 75 Ω end, BNC female on
50 Ω end. Attenuation loss 5.7 dB + 0.5 dB
1-- 1500 MHz. VSWR 1.2:1 or better
1-- 1500 MHz.
JFW Industries model
75Z-- 3G-- BNC
Test G
6 dB Attenuator
2
50 Ω, through-- style with male BNC on one
end and female BNC on the other. VSWR
1.20:1 or better, 1-- 1500 MHz. Insertion loss
6.0 dB + 0.5 dB, 1-- 1500 MHz.
Tektronix part number
011-- 0069-- 03; JFW Industries 50FPG-- 006-- BNC
Tests F, G, H
50 Ω BNC Cable
2
RG-58, male BNC connectors, length 43
inches.
Tektronix part number
012-- 0057-- 01
All tests
Type N to BNC adapter
2
50 Ω, Type N male to BNC female
Tektronix part number
103-0045-00; Amphenol
31-216-RFX
Tests F, G, H
75 Ω BNC female/female adapter
1
75 Ω female BNCs each end. VSWR 1.10:1 Tyco/AMP model 222117-1
(26 dB RL) or better, 1-- 1500 MHz.
2
Test G
VM5000 Automatic Video Measurement Set Option VGA Read This First
Read This First
Table 1: Equipment required for performance verification (Cont.)
Quantity
required
Description
Minimum requirement
Recommended
equipment
Where used
50 Ω BNC female/
female adapter
1
50 Ω, female BNCs each end. VSWR
1.10:1 (26 dB RL) or better, 1-- 1500 MHz.
Tektronix part number
103-0028-00; Amphenol
31-219-RFX
Tests C, G, H
BNC T adapter
1
50 Ω, 1 male BNC, 2 female BNCs
Tektronix part number
103-0030-00; Amphenol
31-208-RFX
Tests B, C, D, E
BNC female to dual
banana adapter
2
Standard (0.750 inch) banana plug spacing
Tektronix part number
103-0090-00; Pomona
Electronics model 1269
Tests B, C, D, E
BNC Shorting cap
1
BNC male connector, center conductor
connected to shell with less than 0.1 Ω
resistance.
Amphenol models 5275 or
31-17
Test C
Table 2: Optional equipment for performance verification
Description
Reference
75 Ω load
Quantity
required
1
Precision 75 Ω 1
BNC male/male
adapter
Minimum requirement
Recommended
equipment
Where used
Minimum Return Loss 45 dB, 1-- 300 MHz, BNC
female connector.
Wide Band Engineering
Test F
Co. model A56T75B/6 with
female BNC connector
option
75 Ω, male BNCs each end. VSWR 1.01:1 (45 dB
RL) or better, 1-- 300 MHz.
Wide Band Engineering
Co. model A74VA, 75 Ω,
male BNCs each end.
VM5000 Automatic Video Measurement Set Option VGA Read This First
Test F
3
Read This First
Test A: Initial Connection and Setup
1. With the VM5000 Power off, connect all five MIU coaxial cables to the host
VM5000. Use the labels on the MIU as a guide. Connect the RS232 cable
between the MIU and COM1 port on the VM5000. Attach a keyboard and
mouse to the VM5000. Turn on the VM5000. The MIU Power ON led
should be lit and the MIU Fault LED should be off. If the Fault indicator is
lit, check that all of the coaxial cables have been properly connected.
2. Open Hyperterminal on the VM5000. If an “MIU – Hyperterminal” session
was previously established and saved, open it. If not, establish a session as
follows:
a. Minimize open programs, such as the oscilloscope application and the
VM5000 application, so that the Windows desktop is visible.
b. Open the terminal emulation program Hyperterminal. Hyperterminal is
typically located under Start>Programs>Accessories>Communications>Hyperterminal.
c. When Hyperterminal is first opened, a pop-up window Connection
Description will open. Under name, enter MIU, and then click OK.
d. A Connect To window will open. Under Connect using, select COM1,
and click OK.
e. A COM1 Properties window will open. Set the Port Settings as follows:
H
Bits per second=9600
H
Data bits=8
H
parity=None
H
Stop bits=1
H
Flow Control=None
After changing the settings, click OK.
3. The Hyperterminal window should be open, as connection MIU. Select
File>Properties. The MIU Properties window will appear. Select the Settings
tab, followed by clicking the ASCII Setup button. Select Echo typed
characters locally and Send line ends with line feeds. Click OK to close the
ASCII Setup window, and then click OK to close the MIU Properties
window.
4. From the keyboard, type $ID? The MIU should identify itself, returning a
response similar to id=miu_v1.0. If there is no response, double check all
electrical connections and the Hyperterminal settings described above.
4
VM5000 Automatic Video Measurement Set Option VGA Read This First
Read This First
NOTE. If typed keyboard characters appear in duplicate (for example.
$$IIDD??), the MIU echo is on. Turn the echo off by typing $ECHO=OFF.
5. If the terminal appears to operate properly, save the configuration by
selecting File>Save in the Hyperterminal window. For convenience, place a
shortcut on the Windows desktop, as this terminal connection will be used
throughout this Performance Verification procedure.
Test B: RGB LF Mode DC Termination Accuracy
This test verifies the accuracy of the internal 75 Ω terminations connected to the
G, B, and R inputs when the RGB LF path is active. The specification for all
three terminations is 75 Ω ¦0.3%.
The following equipment is required for the test:
H
Host VM5000 with mouse and keyboard
H
Digital Multimeter
H
50 Ω BNC cable (Qty 2)
H
BNC “T” adapter (Qty 1)
H
BNC female-to-dual banana adapter (Qty 2)
1. Connect the MIU to the VM5000, apply power, and establish communications using Hyperterminal as described in Test A of this procedure.
2. Check that the green LED in the RGB LF Path is illuminated. If not, using
Hyperterminal, send the command $LOAD=0000000 to the MIU. Verify that
the LED in the RGB LF Path is now illuminated.
NOTE. The V channel and H/V LF Path LEDs will also be illuminated.
3. On the VM5000 front panel, under VERTICAL, select 1 MΩ for CH1, CH2,
and CH3.
4. Connect the two BNC-to-banana adapters to the Multimeter: one to the
Ohms input, the other to the Ohms Sense input. Orient the adapters so the
BNC shell is connected to the LO terminal of each input (on typical
adapters, the banana plug connected to the BNC shell has a GND label).
5. Connect a BNC cable to each BNC-to-banana adapter. Connect the other end
of each cable to the BNC “T” adapter. This connects Ohms input and Ohms
Sense input in parallel, at the BNC “T” adapter.
6. On the multimeter, select 4-wire Ohms mode and 100 Ohms range.
VM5000 Automatic Video Measurement Set Option VGA Read This First
5
Test Equipment Depot - 800.517.8431 - 99 Washington Street Melrose, MA 02176 - FAX 781.665.0780 - TestEquipmentDepot.com
Read This First
7. Connect the BNC “T” adapter to the G input BNC on the MIU.
8. CHECK – that the Multimeter reads between 74.840 and 75.160 Ω.
9. Connect the BNC “T” adapter to the B input BNC on the MIU.
10. CHECK – that the Multimeter reads between 74.840 and 75.160 Ω.
11. Connect the BNC “T” adapter to the R input BNC on the MIU.
12. CHECK – that the Multimeter reads between 74.840 and 75.160 Ω.
13. Disconnect the BNC “T” adapter from the R input BNC.
Test C: RGB LF Mode and HV LF Mode DC Gain
This test checks the gain error of the G, B, and R channels when the RGB LF
Path is active, and of the H and V channels when the HV LF Path is active. The
specification for all five channels is 1.0 ¦ 0.002% (20ppm) when driven from a
0 Ω source and with a 1 MΩ load (provided by the VM5000).
The following equipment is required for the test:
H
Host VM5000, with mouse and keyboard
H
Digital Multimeter
H
BNC female-to-dual banana adapter (Qty 2)
H
50 Ω BNC cable (Qty 2)
H
50 Ω BNC female/female adapter (Qty 1)
H
BNC “T” adapter (Qty 1)
H
BNC shorting cap (Qty 1)
1. Connect the MIU to the VM5000, apply power, and establish communications using Hyperterminal as described in Test A of this procedure.
2. Connect the two BNC-to-banana adapters to the Multimeter: one to the
Ohms input, the other to the Ohms Sense input. Orient the adapters so the
BNC shell is connected to the “LO” terminal of each input (note: on typical
adapters, the banana plug connected to the BNC shell has a “GND” label).
3. Connect a BNC cable to each BNC-to-banana adapter. Connect the other end
of each cable to the BNC “T” adapter. This connects Ohms input and Ohms
Sense input in parallel, at the BNC “T” adapter.
4. On the Multimeter, select 4-wire Ohms mode and 100 Ohms range.
5. Connect the BNC “T” adapter to the G input BNC on the MIU.
6
VM5000 Automatic Video Measurement Set Option VGA Read This First
Read This First
6. Connect the BNC shorting cap to one end of the BNC female/female adapter.
Disconnect the MIU CH1 coaxial cable from the VM5000.
Note that the MIU Fault LED is now illuminated. This is normal, indicating
that the CH1 coaxial cable has been disconnected from the VM5000.
Connect the MIU CH1 coaxial cable to the open end of the BNC female/female adapter with shorting cap. To do this, the latching ring must be rotated
to the full CW position, as viewed from the pin-side of the connector.
Carefully insert the BNC adapter, noting the location of the slots for the
BNC “ears”. This connection shorts the center conductor to the shield so that
the series resistance through the MIU can be measured.
7. Check if the green LED in the RGB LF Path is illuminated. If not, using
Hyperterminal, send the command $LOAD=0000000 to the MIU. Verify that
the LED in the RGB LF Path is now illuminated.
NOTE. The V channel and H/V LF Path LEDs will also be illuminated.
8. CHECK – that the Multimeter reads less than 15.0 Ω.
NOTE. The multimeter will typically read between 10 Ω and 11 Ω. If the reading
is around 75 Ω, check that the BNC short is fully inserted into the MIU CH1
coaxial cable BNC and that the RGB LF Path LED is illuminated.
9. Remove the BNC short and reconnect the MIU CH1 coaxial cable to the
VM5000 CH1 input.
10. Connect the BNC “T” adapter to the B input BNC on the MIU.
11. Disconnect the MIU CH2 coaxial cable from the VM5000, and connect the
BNC short to the cable end, as described in step 6.
12. Check that the green LED in the RGB LF Path is still illuminated. If not,
using Hyperterminal, send the command $LOAD=0000000 to the MIU.
Verify that the LED in the RGB LF Path is now illuminated.
NOTE. The V channel and H/V LF Path LEDs will also be illuminated.
13. CHECK – that the Multimeter reads less than 15.0 Ω.
NOTE. The multimeter will typically read between 10 Ω and 11 Ω. If the reading
is around 75 Ω, check that the BNC short is fully inserted into the MIU CH2
coaxial cable BNC and that the RGB LF Path LED is illuminated.
VM5000 Automatic Video Measurement Set Option VGA Read This First
7
Read This First
14. Remove the BNC short and reconnect the MIU CH2 coaxial cable to the
VM5000 CH2 input.
15. Connect the BNC “T” adapter to the R input BNC on the MIU.
16. Disconnect the MIU CH3 coaxial cable from the VM5000 and connect the
BNC short to the cable end, just as was done for CH1 (and described in
step 6 above).
17. Check that the green LED in the RGB LF Path is still illuminated. If not,
using Hyperterminal, send the command $LOAD=0000000 to the MIU.
Verify that the LED in the RGB LF Path is now illuminated.
NOTE. The V channel and H/V LF Path LEDs will also be illuminated.
18. CHECK – that the Multimeter reads less than 15.0Ω.
NOTE. The multimeter will typically read between 10 Ω and 11 Ω. If the reading
is around 75Ω, check that the BNC short is fully inserted into the MIU CH3
coaxial cable BNC and that the RGB LF Path LED is illuminated.
19. Remove the BNC short and reconnect the MIU CH3 coaxial cable to the
VM5000 CH3 input.
20. Connect the BNC “T” adapter to the V input BNC on the MIU.
21. Disconnect the MIU CH4 coaxial cable from the VM5000 and connect the
BNC short to the cable end, just as was done for CH1 (and described in step
6 above). All of the LEDs on the MIU will be extinguished, but the MIU is
still powered for the H and V channel measurements.
22. Using Hyperterminal, send the command $LOAD=0000000 to the MIU. No
LEDs will be illuminated, but the V channel and HV LF Path are now
selected.
23. CHECK – that the Multimeter reads less than 19.0 Ω.
NOTE. The multimeter will typically read between 10 Ω and 11 Ω. If the reading
is >100 Ω, check that the BNC short is fully inserted into the MIU CH4 coaxial
cable BNC. If the >100 Ω reading persists, check that the MIU is in the proper
mode by sending the query (via Hyperterminal) $LOAD?. You should receive a
reply load=0000000.
24. Connect the BNC “T” adapter to the H input BNC on the MIU.
8
VM5000 Automatic Video Measurement Set Option VGA Read This First
Read This First
25. Using Hyperterminal, send the command $LOAD=0010000 to the MIU. No
LEDs will be illuminated, but the H channel and HV LF Path are now
selected.
26. CHECK – that the Multimeter reads less than 19.0 Ω.
NOTE. The multimeter will typically read between 10 Ω and 11 Ω. If the reading
is >100 Ω, check that the BNC short is fully inserted into the MIU CH4 coaxial
cable BNC. If the >100 Ω reading persists, check that the MIU is in the proper
mode by sending the query (via Hyperterminal) $LOAD?. You should receive a
reply load=0010000.
27. Remove the BNC short and reconnect the MIU CH4 coaxial cable to the
VM5000 CH4 input.
28. Disconnect the BNC “T” adapter from the H input BNC.
The above check evaluates gain error by measuring the MIU series resistance
that forms a voltage divider with the 1 MΩ input resistance of the VM5000. The
15.0 Ω (G,B,R inputs) and 19.0 Ω (H,V inputs) test limits ensure that the gain
error does not exceed ¦20 ppm. If desired, the exact gain error can be calculated
from the measured resistance Rm using the expressions:
G,B,R channels:
GainError(ppm) =
Ꮇ
H,V channels:
GainError(ppm) =
− (75.0)(Rm)
Ꮌ
Ꮇ(1.0E06)(75.0 − Rm) + (75.0)(Rm)Ꮌ
Ꮇ
+ (1.0E06), Rm in Ω
Ꮌ
− (Rm)
+ (1.0E06), Rm in Ω
Ꮇ(1.0E06) + (Rm)Ꮌ
VM5000 Automatic Video Measurement Set Option VGA Read This First
9
Read This First
Test D: HV Input LF Mode DC Termination Accuracy and WB Mode DC Input
Impedance
This test checks the accuracy of the 2.20 kΩ termination that can be switched on
in the HV LF Path (Term On LED) and the DC input impedance of the HV WB
Path. The specification for the LF Path termination is 2.20 kΩ ¦ 1.5%. The
specification for the WB path DC input impedance is 2.20 kΩ ¦ 3.0%.
The following equipment is required for the test:
H
Host VM5000 with mouse and keyboard
H
Digital Multimeter
H
50 Ω BNC cable (Qty 2)
H
BNC “T” adapter (Qty 1)
H
BNC female-to-dual banana adapter (Qty 2)
1. Connect the MIU to the VM5000, apply power, and establish communications using Hyperterminal as described in Test A of this procedure.
2. Using Hyperterminal, send the command $LOAD=0011000 to the MIU.
Verify that the H channel, HV LF Path, and Term On LEDs are illuminated.
The + 8mA and –8 mA LEDs must be off.
3. On the VM5000 front panel, under VERTICAL, select 1 MΩ for CH4.
4. Connect the two BNC-to-banana adapters to the multimeter: one to the
Ohms input, the other to the Ohms Sense input. Orient the adapters so the
BNC shell is connected to the “LO” terminal of each input (note: on typical
adapters, the banana plug connected to the BNC shell has a “GND” label).
5. Connect a BNC cable to each BNC-to-banana adapter. Connect the other end
of each cable to the BNC “T” adapter. This connects Ohms input and Ohms
Sense input in parallel, at the BNC “T” adapter.
6. On the multimeter, select 4-wire Ohms mode and 10 kOhms range.
7. Connect the BNC “T” adapter to the H input BNC on the MIU.
8. CHECK – that the multimeter reads between 2175 Ω and 2225 Ω.
9. Using Hyperterminal, send the command $LOAD=0110000 to the MIU.
Verify that the H channel and HV WB Path LEDs are illuminated, and that
the +8 mA, –8 mA, and Term On LEDs are off.
10
VM5000 Automatic Video Measurement Set Option VGA Read This First
Read This First
10. On the VM5000 front panel, under VERTICAL, select 50 Ω for CH4.
11. CHECK – that the Multimeter reads between 2142 Ω and 2258 Ω.
12. Disconnect the BNC “T” adapter from the H input BNC.
Test E: HV Input LF Mode Current Sources
This test checks the accuracy of the + 8mA and –8 mA current sources. The
specification is 8 mA ¦ 2.5% and –8 mA ¦ 2.5%.
The following equipment is required for the test:
H
Host VM5000 with mouse and keyboard
H
Digital Multimeter
H
50 Ω BNC cable (Qty 1)
H
BNC female-to-dual banana adapter (Qty 1)
1. Connect the MIU to the VM5000, apply power, and establish communications using Hyperterminal as described in Test A of this procedure.
2. On the VM5000 front panel, under VERTICAL, select 1 MΩ for CH4.
3. Using Hyperterminal, send the command $LOAD=0010101 to the MIU.
Verify that the H channel, HV LF Path, and +8mA LEDs are illuminated.
The Term On and -8 mA LEDs must be off.
4. Connect the BNC-to-banana adapter to the Amps input of the multimeter.
Orient the adapter so the BNC shell is connected to the “LO” terminal of the
Amps input (on typical adapters, the banana plug connected to the BNC shell
has a “GND” label).
5. Connect one end of the BNC cable to the BNC-to-banana adapter.
6. On the multimeter, select DC Amps mode and 10 mA range.
7. Connect the other end of the BNC cable to the H input BNC on the MIU.
8. CHECK – that the multimeter reads between 7.85 and 8.15 mA.
9. Using Hyperterminal, send the command $LOAD=0010011 to the MIU.
Verify that the H channel, HV LF Path, and --8mA LEDs are now illuminated. The Term On and +8 mA LEDs must be off.
10. CHECK – that the Multimeter reads between --7.85 and --8.15 mA.
11. Using Hyperterminal, send the command $RESET to the MIU.
12. Disconnect the BNC cable from the H input BNC.
VM5000 Automatic Video Measurement Set Option VGA Read This First
11
Read This First
Test F: RGB WB Mode Input Return Loss
This test checks the Input Return Loss of the 75 Ω G, B, and R inputs when the
RGB WB Path is active. The specification is >27 dB from 1 MHz to 100 MHz,
and >21 dB from 100 MHz to 250 MHz.
The following equipment is required for the test:
H
Host VM5000 with mouse and keyboard
H
Spectrum Analyzer with Tracking Generator
H
Return Loss Bridge
H
6 dB Attenuator (Qty 2)
H
50 Ω BNC cable (Qty 2)
H
Type N to BNC adapter (Qty 2)
Equipment for optional checks (steps 11 -- 14):
H
Reference 75 Ω load
H
75 Ω BNC female/female adapter
H
Precision 75 Ω BNC male-male adapter
1. Connect the MIU to the VM5000, apply power, and establish communications using Hyperterminal as described in Test A of this procedure.
2. Using Hyperterminal, send the command $LOAD=1000000 to the MIU.
Verify that the RGB WB Path LED is illuminated.
3. On the VM5000 front panel, under VERTICAL, select 50 Ω for CH1, CH2,
and CH3.
4. Connect a Type N to BNC adapter, followed by a 6 dB attenuator, to the
tracking generator output. Connect the other end of the attenuator to the
Return Loss bridge RF IN, using a 50 Ω BNC cable. Connect a second Type
N to BNC adapter and 6 dB attenuator to the spectrum analyzer input, and
connect the other end of this attenuator to the bridge RF OUT using a second
50 Ω BNC cable. Leave the bridge test port open.
12
VM5000 Automatic Video Measurement Set Option VGA Read This First
Read This First
5. Set the spectrum analyzer so that the analyzer noise floor (display with no
RF signal applied to the analyzer input) is at least 40 dB below signal level
produced by the bridge when the test port is open (0 dB RL), over the range
of 1 MHz to 250 MHz. The analyzer settings may vary with the specific
spectrum analyzer and bridge used, but the following settings should be
usable with many analyzer/bridge combinations:
H
Tracking Generator output level = 0 dBm
H
Spectrum Analyzer Reference Level = --20 dBm
H
Vertical scale = 10 dB/div (10 div display)
H
Horizontal scale (Span) = 50 MHz/div (10 div display)
H
Center Frequency = 250 MHz (10 div display)
H
Resolution BW (RBW) = 3 MHz
6. A signal display should appear approximately 0.5 divisions below the
analyzer Reference Level mark. This is the Return Loss of the bridge with
the test port open, nominally 0dB. The display will typically have some
vertical ripples across the 500 MHz span, due to amplitude flatness errors in
the tracking generator. Disconnect the BNC cable from the analyzer input,
and check that the signal display moves down at least 4 divisions (40dB). If
it doesn’t, check that all of the analyzer attenuators are set to their minimum
value, and/or decrease the RBW setting. Reconnect the BNC cable.
7. Record the signal amplitudes at the 100 MHz and 250 MHz points in
Table 3, row R1. These are the 0dB return loss reference values. They will be
approximately –24 dBm with the typical bridge. Many analyzers have
markers that readout the frequency and amplitude of the marker position
which makes this task easier and more precise. Alternately, the Reference
Level can be slightly adjusted until the signal display aligns with a convenient graticule mark (most analyzers have a fine Reference Level adjustment
mode).
8. Connect the bridge to the G input of the MIU. If the recommended bridge is
used, it will have a male BNC, allowing direct connection to the MIU BNCs.
Record the signal amplitudes at 100 MHz and 250 MHz in Table 3, row R2.
Calculate the Return Loss using the expression:
Return Loss (dB) = (0dB RL reference value (dBm)) − (MIU input value (dBm))
Record this value in Table 3, row R3.
VM5000 Automatic Video Measurement Set Option VGA Read This First
13
Read This First
NOTE. Increasing return loss means less reflected power, so the display on the
analyzer will move in the direction of increasing dB loss, toward the bottom of
the display screen.
NOTE. If a bridge with a female BNC test port is used, then some type of cable or
adapter will be required to connect the bridge to the MIU input BNCs. If the
adapter is not truly 75 Ω at the test frequencies, it will severely impact the
Return Loss measurement. See Optional steps 11 to 14 below.
Table 3: Input return loss worksheet
100 MHz
G input
B input
250 MHz
R input
G input
B input
R input
R1 - - 0 dB RL reference value (bridge test
port open) (dBm)
R2 - - MIU input value (bridge test port
connected to MIU input) (dBm)
R3 - - MIU input return loss (dB)
R3 = R1 - R2)
9. CHECK – that the Return Loss (Table 3, row R3) is greater than 27.7 dB at
100 MHz and 21.7 dB at 250 MHz.
Example
With the bridge test port open, the analyzer measures –23.4 dBm at 100 MHz
and –24.5 dBm at 250 MHz. With the bridge connected to the MIU G input, the
analyzer measures --58.0 dBm at 100 MHz and –51.3 dBm at 250 MHz. The
MIU G channel 100 MHz return loss is (--23.4) -- (--58.0) = 34.6 dB. The
250 MHz return loss is (--24.5) -- (--51.3) = 26.8 dB.
NOTE. The most exact way to measure these signal level differences is to align
the 0 dB return loss signal display (test port open) to a specific location on the
graticule, using the Reference Level control. Note the Reference Level reading.
Then connect the test port to the MIU, and adjust the Reference Level control
until the new signal display is aligned with the same point on the graticule. The
difference between the two Reference Level readings is the Return Loss. This
method avoids any linearity errors in the analyzer’s log display system.
10. Repeat steps 8 and 9 for the Blue and Red inputs.
14
VM5000 Automatic Video Measurement Set Option VGA Read This First
Read This First
Optional Checks to Verify
Return Loss Bridge
Performance
Return Loss measurements can be severely degraded by bridge calibration errors,
bridge port mismatch, and small impedance errors at the test port. The following
checks can help verify that the measurement system is working properly. These
checks require a Reference 75 Ω Load. The 75 Ω BNC female/female adapter
and the Precision 75 Ω BNC male/male adapter may also be needed.
11. Connect the bridge as described in step 4. If any adapters or cables are
normally used between the bridge test port and the MIU input BNCs,
connect them to the test port, leaving the other side open. Note the analyzer
signal level. This is the 0 dB Return Loss value.
12. Now attach the Reference 75 Ω load. It is important that this load have a
female BNC. If the load has a male BNC, then adapt it with the 75 Ω BNC
female/female adapter. Check that the analyzer signal level has decreased
from the 0 dB Return Loss value by at least 37 dB at 100 MHz and by at
least 31 dB at 250 MHz. If these Return Loss values are achieved, then the
test setup is OK.
13. If Return Loss does not exceed 37 dB at 100 MHz and 31 dB at 250 MHz,
first check the analyzer signal to noise floor. Momentarily disconnect the
coaxial cable from the analyzer input and check that the display drops at
least 10 dB. If the drop is less than 10 dB, try decreasing the analyzer RBW
setting. If the signal to noise floor is at least 10 dB, then the problem is
either with the bridge or with the adapters/cables used on the 75 Ω test port.
14. If adapters or cables are used on the bridge test port, remove them and
connect the Reference 75 Ω load directly to the test port. If the test port is a
female BNC, then use the Precision 75 Ω BNC male/male adapter between
the test port and the Reference 75 Ω load. Again check the Return Loss. If
values of at least 37 dB at 100 MHz and 31 dB at 250 MHz are now
achieved, the problem is with the adapters/cables being used on the test port.
If these values are not achieved, then the problem is likely in the bridge.
Test G: RGB WB Mode Bandwidth
This test checks the bandwidth of the G, B, and R inputs when the RGB WB
Path is active. The specification is less than 3 dB down at 1500 MHz.
The following equipment is required for the test:
H
Host VM5000 with mouse and keyboard
H
Spectrum Analyzer with Tracking Generator
H
75/50 Min-loss Pad (Qty 2)
H
6 dB Attenuator (Qty 2)
H
50 Ω BNC cable (Qty 2)
VM5000 Automatic Video Measurement Set Option VGA Read This First
15
Read This First
H
Type N to BNC adapter (Qty 2)
H
75 Ω BNC female/female adapter
H
50 Ω BNC female/female adapter
1. Connect the MIU to the VM5000, apply power, and establish communications using Hyperterminal as described in Test A of this procedure.
2. Check that the MIU RGB WB Path LED is lit. If not, using Hyperterminal,
send the command $LOAD=1000000 to the MIU. Verify that the RGB WB
Path LED is illuminated.
3. On the VM5000 front panel, under VERTICAL, select 50 Ω for CH1, CH2,
and CH3.
4. Set the tracking generator and spectrum analyzer controls as follows:
H
Tracking Generator output level = 0 dBm
H
Spectrum Analyzer Vertical scale = 1 dB/div
H
Spectrum Analyzer Reference Level = --10 dBm
H
Horizontal scale (Span) = Max Span (or 200 MHz/div if available)
H
Center Frequency = 900--1000 MHz (10 div display)
H
Resolution BW (RBW) = 3 MHz
5. Connect a Type N to BNC adapter, followed by a 6 dB attenuator, to the
tracking generator output. Connect a 50 Ω BNC cable to the other end of the
attenuator. Connect a second Type N to BNC adapter and 6 dB attenuator to
the spectrum analyzer input, and connect the other end of this attenuator to a
second 50 Ω BNC cable. Connect the two cables together with a 50 Ω BNC
female/female adapter.
6. Adjust the analyzer Reference Level control until the displayed signal is
entirely on screen over the frequency range 1 MHz to 1800 MHz.
7. Using the analyzer Display memory, store the swept display. Activate the
“active display minus stored display” mode (sometimes called “B minus
Save A”). A straight line display, with less than 0.2 dB ripple, should appear,
typically at mid-screen. This is the frequency response with the flatness
errors of the tracking generator, attenuators, spectrum analyzer, and cables
normalized out.
8. Connect two 75/50 min-loss pads together, using a 75 Ω BNC female/female
adapter. Insert this connection in place of the 50 Ω BNC female/female
adapter. Decrease the analyzer Reference Level by 11 dB, so that the
frequency response of the series connected min-loss pads can be observed.
Measure the response at 1500 MHz, relative to 1 MHz, and record this value
16
VM5000 Automatic Video Measurement Set Option VGA Read This First
Read This First
in Table 4, column C1. Divide this value by 2 and enter it in column C2. The
value in column C2 is the average 1500 MHz response for the two pads.
NOTE. The display will typically have some amplitude ripple. Estimate the
midpoint of the ripple and use this as the measurement point. Typical 1500 MHz
loss for a series-connected pair of good-quality matching pads will be less than
1 dB.
Table 4: RGB WB mode bandwidth worksheet
C1 – series connected min-loss
pad (“A”+”B”)
1500 MHz response (dB)
C2 – Average
1500 MHz response of
single min-loss
pad (dB)
C3 – MIU
1500 MHz response with
min-loss pad
“A” (dB)
C4 – MIU 1500
MHz response
with min-loss
pad “B” (dB)
C5 – Average
MIU 1500 MHz
response (dB)
C6 – Corrected
MIU 1500 MHz
response
C5=(C3+C4)/2
C6=C5-C2
G CH
B CH
R CH
Equations
C2=(C1)/2
9. Disconnect the 50 Ω cables from the series-connected min-loss pads.
Separate the two min-loss pads. Connect one of the min-loss pads (male end)
to the MIU G input BNC. Connect the other (female) end of the pad to the
cable coming from the 6 dB attenuator and tracking generator output. Attach
a 50 Ω BNC female/female adapter to the open end of the cable going to the
6 dB attenuator on the analyzer input. Disconnect the MIU CH1 cable from
the VM5000. Attach this cable to open end of the BNC female/female
adapter. To do this, the latching ring must be rotated to the full clockwise
position, as viewed from the pin-side of the probe housing. Then carefully
insert the BNC adapter, noting the location of the slots for the BNC “ears”.
NOTE. Take care not to short the probe housing pins to the BNC adapter shell
while inserting it. Momentarily shorted pins will not damage the MIU but can
cause it to change operating mode.
10. Decrease the analyzer Reference Level an additional 13dB from the level of
step 8. (a total of 24 dB from the Reference Level of step 6). The frequency
response of the MIU G channel should be visible.
VM5000 Automatic Video Measurement Set Option VGA Read This First
17
Read This First
NOTE. Take care in identifying the correct signal trace. On many analyzers two
traces, the H channel frequency response with and without normalization, will
be visible. The proper signal trace is the one that is closest to the the position of
the normalized display of step 6.
11. Measure the loss difference between low frequency (far left side of trace) and
that at 1500 MHz. The measurement method will vary with analyzer model.
Many analyzers have amplitude cursor modes to simplify this type of
measurement. Usually the most accurate way to make this measurement (and
the method to use for an analyzer without amplitude cursor modes) is to vary
the analyzer Reference Level:
a. Using the fine Reference Level adjust, position the left side of the signal
trace to a convenient reference line (such as a graticule line or marker).
b. Note the Reference Level reading and then adjust the Reference Level
control until the signal trace at 1500 MHz aligns with the same reference
line. The difference between the two Reference Level settings is the
1500 MHz response relative to the low frequency response.
c. Record this value in Table 4, column C3.
Example: The left side of trace (low frequency end) is vertically
positioned, using the fine Reference Level control, so that it overlays the
center graticule line. The Reference Level reads –34.0 dBm. Then the
Reference Level control is decreased until the 1500 MHz portion of the
trace overlays the same graticule line. The Reference Level now reads
–35.5 dBm. The response at 1500 MHz, relative to low frequency, is
(--35.5) -- (--34.0) = --1.5 dB.
12. Replace the min-loss pad connected to the G input with the other min-loss
pad. With this pad in the signal path, measure the uncorrected G channel
1500 MHz response using the procedure of step 11. Record this value in
Table 4, column C4.
13. Add the values of column C3 and C4. Divide this value by 2 and enter it in
column C5. This is the average uncorrected G channel 1500 MHz response.
Now subtract the average min-loss pad 1500 MHz response (column C2)
from the average uncorrected G channel 1500 MHz response (column C5)
and enter the result in column C6. This is the G channel response at
1500 MHz.
14. CHECK – that the G channel response at 1500 MHz is less than 3.0 dB
down.
15. Disconnect the MIU CH1 coaxial cable from the BNC female/female
adapter, and reconnect it the VM5000 CH1 input. Disconnect the MIU CH2
cable from the VM5000. Attach this cable to open end of the BNC female/
female adapter. Move the min-loss pad and cable currently connected to the
18
VM5000 Automatic Video Measurement Set Option VGA Read This First
Read This First
MIU G input BNC to the B input BNC. The frequency response of the MIU
B channel should be visible.
16. Repeat steps 11–13 for the B channel.
17. CHECK – that the B channel response at 1500 MHz is less than 3.0 dB
down.
18. Disconnect the MIU CH2 coaxial cable from the BNC female/female
adapter, and reconnect it the VM5000 CH2 input. Now disconnect the MIU
CH3 cable from the VM5000. Attach this cable to open end of the BNC
female/female adapter. Move the min-loss pad and cable currently connected
to the MIU B input BNC to the R input BNC. The frequency response of the
MIU R channel should be visible.
19. Repeat steps 11–13 for the R channel.
20. CHECK – that the R channel response at 1500 MHz is less than 3.0 dB
down.
21. Disconnect the MIU CH3 coaxial cable from the BNC female/female
adapter, and reconnect it the VM5000 CH3 input.
Example Table 4
Calculations
The series connected min-loss pads measure –0.6 dB at 1500 MHz. The MIU G
channel measures –1.6 dB at 1500 MHz with one min-loss pad, and –1.4 dB at
1500 MHz with the second min-loss pad. The corrected G channel 1500 MHz
response is calculated to be –1.2 dB (column C6). See Table 5.
Table 5: Sample Table 4 worksheet
G CH
C1 – series connected min-loss
pad (“A”+”B”)
1500 MHz response (dB)
C2 – Average
1500 MHz response of
single min-loss
pad (dB)
C3 – MIU
1500 MHz response with
min-loss pad
“A” (dB)
C4 – MIU
1500 MHz response with
min-loss pad
“B” (dB)
C5 – Average
MIU 1500 MHz
response (dB)
C6 – Corrected
MIU 1500 MHz
response
- 0.6dB
- 0.3dB
- 1.6dB
- 1.4dB
- 1.5dB
- 1.2dB
C5=(C3+C4)/2
C6=C5-- C2
B CH
R CH
Equations
C2=(C1)/2
Test H: H/V Inputs WB Mode Bandwidth
This test checks the bandwidth of the H and V inputs when the HV WB Path is
active. The specification is less than 3dB down at 320 MHz.
VM5000 Automatic Video Measurement Set Option VGA Read This First
19
Read This First
The following equipment is required for the test:
H
Host VM5000 with mouse and keyboard
H
Spectrum Analyzer with Tracking Generator
H
50 Ω 6 dB Attenuator (Qty 2)
H
50 Ω BNC cable (Qty 2)
H
Type N to BNC adapter (Qty 2)
H
50 Ω BNC female/female adapter
1. Connect the MIU to the VM5000, apply power, and establish communications using Hyperterminal as described in Test A of this procedure.
2. Using Hyperterminal, send the command $LOAD=0110000 to the MIU.
Verify that the H input and HV WB Path LEDs are illuminated.
3. Set the tracking generator and spectrum analyzer controls as follows:
H
Tracking Generator output level = 0 dBm
H
Spectrum Analyzer Vertical scale = 1 dB/div
H
Spectrum Analyzer Reference Level = --6 dBm
H
Horizontal scale (Span) = 50 MHz/div
H
Center Frequency = 250 MHz (10 div display)
H
Resolution BW (RBW) = 3 MHz
4. Connect a Type N to BNC adapter, followed by a 6 dB attenuator, to the
tracking generator output. Connect a 50 Ω BNC cable to the other end of the
attenuator. Connect a second Type N to BNC adapter and 6 dB attenuator to
the spectrum analyzer input, and connect the other end of this attenuator to a
second 50 Ω BNC cable. Connect the two cables together with a 50 Ω BNC
female/female adapter.
5. Adjust the analyzer Reference Level control until the displayed signal is
entirely on screen over the frequency range 1 MHz to 500 MHz.
6. Using the analyzer Display memory, store the swept display. Activate the
“active display minus stored display” mode (sometimes called “B minus
Save A”). A straight line display, with less than 0.2 dB ripple, should appear,
typically at mid-screen. This is the frequency response with the flatness
errors of the tracking generator, attenuators, spectrum analyzer, and cables
normalized out.
7. Disconnect the two 50 Ω cables at the BNC female/female adapter. Keep the
female/female adapter connected to the cable going to the analyzer input.
20
VM5000 Automatic Video Measurement Set Option VGA Read This First
Read This First
8. Disconnect the MIU CH4 coaxial cable from the VM5000. All of the MIU
LEDs, including Power, will extinguish, but the MIU is still receiving power
to conduct this test. Connect the MIU CH4 coaxial cable to the cable coming
from the analyzer input, using the BNC female/female adapter. To do this,
the latching ring must be rotated to the full clockwise position, as viewed
from the pin-side of the probe housing. Then carefully insert the BNC
adapter, noting the location of the slots for the BNC “ears”.
NOTE. Take care not to short the probe housing pins to the BNC adapter shell
while inserting it. Momentarily shorted pins will not damage the MIU, but can
cause it to change operating mode.
9. Connect the cable coming from the tracking generator and 6 dB attenuator to
the MIU H input BNC.
10. Using Hyperterminal, send the query $LOAD? to the MIU. Verify that you
receive the response: load=0110000. This checks that the MIU operating
mode did not change as a result of disconnecting the CH4 coaxial cable.
NOTE. If the string is not correct, send the command $LOAD=0110000 to the
MIU.
11. Decrease the analyzer Reference Level by 34dB from the Reference Level
selected in step 5. For example, if the Reference Level is –6 dBm, then
decrease it to –40 dBm. The frequency response of the H channel should be
visible in approximately the same position as was the normalized display of
step 6.
NOTE. Take care in identifying the correct signal trace. On many analyzers two
traces, the H channel frequency response with and without normalization, will
be visible. The proper signal trace is the one that is closest to the position of the
normalized display of step 6.
12. Measure the loss difference between low frequency (far left side of trace) and
that at 320 MHz. The measurement method will vary with analyzer model.
Many analyzers have amplitude cursor modes to simplify this type of
measurement. Usually the most accurate way to make this measurement (and
the method to use for an analyzer without amplitude cursor modes) is to vary
the analyzer Reference Level:
a. Using the fine Reference Level adjust, position the left side of the signal
trace to a convenient reference line (such as a graticule line or marker).
Note the Reference Level reading.
VM5000 Automatic Video Measurement Set Option VGA Read This First
21
Read This First
b. Adjust the Reference Level control until the signal trace at 320 MHz
aligns with the same reference line. The difference between the two
Reference Level settings is the 320 MHz response relative to the low
frequency response.
The left side of trace (low frequency end) is vertically positioned, using
the fine Reference Level control, so it overlays the center graticule line.
The Reference Level reads (–40.25 dBm). Then the Reference Level
control is decreased until the 320 MHz portion of the trace (1.2 div right
from 250 MHz center screen value) overlays the same graticule line. The
Reference Level now reads (–41.75 dBm). The response at 320 MHz,
relative to low frequency, is (--41.75)--(--40.25)=(--1.5dB).
13. CHECK – that the H channel response at 320 MHz is less than 3.0 dB down.
14. Using Hyperterminal, send the command $LOAD=0100000 to the MIU.
This selects the V channel and the HV WB path. No LEDs will be lit on the
MIU.
15. Move the cable connected to the H input BNC to the V input BNC. The V
channel frequency response should appear on the analyzer. Its position and
appearance should be similar to the H channel response observed above. If
not, verify that the MIU is in the proper mode by sending the query
$LOAD?. You should receive the reply load=0100000. If the string is not
correct, send the command $LOAD=0100000 .
16. Repeat the procedure of step 12 above to measure the V channel 320 MHz
response.
17. CHECK – that the V channel response at 320 MHz is less than 3.0 dB down.
18. Remove the cable from the V input. Disconnect the MIU CH4 coaxial cable
from the BNC female/female adapter. Reconnect the MIU CH4 coaxial cable
to the VM5000 CH4 input.
This completes the 012-1685-xx RGBHV Measurement Interface Unit (MIU)
Performance Verification.
22
VM5000 Automatic Video Measurement Set Option VGA Read This First
Test Equipment Depot - 800.517.8431 - 99 Washington Street Melrose, MA 02176 - FAX 781.665.0780 - TestEquipmentDepot.com