1
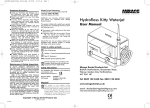
Alpha-1000 SPECTROPHOTOMETER USER’S MANUAL V 1.0 Revision 0 Laxco, Inc. http://www.laxcoinc.com 2 Table of Contents Introduction ............................................................................................................... 4 Working Principle ...................................................................................................... 4 Specifications ............................................................................................................ 5 Unpacking Instructions.............................................................................................. 6 Installation ................................................................................................................. 6 Operation Panel ........................................................................................................ 6 Changing Sample Holders ........................................................................................ 8 Basic Operation ........................................................................................................ 9 Absorbance and Transmittance Measurement ................................................ 9 Making Measurements at Different Wavelengths .......................................... 10 Lamp Changing....................................................................................................... 11 Lamp Adjustment .................................................................................................... 12 Absorbance Accuracy and Stray Light Checking .......................................................... 13 Sample Experiments ...................................................................................................... 13 Experiment 1 A Brief Introduction to Beer’s Law ...................................................... 13 Experiment 2 Measurement of an Absorption Spectrum ............................................. 15 Experiment 3 Study of Beer’s Law .............................................................................. 15 Experiment 4 Determination of the Concentration of a Solution ................................ 16 Experiment 5 Determination of a Species in a Solid Sample ...................................... 18 Parts List ................................................................................................................. 20 Troubleshooting ...................................................................................................... 21 3 Introduction The Alpha-1000 is a single beam spectrophotometer, which is designed to meet the needs of both students and instructors. Its digital display, easy operation, and wavelength range of 400 nm to 1000 nm makes this unit ideal for spectrophotometric experiments in the visible wavelength region of the electromagnetic spectrum. Working Principle The spectrophotometer consists of five parts: 1) Light Source (Halogen lamp) to supply the light 2) A Monochromator to isolate the wavelength of interest and eliminate the unwanted second order radiation 3) A Sample Compartment to accommodate the sample solution 4) A Detector to receive and convert the transmitted light to an electrical signal 5) A Digital Display to show absorbency and transmittance Figure-1, illustrates the relationship between these parts. 100%T 0A Light Source Monochromator Figure-1 Sample Compartment Detector Digital Display Block Diagram for the Spectrophotometer In the spectrophotometer, light from the Halogen Lamp is focused on the entrance slit of the Monochromator where the collimating mirror directs the beam onto the grating. The grating disperses the light beam to produce the spectrum, a portion of which is focused on the exit slit of the Monochromator by a collimating mirror. From here, the beam is passed to a Sample Compartment through one of the filters, which helps to eliminate unwanted second order radiation from the diffraction grating. Upon leaving the Sample Compartment, the beam is passed to the silicon photodiode Detector and causes the Detector to produce an electrical signal that is shown on the Digital Display window. 4 Specifications Table-1 lists the specification for the Alpha-1000. Table-1 Wavelength Range Spectral Slit Width Wavelength Accuracy Wavelength Readability Stray Radiant Energy Photometric Range Photometric Accuracy Data Output * Power Requirements Dimensions Net Weights 400~1000 nm 15 nm ± 3 nm 1 nm ≤ 2%T at 400 nm 0%T to 125%T, -0.3A to 2.0A, Better than ± 2.0%T USB & RS232 85-240 VAC, 50/60 Hz. 455 (L) x 340 (W) x 165(H) mm 7 kg * The USB port can be used for connecting to a Windows based computer which is running the Application Software. The RS232 port can be used for upgrading the firmware. Unpacking Instructions Carefully unpack the contents and check the materials against the following packing list to ensure that you have received everything in good condition: Packing List Description Quantity Spectrophotometer ............................................................................................................ Power Cord....................................................................................................................... Cuvette (round) ..............................................................................................Box of 12 Square Cuvette Adapter .................................................................................................... Dust Cover......................................................................................................................... Allen Wrench..................................................................................................................... User Manual....................................................................................................................... 1 1 1 1 1 1 1 Installation 1. Place the instrument in a suitable location away from direct sunlight. In order to have the best performance from your instrument, keep it as far as possible from any strong magnetic or electrical fields or any electrical device that may generate highfrequency fields. Set the unit up in an area that is free of dust, corrosive gases and strong vibrations. 2. Remove any obstructions or materials that could hinder the flow of air under and around the instrument. 3. Turn on the instrument and allow it to warm up for 15 minutes before taking any readings. Operation Panel The key operating components of the Alpha-1000 spectrophotometers are shown in Figure-2 & Figure-3. The power switch is located on the back of the instrument. Power Switch: Turns the instrument on and off. 0A/100%T Knob: Adjust Digital Display reading to 100%T and 0.000A when blank reference solution is in Sample Compartment. Sample Compartment: Accept 10 mm test tube or 10 mm square cuvette (the square cuvette adapter is required). Wavelength Control Knob: Select desired wavelength in nanometers (nm). Wavelength Readout Window: Displays desired wavelength. USB port: It is used for connecting to Computer with Application Software RS232: It is used for Firmware upgrading. Digital Display Sample Compartment Operation Instructions . Wavelength Control Knob 0A/100%T Knob Wavelength Readout Window Figure-2 Alpha-1000 Spectrophotometer 7 Power Switch Power Socket Air Vent Cooling Fan Figure-3 USB Port RS-232 Back view of Alpha-1000 Changing Sample Holders Your Alpha-1000 comes standard with the A-110-102 Sample Holder. We offer three additional holders as optional accessories. Please refer to Table-3 “Alpha-1 Series Parts List” in Alpha-1 Series Parts List of this manual for details. Follow the steps below to change the Cuvette Sample Holder: Open the lid of the Sample Holder, and locate the Sample Holder Locking Screw as shown in Figure-4 Use Allen Wrench (A-110-521,Figure-5) to loosen the Screw counterclockwise Remove the Sample Holder you want to change, insert the one you want to install, align it properly, and fasten the Screw 8 Lock Screw Figure-4 Changing Sample Holders Figure-5 Allen Wrench Basic Operation Simple OPERATION INSTRUCTIONS are printed on the front panel of your Alpha1000. Absorbance and Transmittance Measurement Making a measurement of absorbance and transmittance is a two-step process. In the first step, a test tube filled with a transparent solution is placed into the sample compartment. This solution will typically be distilled water, but can be the aqueous (in water) medium that you are using for your experiment. The transmittance of this solution is made to read 100%T (0A). This process is called blanking. Blanking must be done each time a new wavelength is selected. Note: When using square cuvettes, use the cuvette adapter provided to cradle the cuvette for insertion into the spectrophotometer. The second step is to remove your blanking solution and replace it with the sample solution. The absorbance and transmittance can be read from the digital display. 9 The step-by-step procedure for making an absorption/transmittance measurement is as follows: 1. Turn on the spectrophotometer by pressing the power switch (the power switch is located on the right side of the back of the instrument.) In order to stabilize the lamp and detector; allow the instrument to warm up for at least 15 minutes. 2. Turn the wavelength control knob to the desired wavelength. 3. Fill a test tube full with blanking solution and with a tissue, wipe off any residue and fingerprints on the outside of the test tube. If the test tube has no guide mark, some may wish to use a permanent marker to draw an approximate ¼ inch vertical line at the lip of the test tube or cuvette (this ensures that you minimize the bearing of any differences in reflection due to small changes in the thickness in the wall of the test tube). Place a test tube into the sample compartment with the test tube guide mark aligned with the mark at the top of the compartment (this mark is located at the front of the sample compartment). Be sure that the test tube has been firmly pressed into the sample compartment and the lid of the sample compartment has been closed. 4. Adjust the display to 100%T and 0.00A by turning the 100%T/ 0A knob. 5. Remove the test tube from the sample compartment and empty the blank solution. 6. Rinse the test tube twice with small volumes of the sample solution to be measured, then fill the test tube 2/3 full with the sample solution and wipe it clean. 7. Place the test tube in the sample compartment, aligning the guide marks (if any). 8. Close the lid of the sample compartment. (Sample site can also be covered) 9. Read the %T and absorbance from the digital display. 10. Remove the test tube from the sample compartment, empty it and repeat Step 7 to 10 for any additional samples. Making Measurements at Different Wavelengths Repeat Step 2 to Step 10 above and remember to blank your spectrophotometer whenever a measurement is being made at different wavelengths. In addition, when operating at a fixed wavelength for an extended period of time, check to make sure that the transmittance reads 100%T when the 10 blanking solution is placed into the sample compartment. If not, repeat the blanking process again. Lamp Changing 1. Remove any cuvettes from the sample compartment. 2. Unplug your spectrophotometer and turn it upside down. Locate the screw that holds the lamp housing in place (refer to the diagram shown below). 3. Remove the screw and retain. BE CAREFUL, THE BULB MAY BE HOT. 4. Remove the old bulb and place the leads of the new bulb into the holes in the lamp socket. Secure the bulb with the metal bracket. Use replacement bulbs with an Item Number of A-110-505. 5. Replace the lamp-housing panel. Secure the screw. Bottom View Lamp house Screw Spill release stopper Figure-6 Bottom View of the Alpha-1000 11 Caution Bulb can be VERY HOT Figure-7 Bulb View of the Alpha-1000 Lamp Adjustment The position of your lamp has been factory adjusted to its optimal setting. Follow these steps below for adjusting the lamp position. These steps should NOT be needed! Unfortunately, one should COMPLETELY close the light chamber between adjustment settings attempts. The bulb is driven by high voltage. Plus, the light output is blinding and will cause eye damage if directly viewed with the unprotected eye. 1. Loosen the screw on the lamp panel to reveal the light bulb within the lamp housing. 2. Make certain that the light bulb is fully inserted into its holder. The bulb socket has been permanently mounted in the optimal position by the factory. So the rest of steps should not be needed! 3. The lamp socket is mounted on an “L”-shaped bracket. This bracket is held in place by 2 screws. Slightly loosen the 2 screws such that you may move the bracket a little. You should then re-tighten the screws, completely. Close the lamp chamber and then power up. Set your spectrophotometer to %T. Continue to adjust the bracket position so that you reach the optimum transmittance reading. Tip: Don’t loosen the screws too much as you adjust the bracket. Very small movements are desired. Small movements are required to help lessen the chance of missing the optimum positioning. 12 4. Once the optimum position has been obtained, verify that the lamp chamber door is secure and all items are returned to their original state except the lamp bracket position. Absorbance Accuracy and Stray Light Checking Specification: ± 2% at 1A (100DPlus), ± 1% at 1A and 2A. The absorbance accuracy and Stray Light should be checked against a set of neutral density filters accurately calibrated to the NIST standards. Contact Customer Service for more information. Sample Experiments Experiment 1 A Brief Introduction to Beer’s Law A spectrophotometer is primarily used to identify unknown substances and to determine their concentrations. The following principles outline how this is accomplished. Matter absorbs energy when it interacts with an energy source such as sound or light. Due to its distinctive atomic structure, each substance only absorbs energy at specific frequencies. Since energy is proportional to frequency, E=hc/λ (where h=6.6262 x 10⁻³⁴ Joules = Plank’s constant, c=2.998 x 10 8 m/s = the speed of light in a vacuum (often rounded to 3.00 x 10 8 m/s), and λ=wavelength of light). Every substance has a characteristic absorbance of the light spectrum (which means that there are wavelengths where the atoms of a substance become highly excited). For example, hydrogen (H2) absorbs light at the following wavelengths in the visible region: 410.7 nm, 433.8 nm, 485.7 nm, and 657.9 nm. We can verify the existence of hydrogen (H2) in an unknown sample by comparing the wavelengths absorbed by the unknown sample to the wavelengths at which hydrogen absorption is known. A spectrophotometer is required to measure absorption spectrums in order to identify an unknown substance. The spectrophotometer is used to measure the amount of light absorbed at distinct wavelengths. This can be plotted and the graph can be used to identify the presence of a particular substance. A spectrophotometer can also be used to determine the concentration of an unknown sample. When a light beam is incident to a sample, part is absorbed, and part is transmitted. The transmittance (T) is defined as the ratio of the transmitted intensity of the light beam (X) to the initial intensity of the light beam (Y), or: T=X/Y. 13 The transmittance varies from 0 to 100. A transmittance of 0%T represents complete absorption by the sample, whereas 100%T represents no absorption by the sample. The absorbance (A) is defined as: A= log (1/T). When the transmittance is 100% (T=1), A=log (1) = 0 and increases as the transmittance decreases. The maximum value of the absorbance read by the Alpha-1000 is 2.0. This represents a Transmittance of: T=1/102.0 or about 1%. This is a very small transmittance and is essentially zero. It is found that absorbance is directly proportional to concentration so that: A=EBC Where: A=The absorbance C=The concentration in moles/liter, and B=The width of the sample cell or cuvette in cm E=A proportionality constant called the molar absorptivity (measured in liters/molecm) The linear relationship between absorbance and concentration and sample cell width is called Beer’s Law. If we have a standard sample with a known absorbance and concentration and a measured absorbance, it is easy to determine an unknown concentration of the sample substance via linear interpolation. (See Figure-8) Absorbance Figure-8 Concentration Absorbance vs. Concentration 14 Experiment 2 Measurement of an Absorption Spectrum The absorption spectrum of a substance helps identify it. In this experiment, you will measure the absorbencies of Cr3+ (chromium III ions) at a series of wavelengths in the visible light region and draw its absorption spectrum. The materials required for this experiment are 20 ml 0.5M Cr3+ (aq) solution and two round cuvettes. Procedure: 1. Place the wavelength dial at a position of 400 nm and adjust the second order filter lever position. 2. Fill one cuvette with de-ionized water and insert it into the sample compartment. Blank the instrument according to the procedure in Basic Operation. Then, remove the cuvette. 3. Fill another cuvette (or the same cuvette rinsed thoroughly with the stock solution) with the Cr+3 stock solution and inset it into the sample compartment. Record the absorbance of the solution at this wavelength and then remove the cuvette. Repeat Step 1 through Step 3 for wavelengths from 400 to 650 nm at 20 nm intervals. Make sure that the meter/display 0%T and 100%T readings are adjusted at each new wavelength. Calculations: 1. Study the data and identify the points where the peaks are likely to be found. Make measurements at smaller intervals (e.g. 5 nm) around these points to locate the peaks more accurately. 2. On regular graph paper, label the horizontal axis wavelength, and mark it from 400 to 650 nm in 20 nm intervals. Label the vertical axis absorbance and mark it in equal intervals from zero to a convenient round value above your highest absorbance. 3. Plot the absorbance for wavelength measured. Draw a smooth curve through the data points. Experiment 3 Study of Beer’s Law Beer’s Law is the basis for the determination of the concentration of an unknown solution. It states that there is a linear relationship between the absorbance and the concentration of the absorbing substance. In order to verify Beer’s law, we can measure the absorbance for different concentrations of a substance at the same wavelength, plot them on a piece of graph paper and see if the data points lie along a straight line. Actually, the points probably will not form an ideal straight line, due to the uncertainty in the measurements. 15 The materials required for this experiment are 500 ml 0.04 g/l thymol blue solution, 40 ml 1 M HCL (aqueous), a 50 ml burette, a 10 ml graduated cylinder, a 100 ml volumetric flask, five round cuvettes, and four Erlenmeyer flasks. Procedure: 1. Fill the burette to the top calibration line (50 ml) with the thymol blue stock solution. 2. Deliver 5 ml of the thymol blue solution from the burette into the volumetric flask. Measure 10 ml HCL (aq) in a graduated cylinder and add to the flask. Dilute the flask to the mark with de-ionized water, cap the flask, and mix the diluted solution thoroughly. Transfer this first standard to an Erlenmeyer flask, calculate its concentration, and label the flask. 3. Rinse the volumetric flask with de-ionized water and repeat step 2 for 15 ml, 20 ml, and 30 ml of HCL. These are standards 2, 3, and 4. 4. Place the wavelength at 545 nm and the second order filter in the white position. Fill a cuvette with de-ionized water and insert it into the sample compartment. Blank the instrument according to the procedure in Basic Operation. 5. Fill another cuvette with the first standard and insert it into the sample compartment. Measure the absorbance of the first standard at this wavelength. 6. Repeat step 5 for the other three standards. Calculations: 1. On a sheet of graph paper, label the horizontal axis concentration and mark it in equal intervals from 0 to 0.02 M. Label the vertical axis absorbance and mark it in equal intervals from 0 to a convenient round value above your highest data point. 2. Plot absorbency versus concentration for the four standard solutions. 3. Using a transparent ruler, draw a straight line from the origin such that there are equal numbers of points above and below the line. This is the Beer’s law plot. Experiment 4 Determination of the Concentration of a Solution You will prepare a Beer’s Law plot from a series of molybdenum blue standards and determine the amount of glucose in a soft drink. The glucose is able to reduce Cu2+ to Cu+ under the reaction conditions. The Cu+ is then used to reduce phosphomolybdic acid (dodeca molybdophosphoric acid) (PMA) to molybdenum blue, which absorbs light at a wavelength of 780 nm. The amount of molybdenum blue formed is directly proportional to the amount of glucose originally present in the solution. The materials required for this experiment are 50 ml 2 g/l glucose stock solution, 12 ml alkaline copper titrate solution, 12 ml phosphomolybdic acid (PMA) solution, 10 ml unknown soft drink sample, two 600 ml beakers, a 50 ml burette, six Erlenmeyer 16 flasks, a 2 ml pipette, a 10 ml pipette, six 25 ml test tubes, six round or square cuvettes, and a hot plate. Procedure: 1. Fill the burette to the top calibration line (50 ml) with the glucose stock solution. Deliver 5 ml of the glucose solution from the burette into the volumetric flask. Dilute the flask to the mark with de-ionized water, cape the flask, and mix the diluted solution thoroughly. Transfer this first standard to an Erlenmeyer flask, calculate its concentration, and label the flask. Rinse the volumetric flask with de-ionized water and repeat step 2 for standards 2, 3, and 4 using 10 ml, 15 ml, and 20 ml of the stock solution. 4. Pour 10 ml of the soft drink into the 100 ml volumetric flask, swirl it until bubbling stops, and dilute to the mark. Transfer this solution to an Erlenmeyer flask. Rinse the volumetric flask, pipette 10 ml of the diluted soft drink solution into it, dilute and mix. Transfer this solution to another Erlenmeyer flask. Rinse the pipette and volumetric flask. Pipette 10 ml of the second dilution into the volumetric flask, dilute and mix. This final unknown solution is the 1:1000 dilution of the original soft drink. 5. Label six test tubes. Fill them with 25 ml of water using a pipette, mark the solution level, and empty them. Pipette 2 ml of water, the unknown and the four standards into the tubes, respectively. Rinse the pipette after each use. 6. Using a graduated cylinder, add 2 ml of the alkaline copper titrate solution to each test tube and stir by swirling the tubes. Rinse the graduated cylinder well. 7. Fill half of a 600 ml beaker with water and place it on a hot plate to boil. Prepare an ice-water bath in a second 600 ml beaker. 8. Immerse the six tubes into the boiling water for exactly six minutes to oxidize the glucose. Remove the tubes from the boiling water and immerse them in the ice water bath for exactly 3 minutes to allow them to cool. 9. Using a graduated cylinder, add 2 ml to the phosphomolybdic acid solution to each tube and stir by swirling them. Allow the solution two minutes to react, and then dilute them to the 25 ml mark with de-ionized water. 10. Place rubber stopper in each tube and mix by inverting the tubes several times. 11. Set the wavelength to 780 nm and put the second order filter lever in the red position. Fill a cuvette with a blank solution and insert it into the sample compartment. Blank the instrument according to the procedure in Basic Operation. 12. Fill another cuvette with the first standard and measure its absorbance on the spectrophotometer. Repeat Step 12 for the other three standards and the unknown solution. Calculation: 1. On a piece of regular graph paper, label the horizontal axis concentration and mark it in equal intervals from 0 to the value of standard 4. Label the vertical 17 axis absorbance and mark it in equal intervals from 0 to a convenient round value above your highest data point. 2. Plot absorbance versus concentration for the four standards. Draw the best straight line through the origin and the four points. 3. Using the working graph determine the concentration of the unknown solution. 4. Multiply the concentration of the unknown by 1000 to get the concentration of glucose in the original soft drink. Experiment 5 Determination of a Species in a Solid Sample In order to determine the amount of a species in a solid sample, it is necessary to make an extraction solution containing that species with a proper solvent and then measure the concentration of the species in the solution using the same method described in the last experiment. As an example, you will determine the amount of iron in a vitamin tablet. Iron II forms a colored complex with 1, 10 phenanthroline, which absorbs light energy at 508 nm. A working curve will be prepared for standard solutions of Iron IIphenanthroline complex, and the concentration of an unknown sample will be determined from the working curve data. The materials required for this experiment are a vitamin tablet, 50 ml 0.1M HCL (aq) solution, 50 ml 0.1g/l Fe+2 (aq) solution, 10 ml 1% (w/v) HONH3 CL (aq) (hydroxylamine hydrochloride solution, 10 ml 1M NaC2H3O2 (aq) sodium acetate) solution, 10 ml 1% (w/v) 1,10- phenanthroline (ortho) solution, a 100 ml beaker, a 50 ml burette, five Erlenmeyer flasks, a 50 ml graduated cylinder, a 10 ml pipette, six round cuvettes, a hot plate, a stirring rod, a gravity funnel, and some filter paper. Procedure: 1. 2. 3. 4. 5. Fill the burette to the top calibration line (50 ml) with the Fe+2 stock solution. Deliver 5 ml of the stock solution form the burette into a clean 100 ml volumetric flask. Measure 10 ml of the acetate solution and 10 ml of the phenanthroline solution into the graduated cylinder respectively and add to the flask. Allow the mixture to stand for five minutes, dilute the flask to the mark with de-ionized water, cap the flask, and mix the diluted solution thoroughly. Transfer this first standard to the Erlenmeyer flask, calculate the concentration of the standard and label the flask. Rinse the volumetric flask with de-ionized water and repeat Step 2 for 10 ml, 15 ml, and 20 ml of the stock solution from the burette. These are standards 2, 3, and 4. Place the vitamin tablet into a 100 ml beaker. Measure 50 ml of the 0.1 M HCL (aq) into the graduated cylinder and add it to the beaker. Place the beaker on a hot plate and heat the extraction solution to boiling. Gently boil the acid extraction solution for 15 minutes. Break apart the tablet with a clean stirring rod while boiling. Remove the beaker from the hot plate and allow the solution to cool to room temperature. 18 6. 7. 8. 9. 10. 11. Transfer the solution from the beaker to the 100 ml volumetric flask. Dilute the de-ionized water and mix thoroughly. This is your diluted extraction solution. Filter 20 ml of the diluted extraction mixture through filter paper in a gravity funnel into a flask or beaker. Wash the volumetric flask thoroughly with de-ionized water. Pipette 10 ml of the diluted extraction solution into the flask, dilute to the mark, and mix thoroughly. This second diluted extraction solution is the unknown solution. Transfer the solution to an Erlenmeyer flask and label it. Place the second order filter lever in the white position and set the wavelength to 508 nm. Fill a cuvette with de-ionized water and insert it into the sample compartment. Blank the instrument according to the procedure in Basic Operation. Fill another cuvette with the first standard. Insert the cuvette into the sample compartment and record the absorbance. Repeat step 10 for the other three standards and the unknown. Note: The range of iron levels in the vitamin tablets can be quite broad. As a result, the prepared unknown solution may not yield an absorbance value that can be properly interpreted from the standard curve. Therefore, you may have to make adjustments in the concentration of iron in the unknown solution by trial and error. If the absorbance of the unknown turns out to be higher than that of standard 4, go back to Step 8 and use smaller amount (e.g. 5 ml) of the diluted extraction solution in making the unknown. If the absorbance of the unknown is lower than that of standard 1, use a larger amount (e.g. 20 ml) instead. Keep doing the above until the desired unknown is obtained. Calculations: 1. On a regular piece of graph paper, label the horizontal axis concentration and mark it in equal intervals from 0 to the value of standard 4. Label the vertical axis absorbance and mark it in equal intervals from zero to a convenient round value above your highest data point. 2. Plot absorbance versus concentration for the four standard solutions. Draw the best straight line through the four points and the origin of the graph. 3. Use the working graph to determine the concentration of Iron II ion in the unknown solution. Using the dilution data from the experiment, calculate the concentration of the diluted extraction solution and the mass of iron (in mg) present in the vitamin tablet. 19 Parts List Table-3 Alpha-1 Series Parts List Item Number A-1000 Accessories A-100-101 Description Model Alpha-1000 Spectrophotometer 15 nm Band pass Wavelength range: 400~1000 nm. Complete with 10 mm Test Tube Cuvettes (12 pcs.) 10 mm Cuvette Adapter, Dust Cover, User Manual Experiment manual includes safety in the lab, 10 experiments, instructor guide Test Tube Sample Holder for 10 mm diameter Test Tubes Square Cuvette Adapter for 10 mm Cuvettes Test Tube Sample Holder for ¾ inch Test Tubes Test Tube Sample Holder for 1 inch Test Tubes COD Vial Sample Holder Power Cord, European plug Holmium Oxide Filter 10 mm x 10 mm x 45 mm (requires A-110-103) Didymium Filter 10 mm x 10 mm x 45 mm (requires A-110-103) A-110-102 A-110-103 A-110-113 A-110-114 A-110-115 A-110-220 A-150-115 A-150-116 Glassware A-301 Test Tube Cuvette, 10 mm diameter, 12 pcs. A-302P-100 Disposable Cuvette, Polystyrene, 10 mm path length, 100 pcs. A-302P-500 Disposable Cuvette, Polystyrene, 10 mm path length, 500 pcs. A-304G Square Cuvettes, Optical Glass, Set of 4 A-305P Disposable semi-micro Cuvette, Polystyrene, 10 mm path length, 500 pcs. Misc. and Replacement Items A-110-505 Tungsten-Halogen Lamps, Package of 2 (6V 10W G4 type) A-110-508 A-110-509 A-110-511 A-110-512 A-110-513 A-110-521 A-120-111 Printer Paper, Package of 3 Printer User Manual Dust Cover Fuse, 3A, quantity 1 (size 5 x 20) Allen Wrench Black block 20 Troubleshooting PROBLEM Instrument Inoperative (Power indicator has no light) Possible Cause Power cord not connected to outlet Internal fuse blown or defective electronic component Solution Plug instrument in Call an authorized service engineer Instrument cannot be set to 100%T (0.000A) No Cuvette Adapter in the Sample Compartment Cuvette Adapter must be in Sample Compartment to open sample holder shutter Light beam blocked: Holder misaligned Shutter Check sample holder Lamp is old or defective Lamp is off alignment Replace Lamp Refer to Lamp Replacement instructions in this manual Call an authorized service engineer Remove Cuvette Adapter or test tube May be stuck open Close shutter Defective electronic component %T cannot be set to 00.0%T Sample holder Sample holder shutter Defective electronic component Incorrect Transmittance to Absorbance correlation Digital Display does not change regardless of sample concentration Bubbles or particles in solution Defective electronic component Wrong wavelength setting Insufficient sample volume Stray sample preparation vapors Bubbles or particles in solution Defective electronic component or loose wiring 21 Call an authorized service engineer Check sample preparation and analytical procedure Call an authorized service engineer Check sample procedure and wavelength setting Fill cuvette with more sample Prepare the sample away from the instrument. Use proper ventilation Check sample preparation and analytical procedure Call an authorized service engineer PROBLEM Instrument drift and noise Possible Cause Solution No sufficient warm up time Significant temperature change Lamp not adjusted properly Check lamp has been properly installed or has moved during transit Refer to Lamp Replacement instructions in this manual Replace with a new lamp Lamp old or defective Incorrect readings obtained Sample Holder Misaligned Refer to Lamp Replacement instructions in this manual Unstable power supply Defective or dirty detector or defective electronic component Insufficient sample volume Wrong wavelength setting Failed to blank (0A/100%T) Failed to set 0%T Call an authorized service engineer Stray sample preparation vapors Bubbles or particles in solution Instrument out of electronic calibration 22 Fill cuvette with more sample Check analytical procedure and wavelength setting Check wavelength accuracy according to procedure in this manual Prepare sample away from instrument. Use proper ventilation Check sample preparation and analytical procedure Call an authorized service engineer