Download Manual for light vehicle simulators
Transcript
FOERST Driving Simulators Research Development Production Foerst GmbH Industriegelände 5 D-51674 Wiehl Tel.: +49-2262-72970 0 Fax: +49-2262-72970 12 Email: [email protected] Internet: www.drfoerst.de Date: 13. February 2013 F12 Simulation Software for Passenger Car Driving Simulators User’s Manual Software F12 Version 5.2 2 Contents 1. 2. 3. 4. 5. 6. 7. 8. 9. Using the Menu of Passenger Car Simulators F12P Eco-Driving Road Safety Motorsports Fitness to Drive Free Driving Driving School Data Logfiles Software Update Procedure Foerst GmbH Industriegelände 5 D-51674 Wiehl Telefon: +49-2262 / 72970-0 Telefax: +49-2262 / 72970-12 Email: [email protected] Internet: http://www.DrFoerst.de/ © 1976-2013 Foerst GmbH. All rights reserved. Information in this document is subject to change without notice. Without limiting the rights under copyright, no part of this document may be reproduced, stored in or introduced into a retrieval system, or transmitted in any form or by any means (electronic, mechanical, photocopying, recording, or otherwise), or for any purpose, without express written permission of Foerst GmbH. FOERST Driving Simulators Research Development Production Foerst GmbH Industriegelände 5 D-51674 Wiehl Tel.: +49-2261-72970-0 Fax: +49-2261-72970-12 Email: [email protected] Internet: www.drfoerst.de Rev-13-02-2013 Using the Menu of Passenger Car Simulators F12P The driving simulator software F12P allows many settings and adjustments and the choice between a multitude of driving tasks/settings. The necessary choices can be made using a small control unit with two buttons: “Line” and “Mode”. All adjustments are made via a menu. This menu can be called up, when the simulator is in rest mode, that means if no drive is currently running. It is usually displayed automatically, and can be opened by pushing either “Line” or “Mode” if currently invisible. The menu is structured line by line and shows a cursor in the form of a red bar. In general, the button “Line” moves the cursor, while the button “Mode” activates or modifies a menu text. The first menu line, shown in yellow, describes the “Program”, which is the highest level mode of the simulator. Further lines of the menu comprise adjustable options for this program. When a drive is started, the current settings in the menu determine the simulator’s behaviour1. There are driving programs like “Driving School” and menus for special adjustments like “Options”, “Service“, or „Replay“, which are not meant to start a ride. For faster navigation between the real driving programs, the three menus “Options”, “Service” and “Driver’s Data” can be configured to be submenus of a single “Settings” menu. In this case, they are accessed by choosing “Settings” in the first line and then “Options”, “Service” or “Driver’s Data” in the second menu line. While driving programs are described in corresponding chapters, this document focuses on the non-drive menus below (the last one is not a menu, but rather an operation mode): 1. 2. 3. 4. 5. 1 Options Service Driver’s Data Replay Replay Playback This may seem obvious, but you can start a ride while the corresponding menu page is not visible (e.g. in the diagnosis page). 2 1. Options The options menu allows the adjustment of global parameters, which influence all driving programs. In addition to the options described here, the menu for your simulator could contain configuration entries for special hardware used in your simulator. Some options described here may be missing if they are not applicable to your simulator or are configured not be changeable. 1.1. Gearshift Options This line allows switching the type of gear shift box. Usually, you can select between “Automatic gearshift” and “Manual gearshift”. Depending on the software version, you might find different and/or additional options special to your simulator hardware or alternative usage modes (e.g. handicapped accessibility). 1.2. Driveaway Assistance The driveaway assistance makes it easier to start the car by making it harder to stall the engine. You can choose between “standard”, “strong”, “off” and “medium”. 1.3. Printout after ride The scenarios can generate a printed evaluation, which contains a list of the driving faults made during the ride as well as the driver’s personal data (if entered using the corresponding menu). You can choose between “on” and “off”2. 1.4. Report printout Some scenarios can create special reports, which can be printed. You can choose between “on” and “off”2. 1.5. Voice Output With this option you can choose which text should be spoken. With the option “standard” all instructions are spoken, with the option “nav. system only”, only the instructions of the route guidance system are spoken. 2 For the latter to work, a printer must be connected to the system and be configured as Windows standard printer. Attention: Installing some printers may lead to subsequent performance problems of the simulator due to driver issues. Such issues are not covered by the warranty. 3 2. Service The service menu offers some service functions as well as a diagnosis display. The latter is used by service technicians in order to quickly solve issues with your simulator in case they arise. 2.1. Diagnosis The diagnosis display allows an assessment of the interface hardware as well as the connected sensors and switches. Thus, it is a valuable tool, if something should not function as expected. The diagnosis display can also be activated at any time using the pc keyboard and the key combination <Ctrl>+<F1>. You can also start a ride (although you cannot see the settings for the newly started ride) while the diagnosis display is active. Turn the ignition key to start the ride selected in last shown driving program menu. Before the ride, the diagnosis display can be switched off using either “Line” or “Mode”, which returns you to the main menu. The values in the diagnosis display are structured as follows: a. b. c. d. Raw analogue inputs Processed analogue Inputs Active digital inputs Active digital outputs a. Raw Analogue Inputs These values are input measurements from the hardware installed in your simulator. The values are interpreted by the software and then used as input values for the simulation. The actual values may be different from simulator to simulator, but you may be asked for them by a service technician. b. Processed Analogue Inputs The above described raw analogue inputs are processed to yield the simulation input values. This translation may need to be changed if the simulator is moved or in reaction to larger environmental changes. This is done in the Calibration process (see section 2.2). We now assume, a calibration has already been performed. Then, the processed values vary from 0 to 100 per cent. The first step for error diagnosis is to observe these values and compare them to actual hardware input. Accelerator pedal released: 0 % 4 Accelerator pedal fully activated: 100% Brake pedal released: 0% Brake pedal fully activated: 100% Clutch pedal released: 100% (transmission) Clutch pedal fully activated: 0% (declutched). After steering wheel initialization, the steering wheel angle, relative to straight motion position, is indicated in degrees. c. Active Digital Inputs Digital inputs are e.g. ignition key, starter, blinker, light switch, safety belt lock, wiper switch and other digital inputs. They are shown both in raw form as a hexadecimal number and in interpreted form as textual descriptions of the currently activated inputs. d. Active Outputs The steering wheel torque is the feedback in per cent. It always vanishes when not driving, so don’t expect other values unless you start a ride, when problems with the steering wheel motor can be diagnosed. The values in the last line refer to digital output values such as vibration motor activation state. You will only need to pay attention to these values if a problem arises and you are asked for them by a service technician. 2.2. Calibration During the calibration process, the raw input range for the various analogue sensor inputs is measured and stored. These measurements are subsequently used to translate the raw sensor inputs into percentage values used by the simulation. A calibration becomes necessary, whenever the simulator is moved or e.g. the environmental temperature changes. It is also advisable to perform a calibration process from time to time to compensate the effects of wear and tear on the sensor and/or interface hardware. During the calibration process, the computer asks you to press, hold and release the pedals, i.e. accelerator, brake and clutch. During the measurement, the current raw values are displayed, which may be interesting for a technician in case of problems. The calibration process may be cancelled by pressing the horn button. 2.3 Finish without Shutdown Activating this entry quits the simulation program without shutting down the computer. After approx. 20 seconds, the program quits and you are left with the Windows desktop. This option is e.g. needed in order to perform a software update. 2.4 Shutdown Activating this entry completely shuts down the computer. This process take about 30 seconds, after which the simulator may be physically powered off. 5 3. Driver Data The driver’s data menu allows to enter user data for the personalized use in e.g. driving schools. This menu is only available, if your software license comprises the driving school program. It offers entering the following data items: 3.1. Driver Id Here, a short identification is entered, which is later used to load the driver data. Usually, a shortened form of the driver’s name or an identification number is used. Please note, that not all letters are allowed for this id. 3.2. Name This allows the input of the full user’s name. 3.3. Gender This allows the input of the user’s gender (mainly for salutation purposes). Please use abbreviations “m” = male and “w” = female. 3.4. Date of Birth Allows to input the user’s date of birth. 3.5. Comment 1 A line of free text for the use of e.g. the driving school. 3.6. Comment 2 Another line of free text. 3.7. Load Data Activating this line using the “Mode“ button causes the driver data identified by the currently entered driver Id to be loaded. Both success and failure of the load process are acknowledged by a corresponding audio signal. 3.8. Save Data Activating this line using the “Mode“ button causes the currently entered user data to be saved under the given driver Id. A successful save process is acoustically acknowledged. 6 4. Replay The replay menu allows to play back a “replay” of the last 10 rides. A “replay” is a recording of the ride, which can be played back either from the driver’s perspective or as seen from outside the vehicle. Optionally, you can display additional diagrams showing various physical data items as they vary over time (e.g. position of the brake pedal,…) 4.1. Show Replay Activating this entry with the “Mode” button starts the replay selected below with display of the selected additional data items. 4.2. Display Data Here, you can select the additional data items to be displayed. You can choose between “None”, “Economical” and “Safety”. 4.3. Choice of ride Here, you can select the ride, for which you want to show a replay. You can choose between the last 10 rides performed on the simulator, presented in reverse order: The last ride appears first, the second last second and so on. The entries are labeled similar to the selections made in the menu to start the ride. If there is still no replay data present, then “-not available!-” is displayed. 7 5. Replay Playback Replays may be started either at the end of a ride or through use of the Replay menu. The simulator then switches to “Replay mode”, the recorded data is played back and data is displayed. A small control window shows the playback state and the time position. The following interactive controls are possible: The Button “Enter” allows you to change perspective between the driver’s perspective and views from outside the vehicle. You can use the “Mode” button to fast forward the playback. You can use the “Line” button to stop or rewind the playback. Pressing and releasing both “Mode” and “Line” quits the replay mode and brings you back to the previous menu (i.e. either evaluation after the ride or main menu). In addition, the replay playback can be influenced using the steering wheel: In neutral position, the replay runs with original speed. Turning the wheel to the right makes playback faster (fast forward). Turning the wheel to the left makes playback run slower (slow motion) or even backwards (rewind). FOERST FOERST Fahrsimulatoren Driving Simulators Research Development Production Foerst GmbH Industriegelände 5 D-51674 Wiehl Tel.: 0049-2262-72970-0 Fax: 0049-2262-72970-12 Email: [email protected] Internet: www.drfoerst.de 10.05.2011 Eco-Driving This program allows the permanent computation and the display of the current and average fuel consumption during a simulation ride. In order to make best use of the Economy measurement system, a sight system with more than one monitor is needed. The program can then be used to display a dynamic engine map on one of the side monitors or an additional external monitor. In addition, the most relevant physical quantities influencing the fuel consumption are displayed as functions of time. A simplified version of this display (current and average consumption only) in textual form can alternatively be shown on the main monitor. The following techniques for fuel-efficient driving can be trained: - fast acceleration - overrun fuel cutoff by engine braking when decelerating - early gear switching, using the highest possible gear when driving uphill - avoidance of unnecessary braking and acceleration manoeuvres - anticipatory driving style This program offers four options: 1. 2. 3. 4. Course Traffic density Diagram type Diagram time Besides these choices “Economic Driving” may also be influenced by other options. In this sense, for instance the gear shift may be preselected (in the option menu). Please consider the menus “Service“ and “Options". 1. Choice of the course With this feature you can choose the world, in which you want to drive. 2 1.1. City The driver drives through city traffic. His route leads across several crossroads, in part with traffic lights. His objective is to keep fuel consumption down – mainly through an anticipatory driving style. 1.2. Suburban area The student starts from a parking place beside a rural road. The route leads him through a village and on a rural road. 1.3. Rural Road The student drives on a rural road. The route features e.g. road works with speed limits and a junction with traffic lights. Again, the objective is to keep fuel consumption down by means of an anticipatory driving style. 1.4. Motorway The driver enters a motorway and later leaves it again. In addition to an anticipatory driving style, fuel consumption can be reduced by keeping braking manoeuvres and acceleration to a minimum. 1.5. Mountains The driver enters a mountain range with a steep rise and leaves it on a steep descent. The objective is again to keep fuel consumption as low as possible. 3 2. Choice of traffic density The traffic comprises about 30 traffic users with artificial intelligence, including passenger cars, trucks, pedestrians, bicycles, and special vehicles, which obey the traffic rules, keep distance to the forgoing vehicles, obey the speed limits, stop in front of a red traffic light and in front of crossing traffic, accelerate and decelerate in a natural way and may be overtaken. The approaching cars stop and make a jam, when you are on the left side of the road. The adjustment in this menu line defines only the quantity of the approaching vehicles. 2.1. Normal traffic There is a normal quantity of vehicles in the virtual world. 2.2. Sparse Traffic The quantity of vehicles in the world is half as much. 2.3. No Traffic No vehicles are generated. The driver is alone on the course. 3. Choice of diagram type Additional diagrams can be shown during the ride. 3.1. Eco This diagram shows beside different vehicle parameters, which influence the fuel consumption, an engine map, which visualizes the actual specific fuel consumption. More you can find under 5. Visualization and Engine Map. 3.2. Safety This diagram shows different vehicle parameters like pedal position, revolutions, gear, steering angle or fuel consumption as a function of time. 3.3. Off No diagram will be shown. 4 4. When are diagrams shown This option is only selectable, if either Eco or safty is choosen. 4.1. Only during Replay The selected diagram is only shown during a replay. 4.2. During Ride and replay The selected diagram is shown during ride and replay. 5. Visualization and Engine Map The fuel consumption of the simulated medium-class passenger car is calculated as a function of motor torque and revolutions per minute. The position of the accelerator pedal, the speed and the current fuel consumption are diagrammatically shown as functions of time. The average fuel consumption is also constantly calculated and displayed. The specific fuel consumption (i.e. fuel consumption in relation to power output) is displayed as a point in the engine map to the right of the other diagrams. The engine map visualizes by graphical means the physical fact that combustion engines work most efficiently at low revolutions per minute and almost open throttle valve. The axes represent the revolutions per minute and the mean piston pressure. The latter is proportional to the engine torque. The blue lines are lines of constant specific fuel consumption. The areas between them are coloured green for low consumption to red for high consumption. A small marker square shows the current working point of the engine as determined by the trainee’s driving style. By observing the movement of the working point, one can see how the driving style influences the fuel consumption. Not only does the consumption rise with rising speed, but also 5 it falls when choosing higher gears. By carefully choosing the right combination of torque and revolutions per minute when accelerating or going uphill, it is possible to save fuel while still moving swiftly. FOERST Driving Simulators Research Development Production Foerst GmbH Industriegelände 5 D-51674 Wiehl Tel.: +49-2262-72970-0 Fax: +49-2262-72970-12 Email: [email protected] Internet: www.drfoerst.de Rev. 2013-06-25 Road Safety The program “Road Safety” is meant to be used for hazard perception training. To this end, it offers a set of scenarios featuring critical situations in various surroundings. The driver is required to properly react in order to prevent an accident. The program „Road Safety“ also replaces the program „Alcohol Simulations“ contained in former versions of the F12 software: Using an alcohol simulation, the traffic scenarios and the contained hazard situations can be used to demonstrate the dangers of driving under the influence of alcohol. The program offers the following choices: 1. Surrounding 2. Variant 3. Weather 4. Dangerous events 5. Alcohol simulation: Mode 6. Alcohol simulation: BAC 7. Safety systems 8. Error Messages 9. Diagram type As a special “Surrounding”, you can additionally find the subprogram “Reaction Tests”. This subprogram can be used to perform raw reaction time measurements and is largely different from all other scenarios. In addition to the choices listed above, the program „Road Safety“ can be influenced by further options. As an example, the type of gearbox (manual or automatic) can be chosen. Please have a look at the Options menu. Depending on the type of simulator or sight system, some options or scenarios may not be available, e.g. because they would not be drivable without side view screens. 2 1. Choice of Surrounding Using this menu item, the general type of surrounding for the scenario is chosen. The following types of surrounding can be selected: 1. 2. 3. 4. City Rural Road Motorway Mountains 1.1. City In this category, four scenarios of approximately three minutes each can be selected: 1. After starting just in front of a town entry, the driver passes bus stops and several parked cars. Finally, he has to traverse a busy roundabout.** 2. The ride starts on the parking lane of a two-lane road. It continues over a traffic light junction to a one-lane road and past some parked cars.*** 3. Several traffic light junctions must be passed. Between the junctions, road works force the driver to change lanes. This ride does not offer additional dangerous situations.* 4. This ride is similar to the first choice, but in addition the driver has to turn off and cross a roundabout.* 1.2. Rural Road This category comprises four scenarios: 1. The driver must cover a distance on rural roads and through a small town. He passes parked cars and forested areas and must overtake a bicyclist. Due to the narrow roads, particular attention must be paid in order not to collide with oncoming traffic. This ride lasts longer and takes approximately six minutes.*** 2. After starting at a parking lot at a rural road the ride spans hilly roads, passes through a small town and continues to a small forest. This ride takes approximately three minutes.*** 3. This ride on narrow roads takes approximately four minutes. Halfway down, a small village is passed.*** 4. The ride starts at a bus stop immediately before leaving town. It continues along a straight, some 90° curves and some junctions back to town. The ride ends after approximately three minutes.* ** This variant can be used without side screens with some limitations (the driver must refrain from driving manoeuvres, which require the use of side mirrors). *** This variant can be used without side screens. * This variant cannot be used without side screens. 3 1.3. Motorway There are two scenarios in this category: 1. The ride starts in front of a motorway entry. The driver must merge into the traffic and must overtake a slow truck. The appropriate distance to the vehicle in front must be kept. The ride ends after leaving the motorway and takes approximately five minutes.* 2. This ride starts at a motorway service station. During the ride, the appropriate distance to the vehicle in front must be kept. Shortly after the service station, the motorway grows from two to three lanes. The ride takes approximately four minutes.* 1.4. Mountains There is only one scenario in this category: 1. A mountain road leads through tunnels, a bridge, a long downhill section and serpentines. * 1.5. Reaction Tests In this special category, you can choose between two scenarios, which are tailor-made for raw reaction time measurements. In one of the two scenarios, the driver must react to deer jumping onto the road, while the other one features virtual stop signs. These reaction test scenarios largely differ from the other scenarios. Therefore, the available options are also different. You can control the traffic density, the weather and the diagram display. For the virtual stop sign ride, the number of measurements (three or five) can be chosen. 4 2. Settings In addition to the choice of surrounding and scenario variant, there are additional parameters to be adjusted. For all parameters, the standard setting is underlined. Weather o Nice o Rain o Fog o Night o Twilight o Snow Dangerous events o Dangerous events o Without Reaction If „Dangerous events“ is activated, the program creates several critical situations at fixed positions matching the surrounding. As a rule of thumb, these situations are created by more or less severe violations of traffic rules by other road users. For the purpose of alcohol prevention, this may call for some explanation by the supervisor. Otherwise, the driver might blame an accident to malicious behaviour of others instead of his own alcoholisation. In addition, further dangerous events can be created using a numeric keypad. Please note, that excessive use of such events can disturb a scenario’s flow and make it behave strangely at later times. Before using the numeric keypad for event insertion, this feature must be enabled in the F12 software configuration. Alcohol simulation: mode o On o Off o Comparison If you choose the mode “Comparison”, the alcohol simulation is only activated after a sober adaption phase. If alcohol simulation is turned on, a graphical alcohol effect and a time delay1 are activated. The strength of these effects depends on the chosen blood alcohol content (BAC, see below). The steering delay in particular will make a sober driver drive a zig- 1 According to Winninghoff, Schmedding und Schimmelpfenning (Die Reaktionszeitverlängerung bei Dunkelheit unter Alkohol- und Blendungseinflüssen – Ergebnisse aus Laborversuchen. Verkehrsunfall und Fahrzeugtechnik (2001)) the minimal reaction time is not enlarged by the influence of alcohol, but the statistic spread is incuding a shift of the distribution centre towards longer reaction times. In other words, the probability of not reacting within a given time span rises. Random reaction time enlargements are not easily integrated into a simulation software and in addition are of questionable pedagogic value. Therefore, the F12 software uses a constant reaction time enlargement corresponding to the time, after which half of the test persons reacted. The above paper does not allow reconstructing the precise curve of reaction time delay as a function of the BAC, whence we use a simple linear dependency. Using this ansatz, the numbers in the above paper imply a reaction time delay of approximately 2.8s per percent BAC. While the pedal positions are simply delayed by this amount, a corresponding delay of the steering wheel does not feel natural, because a constant delay contradicts experience. Therefore, we use a smoothing function with comparable time constant instead of the delay. 5 zag route like under the influence of alcohol. This will also make it harder and harder to cope with the various hazard situations. Alcohol simulation: BAC (blood alcohol content, only accessible, if alcohol simulation turned on) o 0.03 percent o 0.05 percent o 0.08 percent o 0.11 percent o 0.16 percent o Calculator If “Calculator” is chosen, the user is prompted to enter some personal data and the type and number of drinks. Using this data, the formulae of Widmark2 and Watson3 are used to calculate the BAC4. The time of start of drinking is assumed to be three hours before the subsequent ride. If “Calculator” is chosen together with “Alcohol simulation: Comparison”, the calculator is started in the middle of the ride. At the same place, where the alcohol effect would have been activated for explicit BAC values, the driver is stopped and the calculator is started. After all data has been entered, the ride is continued with the calculated BAC value. Choice of security systems: o none o ABS (anti-lock braking system) o ABS + ESC (anti-lock braking system and electronic stability control) Error messages o On o Off Using this option, the display of driver fault messages during the run can be turned on or off. By turning off the messages, the driver is not warned or distracted during the ride, which might be essential if undisturbed measurements are required. Driver’s faults are always displayed in the evaluation table at the end of the ride. 2 E.M.P. Widmark: Die theoretischen Grundlagen und die praktische Verwendbarkeit der gerichtlichmedizinischen Alkoholbestimmung. Urban und Schwarzenberg, Berlin Wien (1932) 3 Watson, Watson & Batt: Total body water volumes for adult males and females estimated from simple antropometric measurements. The American Journal of Clinical Nutrition 33 (1980) 4 Modifications of the Widmark and Watson formulae, as may be found e.g. in the German Wikipedia, are not backed by scientific papers. Therefore, we do not use them. 6 Choice of diagram type: o Security o Eco o Off Optionally, informative diagrams can be shown. You can choose between a security diagram and an economy diagram. The security diagram presents several driving parameters such as pedal positions, steering angle, longitudinal and transversal accelerations. The economy diagram presents the fuel consumption and the engine’s working point in form of a performance map. If you choose one diagram type, the diagram will be shown during the ride and during the replay. If you choose the option “off”, there will be no diagram during the ride, but the security diagram during the replay. 3. Evaluation At the end of every road safety scenario a “Score” will be calculated and shown in the evaluation table. Based on 100% points are subtracted for every mistake during the ride. To the bottom the score is limited to 0%. The number of substracted points depends on the type of error. There are four categories of errors: accidents, severe traffic rule violations, less severe traffic rule violations and bad driving style. FOERST Driving Simulators Research Development Production Foerst GmbH Industriegelände 5 D-51674 Wiehl Tel.: 0049-2262-72970-0 Fax: 0049-2262-72970-12 Email: [email protected] Internet: www.drfoerst.de 10.05.2011 Motorsports With the aid of your Foerst simulator drivers can be taught how to handle a vehicle when going to extremes. The simulator offers the choice between a state-of-the-art formula 1 race course with narrow curves, falls and rises or a blocked off rural road, which is easier to handle. The training gives the driver a good insight into the physics of driving and helps develop an experienced and steady driving style in all situations. In addition, it offers a fun aspect, the real-world counterpart of which is not easily accessible to driving trainees. Some of the aspects of driving physics, which can be shown using the Motorsports program are: Loss of road grip due to centrifugal forces Loss of wheel grip due to acceleration and deceleration Interaction between lateral and longitudinal forces (accelerating forces reduce lateral support and vice versa) Stabilization of a sliding vehicle by countersteering (and: this is not easy!) It should be noted, that driving under extreme conditions uncovers some fundamental restrictions of driving simulators, because the forces on the driver cannot be felt to the full extent as in reality. This leads to a systematic underestimation of the true speed of the own vehicle, making it harder to feel the limits of the own car than in reality. This problem is partially addressed by a slight exaggeration of car inclination. Nevertheless, in the simulator it is harder to go to the limits than in reality and easier to cross these limits. For the fun aspect, we therefore offer a special kind of ‘tyre’ with unrealistically good road contact. The program “Motorsports” offers the following choices: 1. 2. 3. 4. 5. 6. 7. 8. 9. Choice of course Number of laps Various sight and road surface conditions Tyres Motor power Kind of drive Vehicle weight Type of diagram Diagram display time 2 Besides these choices, “Motorsports” may also be influenced by other options. For instance, the gear shift may be changed. Please have a look at the “Options" menu. 1. Choice of Course With this feature you can choose the world, in which you want to drive. The following courses are available: Racetrack Closed rural road. 1.1. Racetrack This formula 1 race course features narrow curves, rises and falls. Going fast on this course is quite demanding. 1.2. Closed Rural Road Here, you drive on a rural road without intervening traffic. The course is much easier to handle and higher speeds can be reached. . 2. Choice of laps Both available courses close to a round. You can choose, how often this round is to be driven. The available choices are: 1 lap 3 laps 5 laps. 3. Choice of the weather Via the computer menu the following sight and road surface conditions can be selected. This allows to make driving harder due to reduced sight and/or reduced road friction. The available choices are: Nice weather Fog Rain Night Twilight. 3 3.1. Nice weather The light and sight conditions are optimal. The road surface is dry and gives a firm hold. 3.2. Fog The sight distance is reduced to 80 m. 3.3. Rain The road surface gets slippery. Weak friction of the tires on the wet road is simulated. This shows up at excessive centrifugal acceleration as well as at hard braking and full acceleration. In addition, the sight is worse than at nice weather. 3.4. Night You have to switch on the light, and may drive with dimmed light or high beam. The viewing distance is reduced, but the friction of the road surface is the same as the one at nice weather. 3.5. Twilight The sun is hanging low at the horizon. The scene is darker than at nice weather. The road surface corresponds to the surface at nice weather. 4 4. Choice of tyres You have the choice between a realistic tyre simulation and unrealistically good tyres. Normal Arcade 5. Choice of motor power Choosing a strong engine and a low vehicle weight (see below), you make the maximum acceleration larger. This makes the car faster, but on the other hand makes it much easier to exceed the physical limits. You can choose between a sports car engine (approx. 110kW) and a weaker engine (approx 55kW). Strong Normal. 6. Choice of kind of drive A front wheel driven car is much easier to handle than a rear wheel driven one. A rear wheel driven car can achieve larger accelerations, because inertia causes greater pressure on the rear wheels when accelerating. On the other hand, the rear wheels start sliding much more easily. Front wheel drive Rear wheel drive. 7. Choice of vehicle weight See “Choice of motor power” above. 800 kg 1400 kg. 8. Choice of Diagram Type As an overlay to the simulation screen, additional diagrams for ride analysis can be shown. Safety Eco Off. 8.1. Safety This diagram shows several vehicle parameters plotted over time. Examples are pedal positions, engine revolutions, choice of gear and steering angle. 5 8.2. Eco In addition to several vehicle parameters influencing fuel consumption, a shell diagram showing the current specific fuel consumption is displayed. 8.3. Off No diagram is shown. 9. Choice of Diagram Display Time If a diagram type has been selected, you can control when the diagram is shown. Obviously, there is no point in specifying when to display no diagram. During Replay only During Ride and Replay. 9.1. During Replay Only The diagram is only shown in the replay to assist ride analysis. 9.2. During Ride and Replay The diagram is also displayed during the actual ride. FOERST Driving Simulators Research Development Production Foerst GmbH Industriegelände D-51674 Wiehl Tel.: 0049-2262-72970-0 Fax: 0049-2262-72970-12 Email: [email protected] Internet: www.drfoerst.de Rev. 2011-05-10 Fitness to Drive The term “Fitness to Drive” comprises different abilities, a good driver should have. This program offers scenarios to test or train some of these abilities. The available scenarios fall into two categories: Reaction tests and long term measurements. 2 1. Menu The “Fitness to Drive” menu page allows to select the current student and to select the next exercise. 1. Program title (use to switch e.g. to the “Edit User Data” page) 2. Choice of test category 3. Choice of “scenario” 4. Settings 5. Driver Identification 1.1. Program Title Using the first (yellow) line, you can switch to other driving programs or to various settings pages. Refer to the “Description of the Menu Control” chapter for details. 1.2. Test Categories The second line allows you to choose between two test categories, which in turn determines the scenarios you can select in the line below. The following categories can be selected: 1. Reaction test 2. Long term measurement 1.3. Choice of Scenario Here, you can choose between the different scenarios belonging to the selected category. You will find an overview about the available scenarios in each category in section 2 “Scenarios”. 1.4. Settings Depending on the selected scenarios, you can make various adjustments. For a description of the available settings, refer to section 2 “Scenarios”. 3 2. Scenarios This section contains short descriptions of the available scenarios. It also lists the available options for each scenario. 2.1. Reaction test The category “Reaction test” contains two scenarios to test the reaction time of the driver. The reaction time is a quite simple criterion for the fitness to drive, but offers very simple and comparable results. The available scenarios for reaction time measurement are: Stop sign Deers Both scenarios contain events, to which the driver has to react and measure the reaction times. They offer similar variants/settings. The standard choice for each setting is underlined. Traffic Density o None o Sparse o Normal Weather o Nice o Rain o Fog o Night o Snow o Twilight Diagram Type o Safety o Eco o Off When are diagrams shown? 4 (only selectable, if either Eco or Safety is chosen) o During Ride and Replay o Only during Replay 2.1.1. Stop sign During the ride, stop signs appear on the screen and the driver is supposed to stop the car. As an additional option, you can choose the number of measurements: o 5 o 3 A report printout is available with Reaction time Reaction distance Braking distance Stopping distance Average reaction time 2.1.2. Deers Five deers appear on the road. The driver must quickly brake in order not to hit them. 5 2.2. Long term measurement After having been behind the steering wheel for a long time, your reaction time may increase, at worst, micro-sleep will be imminent. The simulator offers two scenarios, in which the effects of long term driving may be measured: Driving on a rural road or driving in a motorway road works. In both scenarios, the driver drives several “sections” of a given length. For each section, a “performance rating1” is calculated and presented at the end of the ride. In adjustable intervals, reaction tests are performed, the results of which are also presented at the end of the ride. Comparing the figures, the adverse effects of long term driving can be measured. The menu shows the following choices of scenario: Rural road Motorway In addition to the choice of scenario, further parameters can be adjusted. The standard setting is underlined. Weather o Nice o Rain o Fog o Night o Snow o Twilight Choice of diagram type: o Safety o Eco o Off When are diagrams shown? (only selectable, if either Eco or Safety is chosen) 1 The rating is calculated from track deviation and driving faults. It offers a measure for good driving performance ranging from 0% (horrible) to 100% (perfect) 
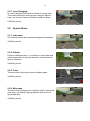
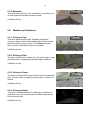
6 o During Ride and Replay o Only during Replay 2.2.1. Rural road Additional options: Sections o 1 section (a 6.3 km) o 3 sections (a 6.3 km) o 5 sections (a 6.3 km) o 10 sections (a 6.3 km) Reaction test o Every minute o Every 2 minutes o Every 5 minutes o Every 10 minutes 2.2.2. Motorway Additional options: Sections o 1 section (a 5.2 km) o 3 sections (a 5.2 km) o 5 sections (a 5.2 km) o 10 sections (a 5.2 km) o Infinite Reaction test o Every minute o Every 2 minutes o Every 5 minutes o Every 10 minutes FOERST Driving Simulators Research Development Production Foerst GmbH Industriegelände 5 D-51674 Wiehl Tel.: 0049-2262-72970-0 Fax: 0049-2262-72970-12 Email: [email protected] Internet: www.drfoerst.de 23.08.2012 Free Driving “Free driving” means, that you do not have to obey a training curriculum or are exposed to a fitness assessment, but that you may choose your speed and track by your own. Several parameters for the drive may be adjusted in the menu. The program “Free Driving” offers the following choices: 1. 2. 3. 4. 5. 6. 7. Various courses Various starting points Various sight and road surface conditions Traffic density ABS Driving Time Type of diagram Besides these choices “Free Driving” may also be influenced by other options. For instance, the gear shift may be changed. Please have a look at the “Options" menu. 1. Choice of Course With this feature you can choose the world, in which you want to drive. The following courses are available: 1.1. Rural Road (1) The course begins with 2 km of curvy highway and 600 m city drive. Inside the city and at its end there are traffic lights. The course closes along a curvy highway. The road leads along a lake with sailboats through landscapes with forest and green. The round may be driven as often as you want. 2 1.2. Rural Road (2) A rural road with city transit. It largely differs from “Rural Road (1)” concerning houses, trees and other virtual objects. The road is much wider. It begins at flat, curvy land road, leads then in curves downhill and uphill again through a city with a choice to turn and drive via another street back to the entrance of the city. Is the choice straight ahead, the road leads via a bridge and aside a lake on a beautiful, curvy country road. . 1.3. Suburban Area A small city with many junctions, one-way streets, stop signs and a roundabout. This course is well suited for exercises concerning right of way rules. 1.4. Urban Area (1) This map features traffic with two lanes per direction in urban surroundings. It contains several traffic light controlled junctions and a roundabout. 1.5. Urban Area (2) Here you find urban roads with a high density of junctions. Some roads have one, others two lanes per direction. 1.6. Motorway The mildly curved motorway runs through woody landscape. There is typical traffic with passenger cars and trucks, barriers and the opposite roadway. The most important tasks are the correct passing and keeping distance. Entrances and exits and the correct threading from the acceleration lane can be trained. The section may be driven as often as you want. The drive is finished, when you leave the motorway via an exit. 3 1.7. Mountains In addition to a course through desert-like landscape this map in particular contains a mountain drive with steep bevels, serpentine roads, a bridge and tunnels. The ride starts right before the serpentine road. 2. Choice of the starting point Each environment provides six different starting points. 3. Choice of the weather Via the computer menu the sight and road surface conditions can be selected. Please note, that not all weather conditions can be selected for all courses. 3.1. Nice weather The light and sight conditions are optimal. The road surface is dry and gives a firm hold. 3.2. Fog For “Rural Road (1)” the drive begins at clear sight. After some hundred meters you drive into a fog bank with 80 meters sight distance. In the fog suddenly cars may approach, so that passing is dangerous. Then the fog decreases. After a while you get into a second fog bank with 40 meter sight distance. All other courses are driven from the very beginning at fog with 80 m sight distance. 3.3. Rain For “Rural Road (1)” the sky is cloudy, and the road is wet. After a while rain sets in. For all other courses it is raining from the very beginning. The road-surface gets slippery. If you drive faster than 80 kilometres per hour, the aquaplaning effect sets in. This is simulated by a splash water noise and a forward swimming of the car, so that in most cases an accident is unavoidable. Furthermore, weak friction of the tires on the wet road is simulated. This shows up at excessive centrifugal acceleration as well as at hard braking. 4 3.4. Snow The landscape shows winter colours. Mountains, fields and trees are snowy white. The traction of the wheels is reduced. At accelerating they may slip. At higher speed the car starts sliding. At blocking wheels the vehicle’s steering is not under control. All other cars drive with reduced speed. The program educates to very careful driving style with soft accelerating and braking and correct choice of gear. 3.5. Night You have to switch on the light, and may drive with dimmed light or high beam. The headlights throw natural, soft light-cones onto the road and objects. Traffic lights, house-windows, rear lights and headlights of other cars are illuminated. The friction of the road surface is the same as the one at nice weather. 3.6. Twilight The sun is hanging low at the horizon. The scene is darker than at nice weather. The road surface corresponds to the surface at nice weather. 4. Choice of Traffic Density The traffic comprises about 30 traffic users with artificial intelligence, including passenger cars, trucks, pedestrians, bicycles, and special vehicles, which obey the traffic rules, keep distance to the forgoing vehicles, obey the speed limits, stop in front of a red traffic light and in front of crossing traffic, accelerate and decelerate in a natural way and may be overtaken. The approaching cars stop and make a jam, when you are on the left side of the road. The adjustment in this menu line defines only the quantity of the approaching vehicles. 4.1. Normal traffic There is a normal quantity of vehicles in the virtual world. 4.2. Few traffic The quantity of vehicles in the world is half as much. 4.3. No traffic No vehicles are generated. The driver is alone on the course. 5 5. Choice of ABS brake Using this option, the anti-lock braking system can be activated or turned off. The available choices are Activated Not activated 6. Choice of Driving Time Use this option to limit the driving time of the scenario1. The available choices are: Unlimited 3 minutes 5 minutes 10 minutes 15 minutes 7. Choice of Diagram Type As an overlay to the simulation screen, additional diagrams for ride analysis can be shown. 7.1. Safety This diagram shows several vehicle parameters plotted over time. Examples are pedal positions, engine revolutions, choice of gear and steering angle. 7.2. Eco In addition to several vehicle parameters influencing fuel consumption, a shell diagram showing the current specific fuel consumption is displayed. 7.3. Off No diagram is shown during the ride. In the replay the Safety diagram is shown. 1 There may also be a Driving time setting in the Options menu. Then the ride is limited by the shorter time. FOERST Driving Simulators Research Development Production Foerst GmbH Industriegelände 5 D-51674 Wiehl Tel.: 0049-2262-72970-0 Fax: 0049-2262-72970-12 Email: [email protected] Internet: www.drfoerst.de Rev. 2011-05-19 Driving School The driving school program is the main driving program for all driving school oriented practice. It contains a number of exercises, called scenarios, grouped together in a number of training blocks. Each of these blocks is a set of scenarios useful for a certain level of experience of the student. The program also implements a front end for the driver identification. The driver’s name is used to mark both log files on the simulator’s hard disk and printed fault lists. Printing fault lists can be activated in the “Options” menu. In the manual operation mode, the driving teacher uses the menu to select scenarios suitable for the current student’s experience level. Thus, the training can be suited precisely to the experience level and capabilities of each individual student. The teacher must first become very well acquainted with all available scenarios of the driving school program. Only then, he can judge their suitability for a particular student. 2 In addition to the manual operation mode, the program offers a “Curriculum” operation mode. In this mode, the program automatically leads the student through a series of scenarios. In order to use this operation mode, start a scenario from the special training block “Curricula”. 1. Menu The Driving School Program menu allows to set the user and to select the lesson that should be practiced next. 1. Program title used to switch to other programs 2. Training block selection 3. Scenario selection 4. Difficulty level 5. Diagram type 6. Time of diagram display 7. Driver identification 1.1. Program title Using the first (yellow) line of the menu, the active program is chosen. Cycle through the available choices, until the “Driving School” program menu is shown. 1.2. Training block selection In the first white line one can select between 5 training blocks and the Curricula collection. This selects the group of scenarios that can be chosen in the next line. The following blocks are available: 1. 2. 3. 4. 5. 6. Curricula Block A: Basic training Block B: Intermediate training Block C: Complex training Block D: Special drives Block E: Weather and sight conditions 1.3. Scenario Selection This entry allows the selection of the scenario to be exercised. The range of scenarios that are selectable here depends on the training block chosen above. An overview of the available scenarios in each training block may be found in section 2 “Scenarios”. 1.4. Difficulty Level Many scenarios offer several difficulty levels or variants. If the selected scenario does not have more than one difficulty level, this menu line is not shown. 3 1.5. Diagram Type Optionally, informative diagrams can be shown. You can choose between a security diagram and an economy diagram. The security diagram presents several driving parameters such as pedal positions, steering angle, longitudinal and transversal accelerations. The economy diagram presents the fuel consumption and the engine’s working point in form of a performance map. 1.6. Time of Diagram Display The diagrams described above can be shown during the replay, during replay and ride or not at all. 1.7. Driver Identification This line allows the entry of the driver’s identification, i.e. his name or ID code. This name is added as identification to the log files and allows the collection of historic data about drives per user. Activate the entry by pressing the 'mode' key, then enter the ID using the normal keyboard. Finish the input by either pressing 'Enter' on the keyboard or by pressing 'mode'. Please note, that only letters 'A' to 'Z' and numbers '0' to '9' are allowed characters of the driver identification. If the driver ID is known to the system, it will display the corresponding proper name in the next line afterwards. Use the program (main menu item) “Edit user data” to add new user information to the system. If you plan to only use the manual operation mode, the identification of the driver is not obligatory. It is only needed, if you want to later relate log files to drivers or if you want to create personalized print-outs. If you want to use the automatic operation mode, you must enter a driver identification, because it is used to store and reload the student’s experience level between driving lessons. We recommend to always add user information to the system for new students. Thereby, typing errors in the driver identification immediately become obvious, because the corresponding proper name is not shown. 2. Scenarios This section gives short descriptions of the implemented scenarios. The descriptions focus on educational goals. The details of the scenario implementations depend on the difficulty level and the country version. Some scenarios may be missing on your simulator, if your simulator lacks the necessary operational elements to properly execute them. 2.1. Curricula This training block contains one or more special “scenarios” for the “Curriculum” operation mode. 4 In the standard configuration, the block contains one curriculum. Over the course of several training sessions this curriculum leads the student through almost all single scenarios. If too many driving faults are made, a scenario is automatically scheduled for later repetition. The program stores the student’s progress and automatically assigns suitable scenarios. To this end, the student must be made known to the system (c.f. section 1.7 “Driver Identification”). Please start the curriculum scenario only when the driver code has been entered correctly, i.e. the corresponding proper name is shown. Right after the curriculum scenario is started, the student is shown an overview page about his/her driving skills. New students see a welcome screen instead. During display of the overview page, you can either start the next scenario or leave the automatic driving school mode. After each scenario, the program returns to the overview page. When you leave the automatic driving school mode at the end of a driving lesson, the current experience/skill level of the student is stored. In the next lesson, the training can be resumed at precisely the point where it previously ended. 2.2. Basic training 2.2.1. Controls The trainee is made acquainted with the positions and the functions of the most important operational elements of a vehicle. They comprise: Accelerator, brake, clutch, gearshift, light switch, windshield wiper switch, blinker, starter and ignition. 2.2.2. Clutch In The trainee learns how to clutch. The objective is to repeatedly start and stop the car. 2.2.3. Start and Gearshift The student learns to start the car, clutch, accelerate and decelerate. Economic gear choice is also trained. 2 difficulty levels 5 2.2.4. Steering In order to train steering, the car is switched to automatic gearshift. A red ball marks the correct viewing distance. The difficulty levels differ in the width of the driving lane. 2 difficulty levels 2.2.5. Parking a Car The trainee is made acquainted with the steps involved in correctly parking a car. 6 2.3. Intermediate Training 2.3.1. Stop and Go The driver is caught up in a traffic jam and must repeatedly brake and accelerate. In higher difficulty levels, he has to also deal with down- and uphill slope. 3 difficulty levels 2.3.2. Braking The student is confronted with several sudden situations. He should quickly react and perform a full braking. The reaction time is measured as well as the braking and stopping distance. 3 difficulty levels 2.3.3. Straits It is not always possible to keep to one’s own driving lane. The student trains the correct behaviour in narrowed traffic situations. 3 difficulty levels 2.3.4. Engine Problems During a rather uneventful ride on a country road, the oil lamp flashes as a sign that engine problems are on their way. The driver should remark this and stop the car, before the car is severely damaged. 2.4. Complex Training 2.4.1. Following Situation The driver trains to keep the right distance to the car in front. The variants differ concerning the traffic situation and the driving style of the man in front. 3 difficulty levels 7 2.4.2. Overtaking The student trains how to overtake slower vehicles. The difficulty levels differ in road shape and traffic density. 3 difficulty levels 2.4.3. Traffic Rules The objective of this scenario is adherence to various traffic rules (speed limits, right of way, regulating signs). 3 difficulty levels 2.4.4. Other Road Users Others do not always adhere to traffic rules. The student is confronted with several variants of such misconduct. 2.4.5. Gap Acceptance In heavy traffic and various turning situations, the driver has to wait for an adequate gap in order to merge into the running traffic. He should neither endanger other traffic participants nor impede following traffic by waiting for an unnecessarily long time. 3 difficulty levels 2.4.6. Economic Driving The goal of this scenario is to drive as fuel-conserving as possible. 3 difficulty levels 8 2.4.7. Lane Changing In various situations the driver is forced to change Iane. The correct behaviour during a lane change is trained. Later, the choice of lane on multilane roads is trained. 2 difficulty levels 2.5. Special Drives 2.5.1. Interurban An interurban drive with occasional dangerous situations. 3 difficulty levels 2.5.2. Suburb Drives in suburban area, i.e. a mixture of rural roads and urban roads with one lane per direction. Occasional dangerous situations. 3 difficulty levels 2.5.3. Town The driver trains driving on urban multilane roads. 3 difficulty levels 2.5.4. Motorway The driver trains merging into motorway traffic, leaving the motorway, overtaking, keeping distance and choice of speed and lane. 4 difficulty levels 9 2.5.5. Mountain The driver trains driving in the mountains. In particular, he is confronted with serpentines and tunnels. 2 difficulty levels 2.6. Weather and Darkness 2.6.1. Driving in Fog The drive starts at good sight. Suddenly a fog bank emerges, which requires an adapted speed. Various dangerous situations occur, which, at not adapted driving style, almost unavoidably lead to an accident. 3 difficulty levels 2.6.2. Driving in Rain The drive is absolved in dense rain. The driver hast o cope with bad friction, aquaplaning and bad sight conditions. 3 difficulty levels 2.6.3. Driving in Snow The road is covered with snow and the friction is extremely bad. The driver has to adapt his driving style to these conditions. 3 difficulty levels 2.6.4. Driving at Night The driver is confronted with the bad sight conditions at night-time. He must correctly switch between high-beam and low-beam light. 2 difficulty levels FOERST Driving Simulators Research Development Production Foerst GmbH Industriegelände 5 D-51674 Wiehl Tel.: 0049-2262-72970-0 Fax: 0049-2262-72970-12 Email: [email protected] Internet: www.drfoerst.de 19.11.2007 Data Logfiles During each ride, the most important driving data is collected. At the end of the ride, this data is stored in a data log file. The data collection is usually done with the maximum time resolution, which is equal to the simulation frame rate. The file name starts with “Logfile_” and continues with the date and time of its creation. The data is formatted as a CSV file (Comma-Separated-Value). This kind of file is human-readable ASCII text, which can be opened with almost any text editor (e.g. Windows Notepad) and can easily be imported into spreadsheet programs such as Microsoft Excel (specify tabulator as item separator and comma as decimal separator). In detail, the following data items are stored: CSV data Time x-pos y-pos z-pos road richt rdist rspur ralpha Dist Speed Brk Acc Clutch Gear RPM HWay DLeft DRight Wheel THead TTL TTC AccLat AccLon EvVis EvDist Err1No Err1Val Err2No Err2Val Err3No Err3Val current real-time in milliseconds since start of the drive. x-position of the vehicle in m. y-position of the vehicle in m. z-position of the vehicle in m. road number of the vehicle in [int]. direction of the vehicle on the road in [BOOL] (0/1). distance of the vehicle from the beginning of the drive in m. track of the vehicle from the middle of the road in m. direction of the vehicle compared to the road direction in degrees. driven course in meters since begin of the drive. actual speed in km/h. brake pedal position in percent. gas pedal position in percent. clutch pedal position in percent. chosen gear (0 = idle, 6 = reverse). motor revolution speed in 1/min. headway, distance to the ahead driving vehicle in m. Distance to the left road board in meter. Distance to the right road board in meter. Steering wheel position in degrees. time to headway, i.e. to collision with the ahead driving vehicle, in seconds. time to line crossing, time until the road border line is exceeded, in seconds. time to collision (all obstacles), in seconds. acceleration lateral, in m/s^2 acceleration longitudinal, in m/s^2 event-visible-flag/event-indication, 0 = no event, 1 = event. event-distance in m. number of the most important driving failure since the last data set (see list). state date belonging to the failure, content varies according to type of failure. number of the next driving failure (maybe empty). additional date to failure 2. number of a further driving failure (maybe empty). additional date to failure 3. 2 Error Log Files In addition to the data log files described above, you can also use the error log files, which are also written at the end of each ride. Their file names contain the driver’s name (if specified in the menu, or “ErrLog” otherwise) and the date and time of the ride. Beside of the driver’s name and the scenario, they do not contain any data not present in the data log files. Nevertheless, they may be useful because of their enhanced readability. The only list errors (and some other events) and also give a clear text description of each error. Error Numbers No. 1 2 3 4 5 6 7 8 9 10 11 12 13 14 15 16 17 18 19 20 21 22 23 24 25 26 27 28 29 30 31 32 33 34 35 36 37 38 Description Frontal collision Run into rear Accident Road border exceeded Red light disregarded Yellow light disregarded Too fast Right of way disregarded ! Light not switched on Not dimmed Not dimmed Indicator not activated for lane change Seat-belt not used Border exceeded Animal accident Not admissible gear shifting Gearbox destroyed Deviation from the ideal line: ... Ride cut short Vehicle turns over Overtaking on the wrong side Speed limits ignored Overtaking prohibition ignored Headway too short You are driving too slowly Wrong lane Wrong lane (opposite direction) The car drifts The car skids Dangerous overtaking manoeuvre too fast on crossroads Aquaplaning The car slides Lateral forces too high ! RPM too high Unnecessary hard braking. Engine stalled Wheels do not grip Comment during daytime at night value is deviation in m 3 39 40 41 42 43 44 45 46 47 48 49 50 51 52 53 54 55 56 57 58 59 60 61 62 63 64 Wheels are blocking Hand brake is still active You are braking with the left foot ! You braked too early ! You did not react ! You left the road You have endangered other road users Indicator not set in the correct way Driving on lay-by lane is prohibited You shifted the gears in the wrong sequence Performance rating: ... Your clutching was not smooth enough You are waiting too long You chose a gap which was too small You didn't follow the exercise Longitudinal forces are too high Declutching time too high Lateral forces in curve too low Reaction time: ... Stopping distance: ... Full beam not used Use the handbrake when changing to the reverse gear. Put the gearbox to the neutral position Laps - driving time: Laps - distance: Track deviation: 65 66 67 68 Wrong lane, stay on the left side ABS active Braking Distance: ... Average Consumption: ... 69 70 71 72 73 74 75 76 77 78 79 80 81 82 83 84 85 Driving time: ... Wrong lane, stay on your lane U-turn forbidden ! Braking Distance with ABS: Braking Distance without ABS: Stop-Sign disregarded You drove in the wrong direction You hit the border Time to line crossing too short. Time to Collision too short You endangered the car behind you You decelerate too late. Average consumption was too high: ... You drove too slowly Score: Stopping prohibited Pressure on brake: ... 86 Controlunit: ... value is performance rating number value is time in seconds value is distance in m value is lap driving time in s value is lap length value is track deviation value (c.f. performance rating) value is braking distance in m value is average fuel consumption in l/100km value is driving time in min. value is distance in m value is distance in m value is fuel consumption in l/100km value is a score number value is braking pedal position in percent. value is a number encoding the 4 pressed button(s) 87 88 89 90 91 92 93 94 95 96 97 98 99 100 101 102 Route lost Route finished Routing-Error You took too much distance for the trip ! You did a forbidden task during driving You ignored right of way and endangered other roadusers! Direction forbidden Direction forbidden in one-way street You reached your Destination! Scenario finished Speed: ... Recommended speed exceeded Backwards driving prohibited RPM too low clutch not used Manipulated by runtime command 103 104 105 106 107 108 109 110 End of ride Event started Event finished Engine overheated Reaction measurement failed Door not closed while driving Passenger not picked up Gap to the roadside too wide while boarding value is speed in km/h the scenario was influenced externally FOERST Driving Simulators Research Development Production Foerst GmbH Industriegelände 5 D-51674 Wiehl Tel.: 0049-2262-72970-0 Fax: 0049-2262-72970-12 Email: [email protected] Internet: www.drfoerst.de 09.07.2009 Driving Simulator F12 Software Update Procedure To install a software update, please follow these steps: 1.) Start up the simulator and wait, until the start-up procedure has completed. Please take the keyboard and the mouse connected to the simulation pc and sit down in front of the monitor(s) or projection screen(s). 2.) Now exit the simulation program: Use the control unit, enter the “Service” menu and select “Finish without Shutdown”. Please wait, until the Windows desktop is visible on all screens. 3.) Exit the “Virtpanel” program (dashboard). To this end, select the icon “Virtpanel” in the Windows task bar and press <Alt>+<F4>. 4.) Insert the Update CD in the CD rom drive of the simulation computer and start the setup program. Usually, the setup program starts automatically after inserting the CD and closing the drive lid. If the setup process does not start automatically, you have to start it manually: Open “My Computer” on the desktop, navigate to the CD rom drive and start “Install.exe” with a double click on the corresponding icon. 5.) The following dialog appears: 6.) After the integrity self test, the setup program starts with the following dialog. Click “Next”, accept the license agreement and again click “Next”. 2 7.) In the following wizard page, deactivate all items except “Main Program” and proceed with “Next”. . 8.) Now choose the target folder. Usually, you should not have to modify the default “C:\Pkw\”. Start the update process by selecting “Install”. 3 9.) After the installation process, click “Finish” to exit the setup program and restart the pc. If you have any questions, please don’t hesitate to ring us up.