1
pump off
pump Toff
u
k
pump off
pump off
pump off
pump off
pump off
valve: open
valve: open
valve: open
valve: closed
valve: open
valve: closed
valve: closed
valve: open
100
valve: closed
200
pump off
k
300
valve: open
valve: open
valve: open*
valve: open
valve: closed
valve: open
valve: closed
valve: closed
valve: open
100
valve: closed
valve: open
valve: open*
valve: open
valve: closed
valve: open
valve: closed
valve: closed
valve: open
valve: closed
200
T2d
400
pump off
k
valve: open
mote ADC
200
100
T1d
400
300
valve: open
mote ADC
300
mote ADC
400
0
11:00AM 12:00PM 1:00PM 2:00PM 3:00PM 4:00PM 5:00PM
0
11:00AM 12:00PM 1:00PM 2:00PM 3:00PM 4:00PM 5:00PM
3000
3000
3000
0
0
time
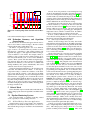
(a) Upstream Tu .
Cd
Cd
Cd
0
11:00AM 12:00PM 1:00PM 2:00PM 3:00PM 4:00PM 5:00PM
0
time
(b) Downstream before production valve
Td1 .
time
(c) Downstream after production valve Td2 .
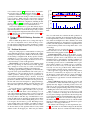
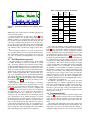
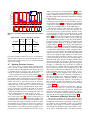
Figure 7. Flow presence detection results.
Detecting Pumpjack Operation
pump off
valve: open
valve: open
valve: open
valve: closed
valve: open
valve: closed
valve: closed
100
pump off
valve: open
200
valve: closed
mote ADC
pump off
valve: open
Previous evaluation shows flow presence detection by
temperature is effective. However, inferring blockage solely
on flow absence is not enough because regular pumpjack
shut-in too stops fluid flow (details in Section 2.1). To avoid
false alarms caused by these irrelevant temperature drop,
we use acoustic sensing to detect pumpjack status and later
apply the result on top of temperature. Next, we evaluate
acoustic algorithm accuracy and draw conclusions based on
the results.
We first evaluate the overall, pump-on and -off detection accuracies. The overall accuracy is high, 20 203 out of
23 129 events (defined by samples in Section 4.3) are correct
(87%) and the accuracy of detecting pump-on is even higher,
96%. However, the accuracy of detecting pump-off is 69%,
which is low compared to the other two metrics. Next, we visualize the algorithm output trace to investigate why pumpoff detection only works partially.
Pump-off detection is much less accurate than overall and
pump-on detection. To understand the difference, we need
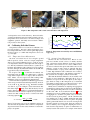
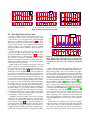
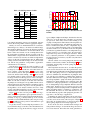
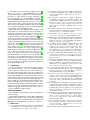
more information about why many pump-off samples trigger pump-on detection. Figure 10 visualize the details by
showing the acoustic amplification trace and algorithm outputs on mote. A red thick line in the upper plot indicates the
threshold (θ p ) we used in our field test. The high spikes follow every valve status change is because the relatively loud
noise generated by wrench-valve clanging is captured by the
acoustic sensor. One reason pump-off detection is not effective is that our acoustic algorithm runs with fixed threshold.
For example, the noise floor rises in the third pump-off period (4:30pm–4:58pm), triggering false positive under nowtoo-low threshold. We are currently working on making our
algorithm adaptive to cope with this situation. In addition
to an adaptive algorithm, this result suggests that filtering
noise during pump-off may too improve pump-off accuracy
(or overall). To verify if noise-filtering helps, we next apply
our algorithm to a cleaner dataset by PC.
We find the easiest way to improve the accuracy of pumpoff detection is to upgrade the hardware for acoustic measurement, because the same algorithm works perfectly on PC
acoustic dataset. Figure 11 shows the same experiment as
forgoing but collected by PC microphones. We take six minutes of the data, covering the first pump-on/-off transition to
configure the threshold, with the same auto-configuration algorithm. The end detection result is encouraging, with 100%
acoustic
θp
300
0
11:00AM 12:00PM 1:00PM 2:00PM 3:00PM 4:00PM 5:00PM
on
P*o
4.6
off
time
Figure 10. Acoustic pumpjack status detection result by
mote. Pump status is denoted at the top of both plots.
Dashed/dotted vertical lines indicate the production valve
is open/closed. The tags “valve” means the production
valve.
accuracy. We study the hardware difference helping PC microphone collect better data with higher SNR for future mote
improvement guidance. We focus on the three most important stages in line with converting raw vibration to digital signal: microphone, preamplifier and analog/digital converter
(ADC). After comparing the specifications, we find that PC
beats mote microphone in all the three stages. First, although
mote microphones have higher sensitivity (-45 dB, [46]) than
the one with PC (-54 dB, [44]), but PC microphone has a
much smaller resistance (1 kΩ against 2.2 kΩ, potentially
able to produce larger current under the same sound pressure. Second, our PC has better preamplifier embedded in its
sound card, SoundMAX AD1988A [43] than mote does [42].
For example, the former has higher input impedance but
lower total harmonic distortion. Finally, the ADC on the
microcontroller of our motes have a much lower resolution,
10-bit comparing to PC sound card’s 24-bit resolution. In
short, all these differences results in better quality of PC data
with larger SNR than the ones collected by our acoustic mote
system.
In this section, we evaluated our acoustic mote for pumpjack status detection. We further applied the same algorithm
to PC acoustic data to provide more complete verification of
our acoustic detection approach. Based on experiment results, we conclude that our mote acoustic detection system