1
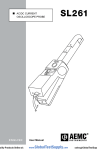
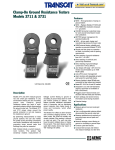
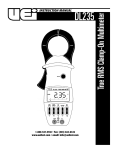
I
721
CLAMP-ON HARMONIC METER
HOL
OFF
~
A
~
V
11/03
99-MAN 100066 v2
Mod
el 72
HAR
–
MON
P
REC
ORD SMO
IC M
-PAU OTH
ETE
SE
R
MAX RANGE
MIN
!
AVG HOLD
+
0
D
1
MIN
MAX
PE
SMO AK
OTH
COM
4
ENGLISH
5
AV
RMS
600 PEAK
AV
Hz
RAN
GE
600V
+
Chauvin Arnoux®, Inc. d.b.a. AEMC® Instruments
15 Faraday Drive • Dover, NH 03820 USA • Phone: (603) 749-6434 • Fax: (603) 742-2346
www.aemc.com • www.chauvin-arnoux.com
%TH F
Hz C D
F
2
3
!
1
User Manual
THD
D
TABLE OF CONTENTS
1. INTRODUCTION ..............................................................3
1.1 Receiving Your Shipment..........................................................4
1.2 Ordering Information.................................................................4
2. PRODUCT FEATURES .....................................................5
2.1 Description................................................................................5
2.2 Control Features .......................................................................7
2.3 Digital Display Features............................................................8
2.3.1 Display and Error Indications........................................9
3. SPECIFICATIONS ..........................................................10
3.1 Electrical Specifications ..........................................................10
3.2 General Specifications............................................................12
3.3 Mechanical Specifications ......................................................12
3.4 Safety Specifications ..............................................................13
4. UNDERSTANDING ELECTRICAL HARMONICS .............14
4.1 Detection and Measurement...................................................20
4.2 Effects on the System.............................................................21
4.3 Transformer Derating..............................................................22
4.4 Meter Readings ......................................................................23
4.5 Crest Factor ............................................................................23
4.6 Limiting the Effects of Harmonics ...........................................24
5. OPERATION ..................................................................25
5.1 Current Measurements ..........................................................25
5.1.1 Ranging ......................................................................26
5.1.2 Analog Output – Vout..................................................26
5.1.3 Other Functions ..........................................................26
5.1.4 Bargraph .....................................................................26
5.2 Voltage Measurements ...........................................................27
5.2.1 Ranging ......................................................................28
5.2.2 Other Functions ..........................................................28
5.2.3 Bargraph .....................................................................28
5.3 THD Push Button: Power Quality Measurements...................29
5.3.1 %THD: Total Harmonic Distortion ...............................29
5.3.2 %DF: Distortion Factor ..............................................31
5.3.3 CF: Crest Factor .........................................................32
5.3.4 Bargraph .....................................................................32
5.4 Range Push Button: Manual Ranges .....................................33
5.5 Hz Push Button: Frequency Measurement.............................34
5.6 Peak/Smooth Push Button......................................................35
5.6.1 Smooth .......................................................................35
5.6.2 Peak............................................................................36
5.7 MIN/MAX Push Button: Recording Function...........................36
5.8 Vout – Analog Output..............................................................38
5.8.1 Output Level ...............................................................39
5.9 Summary of Accessible Functions..........................................39
5.10 Auto-Off Feature .....................................................................40
5.11 Troubleshooting ......................................................................40
6. MAINTENANCE .............................................................41
6.1 Cleaning..................................................................................41
6.2 Battery Test & Replacement ...................................................41
6.2.1 Battery Replacement ..................................................42
Repair and Calibration...........................................................................43
Technical and Sales Assistance ............................................................43
Limited Warranty ...................................................................................44
Warranty Repairs...................................................................................44
CHAPTER 1
INTRODUCTION
Warning
These safety warnings are provided to ensure the safety of personnel and
proper operation of the instrument.
• Read this instruction manual completely before attempting to use or service this instrument and follow all the safety information.
• Use caution on any circuit: Potentially high voltages and currents may be
present and may pose a shock hazard.
• The meter must not be operated beyond its specified operating range.
• Safety is the responsibility of the operator.
• Never open the back of the meter while connected to any circuit or input.
• Always make connections from the instrument to the circuit under test.
• Always inspect the instrument and accessory leads for serviceability prior
to use, and replace defective parts immediately.
• Do not use the meter or any test leads, BNC leads, connectors, probes or
clips if they look damaged.
• Never use the meter on electrical conductors rated above 600Vrms.
International Electrical Symbols
This symbol signifies that the instrument is protected by double or
reinforced insulation. Use only specified replacement parts when
servicing the instrument.
This symbol on the instrument indicates a WARNING and that
the operator must refer to the user manual for instructions before
operating the instrument. In this manual, the symbol preceding
instructions indicates that if the instructions are not followed, bodily
injury, installation/sample and product damage may result.
Risk of electric shock. The voltage at the parts marked with this
symbol may be dangerous.
Harmonic Meter Model 721
3
1.1
Receiving Your Shipment
Upon receiving your shipment, make sure that the contents are consistent with the packing list. Notify your distributor of any missing items. If
the equipment appears to be damaged, file a claim immediately with the
carrier and notify your distributor at once, giving a detailed description of
any damage. Save the damaged packing container to substantiate your
claim.
1.2
Ordering Information
Harmonic Meter Model 721 ............................................... Cat. #1208.52
Includes a 9V battery, two 5 ft (1.5m) leads, two test probes, two grip
probes, one insulated banana to BNC connector, a user manual and a
hard carrying case.
4
Harmonic Meter Model 721
CHAPTER 2
PRODUCT FEATURES
2.1
Description
The Harmonic Meter Model 721 combines the simplicity and familiarity
of digital clamp-ons with today’s critical information on power quality and
harmonics.
Operation is simple and direct, with no menus, calculations or complex
analyzer procedures. Select Amps or Volts on the rotary dial, connect, and
measure. The push of a button gives additional or more specific information. You can troubleshoot and measure power quality with the ease of
using a digital clamp-on — simply, safely, and economically.
The Model 721 performs current and voltage measurements in True RMS,
and provides immediate readings of total harmonic distortion (%THD), distortion factor (%DF), crest factor (CF) and Peak of distorted currents and
complex voltages. It also gives the minimum, maximum, maximum Peak
and average measurement values so you can record for over 24 hours to
monitor daily fluctuations. And, you can measure frequency (Hz) through
either the current or the voltage at any time.
In addition, the instrument’s analog output allows display of the current
waveforms on any oscilloscope or hand-held scope while measuring; or
the output may be used for loggers and recorders.
The Model 721 incorporates True RMS electronics and measurement
techniques to ensure correct and accurate readings on distorted waveforms. Use the Model 721 as a comprehensive tool for troubleshooting
as well as for daily measurements on circuits supplying traditional and
today’s nonlinear loads.
Beyond the absolute product ruggedness and overall design qualities
—the Model 721 is built with GE Lexan® and meets specific physical
standards — the instrument features a high level of safety. The Model 721
meets IEC 1010-1 Category III for 600 V ratings.
Harmonic Meter Model 721
5
The Model 721 is comfortable to hold, compact and easy to maneuver in
crowded breaker panels. The hooked jaw design facilitates clamping and
accommodates two 500 MCM conductors.
The AEMC Harmonic Meter Model 721 works as easily as a clamp-on multimeter, while permitting True RMS voltage and current measurements.
The rotary switch selects the volt or ampere range and, beneath the large
LCD, five push buttons provide direct access to additional key measurement and power quality values.
The Model 721 high sensitivity accepts low input levels (300 mA and 300
mV) permitting power quality measurements on even low power or idling
equipment — an advantage not common to many instruments.
6
Harmonic Meter Model 721
2.2
Control Features
�
����
�
�
���
�
�
�
�
�
���������
��������������
�
�
� ������ ����� ����
���������������������������
�
��
����
�� ��
�
��
�
�
�
�
�
�
���
����
���
��
���
����
��� ������
�
��
�����
���
�
�
����
�
�
���
�
��
��
1. Jaw assembly
Transformer jaws opens to 1.7" (43 mm)
Accepts two 500 MCM
2. Lever/Trigger
Opens or closes jaws
3. Display
Liquid crystal display, 9999 count
4. Min/Max
Selects Record mode for A, V, %THD, %DF, CF, Hz
Accesses the following values: Max, Min, AVG
Harmonic Meter Model 721
7
5. Peak/Smooth
Accesses the following modes:
• Smooth for 3-second averaging for easy readings on fluctuating
signals.
• Peak measurement values (1 ms) for A and V
6. Hold/Data Hold
• Freezes last measured value on display
• Does not freeze bargraph or analog output
7. Rotary selection switch
OFF, Amps/Vout, Volts
8. Hz
Selects frequency measurement (A or V input)
9. THD
Accesses (in A or V) the following measurement modes:
• %THD (Total Harmonic Distortion referenced to the fundamental)
• %DF (Distortion Factor: THD referenced to RMS)
• CF (Crest Factor)
10. Range
Selects Auto Ranging or Manual Ranging measurement ranges
(A or V)
11. Voltage Jacks and Analog Output Vout
“COM” : black
“+” : red
2.3
Digital Display Features
�
�
� ������ ����� ����
���������������������������
��
����
�� ��
�
��
�
�
�
�
�
�
���
����
���
��
�
The combination digital/analog display gives measurements on a large
9999 count (33⁄4 digit) LCD display. A fast responding analog bargraph
display provides indications for trends or surges.
A
Displayed when instrument is measuring TRMS amperes
V
Displayed when instrument is measuring TRMS voltage
8
Harmonic Meter Model 721
Indicates that internal battery requires replacement
SMOOTH
Indicates three second measurement averaging to
smooth fluctuating signals
RANGE
Displayed during manual range selection
HOLD
Displayed when Hold function is activated
RECORD
Blinks (1/second) during record mode
PAUSE
Interrupts recording mode when Hold is activated in the
Record Mode
MAX
Displays maximum measurement value
MIN
Displays minimum measurement value
AVG
Displays average measurement value
%THD
% Total Harmonic Distortion
%DF
% Distortion Factor
CF
Crest Factor
PEAK
Peak (1 ms) measurement (MAX Peak is available in
the recording mode)
Auto-Off feature disabled
Bargraph
Analog bargraph for trend measurements A or V and
remaining battery life at power-up
2.3.1 Display and Error Indications
OL-–––
Input overload: > 999.9 V peak or > 999.9 A peak
Input signal below measurement range
Input exceeds safety, measurement or operating range. The warning triangle is accompanied by a beeping alarm. Discontinue measurement and refer to the specific function and specification section
in user manual.
Please note that the warning triangle will also be displayed if the
input signals are too low, or if the fundamental signal is not 50 or
60Hz.
Harmonic Meter Model 721
9
CHAPTER 3
SPECIFICATIONS
3.1
Electrical Specifications
Reference Conditions: Accuracies are provided under the following reference conditions:
Temperature 23°C ± 5K, 45% to 75% RH; battery voltage 8.5V to 9V; conductor centered in
the probe jaws; DC magnetic field: earth’s field; no external AC magnetic field; no external
electrical field; sine wave 45 to 65 Hz. In Peak, basic accuracy is based on 1 ms samples and
on a signal from 10 to 500 Hz. In THD and DF, the basic accuracy is provided for a square
wave and a triangular wave with 50% duty cycle at 50 or 60 Hz. R refers to Reading and ct(s)
to count(s). Counts may also be referred to as the least significant digits (LSD).
CURRENT (TRMS)
Input Range: 0.05 to 700.0 Arms (±999.9 A Peak)
Basic Accuracy: 0.3 to 99.99 A: 2% R ± 20 cts
100.0 to 400.0 A: 2% R
400.0 to 700.0 A: 5% R
Crest Factor: >3.0 below 300 A
Frequency Range: 15 Hz to 10 kHz
CURRENT (PEAK)
Input Range: 0.05 to ± 999.9 A Peak
Basic Accuracy: 0.05 to 99.99 A: 3% R ± 30 cts
100 to 600 A: 3% R
600 to 999.9 A: 8% R
VOLTAGE (TRMS)
Input Range:
0.05 to 600 Vrms (± 1200 V Peak)
Basic Accuracy: 0.3 to 400.0 V: 1.5% R ± 4 cts
400.0 to 999.9 V: 1.5% R
Crest Factor: >4.0 below 300 V
Input Impedance: 1 MΩ, 47 pF
Frequency Range: 15 Hz to 10 kHz
10
Harmonic Meter Model 721
VOLTAGE (PEAK)
Input Range: 0.05 to 999.9 V Peak
Basic Accuracy: 0.05 to 99.99 V: 3% R ± 30 cts
100 to 999.9 V: 3% R
TOTAL HARMONIC DISTORTION (%THD)
Range: 0.5% to 600.0%
Resolution: 0.1%
Minimum Input: 300 mA, 300 mV
Basic Accuracy (50/60 Hz): 3% ± 2 cts
Frequency Range: Fundamental 45 to 65 Hz, 25th harmonic
Display: Digital - %THD; Bargraph - True RMS (A or V)
DISTORTION FACTOR (%DF)
Range: 0.5% to 100%
Resolution: 0.1%
Minimum Input: 300 mA, 300 mV
Basic Accuracy (50/60 Hz): 3% R ± 2 cts
Frequency Range: Fundamental 45 to 65 Hz, 25th harmonic
Display: Digital - %DF; Bargraph - True RMS (A or V)
CREST FACTOR (CF)
Range: 1.00 to 10.00
Resolution: 0.01
Minimum Input: 300 mA, 300 mV
Accuracy (40 to 450 Hz): 10% ± 3 cts
Frequency Range: 15 Hz to 10 kHz
Display: Digital - CF; Bargraph - True RMS (A or V)
FREQUENCY (Hz)
Range: 0.5 to 9999 Hz
Minimum Input: 1 A or 1 V
Accuracy: 0.5 Hz to 999.9 Hz: 0.1% R ± 1 ct
1000 Hz to 9999 Hz: 0.2% R ± 1 ct
Display: Digital - Hz; Bargraph - True RMS (A or V)
Harmonic Meter Model 721
11
ANALOG OUTPUT (Vout)
Range: 1 mV/A (0.05 to 700 Arms) or,
10 mV/A (0.05 to 60 Arms)
Basic Accuracy: 3%
Input: 0.05 A to 999.9 A Peak
Output Impedance: 4 kΩ, 47 pF
Display: Digital - all A and THD functions; Bargraph - Arms
3.2
General Specifications
Power Source: 9 V Alkaline battery (NEDA 1604, 6LF22, 6LR61)
Power Source Life: 50 hr continuous use approx
Dimensions: 10 x 3.8 x 1.7” (254 x 97 x 44 mm)
Weight: 1.3 lb (600 g)
Display: Quadriplexed LCD with 12.5 mm digits; 33⁄4 digits, 9999cts
Temperature:
Operating: +14° to 131°F (-10° to +55°C)
Storage: -40° to 158°F (-40° to +70°C)
Humidity:
Operating: 0 to 80% RH to +40°C (50% RH @ +55°C)
Storage: 0 to 95% RH
Material:
Case: Gray Lexan® 920A, UL 94 V2
Jaws: Red Lexan® 500R, 10% fiberglass, UL 94 V0
LCD lens: Crystal Lexan® 920A, UL 94 V1
Altitude:
Operating: 2000 m (6500 ft)
Storage: 5000 m (16,000 ft)
3.3
Mechanical Specifications
Envelope Protection: IEC 529: IP 40
Drop Test: IEC 68-2-32: 1m
Vibration: IEC 68-2-6
Shocks: IEC 68-2-27
12
Harmonic Meter Model 721
3.4
Safety Specifications
Protection Level:
Double insulation; IEC 1010-1, 600 V Category III, Pollution degree 2.
Working Voltage: 600 Vrms
Dielectric Test: 5.5 kV, 50/60 Hz, 1 minute
Overload Protection:
Voltage: 1.5 kV Peak permanent
Current: 3000 A AC permanent
Analog output: 1.5 kV Peak permanent
Agency Approvals: UL®, CSA, GS, VDE
ELECTROMAGNETIC COMPATIBILITY
Electrostatic Discharge:
IEC 801-2: No influence: 4 kV class 2
Non-destructive: 15 kV class 4
RF:
IEC 801-3: No influence: 3 V/m class 2
Minor influence: 10 V/m class 3
Transients: IEC 801-4: No influence: 2 kV class 4
Electric shocks: IEC 801-5: No influence: 1 kV class 3
Harmonic Meter Model 721
13
CHAPTER 4
UNDERSTANDING
ELECTRICAL HARMONICS
Until fairly recently, power quality referred to the ability of the electric
utilities to supply electric power without interruption. Today, the phrase
encompasses any deviation from a perfect sinusoidal waveform. Power
quality now relates to short-term transients as well as steady state distortions. Power system harmonics are a steady state problem with dangerous results. Harmonics can be present in current, voltage, or both. Within
the next few years, as many as half of all electrical devices will operate
with nonlinear current draw.
Utility companies invest millions of dollars each year to ensure that voltage
supplied to their customers is as close as possible to a sinusoidal waveform. If the power user connects loads to the system which are resistive,
such as an incandescent light bulb, the resulting current waveform will
also be sinusoidal. However, if the loads are nonlinear, which is typically
the case, the current is drawn in short pulses and the current waveform
will be distorted. Total current that is then drawn by the nonlinear load
would be the fundamental as well as all the harmonics.
�����������
�
������������
�
����������������������������
Harmonic distortion can cause serious problems for the users of electric
power, from inadvertent tripping of circuit breakers to dangerous overheating of transformers and neutral conductors, as well as heating in motors
and capacitor failure. Harmonics can cause problems that are easy to
recognize but difficult to diagnose.
It is becoming increasingly important to understand the fundamentals of
harmonics, and to be able to recognize and monitor the presence of damaging harmonics. Harmonics within an electrical system vary greatly within
different parts of the same distribution system and are not limited simply
14
Harmonic Meter Model 721
to the supply of the harmonic-producing device. Harmonics can interact
within the system through direct system connections or even through
capacitive or inductive coupling.
A harmonic may be defined as an integer multiple of a fundamental frequency. Harmonics are designated by their harmonic number. For our
discussion, we will focus on the 60 Hz power frequency. The second harmonic would be two times the fundamental or 120 Hz. The third would be
three times the fundamental or 180 Hz, and so on.
Nonlinear equipment generates harmonic frequencies. The nonlinear
nature of a device draws current waveforms that do not follow the voltage
waveform. Electronic equipment is a good example. While this is a broad
category that encompasses many different types of equipment, most of
these devices have one characteristic in common: They rely on an internal
DC power source for their operation.
LOADS WHICH PRODUCE HARMONIC CURRENTS:
• Electronic lighting ballast
• Adjustable speed drives
• Electric arc furnaces
• Personal computers
• Electric welding equipment
• Solid state rectifiers
• Industrial process controls
• UPS systems
• Saturated transformers
• Solid state elevator controls
• Medical equipment
This is by no means an exhaustive list of equipment which generate harmonics. Any electronic-based equipment should be suspected of producing harmonics.
Due to the ever increasing use of electronics, the percentage of equipment which generates harmonic current has increased significantly. The
harmonic problem manifests itself with proliferation of equipment using
diode-capacitor input power supplies. This type of equipment draws current in a short pulse only during the Peak of the sine wave. The result of
this action, aside from improved efficiency, is that high frequency harmonics are superimposed onto the fundamental 60 Hz frequency.
The harmonics are produced by the diode-capacitor input section which
rectifies the AC signal into DC. The circuit draws current from the line only
during the peaks of the voltage waveform, thereby charging a capacitor to
the Peak of line voltage. The equipment DC requirements are fed from this
capacitor and as a result the current waveform becomes distorted.
Harmonic Meter Model 721
15
Harmonics in the electric power system combine with the fundamental
frequency to create distortion. The level of distortion is directly related to
the frequencies and amplitudes of the harmonic current. The contribution
of all harmonic frequency currents to the fundamental current is known as
“Total Harmonic Distortion”
or THD. This THD value is
�������
expressed as a percentage
of the fundamental current.
THD values of over 10%
are reason for concern.
�������
THD is calculated as the
square root of the sum of
the squares of all the harmonics divided by the fun����������������������
damental signal (50 or 60
Hz). This calculation arrives
at the value of distortion as a percentage of the fundamental.
Mathematically, %THD is the ratio of the root-mean-square (RMS) of the
harmonic content to the root-mean-square (RMS) value of the fundamental 50 or 60 Hz signal. THD is expressed as a percentage, and may be
greater than 100%.
Total Harmonic Distortion
������
���������������������������������������������
�����������������������������������
����������������
�����
�����������������������������������������
���������������� �����������������������������������������
Wherever there are large numbers of nonlinear loads, there are sure to
be harmonics in the distribution system. Harmonic-producing equipment
is found in varied locations from administrative offices to manufacturing
facilities. In the factory environment, electronic power converters such as
variable speed drives, SCR drives, etc., are the largest contributors to harmonic distortion. It is not uncommon to have THD levels as high as 25%
within some industrial settings.
16
Harmonic Meter Model 721
Most single-phase office equipment draws nonlinear current. While fluorescent lighting with electronic ballasts and many types of office equipment contribute to creating harmonics, personal computer power supplies
are the largest contributor of harmonics within the office environment.
Although THD levels will be lower than in an industrial setting, the susceptibility of office equipment to variations in power quality is extremely high.
������������
Computer Current Waveform
In the industrial environment, there can be many three-phase, nonlinear
loads drawing high levels of load current. The most prevalent harmonic
frequencies are the odd integer multiples of the 60 Hz frequency. The third
harmonic (180 Hz) is always the most prevalent and troublesome.
In general, even harmonics cancel out and are negligible. The largest
single current draw for ballasts is the third harmonic. Triplens (odd
multiples of the third harmonic) are typically the dominant harmonics and
are most common in single-phase, nonlinear loads. The fifth and seventh
harmonics are dominant generally in motor drives.
Large commercial buildings have many different sizes and types of loads.
In most installations the power is distributed with 208/120 volt transformers in a Delta-Wye configuration. When multiple loads are supplied, each
generates triplen harmonic currents on the neutral conductor which are
sent on to the transformer secondary and reflected into the delta primary.
These currents circulate within the delta primary causing overheating and
shortened service life.
���������
�����������
�
��
��
�
�������
���������
��
�
�������
Delta Primary, Circulating Current
Harmonic Meter Model 721
17
Harmonics can cause a variety of problems to any electrical power user.
For large users, the problems can be intense. For electronic equipment
that relies on the zero crossing of the sinusoidal waveform, such as clock
timing devices, heavy harmonic content can cause a zero crossing point
offset.
Odd number harmonics (3rd, 5th, & 7th) cause the greatest concern in
the electrical distribution system. Because the harmonic waveform usually swings equally in both the positive and negative direction, the even
number harmonics are mitigated.
Heating effect causes the greatest problem in electrical equipment. Many
times, electrical distribution equipment has overheated and failed even
when operating well below the suggested rating requirements. Temperature increase is directly related to the increase in RMS current.
Because harmonic frequencies are always higher than the 60 Hz fundamental frequency, “skin effect” also becomes a factor. Skin effect is a phenomenon where the higher frequency causes the electrons to flow toward
the outer sides of the conductor, effectively reducing the cross-sectional
diameter of the conductor and thereby reducing the ampacity rating of the
cable. This effect increases as the frequency and the amplitude increase.
As a result, higher harmonic frequencies cause a greater degree of heating in conductors.
On balanced three-phase systems with no harmonic content, the line currents are 120 degrees out-of-phase, canceling each other and resulting in
very little neutral current. However, when there is distortion in any one of
the phase currents, the harmonic currents increase and the cancellation
effect is lessened. The result is typically a neutral current that is significantly higher than planned. The triplen harmonics (odd multiples of three)
are additive in the neutral and can quickly cause dangerous overheating.
In theory, the maximum current that the neutral will carry is 1.73 times
the phase current. If not sized correctly, overheating will result. Higher
than normal neutral current will cause voltage drops between neutral and
ground which are well above normal. Readings above 4 volts indicate high
neutral current.
False tripping of circuit breakers is also a problem encountered with the
higher frequencies that harmonics produce. Peak sensing circuit breakers
often will trip even though the amperage value has not been exceeded.
Harmonic current Peak values can be many times higher than sinusoidal
waveforms.
18
Harmonic Meter Model 721
Power factor correction capacitor failure in many cases can be directly
attributed to harmonic content. Capacitors appear as extremely low impedance values and are more susceptible to harmonics. Inductive reactance
varies directly with frequency (XL=2pfl). Parallel resonance between the
capacitor bank and the source impedance can cause system resonance
resulting in higher than normal currents and voltages. High harmonic currents have been known to overheat correction capacitors, causing premature failure and sometimes resulting in explosion.
������������������
������������
���������������
����������
�����
����������
����������
����������
�������
Power Factor Capacitors at Resonant Frequency
Most harmonic problems result when the resonant frequency is close to
the 5th or 7th harmonic. These happen to be the largest harmonic amplitude numbers that adjustable speed drives create. When this situation
arises, capacitor banks should be resized to shift the resonant point to
another frequency.
Another useful parameter is the Distortion Factor, or %DF. %DF is the
Total Harmonic Distortion referenced to the total RMS signal.
The Distortion Factor is expressed as a percentage, and may not be
greater than 100%. We provide this term because of the market need and
the requirement of this value under the international standard IEC-555.
Mathematically, %DF is the ratio of the root-mean-square(RMS) of the
harmonic content to the root-mean-square (RMS) value of the total signal,
and expressed as a percentage.
Harmonic Meter Model 721
19
Distortion Factor
�����
���������������������������������������������
���������
�����
���������������
��������������������������������������������
���������������
�������������������������������������������
Please note that our %DF is not the same value as the Distortion Factor
as expressed in the IEEE standard 519-1992 (in which Distortion Factor
is same as THD).
4.1
Detection and Measurement
Harmonic analysis is the first step in alleviating the many problems that
can be encountered. Field measurements are performed to identify frequency and magnitude. An important factor to remember is that most
distribution systems are designed specifically to carry 60 Hz. To begin
identifying a possible harmonics problem, take an inventory of equipment
that may generate harmonic currents (e.g. electronic equipment, fluorescent lighting fixtures with electronic ballasts, variable speed motors, etc).
List the nonlinear loads which are on each branch circuit. The electrical
panel is the point at which most nonlinear harmonic problems can be
detected. Excessive current flow on the neutral can be detected with a
True RMS current meter, but may also be indicated by a resonant buzzing
sound or even visually with discolored connections on the neutral buss.
Beginning at the service entrance panel, measure and record the True
RMS current in each phase, as well as the neutral of the distribution transformer secondary. Compare this measured neutral current to the anticipated current due to phase imbalance. If the phase currents are equal, the
vector sum of the neutral currents will add to zero. If excessive amounts
of triplen harmonics are present in the neutral, neutral current may exceed
phase current. Consult the NEC® for the maximum ampacity for each of
the conductors that have been tested.
20
Harmonic Meter Model 721
Measure each feeder for harmonic content. A high degree at
this location is often heard as a
buzzing sound. A voltage THD
reading is also useful at this location.
IEEE standard 519-1992 is a
guidance document for utilities
and electric power users which
specifies both the maximum distortion levels and recommended
correction levels. The harmonic
distortion limit of 5% is proven
to be the point where harmonics begin to have a detrimental
effect on an electrical distribution
system.
��������������������������
�������������������������
Harmonic current measurements define the harmonic generating characteristics of the load, so measurements should be taken at the load when
possible. Voltage measurements define the system response and are usually taken at the individual busses.
4.2
Effects on the System
To compound the problems that harmonic currents present to the system,
the nonlinear harmonic load currents also have an Ohm’s Law relationship
with the source impedance of the system to produce voltage harmonics.
Consider a heavily loaded transformer that is affected by one branch circuit feeding a nonlinear load; the resulting voltage harmonics can then be
passed down to all the remaining circuits fed by that transformer.
Voltage harmonics may cause havoc within the electrical system. Motors
are typically considered to be linear loads; however, when the source voltage supply is rich in harmonics, the motor will draw harmonic current. The
result is typically a higher than normal operating temperature and shortened service life.
Different frequency harmonic currents can cause additional rotating fields
in the motor. Depending on the frequency, the motor will rotate in the opposite direction (counter-torque). The fifth harmonic, which is very prevalent,
is a negative sequence harmonic causing the motor to have a backward
rotation, shortening the service life.
Harmonic Meter Model 721
21
Noise can be picked up in communication equipment and telephone
systems when harmonics at audio or radio frequencies are inductively or
capacitively coupled into communication or data lines.
When induction-disc watt-hour meters are monitoring nonlinear loads,
depending on the content of the harmonics, the disk may run slower or
faster, resulting in erroneous readings.
4.3
Transformer Derating
Most generators and transformers base their operating characteristics on
non disturbed 60 Hz waveforms. When the waveforms are rich in harmonics,
shortened service or complete failure is sure to follow.
The derating K factor can be applied specifically to transformers to ensure
that dangerous heating will not result due to the transformer supplying load
currents which are rich in harmonic content.
The K factor is determined by measuring the True RMS current of each harmonic, multiplied by the harmonic order and squared. The total sum of this is
then multiplied by the eddy current losses. Transformer parasitic heating due
to harmonic currents is frequency-dependent; higher frequency harmonic currents cause a higher degree of transformer heating and failure.
The K factor can be thought of as an index of the transformer’s ability to
handle nonlinear load current without abnormal heating. Some distribution
transformers today are being designed with magnetic cores and windings to
accommodate harmonic contents.
A K-rated transformer is specifically designed to handle nonlinear loads. The
higher the K factor value, the better the ability of the transformer to handle
nonlinear loads.
IEEE C57.110-1986 is a prescribed procedure used to derate the transformer
loading based on the specific harmonic content. Each specific electrical application is unique in type and amount of harmonic interaction.
IEEE C57.12.00-1987 has proposed a limit of 5% for transformer harmonic
current factor.
An alternate method for derating transformers is available for buildings which
supply single-phase, 120 V receptacles. This method is established by The
Computer & Business Equipment Manufacturers Association (CBEMA).
CBEMA Derating Factor =
22
1.414
Crest Factor
Harmonic Meter Model 721
4.4
Meter Readings
Harmonic problems can be analyzed more easily with the proper test equipment.
The term “True RMS”, or Root-Mean-Square, relates to the equivalent DC
heating value of the current or voltage waveform. If, for example, we apply a
pure sine wave and a distorted sine wave to a resistive load, the point where
they both create the same heating value is the point where they both have the
same RMS value.
True RMS capability is required to accurately measure systems where harmonic current is present. Average responding instruments will yield erroneous
measurement results from 25-40% below the actual value when harmonic
distortion is present.
Many instruments on the market measure average or Peak values of a
waveform and internally multiply by 1.11 or .707 respectively to indicate RMS
values. These devices work well when measuring a pure sine wave.
Instruments with True RMS converters sample the waveform at many different
points and provide accurate readings on distorted waveforms. Microprocessor-based circuits sample, digitize and square each sample, add it to the previous sample squared and take the square root of the total. This process will
yield a True RMS value regardless of the amount of distortion.
4.5
Crest Factor
The crest factor is the ratio of the Peak value of the sinusoidal waveform
to its RMS value.
Crest Factor (CF) =
Peak Value
RMS value
Crest factor indicates the level of peaking
that an instrument can handle without errors
in the measurement. For a perfect sine wave
the crest factor would be 1.414. This relates
to the Peak amplitude that an instrument
is capable of measuring accurately. Typical crest factor ratings are from 2.0 to 6.0.
The higher the factor, the more capable the
instrument of measuring a complex waveform
correctly. When harmonics are present crest
factors may be less than (CF of a square
wave = 1) or greater than 1.414.
Harmonic Meter Model 721
����������
���������
�������
�����
����������������
�������������������������
23
4.6
Limiting the Effects of Harmonics
Derating certain types of electrical equipment is the easiest way to limit the
effects that the increased heating has on the equipment. A 25% derating
for transformers and generators is commonly employed in industry.
Filtering is currently the most common method used to limit the effects
that harmonics present to the rest of the system. Filters typically consist
of tuned series L-C circuits. Filter impedance is negligible with respect to
the rest of the system, limiting its interaction effects for harmonic control.
Filters are sized to withstand the RMS current as well as the value of current for the harmonics.
In the future, systems may be available which will offset harmonics by
applying signals that are equal in amplitude but opposite in phase, thereby
canceling or severely limiting harmonic effects.
�����
�
�
�
�������
���������
����
�������������������������
24
Harmonic Meter Model 721
CHAPTER 5
OPERATION
5.1
Current Measurements
���������
����
��������������
�� � � � � � � � � �
���
����
�
�
���
�
�
�
�
�
�
�
�
�
��
�
���
����
��� ������
�
���
��
�����
����
�
���
1. Turn the rotary switch to the current measurement function A~.
Selection is confirmed with a short beep.
2. Press the trigger to open the jaws. Clamp the jaws around the conductor. The most accurate readings are obtained with the conductor
aligned with the centering marks on the jaws.
3. Take the reading from the display. Current measurements are possible from 50 mA to 700.0 Arms, and to 999.9 A Peak.
WARNING
Although the meter can display up to 999.9 A in Auto Range and in the 600
A manual range, the warning symbol will be displayed above 700 Arms
and accompanied by a beeping alarm sound. This indicates that the input
exceeds the specified safety and operating range. The displayed value is
only indicative and not specified.
Do not continue to operate the instrument when the input value
exceeds the meter safety and operating specifications.
OL is displayed above 1000 A peak in the Peak mode and may also be
accompanied by the warning triangle if the RMS value exceeds 700 A.
The warning symbol may also be displayed if the input signal is too low
(<50 mA) or if the fundamental signal is not 50 or 60 Hz.
Harmonic Meter Model 721
25
5.1.1 Ranging
Auto Ranging is selected by default and selects the best range for the
digital display and for the analog bargraph.
Pushing the RANGE push button selects a fixed manual range: 60 Arms
first, and 600 Arms on the second push.
The digital display and the bargraph indicate the selected range. RANGE
is displayed at the top of the display indicating a manual range selection.
Selection is also confirmed with audible tone.
To sequence back to Auto Ranging, push and hold the RANGE push
button for approximately 3 seconds. The displayed RANGE indicator will
disappear, confirmed with an audible tone.
5.1.2 Analog Output – Vout
In the Current Measurement mode, the Analog Output Vout is always activated in A~ (see § 5.8) and the 10 mV/A (or 100 mV/A) signal is present
at the voltage terminals.
5.1.3 Other Functions
All others push-button functions relating to current may be accessed in A:
• THD (%THD, %DF, CF)
• HZ
• PEAK/SMOOTH
• MIN/MAX recording
These functions are described further in this manual (see p. 16-24).
5.1.4 Bargraph
Please note that the analog bargraph will continue to display RMS current values while other measurement functions are displayed (e.g. %THD,
%DF, CF, Hz, Min/Max, Smooth, Peak). The bargraph ranges are 60 Arms
and 600 Arms.
26
Harmonic Meter Model 721
5.2
Voltage Measurements
����
� �� �� ��� �� �
���������
��������������
���
�
�
�
����
�
�
�
�
�
�
�
�
���
���
�
���
����
��� ������
�
���
��
�����
����
�
���
1. Turn the rotary switch to the voltage measurement function V~.
Selection is confirmed with a short beep.
2. Insert the red test lead into the
jack and the black test lead
into the
jack. Select the appropriate termination (test probes or
clips).
3. Touch or connect the voltage test leads to the circuit under test.
4. Take the reading from the display. Voltage measurements are possible from 50 mV to 600 Vrms, and to 999.9 V Peak.
WARNING
Though the meter can display to 999.9 V in Auto Range and in the 600
V manual range, the warning symbol will be displayed above 600 Vrms
and accompanied by a beeping alarm sound. This indicates that the input
exceeds the specified safety and operating range. The displayed value is
only indicative and not specified.
Do not continue to operate the instrument when the input value
exceeds the meter safety and operating specifications.
OL is displayed above 1000 V peak in the Peak mode and may also be
accompanied by the warning triangle if the RMS value exceeds 600 V.
The warning symbol may also be displayed if the input signal is too low
(<50 mV) or if the fundamental is not 50 or 60 Hz.
Harmonic Meter Model 721
27
5.2.1 Ranging
Auto Ranging is selected by default and selects the best range for the
digital display and for the analog bargraph.
Pushing the RANGE push button will select a fixed manual range: 60 Arms
first and 600 Vrms on the second push.
The digital display and the bargraph indicate the selected range. RANGE
is displayed at the top of the display indicating a manual range selection.
Selection is also confirmed with audible tone.
To sequence back to Auto Ranging, push and hold the RANGE push
button for approximately 3 seconds. The displayed RANGE indicator will
disappear, confirmed with an audible tone.
5.2.2 Other Functions
All others push-button functions relating to voltage may be accessed in V:
• THD (%THD, %DF, CF)
• HZ
• PEAK/SMOOTH
• MIN/MAX recording
These functions are described further in this manual (see p. 29-36).
5.2.3 Bargraph
Please note that the analog bargraph will continue to display RMS voltage values while other measurement functions are displayed (e.g. %THD,
%DF, CF, Hz, Min/Max, Smooth, Peak). The bargraph ranges are 60 Vrms
and 600 Vrms.
28
Harmonic Meter Model 721
5.3
THD Push Button: Power Quality Measurements
THD gives access to Power Quality measurements (%THD, %DF, and CF)
and can be accessed while in Current or in Voltage.
The THD push button accesses three measurement values by sequentially pressing the button:
Push Button Sequencing:
A or V → %THD → %DF → CF → A or V
5.3.1 %THD: Total Harmonic Distortion
%THD is the Total Harmonic Distortion and referenced to the Fundamental
(50/60 Hz) signal. The THD is expressed
as a percentage and may be greater in
���� ���������
��������������
amplitude than the fundamental. A reading greater than 100% is possible. The
����
%THD is also referred to as the Harmonic Factor or %THD-F.
�� �� � � �� � � �
�
�
�
�
�
�
���
�
Mathematically, the Total Harmonic Distortion, or %THD, is the ratio of the rootmean-square (RMS) of the harmonic
content to the root-mean-square (RMS)
value of the fundamental, and expressed
as a percentage (see p. 16 for details).
Harmonic Meter Model 721
���
����
��� ������
�
���
��
�����
����
�
���
29
%THD Application Example:
It is possible to calculate total harmonic current from a %THD reading
when a true RMS current or voltage is also known. First, solve for the Fundamental current using the following example:
Fundamental =
RMS 2
2
%THD
100
+1
With the value for fundamental current known, we can calculate for the
amount of Harmonic Current.
Harmonic =
(RMS) 2 – (Fundamental) 2
Example:
The Model 721 measures a RMS value of 230 Amps and THD of 130%.
This means that the harmonic content is 130% of the fundamental. Calculate for Total Harmonic current by solving the equations:
���������������
���������������
������������
30
��� �
����
���
�
��
���������������
����
���
�����������������������������������
Harmonic Meter Model 721
5.3.2 %DF: Distortion Factor
%DF, or Distortion Factor, is the Total Harmonic Distortion referenced to the total
RMS signal.
The Distortion Factor is expressed as a
percentage and may not be greater than
the fundamental. The %DF never exceeds
100%. The %DF is sometimes referred to
as the %THD-R.
Please note that our %DF is not the same
value as the Distortion Factor as expressed
in the IEEE standard 519-1992 (in which
Distortion Factor is the same as THD).
����
�� �� � � �� � � �
���������
��������������
��
�
�
�
�
�
�
�
���
�
���
����
��� ������
�
���
��
�����
����
�
���
The %DF is a useful term because of the market need to quickly determine
the content of Harmonics and the requirement of Harmonics as a percentage
of the Total RMS under the international standard IEC-555 and possibly other
standards.
Mathematically the Distortion Factor, or %DF, is the ratio of the root-meansquare (RMS) of the harmonic content to the RMS value of the total signal,
and expressed as a percentage (see p. 20 for details).
%DF Application Example:
The Model 721 measures an RMS value of 100 A and a DF of 30%. The mathematics below show how to figure out the Harmonic and Fundamental current:
��������������
�����������
���
���
���
���
���
�
������� �
������
Using the measured values of RMS = 100A and a DF of 30% we can compute the Harmonic and Fundamental current.
��������������
���������������
������������
���
���
���
�
������� �
������������
���
���
�����������������������
Harmonic Meter Model 721
31
5.3.3 CF: Crest Factor
Crest Factor is the ratio of the Peak value
of a waveform to its RMS value. A perfect
sine wave has a crest factor of 1.414. In
distorted waveforms, the crest factor is
typically greater than 1.414 and gives an
indication of the harmonic content.
����
�� �� � � �� �� �
���������
��������������
��
�
�
�
�
�
�
��
�
The CF may also be used to determine
���
����
��� ������ ��
����� ���
the CBEMA (Computer & Business Equipment Manufacturers Association) Derating Factor. The CBEMA Derating Factor
����
is used for evaluating the survivability of
�
���
�
existing conventional transformers in service and servicing single-phase nonlinear
loads such as PCs, computer terminals or other office equipment. For
further use of the CBEMA Derating Factor, contact CBEMA directly.
It should be noted that there is no direct or useful relationship between
the CBEMA Derating Factor, the %THD and Transformer K Factor (IEEE
C57.110-1986).
Crest Factor: CF = Peak/ RMS
CBEMA Derating Factor = 1.414 x RMS/Peak = 1.414/CF
5.3.4 Bargraph
Please note that the analog bargraph will continue to display Arms or Vrms
while THD function measurement values (%THD, %DF, CF) are displayed.
The Range button only changes the bargraph ranges while in the THD
function.
32
Harmonic Meter Model 721
5.4
Range Push Button: Manual Ranges
Pressing the RANGE push button enables you to exit the auto-ranging
mode and enter manual ranges. RANGE operates in either current or voltage.
In Amps:
Pushing the RANGE push-button will select a fixed manual range: 60
Arms first and 600 Arms on the second push. The digital display and the
bargraph indicate the selected range. RANGE is displayed at the top of
the display indicating a manual range selection. Selection is also confirmed with an audible tone.
To sequence back to Auto Ranging, push and hold the RANGE pushbutton for approximately 3 seconds. The displayed RANGE indicator will
disappear, confirmed with an audible tone.
The bargraph ranges are 60 Arms and 600 Arms and are also manually
selected. The analog bargraph will continue to display present values
while other measurement functions are displayed.
In Volts:
Pushing the RANGE push-button will select a fixed manual range: 60
Vrms first and 600 Vrms on the second push. The digital display and the
bargraph indicate the selected range. RANGE is displayed at the top of
the display indicating a manual range selection. Selection is also confirmed with an audible tone.
To sequence back to Auto Ranging, push and hold the RANGE pushbutton for approximately 3 seconds. The displayed RANGE indicator will
disappear, confirmed with an audible tone.
The bargraph ranges are 60 Vrms and 600 Vrms, and are also manually
selected. The analog bargraph will continue to display present values
while other measurement functions are displayed.
Harmonic Meter Model 721
33
5.5
Hz Push Button: Frequency Measurement
The Hz push button accesses the frequency function while in either current or in voltage.
Frequency measurements are possible from 0.5 Hz to 9999 Hz.
Frequency measurements are always Auto Ranging. Pushing the RANGE
push button will only select a fixed range of either 60 or 600 (A or V) on the
bargraph. The RANGE indicator is displayed at the top of the digital display
indicating fixed A or V range selection on
the bargraph. Selection is confirmed with
���� ���������
��������������
an audible tone.
������ �����
To sequence back to Auto Ranging, push
and hold the range selection push-button
for approximately 3 seconds. Displayed
RANGE indicator will disappear, confirmed with an audible tone.
PEAK/SMOOTH push-button is active in
Hz but only the Smooth feature is available. Peak does not exist in Hz measurements (see PEAK/SMOOTH Push
Button, § 5.6). MIN/MAX is active in Hz
(see MIN/MAX Push Button, § 5.7).
��
�
�
�
�
�
�
��
�
���
����
��� ������
�
���
��
�����
����
�
���
If while measuring frequency on a 60 Hz system, the Model 721 indicates
180 Hz, then the third harmonic is dominant and exceeds the fundamental
in magnitude. This may occur in office settings on single-phase loads or
on lighting ballasts. The Model 721 measures the frequency of the signal
with the greatest amplitude.
The analog bargraph will continue to display Arms or Vrms depending
upon which input function is selected.
The HZ function must be exited in order to select another
measurement function. Hz is exited by pressing the Hz pushbutton briefly. A brief beep will be emitted.
34
Harmonic Meter Model 721
5.6
Peak/Smooth Push Button
Peak/Smooth functions are accessed with this push button. Control is verified with a short beep. Peak and Smooth functions may be used for voltage and current measurements. In THD functions and Hz measurement
mode, only Smooth is active. The PEAK and SMOOTH are reached by
sequentially pressing the push button.
Smooth and Peak are selected by sequentially pressing the Peak/Smooth
push button.
Push Button Sequencing:
In A or V: A or V → Smooth → Peak → A or V
In THD:
THD function → Smooth → THD Function
In Hz:
Hz → Smooth Hz
5.6.1 Smooth
Smooth stabilizes the digital readings
when measurements are fluctuating. In
this mode, the Model 721 calculates and
displays a three-second average reading.
Smooth may be used in Volts, Amps, Frequency, as well as power quality functions
(%THD, %DF, CF). Smooth may also be
used while in the MIN/MAX recording
mode.
The analog bargraph will not be affected
by the Smooth functions and continues to
display Arms or Vrms.
Harmonic Meter Model 721
����
� �� �� �� � �� �
���������
��������������
������
���
�
�
�
�
�
�
�
���
�
���
����
��� ������
�
���
��
�����
����
�
���
35
5.6.2 Peak
Peak is a fast responding function which measures the instantaneous
(1ms) Peak values of the measured signal. This function is often used for
half cycle in-rushing signals. The Peak function is displayed in the lower
right-hand corner of the display next to
the measurement symbol.
���� ���������
��������������
������ �����
Peak may also be accessed when recording. When recording MIN/MAX, depressing PEAK gives the MAX Peak only.
The bargraph also indicates the Peak
values. When a Peak value exceeds
the bargraph scale, an arrow at the end
of the scale (►) is displayed. When in
MAX Peak, the MAX Peak value blinks
while the bargraph continues to respond
in Peak mode.
5.7
�
����
����
�
�
�
�
�
�
���
�
���
����
��� ������
�
��
�����
����
�
���
���
MIN/MAX Push Button: Recording Function
The recording feature allows the user to record the Minimum (MIN), Maximum (MAX), Average (AVG), and Maximum Peak (MAX Peak) measurement values.
By pressing the MIN/MAX push button sequentially, the measurements
are displayed. Recording is possible in A, V, %THD, %DF, CF, and HZ.
If SMOOTH is selected prior to RECORDING, the smoothed values are
recorded.
Push Button Sequencing:
In A or V:
A or V Max → Min → Avg → A or V
In A or V Peak:
A or V Peak → Max Peak → A or V Peak
In THD Functions: THD Function → Max → Min → Avg → THD Function
In Hz:
Hz → Max → Min → Avg → Hz
Note: The same operations apply with SMOOTH turned on
Recording is initiated with the MIN/MAX push button during the selected
measurement function. RECORD indication will blink 1/second during the
record mode. Control is verified with a short beep.
36
Harmonic Meter Model 721
Recording is possible for up to 24 hours when using a fresh battery, and
limited to 8 hours in %THD and %DF.
During record mode, a beep indicates the capture of each new minimum
and maximum value. When recording current or voltage measurement
information, specific segments on the analog bargraph will blink indicating
the current status of the MIN and MAX values.
In MIN/MAX Recording, the bargraph indicates Arms or Vrms. The MIN
and MAX values are also indicated and blink.
Harmonic Meter Model 721
37
Recording mode is stopped manually at any time by pushing the HOLD
button. RECORD-PAUSE will then be displayed, and the record indication
will no longer blink. At this point, recorded measurement can be read by
pushing the MIN/MAX push button sequentially. The bargraph blinks on
the MIN and the MAX values. To resume recording, press HOLD again.
When recording PEAK measurements, only MAX PEAK measurement
values are stored in memory, and the bargraph indicates Peak values and
blinking MAX Peak.
Before accessing any other functions, you must exit MIN/MAX
Recording by pushing and holding the MIN/MAX push button
a few seconds until it beeps. The beep will indicate the mode
change and the displayed RECORD symbol will disappear.
5.8
Vout – Analog Output
When measuring current or current power quality, the Model 721 automatically provides an analog output (1 mV/A or 10 mV/A) through the voltage
terminals.
This function enables the user to display the actual current waveform on
any oscilloscope or hand-held scope. You can take measurements on the
clamp-on and visualize the signal waveform on the oscilloscope.
Vout is always present when in A~. The analog output is independent and
does not interfere with the current or power quality measurements (%THD,
%DF, CF, Hz, Min/Max, Peak).
An insulated banana jack to BNC connector is supplied with the instrument. Use your BNC lead and scope. In essence, you have a free current
harmonic transducer for oscilloscopes or hand-held scopes, or even a current transducer for loggers and recorders.
38
Harmonic Meter Model 721
1. Disconnect the probe from all circuits and turn the meter OFF.
2. Connect the insulated BNC connector to the voltage jacks (red to
and black to
).
3. Connect your BNC cable to the insulated BNC jack and to your oscilloscope.
4. Turn the rotary switch to the current measurement function A~. Selection is confirmed with a short beep.
5. Press the trigger to open the jaws. Clamp the jaws around the conductor. The most accurate readings are obtained with the conductor
aligned with the centering marks on the jaws.
6. Adjust the oscilloscope range for the desired waveform size and display. Readings from the Model 721 are also valid. The analog output
is preset to 1 mV/A at the factory and permits current measurements
from 50 mA to 700.0 Arms, and to 999.9 A Peak.
5.8.1 Output Level
The output is preset at 1 mV/A at the factory. We recommend that you use
the oscilloscope amplification rather than changing the 1 mV/A output in
order to benefit from the full 700 Arms operating range. The 10 mV/A is
limited to 60 Arms.
Analog output may be switched internally to either 1 mV per A or 10 mV
per A. The selection is made internally by a mini switch located under the
input terminal circuit card found on the base of the instrument (refer to the
diagram on p. 42).
Extreme care should be exercised when changing the mini switch selection to avoid damaging internal components or wires. This procedure
should only be performed by qualified service personnel.
5.9
Summary of Accessible Functions
Smooth
Peak
MAX
MIN
AVG
MAX Peak
Arms
Yes
Yes
Yes
Yes
Yes
Yes
Vrms
Yes
Yes
Yes
Yes
Yes
Yes
%THD
Yes
No
Yes
Yes
Yes
No
%DF
Yes
No
Yes
Yes
Yes
No
CF
Yes
No
Yes
Yes
Yes
No
Hz
Yes
No
Yes
Yes
Yes
No
Harmonic Meter Model 721
39
5.10 Auto-Off Feature
The Model 721 will automatically shut itself off after 10 minutes during the
following conditions:
• No push button action
• No rotary switch (A ,V) action
• No measurement change
• Not in Record Min/Max mode
A short beep will be heard prior to shutdown. Any control action will repower the instrument.
The Auto-Off feature may be disabled by holding down the RANGE push
button, while turning the rotary selection switch from OFF to either Amps
or Volts.
will be displayed in the upper left-hand corner of the LCD when the
Auto-Off feature has been disabled.
The Auto-Off feature will be reset when the Model 721 is turned off.
5.11 Troubleshooting
From time to time, a minor malfunction may occur due to normal operating
events. Below are common events and solutions which should help you
troubleshoot your Model 721.
Symptom
Recommended Action
Instrument will not turn on
Low battery; replacement required
Missing or inaccurate readings
Check that minimum input level is
present;
Check that the transformer mating
surfaces are clean
No function control action;
High frequency beep(s)
Exit current mode with push button;
Instrument may be beyond safety or
operating range
40
Harmonic Meter Model 721
CHAPTER 6
MAINTENANCE
WARNING
• To avoid electrical shock, do not attempt to perform any servicing unless
you are qualified to do so.
• To avoid electrical shock and/or damage to the probe, do not get water or
other foreign agents into the case. Turn the Model 721 OFF and disconnect the meter from all circuits and inputs before opening the case.
6.1
Cleaning
• Wipe the case and jaw covers with a damp cloth and mild detergent.
• Do not use abrasives or solvents.
• If rusted, sand with very fine sandpaper, then lightly oil. Wipe off
excess oil to prevent it from dripping into the case.
6.2
Battery Test & Replacement
To determine useful battery life, a self-test may be initiated by holding
down any push button while turning the rotary selector from the OFF position to Amps or Volts.
All indicators will light up. The Battery
symbol, as well as battery segment indicator, will blink indicating useful battery
life remaining.
A full bargraph display represents 60
hours of useful battery life. Each bar
segment represents approximately two
hours of battery life.
�
�
������ ����� ����
����������������������
�
��
����
�� ��
�
��
�
�
�
�
�
�
���
����
���
��
It is considered good practice to replace any battery with only a few hours
of life remaining.
Power Source: 9V Alkaline battery (NEDA 1604, 6LF22, 6LR61)
Source Life: 50 hr continuous use approx
Harmonic Meter Model 721
41
6.2.1 Battery Replacement
1.
The instrument must be OFF and disconnected from any circuit or input.
2.
Place the meter face down and remove the three Phillips screws on the
back of the instrument.
3.
Remove the back cover by pulling it down and away from the instrument.
4. Lift the battery away from the case and disconnect the battery.
5. Connect the new battery and position the leads so that they won’t get
pinched when the cover is replaced.
6. Replace the back cover, noting that it slips beneath the hold-down lip
and fits securely into position. Take care to position any loose wire or
circuit correctly before closing.
7. Install and tighten the three screws.
��
��������
�����������
�����������������
������������
�������������
42
Harmonic Meter Model 721
Repair and Calibration
To ensure that your instrument meets factory specifications, we recommend
that it be submitted to our factory Service Center at one-year intervals for recalibration, or as required by other standards or internal procedures.
For instrument repair and calibration:
You must contact our Service Center for a Customer Service Authorization
Number (CSA#). This will ensure that when your instrument arrives, it will be
tracked and processed promptly. Please write the CSA# on the outside of the
shipping container. If the instrument is returned for calibration, we need to
know if you want a standard calibration, or a calibration traceable to N.I.S.T.
(Includes calibration certificate plus recorded calibration data).
Chauvin Arnoux®, Inc.
d.b.a. AEMC® Instruments
15 Faraday Drive
Dover, NH 03820 USA
Tel: (800) 945-2362 (Ext. 360)
(603) 749-6434 (Ext. 360)
Fax: (603) 742-2346 or (603) 749-6309
[email protected]
(Or contact your authorized distributor)
Costs for repair, standard calibration, and calibration traceable to N.I.S.T. are
available.
NOTE: All customers must obtain a CSA# before returning any
instrument.
Technical and Sales Assistance
If you are experiencing any technical problems, or require any assistance with
the proper operation or application of your instrument, please call, mail, fax or
e-mail our technical support hotline:
Chauvin Arnoux®, Inc.
d.b.a. AEMC® Instruments
200 Foxborough Boulevard
Foxborough, MA 02035, USA
Phone: (800) 343-1391
(508) 698-2115
Fax:
(508) 698-2118
[email protected]
www.aemc.com
NOTE: Do not ship Instruments to our Foxborough, MA address.
43
Harmonic Meter Model 721
Limited Warranty
The Model 721 is warranted to the owner for a period of one year from the
date of original purchase against defects in manufacture. This limited warranty
is given by AEMC® Instruments, not by the distributor from whom it was
purchased. This warranty is void if the unit has been tampered with, abused
or if the defect is related to service not performed by AEMC® Instruments.
For full and detailed warranty coverage, please read the Warranty Coverage Information, which is attached to the Warranty Registration Card
(if enclosed) or is available at www.aemc.com. Please keep the Warranty Coverage Information with your records.
What AEMC® Instruments will do:
If a malfunction occurs within the one-year period, you may return the
instrument to us for repair, provided we have your warranty registration
information on file or a proof of purchase. AEMC® Instruments will, at its
option, repair or replace the faulty material.
REGISTER ONLINE AT:
www.aemc.com
Warranty Repairs
What you must do to return an Instrument for Warranty Repair:
First, request a Customer Service Authorization Number (CSA#) by phone
or by fax from our Service Department (see address below), then return the
instrument along with the signed CSA Form. Please write the CSA# on the
outside of the shipping container. Return the instrument, postage or shipment
pre-paid to:
Chauvin Arnoux®, Inc. d.b.a. AEMC® Instruments
Service Department
15 Faraday Drive • Dover, NH 03820 USA
Tel: (800) 945-2362 (Ext. 360)
(603) 749-6434 (Ext. 360)
Fax: (603) 742-2346 or (603) 749-6309
[email protected]
Caution: To protect yourself against in-transit loss, we recommend you
insure your returned material.
NOTE: All customers must obtain a CSA# before returning any
instrument.
44
Harmonic Meter Model 721
I
721
CLAMP-ON HARMONIC METER
HOL
OFF
~
A
~
V
11/03
99-MAN 100066 v2
Mod
el 72
HAR
–
MON
P
REC
ORD SMO
IC M
-PAU OTH
ETE
SE
R
MAX RANGE
MIN
!
AVG HOLD
+
0
D
1
MIN
MAX
PE
SMO AK
OTH
COM
4
ENGLISH
5
AV
RMS
600 PEAK
AV
Hz
RAN
GE
600V
+
Chauvin Arnoux®, Inc. d.b.a. AEMC® Instruments
15 Faraday Drive • Dover, NH 03820 USA • Phone: (603) 749-6434 • Fax: (603) 742-2346
www.aemc.com • www.chauvin-arnoux.com
%TH F
Hz C D
F
2
3
!
1
User Manual
THD
D