1
45
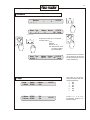
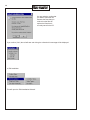
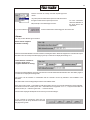
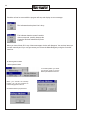
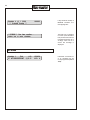
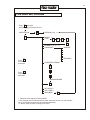
The two functions above (Show data and Show overview) will open two different ways of viewing the Monitoring
data.
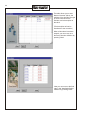
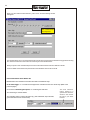
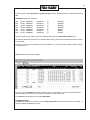
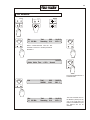
Show data: Displays the “raw” data
test
test
test
test
test
test
test
Direct
Direct
Direct
Direct
Direct
Direct
Direct
20000327
20000327
20000327
20000327
20000327
20000327
20000327
013200
013200
013200
013200
013200
013200
013200
L2
L3
L4
L5
L6
L7
L8
D
D
D
D
D
D
D
Stopped
Stopped
Stopped
Stopped
Started
Started
Started
As you can see this is very similar to the comma delimited file you get from the Extract Mon. Data function.
The software remembers the last time you extracted data and it only works with the latest data set which is added
to the old data.
Of course you can use the raw data like any other spreadsheet, i.e. you can work with the data by sorting, filtering,
summing, and so on.
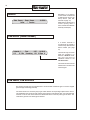
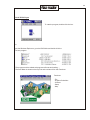
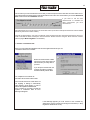
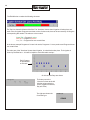
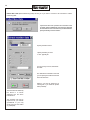
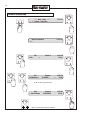
Show overview: Displays Data by steps
As you can see the overview gives details of start/stop time for each step and if you have a Flowmeter/Sensor
decoder installed, it will also give you the water consumption per step and per day….
The overview is calculated from the raw data (Show Data)
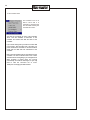
View Monitoring Data
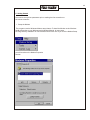
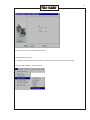
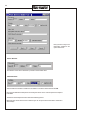
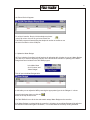
The View function performs the same function as the Extract and View function but it does not extract new data…. It
will open the Excel spreadsheet for viewing.