1
Verify QC
User Manual
Version 1.12B
VERIPOS
A
1
11.05.2015
06.05.2015
REVISION
DATE
Approved for release
For review
DESCRIPTION
AR
AR
RR
-
RR
-
-
ORIGINATOR
CHECKED
APPROVED
CLIENT APPR
Document Title:
Verify QC v1.12B User Manual
Document No:
AB-V-MA-00585
File Ref:
AB-V-MA-00585.doc
Document title:
Document No.
Verify QC v1.12B User Manual
AB-V-MA-00585
CONTENTS
1.
INTRODUCTION .............................................................................................................................................4
2.
INSTALLING VERIFY QC ...............................................................................................................................6
2.1
2.2
2.3
3.
FUNCTIONAL OVERVIEW .............................................................................................................................9
3.1
3.2
3.3
3.4
3.5
4.
RECEIVER ......................................................................................................................................... 55
MSS TIDES ........................................................................................................................................ 59
POP UP DOP WARNINGS ................................................................................................................ 60
CSL RAW OUTPUT ........................................................................................................................... 61
ARCHIVE DATA ................................................................................................................................. 63
GENERATE STATUS REPORT ........................................................................................................ 64
IMPORT VERICHART FILE ............................................................................................................... 64
SYNCHRONISE PC CLOCK .............................................................................................................. 65
VIEW ............................................................................................................................................................. 67
7.1
7.2
7.3
7.4
7.5
7.6
8.
ALF ..................................................................................................................................................... 46
RINEX ................................................................................................................................................. 52
ACTION ........................................................................................................................................................ 55
6.1
6.2
6.3
6.4
6.5
6.6
6.7
6.8
7.
CONFIGURE GNSS RECEIVER ....................................................................................................... 15
CONFIGURE RTCM INPUT ............................................................................................................... 18
DEMODULATOR INPUT .................................................................................................................... 26
CALCULATION .................................................................................................................................. 27
POSITION OUTPUT ........................................................................................................................... 42
CSL OUTPUT ..................................................................................................................................... 44
LOGGING ..................................................................................................................................................... 46
5.1
5.2
6.
MENU STRUCTURE .............................................................................................................................9
DONGLE DEPENDANT FUNCTIONS ..................................................................................................9
USER SELECTABLE FUNCTIONS ................................................................................................... 11
TOPCON / JAVAD PREFILTER ......................................................................................................... 12
FILE .................................................................................................................................................... 13
CONFIGURATION ....................................................................................................................................... 14
4.1
4.2
4.3
4.4
4.5
4.6
5.
PC REQUIREMENTS............................................................................................................................6
DONGLE DRIVER INSTALLATION ......................................................................................................6
AUTOMATIC SOFTWARE START UP .................................................................................................6
IO ........................................................................................................................................................ 67
GNSS.................................................................................................................................................. 68
DIFFERENTIAL .................................................................................................................................. 76
CSL OUTPUT STATION IDS ............................................................................................................. 83
QC ...................................................................................................................................................... 97
LOGGING ......................................................................................................................................... 110
TOOLS........................................................................................................................................................ 116
8.1
8.2
8.3
LOCK CONFIG ................................................................................................................................. 116
COM PORT MAPPING ..................................................................................................................... 117
ADVANCED OPTIONS .................................................................................................................... 118
9.
WINDOWS .................................................................................................................................................. 119
10.
HELP .......................................................................................................................................................... 120
10.1 DONGLE, UPGRADES AND HELPDESK ....................................................................................... 120
10.2 REVISION HISTORY ....................................................................................................................... 123
10.3 USER MANUAL ................................................................................................................................ 123
Rev No:
Date:
A
06.05.2015
Page 2
Verify QC v1.12B User Manual
Document title:
Document No.
Verify QC v1.12B User Manual
AB-V-MA-00585
10.4 ABOUT ............................................................................................................................................. 123
11.
INDEX OF APPENDICES .......................................................................................................................... 124
A
INSTALLING VERIFY QC .......................................................................................................................... 126
A.1
SOFTWARE INSTALLATION........................................................................................................... 126
B
DONGLE DRIVER INSTALLATION .......................................................................................................... 131
C
DEVICE IO DESCRIPTIONS...................................................................................................................... 132
C.1
C.2
C.3
C.4
C.5
D
SERIAL PORTS ............................................................................................................................... 132
CLIENT SOCKET ............................................................................................................................. 133
SERVER SOCKET ........................................................................................................................... 134
DATAGRAM ..................................................................................................................................... 134
FILE IO ............................................................................................................................................. 135
ADVANCED VIEWS ................................................................................................................................... 136
D.1
D.2
D.3
D.4
D.5
D.6
D.7
D.8
D.9
D.10
E
ALMANAC ........................................................................................................................................ 137
GPS EPHEMERIS ............................................................................................................................ 141
GPS CCF .......................................................................................................................................... 142
GPS MEASUREMENTS................................................................................................................... 144
GLONASS EPHEMERIS .................................................................................................................. 146
GLONASS CCF ................................................................................................................................ 147
GLONASS MEASUREMENTS ......................................................................................................... 147
STATION DATA ............................................................................................................................... 149
ULTRA CORRECTIONS .................................................................................................................. 151
APEX CORRECTIONS .................................................................................................................... 152
QUALITY STANDARDS ............................................................................................................................ 155
E.1
E.2
F
UKOOA STANDARD ........................................................................................................................ 155
NMEA-0183 STANDARD ................................................................................................................. 157
VERIFY QC OUTPUTS .............................................................................................................................. 159
F.1
NMEA SENTENCES ........................................................................................................................ 160
G
TIDES LOGGING FILE FORMATS............................................................................................................ 180
H
GNSS RECEIVER LIST ............................................................................................................................. 186
I
VERIPOS - CONTACT DETAILS AND OFFICE LOCATIONS ................................................................ 187
Rev No:
Date:
A
06.05.2015
Page 3
Verify QC v1.12B User Manual
Document title:
Document No.
1.
Verify QC v1.12B User Manual
AB-V-MA-00585
INTRODUCTION
This manual covers the:
installation
configuration
operational procedures
of the VERIPOS Verify QC software for Microsoft Windows 7® and XP®.
The Verify QC suite of processing software provides real-time position with quality control
information for the professional positioning user. It contains full calculation configuration
flexibility with performance monitoring.
The Verify QC functionality is scalable in concept. It is expandable with many specific
features enabled through a USB/Parallel software key (dongle) providing user flexibility and
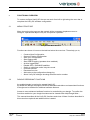
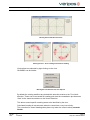
simplicity of operation. The software provides a window into the complete position
derivation process by capturing both GNSS observation and received augmentation data.
Multiple calculation permutations can be configured providing complete visibility of all
parameters with associated quality control.
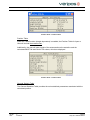
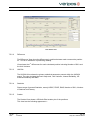
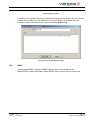
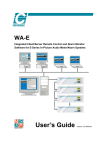
Verify QC Example Screen
Rev No:
Date:
A
06.05.2015
Page 4
Verify QC v1.12B User Manual
Document title:
Document No.
Verify QC v1.12B User Manual
AB-V-MA-00585
Verify QC can receive and output data using serial, TCP/IP communications and data files.
It operates in real-time whilst retaining full functionality in post-processing mode.
The Verify QC software is dongle protected. An enabled dongle will need to be attached to
the PC running Verify QC before the software can be used. You may install Verify QC on a
Window OS PC without an enabled dongle but it will not run without an enabled dongle
being attached.
Principal features of Verify QC for Windows 7® and XP® are:
intuitive use - simple to operate and use
user configurable
supports a range of different GNSS receivers
supports all VERIPOS data broadcast services
accepts corrections from 3rd party non-VERIPOS sources e.g. IALA
capable of multi-reference station and single station GPS-only, GLONASS-only and
GPS/GLONASS calculations
capable of use of high accuracy Precise Point Positioning (PPP) calculations
capable of real-time tidal calculations
provides statistical analysis and QC information
compliant with UKOOA recommendations
unlimited number of position calculations
raw and computed data can be logged for analysis and replay
output position solutions (no limit) and associated QC information
supports TCP/IP communication
Disclaimer:
VERIPOS accepts no responsibility for any damage or injury to the system, ship
or personnel caused by drawings, instructions or procedures not prepared by
VERIPOS.
Copyright © 2004-2014 VERIPOS. All rights reserved. No part of this
documentation may be reproduced or transmitted in any form or by any means,
electronic or mechanical, including photocopying, recording, or by any
information storage and retrieval systems, without a licence from VERIPOS as
copyright owner granting such permission. Applications for such licence should
be addressed to VERIPOS, Veripos House, 1B Farburn Terrace, Dyce,
Aberdeen, AB21 7DT, UK.
No representation, warranty or undertaking, express or implied, is or will be
made and no responsibility or liability will be accepted by VERIPOS or by any of
its officers, employees, agents or advisors as to the accuracy or completeness
of the information contained herein. VERIPOS accepts no responsibility for any
loss or liability which may arise from reliance on information that is contained
within this documentation.
For further information visit the VERIPOS Online Support System (VOSS) web
site http://help.veripos.com
Rev No:
Date:
A
06.05.2015
Page 5
Verify QC v1.12B User Manual
Document title:
Document No.
2.
Verify QC v1.12B User Manual
AB-V-MA-00585
INSTALLING VERIFY QC
The Verify QC software can be supplied preinstalled on a PC or you can install from a CD
inserted into a PC CDROM drive. Note that you can install Verify QC without having an
activated dongle but will not be able to run the application.
See Appendices for details on installing Verify QC.
2.1
PC REQUIREMENTS
Installation requires a PC with Windows® 7 or XP operating system. This is the operating
system platform supported by VERIPOS. The PC is typically provided by VERIPOS to
ensure compatibility. Contact VERIPOS for specification details.
2.2
DONGLE DRIVER INSTALLATION
Verify QC requires a Dongle driver to be installed on the PC.
See the Help section in this manual or contact VERIPOS for details or if you require
assistance.
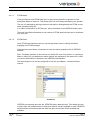
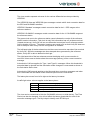
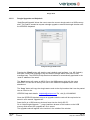
2.3
AUTOMATIC SOFTWARE START UP
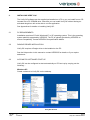
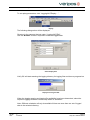
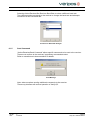
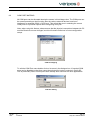
Verify QC can be configured to start automatically on PC boot up by carrying out the
following: Windows XP
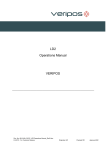
Create a shortcut to Verify QC on the desktop.
Verify QC Shortcut
Rev No:
Date:
A
06.05.2015
Page 6
Verify QC v1.12B User Manual
Document title:
Document No.
Verify QC v1.12B User Manual
AB-V-MA-00585
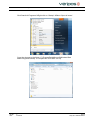
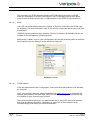
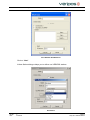
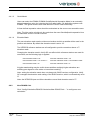
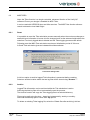
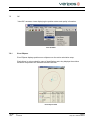
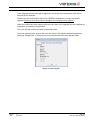
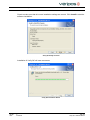
Copy the shortcut to the folder “C:\Documents and Settings\All Users\Start
Menu\Programs\Startup” to complete the “auto start” set up.
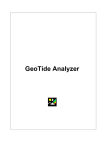
Start Menu
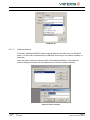
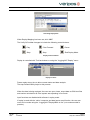
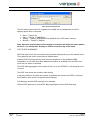
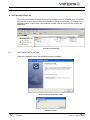
Windows 7
Create a shortcut to Verify QC on the desktop.
Verify QC Shortcut
Rev No:
Date:
A
06.05.2015
Page 7
Verify QC v1.12B User Manual
Document title:
Document No.
Verify QC v1.12B User Manual
AB-V-MA-00585
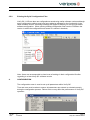
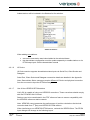
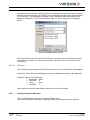
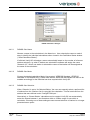
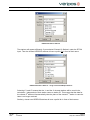
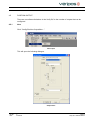
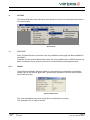
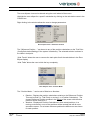
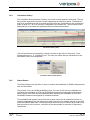
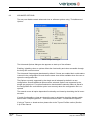
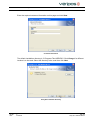
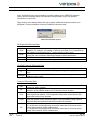
Click StartAll ProgramsRight-click on ‘Startup’Select ‘Open all users’:
Copy the shortcut to the folder “C:\ProgramData\Microsoft\Windows\Start
Menu\Programs\Startup” to complete the “auto start” set up.
Rev No:
Date:
A
06.05.2015
Page 8
Verify QC v1.12B User Manual
Document title:
Document No.
3.
Verify QC v1.12B User Manual
AB-V-MA-00585
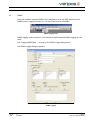
FUNCTIONAL OVERVIEW
To custom configure Verify QC the user can work from left to right along the menu bar to
complete the Verify QC software configuration.
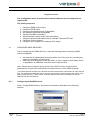
3.1
MENU STRUCTURE
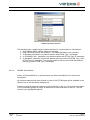
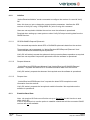
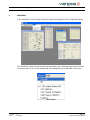
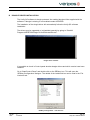
Menu icons along the top menu bar contain all the necessary dropdown menus to
configure, operate and adjust Verify QC for optimum operation.
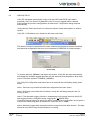
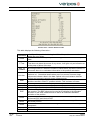
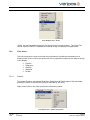
Verify QC Main Menu Structure
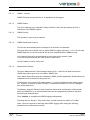
Functions are shown in icons on the task bar below the menu bar. These help you to;
o
o
o
o
o
o
o
o
o
o
o
o
3.2
Create a New Configuration
Open an Existing Configuration
Save your Configuration
Start logging data
Start RINEX logging (operates when enabled)
Archive logged data
Disable GPS / GLONASS satellites
Switch to night-time mode / day-time mode
Increase font size
Decrease font size
Add notes to the configuration change log
About Verify QC dialogue showing software version number
DONGLE DEPENDANT FUNCTIONS
An enabled dongle is required to operate Verify QC.
By default the dongle will support VERIPOS Standard calculation and associated functions.
A dongle can be enabled for additional software features.
Access to more advanced software functions is controlled by your dongle. To confirm the
functions enabled on your dongle its status can be viewed under Help/Dongle/View…
This manual describes all the Verify QC functions and views. Where functions described in
this manual are optional and additional this is stated.
Rev No:
Date:
A
06.05.2015
Page 9
Verify QC v1.12B User Manual
Document title:
Document No.
Verify QC v1.12B User Manual
AB-V-MA-00585
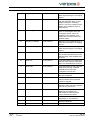
The current dongle dependent Verify QC software functions are listed below:
o
Ultra:
introduces the Ultra calculation and associated functions. Ultra is a
PPP (Precise Point Positioning) calculation offering decimetre level
accuracies
o
Apex:
introduces the Apex calculation and associated functions. Apex is a
PPP (Precise Point Positioning) calculation offering decimetre level
accuracies
o
GLONASS:
introduces a combined GPS+GLONASS calculation and associated
functionality. Note: The combined GPS+GLONASS calculations are
only available when a Topcon, Septentrio AsteRx or NovAtel receiver
is selected
o
CSL Output:
introduces an additional interface for output of P2/94 records to the
Concept Systems Limited (CSL) ViGPS process in various CSL
navigation products
o
Tides:
Tide calculation (including Mean Seas Surface) and associated
functions. Tides requires Apex or Ultra service to be enabled on your
dongle. The Tides calculation estimates the real-time tide at the
users’ location
o
PPP Ref:
introduces a virtual base station RTCM Output based on the current
PPP position, which is used as a virtual reference station location.
This function allows highly stable and accurate DGPS corrections to
be calculated and then be output to external DGPS systems or a
telemetry link
o
Axiom:
Use with the 4 D Veripos positioning software suite
o
Demo:
the demo function allows users to replay predefined demonstration
datasets using associated fixed configurations. To make use of this
requires the Verify QC Demo Data CD
You can check the dongle enable status in Help/Dongle/View…
Rev No:
Date:
A
06.05.2015
Page 10
Verify QC v1.12B User Manual
Document title:
Document No.
Verify QC v1.12B User Manual
AB-V-MA-00585
If a function you require is absent contact the VERIPOS helpdesk for information,
assistance and to order a dongle upgrade.
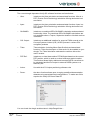
3.3
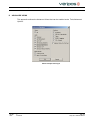
USER SELECTABLE FUNCTIONS
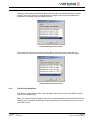
You can customise the appearance of Verify QC. A number of advanced views can be
enabled and a number of advanced software options can be disabled to simplify the
appearance of the software.
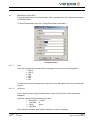
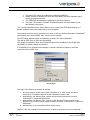
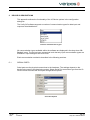
The dialogue to do this is accessed via Tools/Advanced Options.
Advanced Options dialogue
The Advanced Options dialogue can also appear on initial start-up of the software.
Enabling / disabling views or options will affect which configuration dialogues and
associated views are accessible through the Verify QC menu structure.
A number of Advanced Views have been deselected by default. However, by default all
options enabled on the Verify QC dongle will appear enabled in a new configuration.
Options will be presented depending on the features available from the selected GNSS
card.
Rev No:
Date:
A
06.05.2015
Page 11
Verify QC v1.12B User Manual
Document title:
Document No.
Verify QC v1.12B User Manual
AB-V-MA-00585
If views are enabled (ticked), their enable status is stored in the Verify QC configuration file.
An updated view menu structure will be available when Verify QC is run.
Further views may be selected as the options under Views are not all dongle dependent.
Those Options not supported by the dongle are greyed out.
Options selected or deselected are stored when you save the configuration file and will be
in place when you reopen the configuration file.
This manual covers all Verify QC functions and views. If any are absent, please first check
the dongle enable status, under Help/Dongle/View… and your selections under
Tools/Advanced Options.
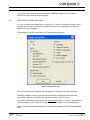
3.4
TOPCON / JAVAD PREFILTER
Topcon and Javad receivers set a status flag for each GNSS satellite measurement. The
Topcon PreFilter allows Verify QC to filter out satellites the receiver has deemed non
optimal before presenting the data to the calculations.
If the Topcon Prefilter option is un-ticked, the Pre-Filter is disabled and Verify QC will only
use its filter within its calculations to determine sub optimal satellites.
The Pre-Filter is enabled as default. To disable the Pre-Filter, Follow these steps:
Note: The Topcon PreFilter option is greyed out until the GNSS receiver type is set in the
menu option Config /GNSS Receiver.
1
In the Config/GNSS Receiver…menu, select the Topcon/Javad card
2
In Tools/Advanced Options, select (tick) or deselect (un-tick) Topcon PreFilter
option
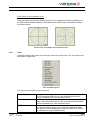
Topcon PreFilter not selected
Rev No:
Date:
A
06.05.2015
Topcon PreFilter selected
Page 12
Verify QC v1.12B User Manual
Document title:
Document No.
3.5
Verify QC v1.12B User Manual
AB-V-MA-00585
FILE
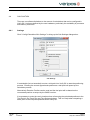
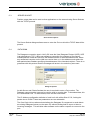
The standard Windows commands “File/New, File/Open…, File/Save, File/Save As… and
File/Exit” allow the user to create a new configuration file and save it or open configuration
files for editing.
Notes: The Verify QC configuration file should be saved and a backup copy created and
stored in a safe area. If a configuration is running and New or Exit is selected, a warning
appears to save or cancel the existing configuration. Creating a new configuration will close
the existing configuration.
File Menu Structure
3.5.1
Auto Start
Selecting Auto-Start ensures the last saved configuration file will re-open automatically
when Verify QC is started.
If you do not require to use the last saved configuration when Verify QC starts, you can
close this configuration, create a new configuration file or open a previously saved file.
Rev No:
Date:
A
06.05.2015
Page 13
Verify QC v1.12B User Manual
Document title:
Document No.
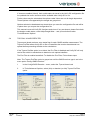
3.5.2
Verify QC v1.12B User Manual
AB-V-MA-00585
Existing Verify QC Configuration Files
Verify QC 1.12B can also use configurations saved using earlier software versions although
some configuration settings may have been added or adjusted for the functionality in the
latest software version. A warning message will appear to advise you are using an earlier
software configuration. When opening existing configuration files from the File Menu the
version in which the configuration was saved in is shown in brackets;
Note: Users are recommended to check over all settings in their configuration file after
upgrading to a later Verify QC software version.
4.
CONFIGURATION
The configuration menu is used to set up all parameters within Verify QC.
Time and care must be taken to ensure all parameters are entered or selected correctly
during the configuration process. Failure to do so may affect the performance of Verify QC
operation.
Rev No:
Date:
A
06.05.2015
Page 14
Verify QC v1.12B User Manual
Document title:
Document No.
Verify QC v1.12B User Manual
AB-V-MA-00585
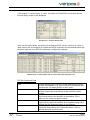
Config Menu Structure
The configuration menu is structured so that the software can be configured in a
logical order.
The primary steps are:
1.
2.
3.
4.
5.
6.
7.
8.
9.
4.1
Configure GNSS receiver input
Configure RTCM inputs
Configure Demodulator Input (if applicable)
Set elevation mask and Geoid Model
Configure DGNSS calculations
Select backups to Apex and/or Ultra calculations
Configure advanced calculations as for example Tides and PPP Ref
Configure Position Outputs
Configure other outputs as for example CSL Output
CONFIGURE GNSS RECEIVER
Prior to configuring the GNSS Receiver, check the following points concerning GNSS
antenna installation:
the antennas is installed with the best possible view of the open sky, avoiding any
masking or possibility of interference
cable runs must be short to avoid any effect on the L2 signal to Noise Ratio values
or degradation of VERIPOS correction services performance
Note: Offsets are not required during setup of the GNSS receiver as the positions
generated by Verify QC are referenced to the phase centre* of the GNSS antennae.
* The offset between the base of the antenna and the antenna phase centre differs for each antenna
type. For example the VERIPOS AD410 antenna has an offset of 45mm between the bottom of the
antenna base and the L1 phase centre. If using a different antenna this information should be
obtained from the manufacturer.
4.1.1
Configuring the GNSS Receiver
Select “Config/GNSS Receiver” and enter the information described in the following
sections.
Rev No:
Date:
A
06.05.2015
Page 15
Verify QC v1.12B User Manual
Document title:
Document No.
Verify QC v1.12B User Manual
AB-V-MA-00585
GNSS Receiver
4.1.1.1
GNSS Name
When no entry is made against “Name” for a GNSS receiver the default name of ‘GNSS
Rx’ is inserted automatically.
For ease of reference it is recommended to change this name to the name or model of the
GNSS receiver used. E.g. ‘Topcon’, ‘Septentrio’, ‘Trimble’ etc.
Where more than one Verify QC system is installed on a vessel, it is good working practice
to give the receivers unique and more descriptive names such as “Port/Fwd”,
“Starboard/Aft” or “Primary” and “Secondary”.
This makes it easier to distinguish between the systems and aids troubleshooting.
4.1.1.2
GNSS Type
Selections of GNSS receiver types are available and are viewed in this drop down menu.
Consult your order confirmation details to determine the receiver card installed in your
VERIPOS hardware.
A list of the current GNSS receiver types and default baud rate used is available in the
Appendix.
Note: If using a Topcon or Javad receiver please refer to the Topcon Prefilter section
(Section 3.4) of this manual.
4.1.1.3
IO Device
The IO Device section supports GNSS receiver inputs from Serial Port, Client Socket or
Datagram.
Serial Port, Client Socket and Datagram connection details are detailed in the Appendix.
For Serial Ports Verify QC must initially be configured to match the existing baud rate of the
receiver so communications may be established.
Rev No:
Date:
A
06.05.2015
Page 16
Verify QC v1.12B User Manual
Document title:
Document No.
Verify QC v1.12B User Manual
AB-V-MA-00585
Three steps are required:
set Verify QC to match the existing receiver baud rate setting (see reference table in
Appendices)
where the baud rate is less than 57600 the receiver baud must then be reset to
38400 or greater. Use Action/Receiver/Set receiver baud rate tool
finally adjust the GNSS Receiver IO Device setting in Verify QC to match the
revised receiver baud rate
Notes: a minimum baud rate of 38400 is required for correct system operation. Receivers
with initial settings lower than this value should be reset to 38400 once communications
have been established.
The above procedure can be used to reset the baud rate for most receivers.
Where you do not know the receiver baud rate, try using default serial port baud rates as
detailed in the Appendix. If problems are encountered with matching Verify QC with the
default serial port setting of GNSS receivers then these setting must be changed by
reference to the manufacturer instructions.
Alternatively use the Verify QC tool under Action/Receiver/Establish baud rate.
Click “Confirm” once all GNSS receiver input settings have been made. Verify QC will then
configure the GNSS receiver and enable output on the selected port for operation with the
software.
Where using an IP connection to your receiver e.g. when using a Veripos LD5, enter the IP
address and port number. For Veripos equipment the information is available from the
Quick Guides or the Operations manual for the receiver, downloadable from VOSS.
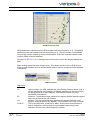
To check that communications are established:
1. open the IO view from the main menu (View/IO)
2. For serial connections check the GNSS data and check the baud rate is correct
a. successfully decoded data appears as green text within the IO view
b. scrolling text is shown in red where data cannot be decoded (incorrect
receiver type or incorrect baud rate)
c. no text appears is no data is received
Where red text is shown, or no text is displayed users should step through possible baud
rate settings of the GNSS receiver and ensure these settings match in the GNSS receiver
and Verify QC.
Rev No:
Date:
A
06.05.2015
Page 17
Verify QC v1.12B User Manual
Document title:
Document No.
Verify QC v1.12B User Manual
AB-V-MA-00585
4.2
CONFIGURE RTCM INPUT
4.2.1
Configure RTCM Input
To add an RTCM input click “Config/RTCM Input/New…”
RTCM Input
This will open the following dialogue:
RTCM Input dialogue
Rev No:
Date:
A
06.05.2015
Page 18
Verify QC v1.12B User Manual
Document title:
Document No.
4.2.1.1
Verify QC v1.12B User Manual
AB-V-MA-00585
RTCM Name
If using more than one RTCM Data link it is good working practice to allocate a more
descriptive Name to each link. This allows each link to be easily identified by the operator.
The use of a descriptive naming convention will assist in distinguishing the RTCM source
when operating Verify QC.
If no name is entered for an RTCM input, name will default to the VERIPOS beam name.
There are no software limitations to the number of RTCM data links that can be interfaced
into Verify QC.
4.2.1.2
RTCM Beam
Once RTCM Input has been named, use the drop down menu to identify the Beam
supplying the RTCM message.
Selecting the correct beam is important as each one has a predefined list of VERIPOS
stations.
Note: The beam selection in the receiver and Verify QC need to be paired, i.e. selecting a
Beam in Verify QC only determines which stations are displayed in the station list; it does
not control which Beam is selected in the VERIPOS demodulator.
The demodulator must also be configured to use this same Beam – see demodulator
manual.
RTCM Beam
VERIPOS recommend users tick the VERIPOS station data type box. This allows the user
to select from the predefined lists of reference stations that are available on each VERIPOS
downlink beam and ensures that the Ultra and Apex corrections will be decoded and
available.
Rev No:
Date:
A
06.05.2015
Page 19
Verify QC v1.12B User Manual
Document title:
Document No.
Verify QC v1.12B User Manual
AB-V-MA-00585
The Secondary via NTRIP must be ticked if the RTCM is being received via NTRIP.
When the Secondary via NTRIP is box ticked, if the RTCM being received via L-Band
antenna were to drop out Verify QC v1.12B switches to use NTRIP RTCM corrections.
4.2.1.3
Mode
Verify QC can automatically detect the ‘Closest 10 Stations’ received on the RTCM input
for decoding. The beam and station then do not need to be selected and are removed from
the dialogue.
VERIPOS recommends that when selecting ‘Closest 10 Stations’ all available stations are
enabled on the demodulator RTCM output port.
Alternatively if “Mode’ is set to ‘User Configurable’ the user can manually select a preferred
list of stations from the ‘Stations’ list for decode by Verify QC.
RTCM Mode selection
4.2.1.4
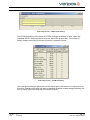
RTCM Stations
If the user has selected ‘User Configurable’, next select the actual Stations to be decoded
by Verify QC.
Note: Use VeriChart planning software available from help.veripos.com to determine the
stations appropriate for the work area. Verify QC will NOT use any selected stations that
are 2500km or more from the users’ location.
The reference station selection in the demodulator and in Verify QC need to be matched
such that all stations required for calculations in Verify QC are also enabled on the
corresponding RTCM output port of the demodulator.
Rev No:
Date:
A
06.05.2015
Page 20
Verify QC v1.12B User Manual
Document title:
Document No.
Verify QC v1.12B User Manual
AB-V-MA-00585
RTCM Stations
4.2.1.5
Additional Stations
Previously undefined VERIPOS stations can be added to the station list of a VERIPOS
beam. You will need to add these when VERIPOS announces a new station available on
that beam.
Users can add a station by selecting ‘Edit’ under Additional Stations. The Additional
Stations dialogue will open and new stations can be defined, edited or deleted:
Additional Stations dialogue
Rev No:
Date:
A
06.05.2015
Page 21
Verify QC v1.12B User Manual
Document title:
Document No.
Verify QC v1.12B User Manual
AB-V-MA-00585
Added stations will be included in the Stations list for selection.
Additional Stations
When adding new stations:
4.2.1.6
ensure the new station was indeed added to the selected beam
the demodulator configuration must be update separately to enable stations on its
RTCM output port. See the demodulator manual
IO Device
IO Device section supports demodulator status inputs via Serial Port, Client Socket and
Datagram.
Serial Port, Client Socket and Datagram connection details are detailed in the Appendix.
Note: Demodulator Status messages require different IO Device and physical connection
from the one used to input the RTCM messages.
4.2.1.7
Use of Non-VERIPOS RTCM stations
Verify QC is capable of using non-VERIPOS corrections. These corrections should comply
with the RTCM SC104 V2 format.
Stations need to be coordinated in the ITRF reference frame to ensure compatibility with
the VERIPOS reference station network.
Note: VERIPOS cannot guarantee the performance of position calculations that include
correction data from 3rd party non-VERIPOS RTCM stations.
When interfacing a non-VERIPOS RTCM source, uncheck the VERIPOS box. The RTCM
Input dialogue will change to the following layout:
Rev No:
Date:
A
06.05.2015
Page 22
Verify QC v1.12B User Manual
Document title:
Document No.
Verify QC v1.12B User Manual
AB-V-MA-00585
Non-VERIPOS RTCM Stations
Click on “New”.
A New Station dialogue helps you to define non-VERIPOS stations.
New Station
Rev No:
Date:
A
06.05.2015
Page 23
Verify QC v1.12B User Manual
Document title:
Document No.
Verify QC v1.12B User Manual
AB-V-MA-00585
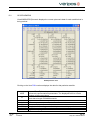
Enter the station Name and RTCM ID. The RTCM ID is obtained from the reference station
provider.
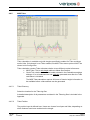
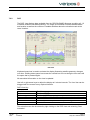
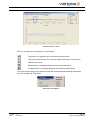
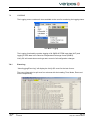
If the RTCM ID is unknown it can be read from the RTCM message header in the Verify QC
IO view after the Device IO settings have been entered.
Select “View/IO” then right click and change the input source to RTCM.
The RTCM ID is stamped at the start of the decoded RTCM header information in each
message.
In the example below, RTCM messages with ID 0505 and 0506 are being input.
View IO View
Verify QC requires the RTCM Type 3 (and when using GLONASS stations, the RTCM Type
32) to determine the reference station location. Where not present the station data will be
rejected by Verify QC.
In order to use reference stations that do not provide Type 3 and/or Type 32 message, but
are at a short range, the user needs to tick the box ‘Local Station’. Verify QC will then
assume that this station is at the users’ location, not apply any differential tropospheric and
ionospheric models, and subsequently use this correction data.
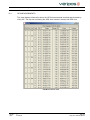
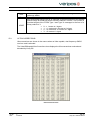
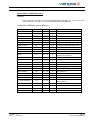
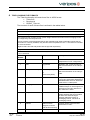
The GPS-to-GLONASS datum shift used by the reference station receiver is normally
detected automatically from the Type 3 and Type 32 messages. Users of non-VERIPOS
stations need to select the datum shift between the GPS and GLONASS reference frames
for the non-VERIPOS stations.
Options available are:
Standard shift (Topcon/Javad default)
RTCM shift (RTCM v2.3)
NovAtel shift (NovAtel default)
Zero Shift
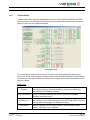
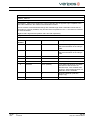
These shifts have the following predefined Helmert parameters:
Shift
Standard
RTCM
NovAtel
Zero
dX (m)
0.0
0.0
0.0
0.0
dY (m)
0.0
0.0
2.5
0.0
dZ (m)
1.0
0.0
0.0
0.0
rX (rad)
0.0
0.0
0.0
0.0
rY (rad)
0.0
0.0
0.0
0.0
rZ (rad)
-1.00e-6
-1.66e-6
-1.90e-6
0.0
Scale
1.0
1.0
1.0
1.0
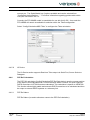
If the RTCM decoding of non-VERIPOS stations is to be automatic then the option ‘Use
Closest 3 ‘should be selected. The manual station configuration area is then made
Rev No:
Date:
A
06.05.2015
Page 24
Verify QC v1.12B User Manual
Document title:
Document No.
Verify QC v1.12B User Manual
AB-V-MA-00585
unavailable in the dialogue. Verify QC will then automatically select the closest 3 stations
based on their coordinates in the RTCM Type 3 messages and label them with identifiers
N1, N2 and N3. These stations will appear in the ‘Config/Calculation/New GNSS Calc…’
dialogues with name ‘N1 {RTCM Input Name [ID]}’ etc, as for example in the dialogue
below:
Closest Non-VERIPOS Station Names
Note: stations that do not broadcast RTCM Type 3 message will not be detected by the
automatic ‘Use Closest 3’ process and therefore cannot be used in Verify QC position
calculations.
4.2.1.8
IO Device
The IO Device section supports RTCM inputs via Serial Port, Client Socket and Datagram.
Serial Port, Client Socket and Datagram connection details are detailed in the Appendix.
Guideline settings for RTCM data: Baud Rate : 9600
Data Bits:
8
Parity:
None
Stop Bits:
1
Users should consult the demodulator manual to confirm the settings.
4.2.2
Editing Existing RTCM Inputs
The Config/RTCM menu lists all configured RTCM inputs.
Input can be selected separately for editing, deletion or change of order as required.
Rev No:
Date:
A
06.05.2015
Page 25
Verify QC v1.12B User Manual
Document title:
Document No.
4.3
Verify QC v1.12B User Manual
AB-V-MA-00585
DEMODULATOR INPUT
The demodulator input is the Demodulator Status message from the L-Band Demodulators
in VERIPOS IMUs.
To add a Demodulator Input click “Config/Demodulator Input/New…”
Demodulator Status
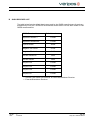
4.3.1.1
Type
Verify QC supports Demodulator Status messages from each of the following IMUs:
LD2/S
LD3/S
LD4
LD5
LD6
LD7
To determine how the messages are output from each IMU types refer to the relevant IMU
manual.
4.3.1.2
IO Device
The IO Device section supports Demodulator inputs via Serial Port, Client Socket and
Datagram.
Guideline settings for Demodulator input data: Baud Rate : 115200
Data Bits:
8
Parity:
None
Stop Bits:
1
Users should consult the demodulator manual to confirm the settings.
Rev No:
Date:
A
06.05.2015
Page 26
Verify QC v1.12B User Manual
Document title:
Document No.
4.4
Verify QC v1.12B User Manual
AB-V-MA-00585
CALCULATION
There are no software limitations to the amount of calculations that can be configured in
Verify QC. Limits are defined by the user hardware, particularly the availability of processor
and memory resources.
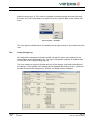
4.4.1
Settings
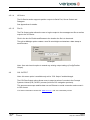
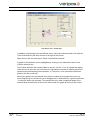
Click “Config/Calculation/Calc Settings” to bring up the Calc Settings dialogue box.
Calc Settings
It is advisable (but not essential) to enter a trial point into Verify QC to start the positioning
process. Entering the current approximate position as a trial point will speed up the
calculation process.
Alternatively Receiver Position can be used and the trial point will be based on the
uncorrected position as output by the GNSS receiver.
It is necessary to enter the user’s location when referencing the calculated positions to the
Trial Point in the Track Plot and Time Series windows. This is of help when comparing a
static point to the computed positions within Verify QC.
Rev No:
Date:
A
06.05.2015
Page 27
Verify QC v1.12B User Manual
Document title:
Document No.
4.4.1.1
Verify QC v1.12B User Manual
AB-V-MA-00585
Height
This measurement is the height of the GNSS antenna phase centre* above the waterline of
the vessel.
* Offset between the base of the antenna and the antenna phase centre differs for each type. e.g.
the AD410 antenna has an offset of 45mm between the bottom of the antenna base and the L1
phase centre. If using other types of antennae this offset must be ascertained.
The height information is used for Geoid Tides and height aided DGNSS calculations.
The antenna height is used in Tides to reduce the antenna location to the waterline before
calculating the GeoidTide values only. Hence changes to this parameter will have an
immediate effect on the estimated GeoidTide values but will not influence the estimation of
the UltraTide values.
Height aiding can be used to add an extra observation to the position calculation in order to
provide additional cover for periods when the GPS constellation is weak or insufficient to
calculate a position.
Height and Height SD values are used when Height Aiding is selected during calculation
setup.
If the Height SD value is reduced, the weighting of Height value will increase.
(See relevant sections in this manual.)
The Height SD value entered should represent the total uncertainty of:
the accuracy of the GPS antenna height measurement
the expected fluctuations in antenna height due to vessel movements caused
by swell
changes in draft and tides
the accuracy of the Geoid model
Note: Height Aiding does not fix the height.
Note: height aiding should not be used in land locked waterways (the Geoid and Mean Sea
Levels do not coincide). Height aiding is not applied to the Apex and Ultra calculations.
4.4.1.2
Fallback Smoothing
The Fallback Smoothing option is enabled by default. When enabled, this smooth’s the
transition between the Apex/Ultra solutions and their fallback /backup solutions. This is
accomplished by breaking down the distance between solutions and transitioning from the
previous solution to the active solution in smaller increments over time, the solution position
doesn’t immediately jump.
When the Fallback Smoothing option is unchecked, the transition will not be smoothed,
therefore will immediately switch between the previous and active solutions as soon as they
become active and a position jump will be observed between calculations.
The Fallback Smoothing option is primarily for use with the VERIPOS AXIOM application,
where Fallback Smoothing should be disabled.
Rev No:
Date:
A
06.05.2015
Page 28
Verify QC v1.12B User Manual
Document title:
Document No.
4.4.1.3
Verify QC v1.12B User Manual
AB-V-MA-00585
Geoid Model
Users can select the EGM96, EGM08 Geoid/Spheroid Separation Model or an externally
derived separation value, by selecting the User radio button. By default the system uses
EGM96. This geoid model is also used within the Geoid Tides functionality.
A User defined separation value should be maintained as the user moves around the area.
Note: The User option should only be used when the exact Geoid/ellipsoid separation from
an alternative source or model is known.
4.4.1.4
Elevation Mask
The user elevation mask sets the minimum elevation at which a satellite will be used in the
position calculations. By default the elevation mask is set to 10º.
The VERIPOS reference stations are all configured to provide corrections above a 7º
elevation mask.
Changing the elevation mask in Verify QC can affect which reference stations are used for
corrections, as the following logic is applied:
User elevation mask ≥ 10º
correction elevation mask = 10º
User elevation mask < 10 º and ≥ 5 º
correction elevation mask = user elevation mask
User elevation mask < 5º
correction elevation mask = 5º
A higher mask setting may be useful where satellites at slightly higher elevations are
suffering poor signal to noise ratios or intermittent masking.
Note: setting the elevation mask does not change the GNSS receiver configuration. Verify
QC manages the elevation mask setting of the GNSS receiver, which is automatically set to
0º.
Note: the VERIPOS Apex and Ultra calculations use a fixed elevation mask of 7º.
4.4.2
New DGNSS Calc
Click “Config/Calculation/DGNSS Calculation/New DGNSS Calc…” to configure a new
calculation.
Rev No:
Date:
A
06.05.2015
Page 29
Verify QC v1.12B User Manual
Document title:
Document No.
Verify QC v1.12B User Manual
AB-V-MA-00585
DGNSS Calculation dialogue
4.4.2.1
DGNSS Calc Name
Allocate a name to the calculations in the Name box. Use a descriptive name to make it
easy to identify the individual calculations when viewed in the Calculation Status window
(“View/Calculation/Status”).
If left blank Verify QC will assign a name automatically based on the number of reference
stations selected. e.g. when 5 stations are selected the software will assign the name
“Network of 5”. When one station is selected the name of that station will be assigned as
the name of the calculation.
4.4.2.2
DGNSS Calc Mode
Choose the desired calculation Mode (Uncorrected, VERIPOS Standard, VERIPOS
Standard² or GLONASS Only). Please note that the VERIPOS demodulator will have to be
enabled accordingly for the individual services required within Verify QC.
4.4.2.3
DGNSS Calc Selection
When ‘Selection’ is set to ‘As Selected Below’, the user can manually select a preferred list
of stations from the ‘Stations’ list for use within the calculation. This list is derived from the
stations that were defined under ‘Config/RTCM Input...’
Alternatively, a ‘Closest Station’ calculation can be created. Verify QC can automatically
select the closest between 1 and 6 stations within a 1500km range for use within a
calculation. Choosing one of these settings means manual selection of stations is no longer
presented as an option.
Rev No:
Date:
A
06.05.2015
Page 30
Verify QC v1.12B User Manual
Document title:
Document No.
Verify QC v1.12B User Manual
AB-V-MA-00585
DGNSS Calculation Selection
The following logic is applied for the station selection for ‘Closest Stations’ calculations:
1. Only stations within 1500km range are selected
2. Only VERIPOS stations are selected – non-VERIPOS stations are excluded
3. A ‘Standard’ calculation only selects stations with RTCM Type 1 messages
4. A ‘GLONASS Only ’ calculation only selects stations with RTCM Type 31 messages
5. A ‘Standard²’ calculation first selects stations which provide both RTCM Type 1 and
RTCM Type 31 messages. The remaining station slots are then filled with stations
that only provide RTCM Type 1 messages
4.4.2.4
DGNSS Calc Stations
Where ‘As Selected Below’ is selected users can select the Stations to be used in the
calculations.
All reference stations that were defined on each of the RTCM inputs will be available in the
Stations box in the calculation dialogue box.
Select the required reference stations by ticking that box in the list. If more than one station
is to be selected highlight the range of stations to be used and select a tick box. This will
tick all of your highlighted stations.
Rev No:
Date:
A
06.05.2015
Page 31
Verify QC v1.12B User Manual
Document title:
Document No.
Verify QC v1.12B User Manual
AB-V-MA-00585
DGNSS Calculation Stations
The stations will appear differently if you selected ‘Closest 10 Stations’ under the RTCM
Input. Then the closest VERIPOS stations all have a prefix Cn in front of their name:
DGNSS Calculation Stations – using Closest RTCM Input Stations
Selecting C1 and C3 means that the 1st and the 3rd closest stations will be used in the
calculation - independent of their station name or station ID. This means that the data for
the closest 4th station will automatically take the place of the closest 3rd station in case the
latter is no longer received.
Similarly, closest non-VERIPOS stations all have a prefix Nn in front of their names:
Rev No:
Date:
A
06.05.2015
Page 32
Verify QC v1.12B User Manual
Document title:
Document No.
Verify QC v1.12B User Manual
AB-V-MA-00585
DGNSS Calculation Stations – using Closest non-VERIPOS RTCM Input Stations
Using these closest RTCM Input feature allows the user vessel to roam a larger (or even a
Global) area without the need to closely monitor or update the station selection.
Checking the Height Aid tick box adds an observation based on the height entered in the
Calc Settings dialogue.
Note: Enabling height aiding allows the Standard, GLONASS Only and Standard²
calculations to work with as little as 3 GNSS satellites. This can be beneficial in
environments with significant masking or in geographic areas of higher ionospheric
disturbance where scintillation can effectively reduce the amount of satellites in view, or
when working in areas that are subject to masking of satellites.
4.4.3
Ultra
This menu option is available only with an Ultra enabled dongle.
VERIPOS Ultra service is based on the Precise Point Positioning (PPP) technique. Using
this technique the GNSS orbit and clock errors in the GNSS systems are corrected and
remaining system errors are estimated or mitigated to a high degree of accuracy giving a
position solution with a decimetre level accuracy.
The Ultra calculation is automatically made available when the dongle is enabled for Ultra.
The Ultra calculation is possible where the conditions exist as follows:
1. The Verify QC dongle is enabled for Ultra.
2. GPS receiver has dual channels and is receiving both frequencies.
3. The VERIPOS demodulator is enabled for the Ultra Service.
4. The Ultra “station” ID is enabled on the demodulator output port.
5. The “Veripos” check box is ticked in the Station Data dialog box.
The Ultra GPS and GLONASS (Ultra2) calculation requires the following additions:
Rev No:
Date:
A
06.05.2015
Page 33
Verify QC v1.12B User Manual
Document title:
Document No.
Verify QC v1.12B User Manual
AB-V-MA-00585
1. The Verify QC dongle is enabled for Ultra and GLONASS.
2. GNSS receiver is enabled for GPS and GLONASS, has dual channels and is
receiving both frequencies.
3. The VERIPOS demodulator is enabled for the Ultra2 Service.
4. The Ultra “GPS station” ID AND “GLONASS station” ID are enabled on the
demodulator output port.
The “Config/Calculation/Ultra” option allows users to select the PPP Mode and up to 4
backup solutions when the Ultra solution is not available.
The backup solutions can be selected from Apex or the user defined Standard or Standard2
calculations (see ‘New DGNSS Calc’ section in this manual).
The PPP Mode dictates which constellation is used in the Ultra calculation.
This will be GPS Only or GPS and GLONASS.
PPP Mode is available if Ultra and GLONASS options are enabled on the dongle and
GLONASS is ticked in Advanced Options.
If GLONASS is not enabled on the dongle or ticked in Advanced Options, the Ultra
calculation will be GPS Only.
Ultra dialogue
The logic of the backup process is as follows:
1. An Ultra solution will be output if the calculation is in ‘Ultra’ mode and has a
minimum of 5 satellites reported in the ‘Calculation Status’ view
2. Alternatively, the ‘Backup One’ solution will be output provided its mode is
‘Differential’ or ‘Reduced Differential’
3. Alternatively, the ‘Backup Two’ solution or the ‘Backup Three’ solution or the
‘Backup Four’ solution will be output provided its mode is ‘Differential’ or ‘Reduced
Differential’
4. Alternatively, an uncorrected solution will be output
Steps 2,3 & 4 are omitted from the process if no backup solutions have been selected.
Rev No:
Date:
A
06.05.2015
Page 34
Verify QC v1.12B User Manual
Document title:
Document No.
Verify QC v1.12B User Manual
AB-V-MA-00585
A smoothing process is used during switches between the different stages of the backup
process allowing Verify QC to seamlessly fall back without steps or interrupting in the Ultra
position output. The smoothing process removes the initial difference between the previous
and current calculation stage over a 100sec time period.
4.4.4
Apex
This menu option is available only with an Apex enabled dongle.
VERIPOS Apex service is based on the Precise Point Positioning (PPP) technique. Using
this technique the GNSS orbit and clock errors in the GNSS systems are corrected and
remaining system errors are estimated or mitigated to a high degree of accuracy giving a
position solution with a decimetre level accuracy.
The Apex calculation is automatically made available when the dongle is enabled for Apex.
The Apex calculation is possible where the conditions exist as follows:
1. The Verify QC dongle is enabled for Apex.
2. GPS receiver has dual channels and is receiving both frequencies.
3. The VERIPOS demodulator is enabled for the Apex Service.
4. The Apex “station” ID is enabled on the demodulator output port.
5. The “Veripos” check box is ticked in the Station Data dialog box.
The Apex GPS and GLONASS (Apex2) calculation requires the following additions:
5. The Verify QC dongle is enabled for Apex and Glonass.
6. GNSS receiver is enabled for GPS and GLONASS, has dual channels and is
receiving both frequencies.
7. The VERIPOS demodulator is enabled for the Apex2 Service.
8. The Apex “GPS station” ID AND “GLONASS station” ID are enabled on the
demodulator output port.
The “Config/Calculation/Apex” option allows users to select the PPP Mode and up to 4
backup solutions for when the Apex solution is not available.
The backup solutions can be selected from Ultra or the user defined Standard or Standard²
calculations (see ‘New DGNSS Calc’ section in this manual).
The PPP Mode dictates which constellation is used in the Apex calculation. This will be
GPS Only or GPS and Glonass. The PPP Mode is available if Apex and Glonass options
are enabled on the dongle and Glonass is ticked in Advanced Options. If Glonass is not
enabled on the dongle or ticked in Advanced Options the Apex calculation will be GPS
Only.
Rev No:
Date:
A
06.05.2015
Page 35
Verify QC v1.12B User Manual
Document title:
Document No.
Verify QC v1.12B User Manual
AB-V-MA-00585
Apex dialogue
The logic of the backup process is as follows:
1. An Apex solution will be output if the calculation is in ‘Apex’ mode and has a
minimum of 5 satellites reported in the ‘Calculation Status’ view
2. Alternatively, the ‘Backup One’ solution will be output provided its mode is
‘Differential’ or ‘Reduced Differential’
3. Alternatively, the ‘Backup Two’ solution or the ‘Backup Three’ solution or the
‘Backup Four’ solution will be output provided its mode is ‘Differential’ or ‘Reduced
Differential’
4. Alternatively, an uncorrected solution will be output
N.B. Steps 2,3 & 4 are omitted from the process if no backup solutions have been selected.
A smoothing process is used during switches between the different stages of the backup
process allowing Verify QC to seamlessly fall back without steps or interrupting in the Apex
position output. The smoothing process removes the initial difference between the previous
and current calculation stage over a 100sec time period.
Rev No:
Date:
A
06.05.2015
Page 36
Verify QC v1.12B User Manual
Document title:
Document No.
4.4.5
Verify QC v1.12B User Manual
AB-V-MA-00585
MSS Tides
Tides calculation is available only with dongles specifically enabled for Tides and Apex
and/or Ultra. If the dongle is not Tides enabled, the MSS Tides menu option will NOT be
shown in the Config menu.
Tides calculation creates Tides estimates relative to two different vertical references:
MSS Tides. This is calculated relative to Mean Sea Surface.
Geoid Tide, relative to the Geoid model selected in the Calculations settings
dialogue. It is an instantaneous tide estimate generated soon after the Tides
calculation is initialised
The MSS Tides calculation requires 39 hours of historic height information to
be available before a tide estimate can be generated
4.4.5.1
Tides Directory
Select the location for the Tides log files.
A detailed description of all parameters contained in the Tides log files is included in the
Appendix.
4.4.5.2
Tides Position
The position input is defined here. Users can choose from Apex and Ultra, depending on
which features have been enabled on the dongle.
Rev No:
Date:
A
06.05.2015
Page 37
Verify QC v1.12B User Manual
Document title:
Document No.
4.4.5.3
Verify QC v1.12B User Manual
AB-V-MA-00585
Talker
Choose the Talker between VQC and Standard.
If Standard is selected then the talker ID in the tide output files (TideInfo.txt & Doodson.txt)
will be ‘$UltraTide’.
When VQC is selected the talker ID will be ‘VQCnnnTide’, where nnn represents the Verify
QC version number. For example if Verify QC v1.12 is used, it will have a talker ID of
‘VQC112Tide’.
4.4.5.4
Tides Interval
Interval is the period over which the height information is averaged to remove the impact of
heave. A 10 minute averaging interval is recommended for the Tides calculation.
4.4.5.5
Output every second
When this box is checked the interval of the real time output of tides message is 1 second.
The message is repeated for the period set in the Tides Interval and is updated with the
new values after the interval has passed.
The Tides logged files (Tides Info and Sprint) are unaffected by this check box, they are
updated after the interval period.
4.4.5.6
Time Reference
The Time reference is the time stamp format used in the UltraTides (TidesInfo) message.
HH:MM:SS: This time format is Hour, Minutes, Seconds in UTC
GPS:
This time format is seconds starting at 00:00:00 6th Jan 1980
4.4.5.7
Output Format
MSS Tides can output the Tides information via Serial Port, Server Socket or Datagram in
addition to the Tides information being logged to file
The Output Format selects the format of data that will be output on the selected IO Device.
The output format can be set to UltraTide or SPRINT. Details of these formats can be found
in Appendix G.
The UltraTide output will not include values for Doodson, MSS Tide and Draft for the first
39hrs of use. Verify QC will re-calculate all Tide values and update the existing TideInfo.txt
file once it has enough data to populate the Doodson filter. Any separate records made
using real-time output will not benefit from this feature.
4.4.5.8
Geoid Model
Verify QC v1.12B supports the use of a Mean Sea Surface (MSS) model, relative to which
the user can estimate tides. The Mean Sea Surface is the displacement of the sea surface
relative to a mathematical model of the earth. It closely follows the Geoid (approximated by
EGM models), though with additional Mean Dynamic Topography deviations due to
Rev No:
Date:
A
06.05.2015
Page 38
Verify QC v1.12B User Manual
Document title:
Document No.
Verify QC v1.12B User Manual
AB-V-MA-00585
currents etc. The Geoid Model has 3 options available and can be selected from
“Config/Calculation/Settings…”. For further information regarding geoid models within
Verify-QC see section 4.4.1.3.
Currently the DTU10MSS model is unavailable for use with Verify-QC. As a result the
DTU10MSS will remain unavailable for selection within the Tides configuration.
Select “Config/Calculation/MSS Tides” to configure the Tides calculation.
Tides dialogue
4.4.5.9
IO Device
The IO Device section supports Real time Tides output via Serial Port, Server Socket or
Datagram.
4.4.6
PPP Ref Calculation
The PPP Ref calculation (Config/Calculation/PPP Ref/Calculation) uses the current position
of the Apex or Ultra calculation as a ‘virtual reference station’ location, for which real-time
DGPS corrections in RTCM format are calculated. This calculation is specific to VERIPOS.
This function allows highly stable and accurate DGPS corrections to be calculated and then
be output to external DGPS systems or a telemetry link.
4.4.6.1
PPP Ref Name
PPP Ref Name (is used to allocate a name to the PPP Ref calculation)
Rev No:
Date:
A
06.05.2015
Page 39
Verify QC v1.12B User Manual
Document title:
Document No.
Verify QC v1.12B User Manual
AB-V-MA-00585
PPP Ref calculation dialogue
4.4.6.2
PPP Ref Position
This allows the PPP solution to be used as the reference position for the PPP ref process
to be selected. Users can select, depending on their availability, from Ultra or Apex.
4.4.6.3
PPP Ref Elevation Mask
This sets the user elevation mask for PPP Ref calculation.
4.4.6.4
PPP Ref RTCM Output
The actual RTCM output parameters and IO Device settings are configured in a second
dialogue (Config/Calculation/PPP Ref/RTCM Output).
PPP Ref RTCM Output dialogue
4.4.6.5
PPP Ref Station Ident
Use this to set the RTCM Station ID of the PPP Ref corrections (between 0-1023).
4.4.6.6
PPP Ref Station Health
Use this to set the RTCM Station Health of the PPP Ref corrections (between 0-7
Rev No:
Date:
A
06.05.2015
Page 40
Verify QC v1.12B User Manual
Document title:
Document No.
Verify QC v1.12B User Manual
AB-V-MA-00585
As defined in RTCM v2.3, where 0 is healthy and 7 is unhealthy.
4.4.6.7
PPP Ref IO Device
The IO Device section supports RTCM output via Serial Port, Server Socket, Datagram and
to File IO. Details are in the Appendix.
4.4.6.8
PPP Ref RTCM Settings
The PPP Ref calculation can output the RTCM messages required for a single-frequency
DGPS calculation, i.e. Type 1, Type 2 and Type 3 messages.
PPP Ref also supports Type 16 messages to keep DGPS systems up to date on the source
of the DGPS corrections.
Each of these messages can be enabled and their output intervals set.
The output interval of Type 1 and Type 2 messages is defined in seconds.
The output interval of Type 3 and Type 16 messages is set in minutes.
4.4.6.9
PPP Ref Terminators
By default a carriage return (CR) is added to each RTCM message. The CR can be
removed. An additional option exists to add a Line Feed (LF) to each RTCM message.
Rev No:
Date:
A
06.05.2015
Page 41
Verify QC v1.12B User Manual
Document title:
Document No.
4.5
Verify QC v1.12B User Manual
AB-V-MA-00585
POSITION OUTPUT
There are no software limitations in the Verify QC to the number of outputs that can be
configured.
4.5.1
New
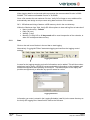
Click “Config/Position Output/New…”
New Output
This will open the following dialogue:
Output Name
Rev No:
Date:
A
06.05.2015
Page 42
Verify QC v1.12B User Manual
Document title:
Document No.
4.5.1.1
Verify QC v1.12B User Manual
AB-V-MA-00585
Position Name
A Name can be given to the output. Use a name that indicates which calculation is being
output and the external system connected.
4.5.1.2
Position
Select the Position calculation to be used. The pull down menu displays the list of all user
configured calculations.
Apex and Ultra will be included where these are enabled on the dongle.
4.5.1.3
Position Message
Select the Message type to output from:
NMEA
WesternGeco TRINAV
WesternGeco TRINAV V3
VERIPOS UKOOA Output
VERIPOS UKOOA2 Output
GPLCT
Veripos Applications - (Axiom)
The NMEA message type allows users to select one or more NMEA sentences.
Of these the GGA (DP), GLL, GST, ZDA, GNS, VTG (Default) GSA and GSV all conform to
the NMEA v3.0 standard.
Further options exist for the GGA and VTG sentences. Options are:
GGA (Default) - number of SV’s can exceed 12 and sentence length can
exceed 82 characters. Increased precision (7 decimals for Lat & Lon)
GGA (Alstom) - number of SV’s is limited to 12 and the sentence length can
exceed 82 characters. The latency value equals the actual latency divided by
12 for DGNSS solutions and divided by 36 for the Ultra and Apex solutions
GGA (PPP) - number of SV’s can exceed 12 and sentence length can exceed
82 characters. The DGPS QI parameter offers the full range from 0-9. It will
show 5 for an Ultra or Apex solution and 2 for a differential Standard or
Standard² solution. Increased precision (7 decimals for Lat & Lon)
GGA (DP) - fully NMEA-0183 v3.0 compatible string. Number of SV’s is limited
to 12 and the sentence length is restricted to 82 characters
VTG (Default) - conforms to NMEA v3.0 standard
VTG (Old) - conforms to NMEA v2.3 standard
The Axiom String is a proprietary string for use with VERIPOS INS Module (Axiom).
Detailed descriptions of Verify QC position output messages are contained in Appendices.
Rev No:
Date:
A
06.05.2015
Page 43
Verify QC v1.12B User Manual
Document title:
Document No.
4.5.1.4
Verify QC v1.12B User Manual
AB-V-MA-00585
IO Device
The IO Device section supports position output via Serial Port, Server Socket and
Datagram.
See Appendices for details.
4.5.1.5
File IO
The File Output option allows the user to log the output to the messages text file as well as
output to the IO Device.
Click in the box for Enable and Browse to the location the file is to be stored.
The split at Midnight option creates a new file at midnight and attaches a date stamp to
each filename.
File Output
Note: User also has the option to amend any existing output settings (Config/Position
Output).
4.6
CSL OUTPUT
Note: this menu option is available only with a “CSL Output” enabled dongle.
The CSL Raw Output option allows users to output a series of records to the Concept
Systems Limited (CSL) ViGPS* process (built into CSL navigation products).
This process can accept satellite data over an Ethernet or serial connection and convert it
to CSL format.
*For further information contact CSL www.csl.co.uk . CSL are a subsidiary of ION.
Rev No:
Date:
A
06.05.2015
Page 44
Verify QC v1.12B User Manual
Document title:
Document No.
Verify QC v1.12B User Manual
AB-V-MA-00585
CSL Raw Output
Allocate a name to the output. If no name is entered it will default to ‘CSL Raw Output’.
The Rx ID output must be enabled for it to become active. It is in the range of 0-99 and is
used by the receiving application to identify the source of the CSL Raw messages.
The IO Device section supports CSL Raw output via Server Socket, Datagram and File
Output.
See the Appendix for details.
Rev No:
Date:
A
06.05.2015
Page 45
Verify QC v1.12B User Manual
Document title:
Document No.
5.
Verify QC v1.12B User Manual
AB-V-MA-00585
LOGGING
5.1 – Automatic ALF logging
Verify QC can log all raw GNSS data and raw RTCM data to files in the proprietary Verify
QC logging format.
Verify QC can also log the GPS data in RINEX (Receiver INdependent EXchange) format.
Note: Verify QC automatically maintains a copy of all raw GPS and RTCM input data in
proprietary files. It keeps the last 72 hours of logged data for the current configuration.
This data is sufficient for most problem diagnostic requirements. (Subsets of the data may
be copied to other locations and sent to VERIPOS). The user only needs to manually
configure logging if it is required for own needs or to meet the survey specification.
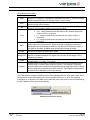
Logging menu structure
5.1
ALF
Verify QC can be configured to log all GNSS data and RTCM data to files in the proprietary
Verify QC logging format. The data can be archived and replayed at a later time to provide
the same information as seen real time, enabling additional offline analysis to be
undertaken.
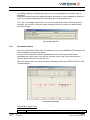
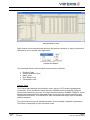
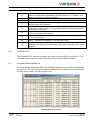
5.1.1
Edit
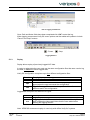
“Logging/ALF/Edit…” allows the user to set up the logging path and the desired file size
prior to starting the logging process.
Logging Control
Enter the logging file “Max Size”. Default is 1400kB.
Files are logged for fault finding may be emailed and the recommended file size is 1400kB.
Rev No:
Date:
A
06.05.2015
Page 46
Verify QC v1.12B User Manual
Document title:
Document No.
Verify QC v1.12B User Manual
AB-V-MA-00585
When logging data for review and archive purposes the recommended file size is 20005000kB. The maximum allowable file size is 10,000kB.
Once a file reaches the set maximum file size, Verify QC will open a new, additional file
automatically and assign a unique name using date and time of file creation.
QC 1.12B allows archiving of data to a USB memory stick in the root directory.
Within the ‘Maximum Age’ field, Verify QC offers options to clear old log files at intervals of:
None (continuous) – Default
Daily (24 hour)
Weekly (7 day)
Monthly (31 day) N.B. a 31 day month will be used irrespective of the calendar, to
allow for overlap and data recovery.
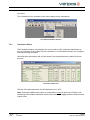
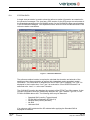
5.1.2
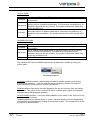
Start
Click on the red ‘record’ button in the tool bar to start logging.
Alternatively “Logging/ALF/Start” starts data logging and confirms the logging control
settings.
Logging Start Button
A name for the logging session and useful information can be added. This will show when
selecting a log for replay. VERIPOS recommend adding information on the hardware and
software configuration and operating environment. This aids analysis of the replay and
provides an opportunity to describe any specific areas for review.
Logging Parameters
Information you enter is stored in the Logging Schedule (.ars file) in the same directory as
the Verify QC logging files. Name field is used as the filename.
Rev No:
Date:
A
06.05.2015
Page 47
Verify QC v1.12B User Manual
Document title:
Document No.
Verify QC v1.12B User Manual
AB-V-MA-00585
Path to logging schedule file
Once Path and Notes fields have been completed click “OK” to start the log.
When logging commences Verify QC menu options and the toolbar will update to include
“Pause” and “Stop” buttons.
- Pause
- Stop
Logging Buttons
5.1.3
Replay
Replay allows replay of previously logged ALF data.
In order to replay data the user must use the same configuration files that were used to log
the data, in addition to actual logged data.
Verify QC configuration comprises up to four different configuration files:
Extension Description
.ver
Verify QC Configuration File
.alm
Almanac File - contains the GPS Almanac Information.
Persistence File - contains information regarding the screen
.aps
layout when the user last saved the configuration.
Type 3 Message File - contains the position of the reference
.t3m
stations used in the configuration.
Logged data comprises two different file types:
Extension Description
.alf
Log Files - contains all the raw data.
Logging Schedule File - contains the sequence of the log files.
.ars
Also contains the Name and Notes that the user added when
starting the logging session.
Note: VERIPOS recommend replay is used only with offline Verify QC systems
Rev No:
Date:
A
06.05.2015
Page 48
Verify QC v1.12B User Manual
Document title:
Document No.
Verify QC v1.12B User Manual
AB-V-MA-00585
To set replay parameters, click “Logging/ALF/Replay…”
Replay
The following dialogue box will be displayed.
Directory is the same as that set under “Logging/ALF/Edit”.
Use the “Browse” button if required to locate the logged data.
Select Replay Files
Verify QC will start scanning the logging directory for logging files and show a progress bar
Replay Files Progress Bar
When the logging session and logging file availability have been determined, select the
required Logging Schedule from the drop down at “Schedule”.
Note: Different schedules will only be available if there are more than one set of logged
data in the selected directory
Rev No:
Date:
A
06.05.2015
Page 49
Verify QC v1.12B User Manual
Document title:
Document No.
Verify QC v1.12B User Manual
AB-V-MA-00585
Replay Schedule Selection
Start and stop times will be displayed and the replay period can be amended using drop
down menus.
Time span of Replay data
After replay period is set click “OK”. Review the replay mapping window and confirm all
data to be replayed is active (displays an A in the left hand column).
If passive (P) and you require it to be active Double click on the data string to display the “Set Mode” menu.
Change the mode to active and click “OK”.
Similarly an active string can be made passive if not required in the replay.
Rev No:
Date:
A
06.05.2015
Page 50
Verify QC v1.12B User Manual
Document title:
Document No.
Verify QC v1.12B User Manual
AB-V-MA-00585
Activating Replay Data
When Replay Mapping has been set, click “OK”.
The Verify QC toolbar changes to include the following control buttons:
- Play
- Fast Forward
- Pause
- Step
- Stop
- End Replay Mode
Replay Control Buttons
Replay is controlled with Tool bar buttons or using the “Logging/ALF Replay” menu.
Replay Controls
Pause replay at any time to allow current status and data analysis.
The step forward facility helps in this process.
When the data is being replayed, the user can open views, output data as GGA text files
and monitor calculations as if the system was operating in live mode.
Input functions are disabled with software in replay mode.
If replay is used with the ‘online’ computer and data inputs are still active, the user can
revert to live mode using the “Logging/ALF Replay/Back to live” (not recommended in
practice).
Rev No:
Date:
A
06.05.2015
Page 51
Verify QC v1.12B User Manual
Document title:
Document No.
5.2
Verify QC v1.12B User Manual
AB-V-MA-00585
RINEX
Verify QC software supports RINEX v2.10 standard and can log GPS data files in the
RINEX format. Logging intervals of 1, 15 and 30 seconds are available.
RINEX Logging menu
RINEX logging must be ticked in Tools/Advanced Options before RINEX logging can be
used.
Use “Logging/RINEX/Edit…” to bring up the RINEX Logger dialogue box.
The RINEX Logger dialogue appears:
RINEX Logging
Rev No:
Date:
A
06.05.2015
Page 52
Verify QC v1.12B User Manual
Document title:
Document No.
5.2.1.1
Verify QC v1.12B User Manual
AB-V-MA-00585
RINEX – Version
RINEX files that comply with the v2.10 standard can be logged.
5.2.1.2
RINEX Station
This is for entering a four character Station identifier, which will be used as the first 4
characters of the RINEX log files.
5.2.1.3
RINEX Run By
The operators’ name may be entered.
5.2.1.4
RINEX Observation Interval
The files are automatically split at midnight if an interval is not selected.
The drop down menu allows users to select RINEX Logging Interval of 1, 15 or 30 seconds.
RINEX data at a one second interval will amount to approximately 100Mb per day.
A one second interval is recommended or even required for dynamic users.
15 and 30 second intervals are more suited to static users.
Hourly creates a new file every hour.
5.2.1.5
Measurement Control
The three Measurement Control dialogue boxes C/A, L1 and L2 are used to select the
GNSS observation types to be recorded in RINEX files.
Note: which observation types are available is GNSS receiver dependant. Observations not
available from the receiver will be greyed out.
If the receiver only outputs C/A measurements - L1 and L2 dialogue boxes will be greyed
out. Similarly, if receiver outputs C/A and L1 measurements but not L2, the L2 dialogue
box will be greyed out.
The Marker, Antenna, Observer and Comments inputs allow configuration of the header
within the RINEX file. It is recommended these are as complete as possible to aid postprocessing and identification.
Click ‘Confirm’ to complete the RINEX logging configuration.
Following this the ‘Record’, ‘Play’ and ‘Pause’ control buttons are visible in Tool Bar.
Note: users are required to manually start RINEX logging after setting the following
parameters for measurement control.
Rev No:
Date:
A
06.05.2015
Page 53
Verify QC v1.12B User Manual
Document title:
Document No.
Verify QC v1.12B User Manual
AB-V-MA-00585
Manually start RINEX logging by selecting the “Start RINEX Logging” control button on
the toolbar or “Logging/RINEX/Start “.
Rev No:
Date:
A
06.05.2015
Page 54
Verify QC v1.12B User Manual
Document title:
Document No.
6.
Verify QC v1.12B User Manual
AB-V-MA-00585
ACTION
The Action drop down menu allows for commands to be sent to the processes as shown in
the screen below:
Action Menu
6.1
RECEIVER
Note: GLONASS entries in the menu are only available if the dongle has been enabled for
GLONASS.
Establish and Set receiver Baud Rate entries are only available when a GNSS receiver has
been connected using a serial port and set to communicate at matching baud rates.
6.1.1
Details
“Action/Receiver/Details” displays details of connected receiver hardware and software.
Details vary on the receiver type used. Typically they include the receiver serial number
and firmware version.
Receiver Details View
The view will populate only when Verify QC is connected to a receiver.
This example is for a Topcon receiver.
Rev No:
Date:
A
06.05.2015
Page 55
Verify QC v1.12B User Manual
Document title:
Document No.
6.1.2
Verify QC v1.12B User Manual
AB-V-MA-00585
Initialise
“Action/Receiver/Initialise” sends commands to configure the receiver for use with Verify
QC.
Note: this does not set or change the communication parameters. Interface the GPS
receiver to Verify QC using “Config/GNSS Rx” prior to using this command.
Users are not required to initialise the receiver once the software is operational.
Required when setting up a new system or when Verify QC stops receiving data from the
GNSS Receiver.
6.1.2.1
GPS/GLONASS Request Ephemeris
The command requests the latest GPS or GLONASS ephemeris data from the receiver.
These settings can be accessed via “Action/Receiver/GPS/Request Ephemeris” and
“Action/Receiver/GLONASS/Request Ephemeris”.
Verify QC will actively request the ephemeris during normal software operation as required.
Users are not required to request the ephemeris once the software is operational.
6.1.2.2
Request Almanac
“Action/Receiver/GPS/Request Almanac” and “Action/Receiver/GLONASS/Request
Almanac” - requests the latest GPS or GLONASS almanac data from the receiver.
Verify QC actively requests the almanac. Not required once the software is operational.
6.1.2.3
Request Iono
“Action/Receiver/GPS/Request Iono” requests the latest GPS ionospheric model
information from the receiver.
Verify QC actively requests the ionospheric model information. Not required once the
software is operational.
6.1.3
Establish Baud Rate
Note: the receiver IO Device must first be set up as Serial Port for this function to work
within Verify QC.
If this is not done prior to use the option to establish a baud rate with the connected GNSS
receiver will not be available.
Rev No:
Date:
A
06.05.2015
Page 56
Verify QC v1.12B User Manual
Document title:
Document No.
Verify QC v1.12B User Manual
AB-V-MA-00585
Selecting Action/Receiver/Establish Baud Rate will open the Baud Rate Monitor status
window. Verify QC will start to cycle through the range of baud rates and attempts to
establish a connection with the GNSS Receiver.
Establish Baud Rate status window
Once Verify QC detects the receiver current baud rate setting it will report that it is
connected to the receiver at this specific baud rate. See the example dialogue below.
Establish Baud Rate status window
6.1.4
Set Receiver Baud Rate
This feature is particularly useful if the initial baud rate was too low for the GNSS receiver
data to flow continuously.
Note: you cannot change the baud rate until you have established communications with the
receiver via a serial port. See earlier sections describing the procedure for set up of serial
port GPS comms.
Rev No:
Date:
A
06.05.2015
Page 57
Verify QC v1.12B User Manual
Document title:
Document No.
Verify QC v1.12B User Manual
AB-V-MA-00585
Selecting Action/Receiver/Set Receiver Baud Rate to select a different baud rate.
The software sends commands to the receiver to change the baud rate and attempts
connection at this new baud rate.
Set Receiver Baud Rate dialogue
6.1.5
Send Command
“Action/Receiver/Send Command” allows specific commands to be sent to the receiver.
These must conform to the receivers’ proprietary command structure.
Refer to manufacturer’s documentation for details.
Send Message
Note: take care when sending additional commands to the receiver.
These may interfere with normal operation of Verify QC.
Rev No:
Date:
A
06.05.2015
Page 58
Verify QC v1.12B User Manual
Document title:
Document No.
6.2
Verify QC v1.12B User Manual
AB-V-MA-00585
MSS TIDES
Note: the Tides function is a dongle controlled, advanced function of the Verify QC
software. Ensure your dongle is enabled for MSS Tides.
It can be used with VERIPOS Apex and Ultra services. The MSS Tides function allows a
vessel to determine local tidal height.
6.2.1
Reset
It is possible to reset the Tide calculation process manually when the work area changes or
essential input information is known to have changed such as the antenna height above the
waterline. Previously logged data is deleted and the Tides logging process starts afresh.
Following reset the MSS Tide calculation requires an initialisation period of 39 hours.
A Geoid Tide calculation gives an instantaneous tides estimate.
Tides Reset Dialogue Box
A tick box option to archive logged Tide information is presented before resetting.
Select an archive location where the two log files will be stored using “Browse…”
6.2.2
Archive
Logged Tide information can be archived whilst the Tide calculation is active.
Archiving the tide log files will not automatically reset the process.
The Archive function will copy the Tides logging files to a selected directory.
Files may be split using the drop – down box between daily, weekly or monthly.
Note that the Monthly option covers a 31 day period.
To delete an existing Tides logging file, select the ‘Delete files after archiving’ tick box.
Rev No:
Date:
A
06.05.2015
Page 59
Verify QC v1.12B User Manual
Document title:
Document No.
Verify QC v1.12B User Manual
AB-V-MA-00585
Tides Archive Dialogue Box
The file naming conventions for logged archived data will vary dependant on the file
splitting option which is selected:
None – TideInfo.txt
Daily – TideInfo_YYMMDD.txt
Weekly – TideInfo_GPSWWWW.txt (WWWW is the GPS week number)
Monthly – TideInfo_YYMM.txt
Note: Sprint.txt and Doodson.txt file naming conventions will follow the same pattern
as above. For weekly files, Sunday is defined as the first day of the week.
6.3
POP UP DOP WARNINGS
DOP Warnings inform the users about future periods of bad geometry or low satellite count.
They appear at the centre screen with an audible alarm.
Advance DOP warnings alert the user about the weakness of the available GNSS
constellation in the work area. More detailed information is available from the DOP View
when the icon button is selected.
The DOP Warnings appear if the number of SV’s is <6 and if PDOP is >10 during the next
12 hours.
The DOP view shows the elevation mask setting.
It may be possible to increase the number of satellites and improve the DOP by reducing
this elevation mask under Config/Calculation/Settings.
This dialogue permits DOP warnings to be disabled.
Restore DOP warnings in Action/DOP Warnings/Display Current DOP Warnings.
Rev No:
Date:
A
06.05.2015
Page 60
Verify QC v1.12B User Manual
Document title:
Document No.
Verify QC v1.12B User Manual
AB-V-MA-00585
Example DOP Warning Pop-up
The above example shows two periods of poor DOP and one period of low satellite
numbers forecast over the coming 12 hour period.
Verify QC’s program menu is locked-out when the warning pop-up box is open.
The pop-up will disappear when the warning is acknowledged. Access to Verify QC’s
program menu is restored.
Additional DOP warnings for the next 12 hours are shown in the ‘Info Bar’ at the bottom left
of the Verify QC main program window. These are independent of the DOP warning
enable/disable status.
6.3.1
Disable
The DOP warning feature can be disabled by ticking the ‘Do not show this dialogue again’
box or select “Action/DOP Warnings/Disable”.
The DOP warning status can be reversed by selecting “Action/DOP Warnings/Enab.”.
6.3.2
Display Current DOP warning
To recall the most recent warnings select “Action/DOP Warnings/Display Current DOP
Warnings.”
6.4
CSL RAW OUTPUT
6.4.1
Output Ephemeris / Ionospherics / UTC
These options force the instant output of Ephemeris, Ionospheric and UTC CSL Raw
records on the configured CSL Raw Output IO device.
Rev No:
Date:
A
06.05.2015
Page 61
Verify QC v1.12B User Manual
Document title:
Document No.
6.4.2
Verify QC v1.12B User Manual
AB-V-MA-00585
Reset ID Mapping
The CSL Output Format requires the RTCM Station IDs to be in a 2 digit format (00 to 99).
The RTCM Format allows station IDs from 0000 to 1024. As a result Verify QC maps the
stations received within Verify QC to the 2 digit format. This is done by assigning the first
received reference station to 00, the second received reference station to 01 and so on
until all received stations have been mapped to a 2 digit code.
Selecting the menu item Reset ID Mapping allows the ID number scheme (0 – 99) to be
reset
Note: These functions apply where the dongle is enabled for CSL output and Verify QC is
providing an output to a Concept Systems Limited navigation system.
These actions are available under Action/CSL Raw Output/
Action CSL Raw Output
Rev No:
Date:
A
06.05.2015
Page 62
Verify QC v1.12B User Manual
Document title:
Document No.
6.5
Verify QC v1.12B User Manual
AB-V-MA-00585
ARCHIVE DATA
Verify QC maintains automatically a copy of all raw GPS and RTCM input data in
proprietary (ALF) file format. By default the last 72 hours of logged data is retained.
Archived data for previous configurations is retained for 7 days before being removed
automatically.
“Action/Archive Data” selects all or a continuous subset of data and copies it to another
location.
Verify QC 1.12B adds an icon shortcut to the main control bar:
This feature has been implemented for when software performance issues are identified
and data and configuration files have to be forwarded to VERIPOS for further analysis.
Archive Data
To archive data click “Browse” and select the location. Verify QC will scan automatically
and display the available logged data files with the start/end times available in drop down
menus. File name syntax is YYMMDD_HHMMSS.
The Verify QC configuration and status files to be archived are selected by ticking check
boxes.
Note 1: Data can only be archived after the configuration has been saved.
Note 2: Archiving current data will not delete it. Verify QC will always keep the last 72
hourly log files.
Note 3: The automatic logging function is independent of the normal (manual) Verify QC
data logging function (configured under: Logging/ALF or RINEX/ Edit).
Continuous manual logging of Verify QC data is configured at “Logging/Edit” and requires a
manual start. Manual log files are limited to a maximum size of 10MB.
Note 4: Manually logged data cannot be archived using the archive data function. This data
should be recovered using windows Explorer for saving.
Rev No:
Date:
A
06.05.2015
Page 63
Verify QC v1.12B User Manual
Document title:
Document No.
6.6
Verify QC v1.12B User Manual
AB-V-MA-00585
GENERATE STATUS REPORT
Verify QC automatically generates a ‘Status Report’ at midnight.
The report contains information about the availability of GNSS measurements, GNSS cycle
slips, GNSS satellite health status, the availability of RTCM messages and the availability
of positions.
Should the user require an ad hoc report select Action/Generate Status Report.
Select the location and filename of the report and click Save.
Generate Status Report
6.7
IMPORT VERICHART FILE
Verify QC contains a station list for the global VERIPOS network, valid on the date of
software release.
VERIPOS recommend an update is downloaded on a regular basis.
Information is contained in Verichart Station Configuration File format.
The updated station list is on the VERIPOS support website:
http://help.veripos.com
Use “Action/Import Verichart File” to import a file into Verify QC.
Rev No:
Date:
A
06.05.2015
Page 64
Verify QC v1.12B User Manual
Document title:
Document No.
Verify QC v1.12B User Manual
AB-V-MA-00585
Import Verichart File
When the file is loaded updated global station information is used to display the coverage
on the Station Map.
6.8
SYNCHRONISE PC CLOCK
Use “Synchronise PC Clock” facility to adjust the PC time to Verify QC system time (GPS
time).
The Synchronise PC Clock option will not work in Windows 7 unless the User Account
Control option is set to Never Notify.
To Set the UAC follow the steps below:
Open Control Panel – User Accounts and select the option for Change User Account
Control Settings
Set the UAC to Never Notify and select OK.
After clicking OK restart the PC to apply changes.
Rev No:
Date:
A
06.05.2015
Page 65
Verify QC v1.12B User Manual
Document title:
Document No.
Rev No:
Date:
A
06.05.2015
Verify QC v1.12B User Manual
AB-V-MA-00585
Page 66
Verify QC v1.12B User Manual
Document title:
Document No.
7.
Verify QC v1.12B User Manual
AB-V-MA-00585
VIEW
The View menu contains all views available to the user for monitoring the data input, data
quality, positioning and QC status of Verify QC.
View menu structure
When Verify QC has been configured for use* the user can select the required display
screen information.
It is recommended that only windows required for the current operation are opened.
Verify QC does not require windows open on the screen to function correctly.
*Note: The range of options available in the View menu is dependent on the dongle enable
status or your settings. View these at Tools/Advanced Options.
7.1
IO
Select “View/IO” to display scrolling IO data. This terminal window allows the user to view
the data input and output on a specified port. Correct decoding of the input data is printed
in green with the decoded data header printed in black. If input data is NOT decoded
correctly or is corrupted it will be printed in red or not at all. Output data is printed in blue.
IO View
Right clicking in the IO view allows the user to change the data source.
All defined inputs to, or outputs from Verify QC can be monitored.
Rev No:
Date:
A
06.05.2015
Page 67
Verify QC v1.12B User Manual
Document title:
Document No.
Verify QC v1.12B User Manual
AB-V-MA-00585
View IO Options
Pause and Fixed Font options are available to aid data interpretation.
7.2
GNSS
The GNSS menu section contains views relating to the GNSS receiver and satellites.
View GNSS Menu
7.2.1
SNR
SNR displays the Signal to Noise Ratios, measured in dbHz for each GPS/GLONASS
satellite in view.
The following characteristics are displayed by the various GPS receiver types:
Rev No:
Date:
A
06.05.2015
A stronger signal is displayed when the signal indicator moves to the right side
of the window
The width of the signal indicator summarises the recent variation in signal
strength
A large hatched area indicates unstable tracking
When the signal strength becomes critical the colour of the signal indicator
changes to yellow and then red Parameters are set in the system.
Satellites at higher elevations have higher signal strengths and are less prone
to noise. All signals are normal in the figure below
Page 68
Verify QC v1.12B User Manual
Document title:
Document No.
Verify QC v1.12B User Manual
AB-V-MA-00585
SNR Measurements View
GPS satellites are identified by their PRN number and are preceded by a ‘G’. GLONASS
satellites by their slot number and are preceded by a ‘R’. The slot number for GLONASS
refers to the transmit frequency slot for each satellite. GPS uses a pseudo random code
number (PRN) to identify satellites.
Clicking SV, AZ, EL L1 or L2 changes the vertical order in which the window displays the
data.
Right clicking will do the same using a menu. This allows selection of the ‘GPS Source’.
(Feature only available when a second GNSS receiver input is configured for the Heading
Calculation).
SNR View Options
SNR View:
SV
EL
AZ
CA & L2
Rev No:
Date:
A
06.05.2015
Space Vehicle. For GPS satellites this is the Pseudo Random Noise code, a
unique identifier for each satellite. GLONASS satellites use the slot number
as unique identifier for each satellite. (Indicates the unique slot in the
GLONASS constellation)
Elevation. The elevation angle measured in degrees that the satellite resides
above the horizon at the user location
Azimuth. This is a horizontal angle measured in degrees from the north
direction to the direction of the satellite. This is relative to the user’s location.
This is the SNR value, measured in dBHz, of the carrier at frequencies L1
and L2 respectively L2 frequency is only available when using a dual
frequency receiver with a dual frequency antenna.
Page 69
Verify QC v1.12B User Manual
Document title:
Document No.
7.2.2
Verify QC v1.12B User Manual
AB-V-MA-00585
DOP
The DOP view displays data available from the GPS/GLONASS Almanac providing a 6, 12
or 24hour window used when planning. The range of information includes satellite status
and location as well as the number of useable satellites above the elevation mask at the
users’ location.
DOP View
Keyboard space bar is used to animate the display illustrating satellite geometry changes
over time. Holding down space bar causes the vertical bar to move along the time axis until
the space bar is pressed again.
All associated information on the view is updated.
Use left or right arrow keys to adjust the display at 6 minute intervals. The ‘time’ bar can be
dragged with the mouse to any required location.
DOP View Key
Line Colour
Black
Red
Green and Blue
White
Yellow
Red
Detail
Predicted PDOP
Predicted HDOP
Healthy GPS and GLONASS satellites above the elevation mask
Satellites below the mask
Unhealthy satellites (unavailable for positioning)
Disabled
The animation can also be started by right clicking on the DOP view and selecting ‘Start
Animation’.
Rev No:
Date:
A
06.05.2015
Page 70
Verify QC v1.12B User Manual
Document title:
Document No.
Verify QC v1.12B User Manual
AB-V-MA-00585
By default the DOP view predicts the Next 6 Hours.
Time windows of the DOP view can be increased to the Next 12 Hours, to display a Full
Day. Set the Display Mode using right click in the DOP view.
DOP View Display Mode
Right click can also be used to hide GLONASS constellation details.
7.2.3
Almanac
This is an Advanced View. See Appendices for detailed description.
7.2.4
SV Health
“View/SV Health” displays the current health status of all the GPS and/or GLONASS
satellites in view.
SV Health View
Rev No:
Date:
A
06.05.2015
Page 71
Verify QC v1.12B User Manual
Document title:
Document No.
Verify QC v1.12B User Manual
AB-V-MA-00585
GPS SV Health
SV
Enabled
Ephemeris
Almanac
Identifies the GPS satellite PRN number
Satellites enabled or disabled by the user in the current Verify QC software
configuration
Shows the satellite health status based on ephemeris data. This is the
primary source of satellite health status. The information is available only for
satellites tracked at the user location. The number indicates the health flag
as per the GPS ICD.
Shows satellite health status based on the ephemeris data. This is the
secondary source of satellite health status. Information is available for all
satellites in the constellation. The number indicates the health flag per GPS
ICD.
GLONASS SV Health
Slot
Enabled
Ephemeris
Almanac
Identifies the GLONASS satellite slot number
Satellites enabled or disabled by the user in the current Verify QC software
configuration
Gives satellite health status based on ephemeris data. This is the primary
source of satellite health status. The information is available only for
satellites tracked at the user location. The number indicates the health flag
as per the GLONASS ICD.
As for GPS satellites
The individual GPS and GLONASS sections can be displayed or hidden by ticking the
system name.
SV Health View Options
Unhealthy satellites transmit a warning flag uploaded by satellite ground control during
maintenance operations. Verify QC uses this flag to temporarily prevent the data from
these satellites from being used in position calculations.
Disabled satellites have been manually flagged by the user for exclusion from the position
calculations. This option covers a scenario in which a satellite goes “rogue” and transmits
bad data without being flagged unhealthy.
GPS/GLONASS satellites - users can disable satellites in the matrix on the Verify QC menu
bar at the top of the screen.
Unhealthy satellites are already shown in yellow. Individual satellites can be disabled and
removed from all calculations by clicking on the satellite number. This number will be in red
to indicate its disabled status.
Rev No:
Date:
A
06.05.2015
Page 72
Verify QC v1.12B User Manual
Document title:
Document No.
Verify QC v1.12B User Manual
AB-V-MA-00585
Click on the satellite number to Toggle between enable/disable.
SV Disable/Enable
Note: Use this facility with caution. The status of any disabled satellite should be frequently
reviewed. Leaving healthy satellites in a disabled condition can seriously reduce positioning
accuracy and stability.
7.2.5
Missing SV Constellation Plot
The missing SV Constellation Plot indicates satellite observations missing for one or more
epochs. Verify QC uses the GPS and GLONASS almanac to determine the satellites above
the user’s elevation mask and their visible position. If a GPS or GLONASS observation is
not received a dot with the GPS PRN/GLONASS slot number is indicated on the colour
constellation plot.
Colour provides additional information on the missing observation type as indicated by the
on-screen legend.
Possible causes of missing satellites are:
masking
intermittent tracking due to external interference
intermittent tracking due to low signal levels
unhealthy satellites
Observations for unhealthy satellites will be missing continuously. These create a yellow
arc on the plot.
When unhealthy satellites are not reported as being unhealthy by the receiver they will
appear as a red arc on the plot.
Rev No:
Date:
A
06.05.2015
Page 73
Verify QC v1.12B User Manual
Document title:
Document No.
Verify QC v1.12B User Manual
AB-V-MA-00585
Missing SV Constellation Plot View
Missing SV Plot – Poor Tracking/Corrected for Heading
View options are selected by right clicking on the view.
GLONASS can be hidden.
Missing SV Constellation Plot View Options
By default the missing satellites are plotted with azimuths relative to the True North
direction. These can be corrected for heading such that the constellation plot becomes
‘fixed’ to the vessel and relative to the Vessel Direction.
This allows vessel specific masking areas to be identified by the user.
Calculated heading is less accurate when the vessel has a very low velocity.
The correction for vessel heading takes place only when the vessel velocity exceeds
3km/hr.
Rev No:
Date:
A
06.05.2015
Page 74
Verify QC v1.12B User Manual
Document title:
Document No.
Verify QC v1.12B User Manual
AB-V-MA-00585
Switching the view to “Correct for Heading” may reduce the number of points on the
constellation plot.
The plot will display missing satellite data for the last 24 hours.
Clear the buffer by right clicking on the view and select this option.
7.2.6
GPS Ephemeris
This is an Advanced View. See appendices for a detailed description.
7.2.7
GPS CCF
This is an Advanced View. See appendices for a detailed description.
7.2.8
GPS Measurements
This is an Advanced View. See appendices for a detailed description.
7.2.9
GLONASS Ephemeris
This is an Advanced View. See appendices for a detailed description.
7.2.10
GLONASS CCF
This is an Advanced View. See appendices for a detailed description.
7.2.11
GLONASS Measurements
This is an Advanced View. See appendices for a detailed description.
Rev No:
Date:
A
06.05.2015
Page 75
Verify QC v1.12B User Manual
Document title:
Document No.
7.3
Verify QC v1.12B User Manual
AB-V-MA-00585
DIFFERENTIAL
The Differential menu contains all views relating to correction data.
View Differential Menu
7.3.1
Latency
The “View/Differential/Latency” view displays information about the age of the correction
data for all stations and services with RTCM inputs.
Latency View
Rev No:
Date:
A
06.05.2015
Page 76
Verify QC v1.12B User Manual
Document title:
Document No.
Verify QC v1.12B User Manual
AB-V-MA-00585
The view contains separate columns for the various differential services provided by
VERIPOS.
The VERIPOS Ultra and VERIPOS Apex messages contain orbit & clock correction data for
the GPS and GLONASS satellites.
VERIPOS ‘Standard’ messages contain correction data for the L1 GPS ranges at the
reference stations.
VERIPOS ‘GLONASS’ messages contain correction data for the L1 GLONASS ranges at
the reference station
The green circle next to the reference station name indicates the receipt of the reference
station location information. This circle is red if this information has not yet been received
(viewed at start-up). Verify QC will not use differential corrections from a reference station
until its location is known. The station locations are saved to file so that Verify QC does not
wait to reacquire them every time the configuration is restarted.
The left-hand edge of the bar shows how old the current correction was when first received
by Verify QC. Since the messages are time stamped when generated by the reference
station, Verify QC is able to determine their age.
The right-hand side of the bar advances across the display until a new correction is
received. Values next to the bar show the current age (latency) of the current correction
message.
A threshold of 120 sec applies for Type 1 and Type 31 messages. When this threshold is
exceeded data is rejected and the calculation mode changes to uncorrected as shown in
the Calculation Status view.
A threshold of 360 seconds applies to the Ultra and Apex correction messages and when
this is exceeded the calculation mode Ultra and Apex become uncorrected.
The latency bar moves from left to right as the latency increases.
A traffic light colour scheme applies to the latency bars: Colour
Green
Yellow
Red
Latency (%)
less than 50% of the threshold
latency exceeds 50% of the threshold
latency exceeds 75% of the threshold
The view can be customised to hide the GLONASS column or to hide the key. The Time
Period can also be changed - this will not affect the latency thresholds for each of the
correction message types. The Key helps to identify each RTCM input.
Rev No:
Date:
A
06.05.2015
Page 77
Verify QC v1.12B User Manual
Document title:
Document No.
Verify QC v1.12B User Manual
AB-V-MA-00585
Latency View Options
The Latency View can operate in a Standard or Arrival Mode. Users can set the mode by
right click on the screen.
In Arrival Mode the Latency view only shows the age of the corrections when they arrive.
In Standard Mode, the columns show the correction latency as bars.
Clicking on blue reference station names will open a Differential Data view for the station.
Clicking on the blue Ultra name opens the VERIPOS Ultra Corrections view. Similarly, the
VERIPOS Apex Corrections view can be opened by clicking on the blue Apex name.
7.3.2
Polar Plot
Polar Plot displays information regarding the GPS and GLONASS satellite constellations at
the users’ location and at the reference stations.
This view shows which satellites are in the sky and the status of these satellites.
Information is based on the reference station location and received GNSS almanac
information. The polar plot will be empty if this information is absent.
Polar Plot View
Rev No:
Date:
A
06.05.2015
Page 78
Verify QC v1.12B User Manual
Document title:
Document No.
Verify QC v1.12B User Manual
AB-V-MA-00585
The polar plot is used to indicate the status of the corrections and the local observations.
The legend at the right hand side of the chart gives an interpretation for each colour used.
Details for GLONASS constellation can be hidden - right click on the view and select ‘Hide
GLONASS’.
7.3.3
Station Map
“View/Differential/Station Map” opens a map of the user work area. The map is scaled
automatically to fit the users’ location and the location of all reference stations selected in
RTCM inputs and from which station location information has been received.
Station Map View
Options are available using right click.
Station Map View Options
The map can be copied as an image and the tables and legend can be hidden.
Rev No:
Date:
A
06.05.2015
Page 79
Verify QC v1.12B User Manual
Document title:
Document No.
Verify QC v1.12B User Manual
AB-V-MA-00585
By default the map will zoom in to the user location and the stations for which corrections
have been received.
The map can be changed to show the VERIPOS coverage, displaying all stations in the
global VERIPOS network.
It can also be adjusted to show the 5º, 15º and 30º elevations of all satellite delivery links.
Station Map View – Global Coverage
Use the mouse to draw a box on the map and zoom to that area. Use zoom out / zoom in
icon to move back to the previous map.
7.3.4
Station Data
This is an Advanced View. See appendices for a detailed description.
7.3.5
Ultra Corrections
This is an Advanced View. See appendices for a detailed description.
7.3.6
Apex Corrections
This is an Advanced View. See appendices for a detailed description.
7.3.7
Rev No:
Date:
Type 16 Messages
A
06.05.2015
Page 80
Verify QC v1.12B User Manual
Document title:
Document No.
Verify QC v1.12B User Manual
AB-V-MA-00585
View/Differential/Type 16 Messages opens a view showing details for received Type 16
messages.
Reference stations may issue additional station information or status updates by sending a
Type 16 message containing ASCII information up to 90 characters long.
The Type 16 messages view lists for one (or more) stations the time of the last received
message, the number of times the same message has been received, the station name
and the message.
Type 16 Messages View
7.3.8
Demodulator Status
When the Demodulator Status input is enabled on one or more VERIPOS RTCM inputs this
view will display the status information.
View presents a table with decoded information from the last 5 demodulator status
messages and a time series view, with the minimum (red), mean (blue) and maximum
(green) voltage values for the last 24 hours.
Note: this feature does not support the status messages output by VERIPOS LD2S or LD3G2 demodulators.
Demodulator Status View
Demodulator Status Table
Time
Rev No:
Date:
A
06.05.2015
time of the demodulator status message
Page 81
Verify QC v1.12B User Manual
Document title:
Document No.
Verify QC v1.12B User Manual
AB-V-MA-00585
Quality
Losses
Errors
Channel
BER
Voltage
Freq
Flags
Service
Quality Figure representing the percentage of error free data blocks received
since the previous status message
number of received data block sync losses recorded since the previous status
message
number of encoded data block errors recorded since the previous status
message
VERIPOS satellite beam selected
minimum, average and maximum values of the bit error rate (BER) recorded
since the previous status message Range E5 – E7.
minimum, average and maximum values of signal strength voltage recorded
since the previous status message. 2.0 – 3.5v.
tuning frequency offset for the demodulator
representation of the five status flags or diamonds displayed on the Signal
Status Page. The state of the flags is recorded throughout the time interval. It
will read 11111 if no losses have been detected. If one or more flags changes
state during the time interval, the corresponding bit in the TEST message will
change to 0 and remain in this state until the start of the next measurement
interval
service identifier. R or V refers to a VERIPOS provided service. U indicates
an unrecognised service. In the event of significant interruption of the
received signal, this field may appear blank
Demodulator Status View Options
Right clicking on the view menu allows the user to view the demodulator status information
of another demodulator source or simplify by hiding the table or the graph.
Rev No:
Date:
A
06.05.2015
Page 82
Verify QC v1.12B User Manual
Document title:
Document No.
7.4
Verify QC v1.12B User Manual
AB-V-MA-00585
CSL OUTPUT STATION IDS
The CSL Output Format requires the RTCM Station IDs to be in a 2 digit format (00 to 99).
The RTCM Format allows station IDs from 0000 to 1024. As a result Verify QC maps the
stations received within Verify QC to the 2 digit format. This is done by assigning the first
received reference station to 00, the second received reference station to 01 and so on
until all received stations have been mapped to a 2 digit code. If the CSL IDs to be
allocated exceeds 99, internally Verify QC shall to continue to number upwards, e.g. 100,
101, 102 etc. In the CSL output it will however restart at 00. In the CSL ID index table it
will show 00*, 01*, 02* to indicate that these ID’s are duplicates.
This view shows the station mapping for the configuration in use.
CSL Output Station IDs
Rev No:
Date:
A
06.05.2015
Page 83
Verify QC v1.12B User Manual
Document title:
Document No.
Verify QC v1.12B User Manual
AB-V-MA-00585
Calculation
The Calculation menu contains all the views relating to the calculations
View Differential Menu Structure
7.4.1
Calculation Status
The Calculation Status view displays the current status of the configured calculations to
give an indication of the quality of these calculations. All calculations setup in the Configure
Calculations page are listed.
Ultra and Apex calculations will only be shown if the dongle has been enabled for these
services.
Calculation Status View
The top of the table shows the current date and time in UTC.
Note: Clicking the left mouse button on a calculation name will open up a Position view
containing more detailed calculation status information, with toggle between advanced and
simple views.
Rev No:
Date:
A
06.05.2015
Page 84
Verify QC v1.12B User Manual
Document title:
Document No.
Verify QC v1.12B User Manual
AB-V-MA-00585
Calculation Status Data
Name
Mode
F-Test
Unit Var.
Semi Major
# Stns
# SVs
PDOP
Rev No:
Date:
A
06.05.2015
Name allocated to the calculation by the user
Current mode of the calculation. This is the prime indicator of the current
calculation status. Possible modes are: As Received – indicates the position as generated by the external
GPS receiver
No Position
No Solution
Uncorrected – no differential correction has been applied
L1 – Solution using single frequency measurements
L1/ L2 – Solution using Dual frequency measurements
Diff – differential corrections have been applied for all stations
Reduced– differential corrections have been applied for some
stations
GPS – Solution using GPS Constellation only
GPS+GLO – Solution using GPS and GLONASS Constellations
Uncorrected (Settling) – Ultra initialisation fixes
Ultra DGPS (Settling) – initial Ultra orbit & clock corrected fixes
Ultra (Settling) – Ultra converging
Ultra – Ultra converged
Apex DGPS (Settling) – initial Apex orbit & clock corrected fixes
Apex (Settling) – Apex converging
Apex – Apex converged
BU 1: ‘Backup One calculation mode’
BU 2: ‘Backup Two calculation mode’
Reduced Diff - data from some stations is not received
BU1 or BU2 indicate the Ultra or Apex calculation is currently unavailable
and that the Backup One or Backup Two calculation is being output. The *
indicates that backup smoothing is active. The backup smoothing is used in
the transition from Ultra or Apex to BU1 or BU 1 to BU 2 and vice versa to
ensure a seamless transition avoiding a step in the position.
An indication of the overall fit of the observations to the statistical model. The
F-Test does not detect the source of any errors but gives an indication as to
the pass or failure status of the test.
The ratio between actual and modelled errors. Values range around 1.
Spikes in the unit variance indicates outliers and erroneous pseudo-range
measurements.
95% semi-major axis of the error ellipse shown in the Track Plot view
Number of reference stations for which corrections are being used in the
calculation
Number of satellites used in the calculation. Combined GPS and GLONASS
calculations follows the syntax ‘x + y’ with x being the number of GPS
satellites and y being the number of GLONASS satellites
Positional Dilution of Precision indicates the strength of the geometry for
determining a 3D position estimate and a basic accuracy indicator
Page 85
Verify QC v1.12B User Manual
Document title:
Document No.
Verify QC v1.12B User Manual
AB-V-MA-00585
If Verify QC detects a problem in a position calculation the name of the calculation in the
Calculation Status view changes colour. A yellow background indicates a warning about
possible position quality degradation whilst red text indicates a calculation failure.
Other possible causes of the name field changing to yellow will be the loss of a reference
station or a high DOP value, as shown below.
Calculation Status Warning
7.4.2
Position
View/Calculation/Position first opens the ‘Simple’ version of the position view. This displays
the calculation name, the time (UTC) and the geographical coordinates.
No statistical parameters are shown.
Height is the height above the Geoid model, selected by the user in
Config/Calculation/Settings either EGM96, EGM08 or a user defined Geoid separation.
Simple Position View
Advanced (bottom right) opens the view showing calculation statistics.
Rev No:
Date:
A
06.05.2015
Page 86
Verify QC v1.12B User Manual
Document title:
Document No.
Verify QC v1.12B User Manual
AB-V-MA-00585
Advanced Position View
Right clicking in this window allows editing of the position calculation or copying contents to
clipboard for use in another word application.
Position View Options
The Advanced Position View includes several sections including:
Positions Table
General Statistics Table
Notes Table
Error Ellipse View
Constellation View
Position Table
The Position table displays the calculation name, the time (UTC) and the geographical
coordinates. These include the height above the WGS84 reference ellipsoid. Using the
Geoid model selected by the user in Config/Calculation/Settings (EGM96, EGM08 or a user
defined Geoid separation) this ellipsoidal height is also split into a Geoid separation and
height above this Geoid. The reference for each coordinate and height value is indicated
between brackets.
The right hand column gives standard deviation of the individual coordinate components.
The bottom row displays current calculation mode.
Rev No:
Date:
A
06.05.2015
Page 87
Verify QC v1.12B User Manual
Document title:
Document No.
Verify QC v1.12B User Manual
AB-V-MA-00585
Position View – Position Table
Position Table
When the Tides function (dongle dependent) is enabled, the Position Table for Apex or
Ultra will include three extra rows,
Additionally, the user will enter height of the antenna above the waterline and the
calculated MSS Tide and Geoid Tide values, which are displayed.
Position View – Position Table
General Statistic Table
The General Statistics Table provides the main statistical parameters associated with the
calculated position.
Rev No:
Date:
A
06.05.2015
Page 88
Verify QC v1.12B User Manual
Document title:
Document No.
Verify QC v1.12B User Manual
AB-V-MA-00585
Position View – General Statistics Table
This table displays the following information: Confidence
Power
F-Test
Deg. Of
Freedom
Unit Var.
RMS
Semi-Major
Semi-Minor
Angle
DOP
PDOP
HDOP
VDOP
SOG
CMG
Rev No:
Date:
A
06.05.2015
reliability of the position indicating that 99% of the positions are contained
within the error ellipse
measures the tests ability to reject the null hypothesis when it is actually
false
indication of the overall fit of the observations to the statistical model. The FTest does not detect the source of any errors; it will give only an indication as
to the pass or failure of the test.
number of additional observations compared to the unknown quantities that
are being solved for. When the number of observations equals the number of
unknowns there is no redundant information in the position calculation
the ratio between the actual and modelled errors. The expected value of unit
variance is 1. Occasional small values are of no concern; however large
values can indicate a bias in the data. Spikes in the unit variance indicate
outliers and erroneous pseudo-range measurements
Root Mean Square is a statistical measure of the scatter of computed
positions around a “Best Fit” position solution. This is shown in meters
Semi-Major axis of the error ellipse produced by the calculation
Semi-Minor axis of the error ellipse produced by the calculation
direction of the Semi-major axis from the centre of the error ellipse
Dilution of Precision is a measure of the strength of the satellite geometry at
the receiver. The DOP value can be used as a multiplier to the standard
deviation of the GPS measurements to derive an estimated standard
deviation of the position
Positional DOP is a 3 dimensional measure of the accuracy composed of
Horizontal DOP and Vertical DOP
Horizontal DOP is a two dimensional measure of the accuracy of the
horizontal position
Vertical DOP is an indicator of the strength of the calculation in the height
component
Speed over the Ground
Course Made Good
Page 89
Verify QC v1.12B User Manual
Document title:
Document No.
Verify QC v1.12B User Manual
AB-V-MA-00585
The bottom row of the General Statistic Table lists the PRN number (G) of the GPS
satellites used in the calculation. Slot numbers (R) of the GLONASS satellites is displayed.
Notes Table
The Notes Table lists statistical parameters.
Position View – Notes table
This table displays the following information: Notes
PRN
Station
SD
Resid
ResisSD
mde
wStat
wTest
East
North
Up
Rev No:
Date:
A
06.05.2015
displays general information such as a reference station being out of range,
missing data or data being rejected
a unique identification PRN or slot number for each GPS and GLONASS
satellite respectively.
reference station name
standard deviation of the corrected pseudo-range
residual of the corrected pseudo-range in the position computation
standard deviation of the residual
Marginally Detectable Error is the smallest error identified by the w-test with a
probability of 80%
figure used in the w-test
w-test is used to prove the null hypotheses by testing against a series of
alternative hypothesis. These are formulated to describe any possible error
pattern, or combination of error patterns. If the error turns out to be
statistically significant for any of the alternative hypotheses the null
hypotheses will be rejected in favour of the particular alternative, if no
alternative then the null hypothesis will be accepted. If this w-test matched the
proposed error patterns with the error patterns found in the observation, and if
no match is found, the null hypothesis is accepted
component of external reliability on the measurement, i.e. the effect an error
the size of the mde would have on the East component of the position
a component of external reliability on the measurement, i.e. the effect an error
the size of the mde would have on the North component of the position
component of external reliability on the measurement, i.e. the effect an error
the size of the mde would have on the North component of the position
Page 90
Verify QC v1.12B User Manual
Document title:
Document No.
Verify QC v1.12B User Manual
AB-V-MA-00585
Error Ellipse and Constellation View
The error ellipse and its scale (default scale is 5m) are displayed with the constellation of
the GPS and GLONASS satellites. GPS satellites are white circles. GLONASS satellites
are white squares.
Position View – Error Ellipse and Constellation View
7.4.3
Tides
View/Calculation/Tides opens the Tides table and a time series view. The view options are
accessible via right click.
Tides View Menu Options
The user can choose from nine time series:
Antenna Height:
Geoid Tide:
MSS Tide*
Rev No:
Date:
A
06.05.2015
a time series plotting the minimum, maximum and mean height of
the GPS antenna relative to the user selected Geoid model.
Points are added at the user selected interval
a time series, plotting the minimum, maximum and mean height
of the vessel waterline relative to the user selected Geoid model.
Points are added at the user selected interval
Time series plotting the minimum, maximum and mean height of
the vessel waterline relative to the Tide filter estimate of Mean
Sea Surface. Values displayed are called the MSS Tide. Points
are added at the user selected interval.
Page 91
Verify QC v1.12B User Manual
Document title:
Document No.
Verify QC v1.12B User Manual
AB-V-MA-00585
Hourly Height
Hourly Tide*
MSS Reference*
Draft Change
Vertical Bias
User-Entered Antenna
Time series plotting the minimum, maximum and mean height of
the GPS antenna relative to the user selected Geoid model.
Points are added at an hourly interval
Time series plotting the minimum, maximum and mean height of
the vessel waterline relative to the Tide filter estimate of Mean
Sea Surface. Values displayed are called MSS Tide. Points are
added at an hourly interval.
Time series plotting the Tide filter estimate of Mean Sea Surface.
Points are added hourly.
Time series plotting the change in Draft. This is calculated as the
current Doodson value minus the Doodson value for the first
record.
Time series plotting the vertical bias detected between MSS Tide
and Geoid Tide.
Time series plotting the User entered height of the antenna
above the waterline. As entered in “Config/Calculation/Settings”
* Estimate is only available after 39 hours of continuous operation.
Verify QC v1.12B now supports a Mean Sea Surface (MSS) model, relative to which the user can
estimate tides. The Mean Sea Surface is the displacement of the sea surface relative to a
mathematical model of the earth. It closely follows the Geoid (approximated by EGM models),
though with additional Mean Dynamic Topography deviations due to currents etc.
The implemented model is DTU10MSS, created by the Danish National Space Institute (see
http://www.space.dtu.dk/english/Research/Scientific_data_and_models/Global_Mean_sea_surface).
This model has been derived by processing satellite altimetry datasets acquired over 17 years. The
grid used by Verify QC has a 2-minute by 2-minute resolution and an estimated accuracy of better
than 10cm.
The first five time series contain three separate lines for the minimum (red), mean (blue)
and maximum (green) height or tide values.
Tides View – Table and Time Series
Rev No:
Date:
A
06.05.2015
Page 92
Verify QC v1.12B User Manual
Document title:
Document No.
Verify QC v1.12B User Manual
AB-V-MA-00585
The Tides View includes several sections including the Tidal Height table, the MSS
Calculation table, the Input Status Table, the Current Status table and the time series
graph.
Tidal Height table
Time
Count
Average
Std. Dev.
Minimum
Maximum
Ave SD
Latitude
Longitude
Semi Major
Geoid Sep.
Time for which information is valid
Number of height samples used for deriving listed results
Height average
Standard deviation of height values included in average
Minimum of height values included in average
Maximum of height values included in average
Average of the standard deviation of height values included in
average
Latitude at given time
Longitude at given time
Average of semi major of height values included in average
Separation between the Geoid and the WGS84 reference
ellipsoid
MSS Calculation table
MSS
Count
Latest
Date
Time
Tide filter overall estimate of MSS
Sequence number of local hourly estimate of MSS
Most recent Tide filter local estimate of MSS
Date for which information is valid
Time for which information is valid
Tides View – MSS Calculation Table
Input Status table
Status
Date
Time
Hold-off
Accuracy
Rev No:
Date:
A
06.05.2015
Status of height input into Tide filter. Can show ‘No Position’,
‘Converging’, ‘Converged’
Date for which information is valid
Time for which information is valid
Can show ‘Active’ or time until hold-off period expires
Shows reported standard deviation of the current height input
If the standard deviation exceeds the threshold it also shows
the threshold
Page 93
Verify QC v1.12B User Manual
Document title:
Document No.
Verify QC v1.12B User Manual
AB-V-MA-00585
Tides View – Input Status Table
Current Statistics table
Centre
Count
Mean Height
Height SD
Min Height
Max Height
Shows time and date for the current averaging period
The number of accepted height input values during the current
averaging period, followed by ‘OK’ (if count exceeds the
minimum 50% required to generate a valid result)
Average height during the current averaging period
Standard deviation of the the heights during the current
averaging period
Minimum height during the current averaging period
Maximum height during the current averaging period
Tides View – Current Statistics Table
7.4.4
PPP Ref
The PPP Ref calculation uses the current position of the selected Apex or Ultra calculation
as a virtual reference station location.
This allows highly stable and accurate DGPS corrections to be calculated, which can be
output to external DGPS systems or a telemetry link.
Note: the PPP Ref calculation will only generate an RTCM output whilst the selected Apex
or Ultra calculation has an converged status, i.e. respectively reports ‘Apex’ or ‘Ultra’ in the
Calculation Status View
The full status of the PPP Ref calculation can be monitored using View/Calculation/PPP
Ref ….
The view displays the status of the PPP position calculation (used as a virtual reference
station location). Initially, following the start of the PPP calculation, only the PPP position
and its calculation status (Mode) are shown in the PPP Ref view. Once the PPP calculation
Rev No:
Date:
A
06.05.2015
Page 94
Verify QC v1.12B User Manual
Document title:
Document No.
Verify QC v1.12B User Manual
AB-V-MA-00585
is converged, i.e. reports ‘Apex’ or ‘Ultra’, the status of RTCM DGPS corrections that are
currently being output is also displayed.
PPP Ref View – Position Status Table
Once the calculation Mode, depending on the selected PPP solution, reaches an ‘Ultra’ or
‘Apex’ status, the view expands to include the DGPS corrections for the satellites above the
elevation mask set in the PPP Ref calculation configuration dialogue.
PPP Ref View – Position Status and Correction Data Table expanded view
PPP Ref Differential Data
PRN
Elev
Azi
Iono
Tropo
Rev No:
Date:
A
06.05.2015
Pseudo Random Noise code. A unique identification number
for each GPS satellite. E.g. PRN 13 refers to the satellite that
transmits the 13th weekly portion of the P code
Elevation. The elevation angle measured in degrees that the
satellite resides above the horizon at the reference station
location
Azimuth. This is a horizontal angle measured in degrees from
the north direction to the direction of the satellite. This is
relative to the reference station location
The delay in meters caused by the Ionosphere to the GPS
signal from the particular satellite. An ionospheric delay value
derived from the Klobuchar model in the Almanac
The delay in meters caused by the troposphere to the GPS
signal from that satellite at the reference station. Value is
derived using the Hopfield model.
Page 95
Verify QC v1.12B User Manual
Document title:
Document No.
SF
PRC
Rate
UDRE
IODE
Verify QC v1.12B User Manual
AB-V-MA-00585
This is the scale factor as a code which could be either 0 or 1:
0 = scale factor for pseudo range correction is better
than 0.02 meter and for range rate correction is 0.002
meter/second
1 = scale factor for pseudo range correction is better
than 0.32 meter and for range rate correction is 0.032
meter/second
PRC is the Pseudo Range Correction as observed on the L1
pseudo-range at the reference station
This is the rate of change, in meters, of the pseudo-range
corrections
User Differential Range Error. An estimate of the performance
of the satellites pseudo-range as measured at the reference
station in meters. This number is provided as part of the
RTCM Type 1 messages in the form of a binary code 0 to 3:
0: ≤ 1 meter at 1 sigma
1: > 1 meter and ≤ 4 meter at 1 sigma
2: > 4 meter and ≤ 8 meter at 1 sigma
3: > 8 meter at 1 sigma
Data Ephemeris identifies the set of ephemeris parameters.
Gives the user a means of detecting change
The PPP Ref position table displays the GPS week, day and time and the geographical
WGS84 coordinates for the Apex or Ultra solution.
The table also includes the height above the Geoid model selected by the user in
Config/Calculation/Settings and the separation value from this Geoid model.
The column to the right shows the standard deviation of the individual coordinate
components.
The rows underneath show the latency of the last received Apex / Ultra corrections, the
Unit variance, Semi-Major and PDOP of the calculated PPP Position and its calculation
mode.
Rev No:
Date:
A
06.05.2015
Page 96
Verify QC v1.12B User Manual
Document title:
Document No.
7.5
Verify QC v1.12B User Manual
AB-V-MA-00585
QC
“View/QC” accesses views displaying the position status and quality information.
View QC Menu
7.5.1
Error Ellipses
Error Ellipses displays position error ellipses over the entire calculation setup.
Each ellipse is colour coded for ease of identification and a key displays the solution
deviation compared to the selected reference solution.
Error Ellipses View
Rev No:
Date:
A
06.05.2015
Page 97
Verify QC v1.12B User Manual
Document title:
Document No.
Verify QC v1.12B User Manual
AB-V-MA-00585
The error ellipses view can be altered using the scroll wheel of the mouse.
Highlight the error ellipse for a specific calculation by clicking on the calculation name in the
Position box.
Right clicking in the window allows the user to change parameters:
Error Ellipses View – Reference Position
The “Reference Position…” can be set to any of the position calculations or the Trial Point
(Config/Calculation/Settings) if the system is stationary. The selected solution is shown in
the index in bold print.
“Hide Tracks” allows the user to remove the track plots for all the calculations in the Error
Ellipse display
“Hide Table” allows the user to hide the key completely.
Error Ellipses View – Position Mode
The “Position Mode…” can be set to Relative or Absolute:
Rev No:
Date:
A
06.05.2015
Relative - Displays the position calculations relative to the Reference Position.
This can be fixed (i.e. Trial Point) or moving (i.e. a Position Calculation). The
chosen Reference Position remains in the centre of the screen with the other
positions shown relative to it.
Absolute - Displays all Position Calculations in their actual positions. In a
moving environment, none of the positions will be centred and will all move
around the screen. For a known reference position the differences are shown
for each position.
Page 98
Verify QC v1.12B User Manual
Document title:
Document No.
Verify QC v1.12B User Manual
AB-V-MA-00585
Error Ellipses View – Scale
“Scale” can be changed and the plot Re-Centred to the current position. The Track Plot
can be copied to the PC’s clipboard as a bitmap image for pasting into applications.
7.5.2
Time Series
The time series plot is used to monitor the performance of positions calculated over a
known period of time. Users can select one of five predefined views from the tabs at the top
of the display:
7.5.2.1
Position
Difference
UKOOA
Statistics
Scatter
Position
The default Position view shows Delta East, Delta North & Delta Height of the calculated
positions (relative to the reference position selected by the user).
Right mouse click on the view to select the reference position.
Time Series View – Reference Position
Rev No:
Date:
A
06.05.2015
Page 99
Verify QC v1.12B User Manual
Document title:
Document No.
Verify QC v1.12B User Manual
AB-V-MA-00585
Time Series View
7.5.2.2
Difference
The Difference View show the differences in position between each consecutive position
fix. This is an indication of positioning stability.
View shows the 1st differences for each calculated position including Number of SV’s and
the Unit Variance.
7.5.2.3
UKOOA
The UKOOA View shows the primary statistical parameter present within the UKOOA
output. The view includes the Semi-major axis, Unit Variance, Internal Reliability, 2D
External Reliability and RMS.
7.5.2.4
Statistics
Shows range of general Statistics, namely HDOP, PDOP, RMS, Number of SV’s, Number
of Stations and Latency.
7.5.2.5
Scatter
The Scatter View shows a 2D North-East scatter plot of the positions.
This view has the following appearance: -
Rev No:
Date:
A
06.05.2015
Page 100
Verify QC v1.12B User Manual
Document title:
Document No.
Verify QC v1.12B User Manual
AB-V-MA-00585
Time Series View – Scatter Plot
In addition to selecting the five predefined views, users can customise each view with the
Time Scale and Plot pull down menus to the right of the screen.
Right click on the view and select “Show Controls/Hide Controls”.
A graph for a calculation can be highlighted by clicking on the calculation name in the
Position selection box.
The Position selection box can be hidden or shown. Use the + icon to expand the display.
When the box is open the user can select the calculations required for plotting (select the
square boxes) and selecting the calculation, or Trial point - to be used as the reference
position (tick the round box).
Moving the pointer over a particular time series or scatter plot changes the cursor to a
zoom magnifying icon and a box can be dragged over a selected area - right mouse button
- to start the area to be reviewed. This pauses the view, adds a magnified graph of the
selected area at the bottom of the screen and a small, full graph at the top of the screen:
Rev No:
Date:
A
06.05.2015
Page 101
Verify QC v1.12B User Manual
Document title:
Document No.
Verify QC v1.12B User Manual
AB-V-MA-00585
Time Series View – Zoom
Zoom in as many times as required. Icon functions:
Pauses the live update view to review a previous period
Play option puts the user into real time mode and jumps to current time
Refresh the screen
Back button for stepping between previous zoomed areas
Forward button for stepping between successive zoomed areas
The right mouse button in the window of both the time series and scatter plot accesses
menu to change the Time Scale:
Time Series View Options
Rev No:
Date:
A
06.05.2015
Page 102
Verify QC v1.12B User Manual
Document title:
Document No.
Verify QC v1.12B User Manual
AB-V-MA-00585
Change the Y-scale of the vertical axis by moving the mouse pointer to the vertical axis and
double clicking.
Select Automatic or customise:
Time Series View – Y-Scale
The Time Series view can be copied to the PC’s clipboard as a bitmap image for pasting
into MS Paint or MS Word.
Rev No:
Date:
A
06.05.2015
Page 103
Verify QC v1.12B User Manual
Document title:
Document No.
7.5.3
Verify QC v1.12B User Manual
AB-V-MA-00585
Overall Status
“View/Overall Status” opens a detailed summary view of the GPS/GLONASS and RTCM
data input status, the calculation status and the data output status and provides a general
picture of the Verify QC operational status.
Overall Status View
The overall status view has three zones. The area to the left indicates the status of the
inputs, the centre area indicates the status of the received GPS/GLONASS and RTCM data
and the area to the right indicates the status of the outputs. Each area is described in more
detail as follows:
Inputs area
Receiver
GPS / GLONASS
‘RTCM Link x’
Constellation
Rev No:
Date:
A
06.05.2015
indicates if the receiver data is being received and decoded. When
both halves are green the receiver data is receiving and decoding
successfully. Red indicates a failure.
indicates whether almanac information is available for each satellite
(green). Unhealthy satellites are shown in yellow and disabled
satellites are shown in red.
indicates that the RTCM data for each RTCM input is being received
and decoded. If both halves are green then the RTCM data is received
and decoded successfully. Red indicates a failure.
shows the location of GPS (green circle) and GLONASS (orange
square) satellites and their status (white = below elevation mask,
yellow = unhealthy, red = disabled).
Page 104
Verify QC v1.12B User Manual
Document title:
Document No.
Verify QC v1.12B User Manual
AB-V-MA-00585
L1/L2 area
GPS / GLONASS
Ephemeris
Corrections
Calculations
indicates whether the pseudo-range, carrier and Doppler observations
for satellites above the horizon have been received (green). Satellites
below the elevation mask at the user end are shown in white.
indicates if GPS and GLONASS ephemeris data for satellites above
the horizon have been received. Satellites below the elevation mask at
the user end are shown in white.
indicates whether GPS L1 (Type 1), GPS L2 (Type 15) and GLONASS
L1 (Type 31) corrections have been received (green) for the listed
satellites at each reference station. Missing corrections are shown in
red and satellites ‘just above the elevation mask’ at the reference
station without corrections are shown in orange. Satellites below the
elevation mask at the reference station are shown in white. The circle
before the station name indicates whether a Type 3 with the station
position has been received (green = yes, red = no). The circle after the
station name indicates whether the correction data is within the latency
thresholds (green < 60sec, orange < 90 sec, and red > 90sec).
indicates which satellites are included in the position calculation
(green). Satellites not included in the calculation (due to missing
GPS/GLONASS observations or their corrections, or due to w-test
rejection) are shown in red, as are disabled satellites. Satellites below
the elevation mask at the user end are shown in white.
Outputs area
‘Output x’
indicates the output status of each position output. Green indicates a
data message output recently and the number indicates the length of
message.
The appearance of the view can be changed by selecting the relevant options after right
clicking on the view.
Overall Status View Options
Mouse clicking on each coloured box will open the relevant view with additional information.
Clicking on the receiver input, RTCM input and position output boxes will open the IO View.
Clicking on the corrections area will open the Differential Data view for that particular
station. Clicking on the calculation area will open the Position view for that particular
calculation.
It is also possible to open the Almanac, GPS & GLONASS Ephemeris, GPS & GLONASS
Measurements, Latency and Station Map by clicking on the relevant areas.
Rev No:
Date:
A
06.05.2015
Page 105
Verify QC v1.12B User Manual
Document title:
Document No.
7.5.4
Verify QC v1.12B User Manual
AB-V-MA-00585
Calculation History
The calculation history displays a history of the main events against a time scale. The top
bar provides a general overview of event happenings and the time period. The black box
acts as a viewfinder and can be moved along the time axis. Depending on the overall time
scale an area of 5, 30 or 60 minutes is magnified in the bottom bar. The left-hand column
describes the event whilst the right-hand column shows the time-span.
Calculation History View
The time period can be changed by using the mouse to right click in the screen. Time
period options are 1, 6, 12 and 24 hours. The user can select also the calculation for the
calculation history to be displayed: -
Calculation History View Options
7.5.5
Status Report
The Status Report view provides 3 views to monitor the availability of GNSS measurements
and correction data.
The primary view is the GNSS Availability View. The view is split into an availability bar
indicating the availability of GPS and GLONASS measurement sets against the present
day’s 24-hour time scale and an availability table indicating the availability of GPS and
GLONASS measurements against 5º elevation brackets.
The availability bar appears continuous with a green colour for all measurement sets. A
missing measurement set will appear as a black vertical line to indicate a break in the GPS
and/or GLONASS data input. A missing measurement set may be caused by a break in the
data connection to the receiver, corruption of the data stream or total loss of data due to
interference.
Rev No:
Date:
A
06.05.2015
Page 106
Verify QC v1.12B User Manual
Document title:
Document No.
Verify QC v1.12B User Manual
AB-V-MA-00585
The availability table will, for each 5º elevation bracket, indicate what percentage of
expected CA, L1 and L2 observations were received in Verify QC. Percentage values less
than 100% may for example be caused by (low elevation) antenna masking or intermittent
tracking due to interference.
Status Report View – GNSS Availability
Note: which observation types are monitored depends on the GNSS receiver type. The
Septentrio AsteRx2 receiver, for example, does not output L1 observations and the column
therefore will appear blank when using that GNSS receiver type.
The view options dialogue, accessible via a right mouse click on the view, allows
GLONASS information to be hidden and the contents of the Status Report View to be
changed to show GNSS Health History information or RTCM Availability information.
Status Report View Options
The GNSS Health History View shows the PRN or Slot Number of GPS and GLONASS
satellites, and the time period they were unhealthy, against the present day’s 24-hour time
scale.
Rev No:
Date:
A
06.05.2015
Page 107
Verify QC v1.12B User Manual
Document title:
Document No.
Verify QC v1.12B User Manual
AB-V-MA-00585
Status Report View – GNSS Health History
The RTCM Availability View shows the RTCM message availability of Ultra, Apex and
individual DGPS reference stations since the start of the present day. The number of
station outages exceeding 5 minutes is listed in a separate column.
Status Report View – RTCM Availability
The view options dialogue allows the current status report information to be exported to an
Excel file. Selecting this option will open a standard Windows browse dialogue allowing the
user to select a file name and path for the status report.
Rev No:
Date:
A
06.05.2015
Page 108
Verify QC v1.12B User Manual
Document title:
Document No.
Verify QC v1.12B User Manual
AB-V-MA-00585
Status Report View – Generate Status Report
Rev No:
Date:
A
06.05.2015
Page 109
Verify QC v1.12B User Manual
Document title:
Document No.
7.6
Verify QC v1.12B User Manual
AB-V-MA-00585
LOGGING
The Logging menu contains all views available to the user for monitoring the logging status.
View Menu - Logging
The Logging functionality contains logging of all GNSS & RTCM input data (ALF) and
logging of GPS data in the Receiver Independent Exchange format (RINEX).
Verify QC will create also event logs and a record of all configuration changes.
7.6.1
Event Log
“View/Logging/Event Log” will display the Verify QC event for the last 4 hours.
The event information is split over four columns with the heading Time, Mode, Event and
Source respectively.
Rev No:
Date:
A
06.05.2015
Page 110
Verify QC v1.12B User Manual
Document title:
Document No.
Verify QC v1.12B User Manual
AB-V-MA-00585
Event Log View
The Time column displays date and time information. The Mode column indicates if the
event is for the users’ information or if it constitutes a warning. Warnings are displayed
when critical data inputs time out. The Event column provides a description of the event.
The Source column gives an indication of which process detected the event.
The event log can be sorted by any of the columns. Clicking on the column name changes
the sort order for each column. Alternatively the sorting parameters can be set by right
clicking on the view menu and selecting options under ‘Sort by’.
Event Log View – Sort By Options
Individual columns can be hidden by right clicking on the view and selecting options under
‘Show’.
The Display Mode of the event log can be changed. The live mode can be paused or set to
display a past event log file.
Event Log View – Display Mode Options
The user can view the events of previous days by right clicking on the view menu and
selecting “Display Mode…/File.” The full list of event files associated with the current
configuration are shown and are available for selection.
Event Log View – Select File
Rev No:
Date:
A
06.05.2015
Page 111
Verify QC v1.12B User Manual
Document title:
Document No.
Verify QC v1.12B User Manual
AB-V-MA-00585
Whilst the event log is in ‘File’ mode it is possible to browse through the event files using
the ‘Next’ and ‘Prev’ commands or to select the file for a specific date via the ‘Select’ submenu.
Event Log View – File Mode
The view options outlined above are available also by right clicking on the header bar of the
view.
7.6.2
Config Change Log
All configuration changes are stored in an XML file with the same name and kept in the
same location as the configuration file. This log of configuration changes is displayed also
in Verify QC in the Config Change log View.
The view contains a record of the date and time of the change, a title and a description of
the change. Further details of the change can be displayed by clicking on the ‘+’ symbol at
the start of the specific change entry. Similarly, the details can be collapsed.
Rev No:
Date:
A
06.05.2015
Page 112
Verify QC v1.12B User Manual
Document title:
Document No.
Verify QC v1.12B User Manual
AB-V-MA-00585
Config Change Log View
In addition to the software storing all configuration changes automatically, the user can add
notes to the log (XML file). The ‘Add Notes to Config Change Log’ dialogue will open
following a right mouse click on the view and selecting ‘Add to Log’.
Config Change Log Add Notes Dialogue
7.6.3
RINEX
“View/Logging/RINEX” opens the RINEX logging status view and displays the
Measurements, Header and Stats chosen from the option menu at the top of the view.
Rev No:
Date:
A
06.05.2015
Page 113
Verify QC v1.12B User Manual
Document title:
Document No.
Verify QC v1.12B User Manual
AB-V-MA-00585
See RINEX standards for further details about the displayed RINEX data records.
RINEX View - Measurements
Rev No:
Date:
A
06.05.2015
Page 114
Verify QC v1.12B User Manual
Document title:
Document No.
Verify QC v1.12B User Manual
AB-V-MA-00585
RINEX View - Header
The RINEX ‘Stats’ view shows the current logging path and the size of the current data file.
Rev No:
Date:
A
06.05.2015
Page 115
Verify QC v1.12B User Manual
Document title:
Document No.
8.
Verify QC v1.12B User Manual
AB-V-MA-00585
TOOLS
The Tools menu offers a small selection of amenities to enhance Verify QC operations.
Tools Menu Structure
8.1
LOCK CONFIG
The configuration file in use can be secured by means of a password. Using “Lock Config”
allows file protection by the entry of a password (at least 6 characters long). It is
recommended that all Users are advised of this password for access to the configuration
once it has been locked.
Locking the configuration file will disable access to configuration menus. However, users
can still change the window display, and make any other cosmetic changes.
Lock Config
Rev No:
Date:
A
06.05.2015
Page 116
Verify QC v1.12B User Manual
Document title:
Document No.
8.2
Verify QC v1.12B User Manual
AB-V-MA-00585
COM PORT MAPPING
All COM ports can be allocated descriptive names in this dialogue box. The COM ports can
be named according to their function after the various external devices have been
interfaced, for example COM1 = GPS input. This will aid the user in selecting the correct
COM ports for input and outputs when configuring Verify QC.
Note: when using this feature, please ensure that the physical connections between the PC
and the Receivers are not changed, as this will create confusions in future configuration
setups.
COM Port Mapping
To edit the COM Port name double click on its name in the dialogue box. If required COM
ports can be disabled so that they cannot be selected for inputs or outputs in Verify QC.
This is particularly useful if some ports have already been reserved for other applications.
COM Port Editing
Rev No:
Date:
A
06.05.2015
Page 117
Verify QC v1.12B User Manual
Document title:
Document No.
8.3
Verify QC v1.12B User Manual
AB-V-MA-00585
ADVANCED OPTIONS
The user can disable certain advanced views or software options using “Tools/Advanced
Options”.
Advanced Options dialogue
The Advanced Options dialogue also appears on start-up of the software.
Enabling / disabling views or options affects the functionality and views accessible through
the Verify QC menu structure.
The Advanced Views appear deselected by default. If views are enabled their enable status
is stored in the configuration file such that the same view will be available when the user reopens the configuration file.
The Options currently supported by the dongle are all selected by default in a new
configuration. Several additional options can be selected. Options not supported by the
dongle are greyed out. For options selected or deselected the selection status is stored in
the configuration file such that the option is set correctly when the configuration file is reopened.
The manual covers all option dependent functionality and views by describing the full menu
structure.
If certain functionality or views are absent the user is advised to check the dongle enable
status under “Help/Dongle/View…” and the selections under “Tools/Advanced Options.”
If using a Topcon or Javad receiver please refer to the Topcon Prefilter section (Section
3.4) of this manual.
Rev No:
Date:
A
06.05.2015
Page 118
Verify QC v1.12B User Manual
Document title:
Document No.
9.
Verify QC v1.12B User Manual
AB-V-MA-00585
WINDOWS
In the “Windows” menu all open Verify QC views can displayed in Tile or Cascade format.
The “Windows” menu also shows all current windows open. Selecting these options makes
the window active. The active window has a tick displayed next to the label in the menu.
Window Menu
Rev No:
Date:
A
06.05.2015
Page 119
Verify QC v1.12B User Manual
Document title:
Document No.
10.
Verify QC v1.12B User Manual
AB-V-MA-00585
HELP
The Help menu contains utilities for reprogramming dongles and gives access to the
revision history, the User Manual and the software About details.
10.1
DONGLE, UPGRADES AND HELPDESK
10.1.1
View
“Help/Dongle/View” allows the user to see the current status of the Verify QC Dongle.
Help Dongle Menu
The Dongle view displays the amount of time left on the dongle activation and the software
features enabled for the dongle. It also shows the most recent dongle upgrade
Confirmation Code, which has to be supplied to the VERIPOS Helpdesk after the dongle
has been upgraded with new features.
Verify QC will remind the user by means of a pop-up warning box when the dongle has less
than 7 days remaining and is about to expire. The number of dongle days remaining is also
displayed on the ‘Information Bar’ at the bottom left of the Verify QC screen.
Rev No:
Date:
A
06.05.2015
Page 120
Verify QC v1.12B User Manual
Document title:
Document No.
Verify QC v1.12B User Manual
AB-V-MA-00585
Dongle View
10.1.2
Dongle Upgrades and Helpdesk
“Help/Dongle/Upgrade” allows the user to save the current dongle code to a USB memory
stick. This code is needed to request a dongle upgrade or extend the dongle duration with
the VERIPOS Helpdesk.
Verify QC Dongle Status Code
Pressing the ‘Email’ button will start the user’s default email software, (e.g. MS Outlook),
and open a new email message to be sent with the dongle status code in the e-mail
message body. The VERIPOS Help Desk email address is automatically populated in the
‘send to’ address of the email.
The ‘Save’ button will create an ASCII file on the USB memory stick with the name
status.dsf. This file can be sent by the user to the VERIPOS Helpdesk as an email
attachment.
The ‘Copy’ button will copy the dongle status code to the clip board so that it can be pasted
into an e-mail or fax.
VERIPOS help desk details: [email protected] Tel. +44 (0) 1224 965900
Once the VERIPOS Helpdesk returns an upgrade code the code will be required to be
saved in a file named “upgrade.dsf”.
Save the file to a USB memory stick and insert into the Verify QC PC.
Go to “Help/Dongle/Upgrade…”, press Load then browse to the location on the USB
memory stick where the “upgrade.dsf” file is saved.
The upgrade code will appear in the text box in the middle of the window.
Rev No:
Date:
A
06.05.2015
Page 121
Verify QC v1.12B User Manual
Document title:
Document No.
Verify QC v1.12B User Manual
AB-V-MA-00585
Press Upgrade and the code will be applied to the dongle and confirmation code will be
returned by the software.
Please send this confirmation code to the VERIPOS Helpdesk to record a successful
upgrade. Failure to do so may result in dongles not accepting future updates.
When the codes have been entered, the user can check if the upgrade has been applied as
requested, by selecting “Dongle/View”.
The view will now contain the latest confirmation code.
Once the code has been entered the user can check if the upgrade has been applied by
selecting “Dongle/View” to bring up the view (example below) to show dongle status.
Dongle View after upgrade
Rev No:
Date:
A
06.05.2015
Page 122
Verify QC v1.12B User Manual
Document title:
Document No.
10.2
Verify QC v1.12B User Manual
AB-V-MA-00585
REVISION HISTORY
Provides a summary of the revisions of Verify QC software versions.
10.3
USER MANUAL
Opens the Verify QC manual in PDF format, provided Adobe Reader is installed on the PC.
10.4
ABOUT
This opens the following dialogue box containing the necessary support contact information
together with the Verify QC Software Version and the version of the Algorithms. The
software version may be requested if the user requires support to assist in resolving any
technical issues.
Verify QC About View (Example)
Rev No:
Date:
A
06.05.2015
Page 123
Verify QC v1.12B User Manual
Document title:
Document No.
11.
INDEX OF APPENDICES
A
B
C
D
E
F
G
H
I
Rev No:
Date:
Verify QC v1.12B User Manual
AB-V-MA-00585
A
06.05.2015
INSTALLING VERIFY - QC
A.1
SOFTWARE INSTALLATION
DONGLE DRIVER INSTALLATION
DEVICE IO DESCRIPTIONS
C.1
SERIAL PORTS
C.2
CLIENT SOCKET
C.3
SERVER SOCKET
C.4
DATAGRAM
C.5
FILE IO
ADVANCED VIEWS
D.1
ALMANAC
D.2
GPS EPHEMERIS
D.3
GPS CCF
D.4
GPS MEASUREMENTS
D.5
GLONASS EPHEMERIS
D.6
GLONASS CCF
D.7
GLONASS MEASUREMENTS
D.8
STATION DATA
D.9
ULTRA CORRECTIONS
D.10 APEX CORRECTIONS
QUALITY STANDARDS
E.1
UKOOA STANDARD
E.2
NMEA-0183 STANDARD
E.3
IMCA RECOMMENDATIONS
VERIFY QC OUTPUTS
F.1
NMEA SENTENCES
F.2
ADVANCED POSITIONING AND QC SENTENCES
TIDES LOGGING FILE FORMATS
TRIMBLE 4000DS AND TRIMBLE 4000SSE/SSI CONFIGURATION
H.1
4000DS
H.2
4000SSE/SSI
GNSS RECEIVER LIST
Page 124
Verify QC v1.12B User Manual
Document title:
Document No.
Verify QC v1.12B User Manual
AB-V-MA-00585
APPENDICES
Rev No:
Date:
A
06.05.2015
Page 125
Verify QC v1.12B User Manual
Document title:
Document No.
A
Verify QC v1.12B User Manual
AB-V-MA-00585
INSTALLING VERIFY QC
The Verify QC software is installed from a CD inserted into a PC CDROM drive. It contains
an auto-start feature that will start the installation process automatically. If installing from a
different location or auto-start is not available, double click the setup.exe file to begin the
installation.
Verify QC Program Setup
A.1
SOFTWARE INSTALLATION
When the installation starts, the following screen will appear:
Screen Display of Preparing to Install
Windows Installer
Rev No:
Date:
A
06.05.2015
Page 126
Verify QC v1.12B User Manual
Document title:
Document No.
Verify QC v1.12B User Manual
AB-V-MA-00585
Check that the version of Verify QC you are installing is correct, and then click Next.
Verify QC Software Version
Read the VERIPOS Software License, accept the terms in the license agreement to
continue and then click Next.
VERIPOS Software License
Rev No:
Date:
A
06.05.2015
Page 127
Verify QC v1.12B User Manual
Document title:
Document No.
Verify QC v1.12B User Manual
AB-V-MA-00585
Enter the required customer information on this page and click Next.
Customer Information
The default installation directory is C:\Program Files\VERIPOS. Click Change if a different
location is to be used. Select the directory to be used then click Next.
Verify QC Installation Directory
Rev No:
Date:
A
06.05.2015
Page 128
Verify QC v1.12B User Manual
Document title:
Document No.
Verify QC v1.12B User Manual
AB-V-MA-00585
Check to make sure that all current installation settings are correct. Click Install to start the
software installation.
Verify QC Ready to Install
Installation of Verify QC will now commence.
Verify QC Installation Status
Rev No:
Date:
A
06.05.2015
Page 129
Verify QC v1.12B User Manual
Document title:
Document No.
Verify QC v1.12B User Manual
AB-V-MA-00585
Installation is now complete. Click Finish.
Verify QC Installation Complete
Rev No:
Date:
A
06.05.2015
Page 130
Verify QC v1.12B User Manual
Document title:
Document No.
B
Verify QC v1.12B User Manual
AB-V-MA-00585
DONGLE DRIVER INSTALLATION
The Verify QC software is dongle protected. An enabled dongle will be supplied with the
software. If dongle is missing or not enabled contact VERIPOS.
The installation of the dongle driver will automatically follow the Verify QC software
installation.
The drivers may be upgraded or (re)installed manually by going to “Start\All
Programs\VERIPOS\Dongle Drivers\Reinstall Drivers”.
Dongle Driver Installer
It is possible to check in Control panel whether dongle drivers and which version have been
installed.
Go to “Start/Control Panel” and double click on the DESkey icon. This will open the
‘DESkey Configuration’ dialogue. The details of the installed driver can be read in the ‘File
Versions’ tab:
DESkey Configuration – File Versions
Rev No:
Date:
A
06.05.2015
Page 131
Verify QC v1.12B User Manual
Document title:
Document No.
C
Verify QC v1.12B User Manual
AB-V-MA-00585
DEVICE IO DESCRIPTIONS
This appendix outlines the functionality of the IO Device options in the configuration
dialogues.
The Verify QC software supports a number of communication types for data input and
output as described below: -
IO Device Communication Types
All communication types available within the software are displayed in the drop down “IO
Device” menu. The list has been customised such that only input communication types are
available in input dialogues and vice versa.
Each communication method is described in the following sections.
C.1
SERIAL PORTS
Serial ports are the physical connections to the hardware. The settings depend on the
device being used or the data being output. Select Serial Port connection type from the IO
Device menu to access the serial port configurations options.
Serial Port Options
Rev No:
Date:
A
06.05.2015
Page 132
Verify QC v1.12B User Manual
Document title:
Document No.
Verify QC v1.12B User Manual
AB-V-MA-00585
The Port number is a sequential number corresponding to the communication port on the
computer. When using a multi-port board (Digi/Decision SI-8) board the Port numbers will
increment from the permanent ports as shown in the example below:
Com1 = Computer Com1
Com2 = Computer Com2
Com3 = Digi 1
Com4 = Digi 2
Etc.
Detailed information for the PC’s available ports can be found under Device Manager,
which is a sub-section of the System Manager in the Windows Control Panel.
A Com port already in use by Verify QC or another application on the PC will be labelled as
‘in use’ in the Port pull down menu. It can still be selected but Verify QC cannot open this
port as it is locked by the Operating System.
Select the correct Baud rate. This must match the settings of the device connected to
Verify, or the setting required for the output string. Data Bits, Parity and Stop Bits can be
changed if the interfaced device does not use the 8 NONE 1 protocol.
C.2
CLIENT SOCKET
GPS, RTCM and Demodulator Status data can be received from other applications on the
network using Client Sockets with the TCP/IP protocol.
Typically, a GPS receiver or a VERIPOS Demodulator can be connected to a networked
computer using one of the physical ports or DIGI ports. The data is then input into the
VERIPOS VIO software, part of the Verify QC suite of programs. The VIO software can be
configured with Server Sockets such that data is broadcast over the network (including the
local host computer) making the data available to more than one user.
Client Socket Options
The Client Socket dialogue allows users to enter the IP Address of the computer serving
out the data and the Port on which the TCP/IP data is present. If the data is coming from
the same computer as Verify QC the IP address should be left as “localhost”. Ports range is
between 0 – 65535.
Rev No:
Date:
A
06.05.2015
Page 133
Verify QC v1.12B User Manual
Document title:
Document No.
C.3
Verify QC v1.12B User Manual
AB-V-MA-00585
SERVER SOCKET
Position output data can be sent to other applications on the network using Server Sockets
with the TCP/IP protocol.
Server Socket Options
The Server Socket dialogue allows users to enter the Port on which the TCP/IP data will be
present.
C.4
DATAGRAM
The Datagram connection type in Verify QC uses the User Datagram Protocol (UDP). UDP
is an alternative to TCP. It does not manage a connection for purposes of flow control.
Instead packets of data are issued to the intranet/internet in either broadcast mode, where
any networked computer on the LAN can receive them, or in the address mode where the
data packets have headers specifying the addressees of the intended recipient. There is no
guarantee with this protocol that the messages will arrive in the order they were sent.
Datagram Options
As with Server and Clients Sockets the user is required to enter a Port number. The
Datagram communication type can be used to send or receive data. To broadcast data, tick
the ‘Is Broadcast’ box. To receive data, leave this box unchecked.
The IP Address configuration defaults to ‘local host’ with a Max Size of 512, limiting the
packet size to 512kb. These two parameters are user selectable.
The Send Only tick box when selected allows the Datagram IO component to send data to
an existing Datagram listener on the same PC without binding itself to a port to listen to
incoming messages. This will allow other software on the same computer to connect to the
port.
Rev No:
Date:
A
06.05.2015
Page 134
Verify QC v1.12B User Manual
Document title:
Document No.
C.5
Verify QC v1.12B User Manual
AB-V-MA-00585
FILE IO
The File IO device type allows the logging of output data to file. Users can browse to the
destination directory and enter the name and extension of the logging file under ‘Write
Filename’. It is advisable to use the ‘.txt’ file extension, as this will allow the files to be read
using most ASCII file viewers.
A new logging file is created at midnight if the box ‘Split at Midnight’ is ticked. The date is
then included automatically in the file name, using the convention ‘Write
Filename_YYMMDD.txt’.
File IO Options
Rev No:
Date:
A
06.05.2015
Page 135
Verify QC v1.12B User Manual
Document title:
Document No.
D
Verify QC v1.12B User Manual
AB-V-MA-00585
ADVANCED VIEWS
This appendix outlines the Advanced Views that can be enabled under Tools/Advanced
Options.
Advanced Options dialogue
Rev No:
Date:
A
06.05.2015
Page 136
Verify QC v1.12B User Manual
Document title:
Document No.
D.1
Verify QC v1.12B User Manual
AB-V-MA-00585
ALMANAC
In Verify QC1.12B the Satellite constellation convention is adopted as below;
GPS
= G## (where ## represents the SV PRN)
GLONASS
= R## (where ## represents the SV slot number)
In future when available on the GNSS receiver, Galileo SV’s will show E## and Compass
SV’s will show C##.
View/GNSS/Almanac displays the current Almanac data for each satellite in view.
The almanac contains orbit information of all the satellites, the satellite clock parameters,
ionospheric and tropospheric delay parameters.
Almanac View
Clicking on the BLUE satellite numbers changes the displayed data to that particular
satellite.
Rev No:
Date:
A
06.05.2015
Page 137
Verify QC v1.12B User Manual
Document title:
Document No.
Verify QC v1.12B User Manual
AB-V-MA-00585
GPS Almanac Data
toi
toa
health
e
i0
(O) 0
A(1/2)
(Omega)O
ω
M0
af0
af1
Time of issue, given as GPS week and GPS time
Time of almanac, given as GPS week and GPS time
based on the 5 Least Significant Bits (LSB) of the 8-bit health words in the
navigation sub-frame data. The health flag ranges from 0-255. A non-zero
value indicates that the satellite is unhealthy
Eccentricity
Inclination angle at reference time
Rate of change right ascension.
Square root of the semi major-axis in (root) meter
longitude of ascending Node of Orbit Plane at Weekly Epoch
Argument of perigee
Mean anomaly at reference time
Satellite clock offset
Satellite clock drift
GLONASS Almanac Data
toi
channel
health
N
λ
tλ
ε
ω
Δi
ΔT
ΔTdot
τ
Time of issue, given as GPS week and GPS time
GLONASS satellite channel number
A satellites health is established by the GLONASS Control Centre, and from
there a satellite is either flagged as healthy (1) or not
Current date. Calendar number of day within four-year interval starting from
a leap year
Longitude of the first ascending node in PZ-90 coordinate system
Time of the first ascending node passage
Eccentricity
Argument of perigee
correction to the mean value of inclination
Correction to the mean value of Draconian period
Rate of change of orbital period
Time correction to GLONASS time scale (vs. UTC(SU))
By clicking on the blue UTC in the GPS Almanac section the Almanac UTC data will be
shown.
GPS Almanac UTC Data
toi
A0
A1
ΔtLS
tot
WNt
WNLSF
DN
ΔtLSF
Rev No:
Date:
A
06.05.2015
Time of issue, given as GPS week and GPS time
Constant and first order terms polynomial.
Constant and first order terms polynomial.
Delta time due to leap seconds, the offset between GPS time and UTC time
Reference time for UTC data.
UTC reference week number.
Week number.
Day number.
Delay time due to leap seconds
Page 138
Verify QC v1.12B User Manual
Document title:
Document No.
Verify QC v1.12B User Manual
AB-V-MA-00585
GPS Almanac UTC Data
By clicking on the blue Iono in the GPS Almanac section the Almanac Iono data will be
shown.
GPS Almanac Iono Data
toi
α(n)
β(n)
Rev No:
Date:
A
06.05.2015
Time of issue, given as GPS week and GPS time
The coefficients of a cubic equation representing the amplitude of the vertical
delay, 4 coefficients
The coefficients of a cubic representing the period of the model, 4
coefficients
Page 139
Verify QC v1.12B User Manual
Document title:
Document No.
Verify QC v1.12B User Manual
AB-V-MA-00585
GPS Almanac Iono Data
Rev No:
Date:
A
06.05.2015
Page 140
Verify QC v1.12B User Manual
Document title:
Document No.
D.2
Verify QC v1.12B User Manual
AB-V-MA-00585
GPS EPHEMERIS
View/GNSS/GPS Ephemeris displays the current ephemeris data for each satellite that is
being tracked.
GPS Ephemeris View
Clicking on the blue PRN numbers displays the data for that particular satellite.
IODE
toe
A(1/2)
e
Mo
(OMEGA)o
i0
ω
Rev No:
Date:
A
06.05.2015
Issue of Data Ephemeris provides a means of detecting any change in the
ephemeris representational parameters. The displayed value is a serial
number of the current issue.
Reference time of ephemeris in seconds related to a GPS week. A GPS
week has a length of 604800 seconds.
Square root of the semi major-axis (root) in meters
Eccentricity
Mean anomaly at reference time
Longitude of ascending node of orbit plane at a weekly epoch
Inclination angle at reference time
Argument of perigee
Page 141
Verify QC v1.12B User Manual
Document title:
Document No.
Verify QC v1.12B User Manual
AB-V-MA-00585
Δn
OMEGADOT
IDOT
Crc
Crs
Cuc
Cus
Cic
Cis
IODC
af0
af1
af2
TGD
health
curve fit
accuracy
D.3
Mean motion difference from computed value
Rate of change right ascension
Rate of change of inclination angle
Amplitude of the cosine harmonic correction term to the orbit (radians)
Amplitude of the sine harmonic correction term to the orbit (radians)
Amplitude of the cosine harmonic correction term to the argument of latitude
Amplitude of the sine harmonic correction term to the argument of latitude
Amplitude of the cosine harmonic correction term to the angle of latitude
Amplitude of the sine harmonic correction term to the angle of inclination
Issue of Date Clock
Satellite clock offset
Satellite clock drift
Satellite clock frequency drift.
Tropospheric group delay. L1 – L2 correction
GPS satellite health
Length of curve fit
Accuracy of fit
GPS CCF
The Code Carrier Filter (CCF) displays the GPS observation filtering process as a time
series plot. Two fundamental observables can be derived from the GPS signal, the code
and the carrier. The Code or Pseudo-Range (PR) is derived from the time difference
between the transmitted code and that of the receiver code. The carrier is the continuous
wave frequency upon which the code is modulated. At the receiver the carrier, or the
integrated Doppler measurements, are less affected by multipath compared to the code
measurements. The CCF uses the more stable carrier measurements to filter and smooth
the code measurements. These smoothed code measurements are then used in the
position calculation process.
If the CCF reading is permanently high, or fluctuates, then the code measurements are
suffering from increased noise. This is common for low elevation satellites or satellites that
are tracked intermittently. If poor CCF readings are seen on all satellite and also at higher
elevation then it is likely that interference is present, the receiver antenna is badly
positioned or there is a problem with the antenna cable / connections.
Cycle slips are a loss of lock on the carrier wave, and this can also be seen in the CCF
graph by means of a blue vertical line. If there are large numbers of cycle slips, then the
positioning of the antenna should be looked at.
The CCF view is broken down into thumbnails and a main plot. Thumbnail views for the
CA, L1* and L2* observations are displayed for each satellite in view. The user can select a
thumbnail to get an enlarged CCF chart in the main display by clicking on it. The CCF
chart is a time series representation of the code carrier filter for each measurement of the
last 15 minutes.
* Which observations are available is receiver dependent. L2 will only be available if the
GPS receiver is a dual frequency unit. For some single frequency receivers such as the
DG14/16 only CA will be displayed.
Rev No:
Date:
A
06.05.2015
Page 142
Verify QC v1.12B User Manual
Document title:
Document No.
Verify QC v1.12B User Manual
AB-V-MA-00585
GPS CCF View
The Red dots are raw unfiltered measurements from the GPS receiver.
The Black line is the mean of the raw measurements.
The Green line shows the result of the Code Carrier Filter and should follow the red dots.
Cycle slips are indicated by a blue vertical line.
Clicking the right mouse button in the window allows the user to change the appearance of
the display. CA, L1 and L2 thumbnails can be switched on or off. It also possible to hide
the cycle slip indicators.
Scale allows the scale of the main plot to be selected. The scale can either be
automatically managed by Verify QC or set to one of the offered scales from 0.5m to 20m.
The thumbnails have a fixed 5m scale. If the data exceeds the 5m range, the 5 will be
shown in bold red with an exclamation mark behind it.
CCF View Options
Rev No:
Date:
A
06.05.2015
Page 143
Verify QC v1.12B User Manual
Document title:
Document No.
D.4
Verify QC v1.12B User Manual
AB-V-MA-00585
GPS MEASUREMENTS
This view displays information about the GPS measurements received and decoded by
Verify QC. The top row is showing the GPS week number, the day and GPS time.
GPS Measurements View
Rev No:
Date:
A
06.05.2015
Page 144
Verify QC v1.12B User Manual
Document title:
Document No.
Verify QC v1.12B User Manual
AB-V-MA-00585
GPS Measurement Data
PRN
Elev
Azi
Freq
SNR
Range
Range SD
Phase
Doppler
Pseudo Random Noise code is a unique identification number for each GPS
satellite. For example, if a satellite is referred to as PRN 13, this refers to the
satellite transmitting the 13th weekly portion of the P code.
The elevation angle measured in degrees of the satellite position above the
horizon at the user’s location.
Azimuth is the horizontal angle measured in degrees from north to the
direction of the satellite relative to the user’s location.
Frequency refers to the observation types: C/A - range measurement derived from the Coarse Acquisition
Code on the L1 frequency
L1 - range measurement derived from the carrier at the L1
frequency
L2 - range measurement derived from the carrier at the L2
frequency
Signal to Noise Ratio is a measure of the power of a received satellites
carrier signal at a GPS receiver. Signal strength is generally measured in
dBHz but there are differences between the various GPS receiver types. A
low SNR is less than 30 dBHz whilst good SNR exceeds 40 dBHz.
Range is the distance measured from the satellite to the users GPS antenna,
the unit of measurement being the metre.
Range Standard Deviation is a statistical parameter of the range data. The
lower the standard deviation the higher the accuracy of the ranges. SD is
measured in meters.
This is the Range divided by the wavelength measured in metres.
Wavelengths: L1 ≈ 19cm L2 ≈ 24cm
Doppler effect is the change of signal frequency as the transmitting source
moves closer or further away from the receiver. The reading in this table
gives the difference between the transmitted carrier frequency at the satellite
and the frequency received at the GPS receiver. The Doppler measurement
is used for the calculation of the user velocity.
The GPS data for a second GNSS receiver can be displayed in the view when Verify QC is
configured to receive GPS data from a second GNSS receiver, i.e. when the Heading
Calculation is configured. This data can be selected via a right-click on the view and setting
the GPS Measurement Source accordingly.
GPS Measurements View Options
Rev No:
Date:
A
06.05.2015
Page 145
Verify QC v1.12B User Manual
Document title:
Document No.
D.5
Verify QC v1.12B User Manual
AB-V-MA-00585
GLONASS EPHEMERIS
View/GNSS/GLONASS Ephemeris displays the current ephemeris data for each satellite
that is being tracked.
GLONASS Ephemeris View
Clicking on the blue slot numbers displays the data for that particular satellite.
GLONASS Ephemeris Data
Channel
Day No
tk
tb
Xn, Yn, Zn
‘Xn, ‘Yn, ‘Zn
‘’Xn, ‘’Yn, ‘’Zn
Rev No:
Date:
A
06.05.2015
Shows the GLONASS satellite channel number
Shows the current date. Calendar number of day within four-year interval
starting from a leap year.
the time referenced to the beginning of the frame within the current day
index of a time interval within current day according to UTC (SU) +03 hours
00 min. The number between brackets indicates the number of ephemeris
messages received with the same tb value.
coordinates of the nth satellite in PZ-90 coordinate system at the instant tb
velocity vector components of the nth satellite in PZ-90 coordinate system at
instant tb
acceleration components of the nth satellite in PZ-90 coordinate system at
instant tb
Page 146
Verify QC v1.12B User Manual
Document title:
Document No.
Verify QC v1.12B User Manual
AB-V-MA-00585
En
τc
τ
γ
Bn
P1
P2
P3
P4
D.6
“age” of the immediate information. The time interval elapsed since the
instant of its calculation (uploading) until the instant tb for nth satellite. This
word is generated on board the satellite
GLONASS time scale correction to UTC(SU) time
correction of satellite clock vs. GLONASS time
relative deviation of predicted carrier frequency value of nth satellite from
nominal value at the instant tb
health flag. The equipment analyzes only one MSB of this word. 1 indicates
malfunction of given satellite. The equipment does not consider the second
or third bits of this word
flag indicates time interval between two adjacent values of tb (minutes) in
both current and previous frames
flag indicates oddness ("1") or evenness ("0") of the value of tb (for intervals
of 30 or 60 minutes)
flag indicates number of satellites with almanac transmission within given
frame. 1 indicates five satellites, 0 corresponds to four.
flag indicating ephemeris parameters are present. "1" indicates updated
ephemeris or frequency/time parameters have been uploaded by the control
segment
GLONASS CCF
The GLONASS CCF view and its options are similar to that of GPS. See section B.3. The
GLONASS slot numbers are used to identify the individual GLONASS satellites.
D.7
GLONASS MEASUREMENTS
This view displays information about the GLONASS measurements received and decoded
by Verify QC. The top row shows the GPS/GLONASS receiver date and time expressed by
the GPS week number, the day and GPS Time.
GLONASS Measurements View
Rev No:
Date:
A
06.05.2015
Page 147
Verify QC v1.12B User Manual
Document title:
Document No.
Verify QC v1.12B User Manual
AB-V-MA-00585
GLONASS Measurement Data
Slot
Chan
Elev
Azi
Shows the dedicated satellite number as assigned to the satellites orbital
path.
Indicates the increment or decrement of the satellite transmitting frequency
from the F1 frequency.
Elevation angle measured in degrees of the satellite above the horizon at the
user’s location.
Azimuth is the horizontal angle measured in degrees from the north direction
to the direction of the satellite relative to the user’s location.
Frequency refers to:
Freq
SNR
Range
Range SD
Phase
Doppler
Rev No:
Date:
A
06.05.2015
C/A - range measurement derived from the Coarse Acquisition
Code on the L1 frequency
L1 - range measurement derived from the carrier at the L1
frequency
L2 - range measurement derived from the carrier at the L2
frequency
Signal to Noise Ratio is a measure of the power of a received satellites
carrier signal at the receiver. Signal strength is generally measured in dBHz
but there are differences between the various receiver types. A low SNR is
less than 30 dBHz whilst good SNR exceeds 40 dBHz.
is the distance measured from the satellite to the user’s antenna in metres?
Range Standard Deviation is a statistical parameter of the range data
measured in meters. The lower the standard deviation the higher the
accuracy of the ranges.
is the range divided by the wavelength in metres?
Doppler effect is the change of signal frequency as the transmitting source
moves closer or further away from the receiver. The reading gives the
difference between the transmitted carrier frequency at the satellite and the
frequency received at the receiver. The Doppler measurement is used to
calculate the user velocity.
Page 148
Verify QC v1.12B User Manual
Document title:
Document No.
D.8
Verify QC v1.12B User Manual
AB-V-MA-00585
STATION DATA
A single view per station is used to show the reference station information as contained in
the correction messages. The view has a GPS section for the GPS range correction data in
the Standard messages and a GLONASS section for the GLONASS range correction data
in the GLONASS messages. Two separate sections show the received WGS84 and PZ-90
reference station coordinates.
Figure 1 – Differential Data View
The reference station location is required to calculate the elevation and azimuth of the
satellites at the reference station as well as their ionospheric and tropospheric model
information. This information is obtained from the RTCM Type 3 message. The Type 3 is
displayed in the Location box. If no Type 3 is received for a non-VERIPOS station it is
assumed to be ‘local’, i.e. at the user’s location.
The GLONASS Location box displays the contents of the RTCM Type 32 message. It also
includes information about the relationship between the Type 3 and the Type 32, i.e. the
PZ-90 to WGS84 datum shift. The following shifts may be detected:
o
o
o
o
o
Standard Shift (used by Topcon/Javad)
RTCM Shift (published in RTCM v2.3)
NovAtel Shift (used by NovAtel)
No Shift
Unknown Shift
If an unknown shift is detected the 3D residual after applying the Standard Shift is
displayed in brackets.
Rev No:
Date:
A
06.05.2015
Page 149
Verify QC v1.12B User Manual
Document title:
Document No.
Verify QC v1.12B User Manual
AB-V-MA-00585
Note: GLONASS users should carefully consider whether a non-VERIPOS reference
station with an unknown datum shift should be incorporated in any of the position
calculations in Verify QC.
Right clicking in the display allows the user to select a different reference station to be
displayed. It is also possible to hide the GLONASS correction data.
Differential Data View Options
GPS Specific Differential Data
PRN
IODE
Iono Delay
Iono Rate
Pseudo Random Noise code is a unique identification number for each GPS
satellite. For example, if a satellite is referred to as PRN 13, it is identified as
the satellite that transmits the 13th weekly portion of the P code
The Issue of Data Ephemeris identifies the set of ephemeris parameters
giving the user a means of detecting changes in these parameters
The ionospheric delay (meters) is measured at the reference station
is the rate of change of the Iono Delay measured at the reference station
GLONASS Specific Differential Data
Slot
tb
Change
The dedicated satellite number assigned to the satellites orbital path.
index of a time interval within current day according to UTC(SU) +03 hours 00
min
Indicates whether the GLONASS ephemeris data has changed without a
change in the tb value
Common Differential Data
Elev
Azi
Iono
Tropo
SF
Rev No:
Date:
A
06.05.2015
elevation angle measured in degrees of the satellite above the horizon at the
reference station location
The horizontal angle measured in degrees from the north direction to the
direction of the satellite relative to the reference station location
The delay in meters caused by the Ionosphere to the GPS/GLONASS signal
from a particular satellite. This ionospheric delay value is derived from the
Klobuchar model in the Almanac
The delay in meters caused by the troposphere to the GPS/GLONASS signal
from the satellite, at the reference station. This tropospheric delay value is
derived using the Hopfield model defined within the software
scale factor as a code equal to 0 or 1: 0 = scale factor for pseudo range correction better than 0.02 meter and for
range rate correction 0.002 meter/second
1 = scale factor for pseudo range correction better than 0.32 meter and for
range rate correction 0.032 meter/second
Page 150
Verify QC v1.12B User Manual
Document title:
Document No.
Verify QC v1.12B User Manual
AB-V-MA-00585
PRC
Rate
UDRE
D.9
Pseudo Range Correction as observed on the L1 pseudo-range at the
reference station
Rate of Change, in meters, of the pseudo-range corrections
User Differential Range Error is an estimate of the performance of the satellite
pseudo-range as measured at the reference station in meters. This number is
provided as part of the RTCM Type 1 and Type 31 messages in the form of a
binary code 0 to 3:
0: ≤ 1 meter at 1 sigma
1: > 1 meter and ≤ 4 meter at 1 sigma
2: > 4 meter and ≤ 8 meter at 1 sigma
3: > 8 meter at 1 sigma
ULTRA CORRECTIONS
Ultra corrections are shown in the menus when an Ultra capable, dual frequency GNSS
receiver card is selected.
The View/Differential/Ultra Corrections view displays the Ultra corrections received and
decoded by Verify QC.
Ultra Corrections View
Rev No:
Date:
A
06.05.2015
Page 151
Verify QC v1.12B User Manual
Document title:
Document No.
Verify QC v1.12B User Manual
AB-V-MA-00585
The Ultra correction information is listed by GPS PRN number. The headings in the table
refer to: -
PRN
IODE
Age
Delta X
Delta Y
Delta Z
Delta T
Source
SFO
SFC
D.10
Pseudo Random Noise code. This is a unique identification number for each
GPS satellite. For example, if a satellite is referred to as PRN 13, this refers to
the satellite that transmits the 13th weekly portion of the P code
The Issue of Data Ephemeris identifies the set of ephemeris parameters and
gives the user a means of detecting any change in these parameters
The difference between the current time and time that the correction values
were generated, in seconds
GPS orbit correction to the ECEF X coordinate of the broadcast ephemeris, in
metres
GPS orbit correction to the ECEF Y coordinate of the broadcast ephemeris, in
metres
GPS orbit correction to the ECEF Z coordinate of the broadcast ephemeris, in
metres
GPS clock correction relative to the GPS broadcast clock, in metres
Reference to the source of the Ultra corrections within the Veripos data
network, i.e. Primary or Secondary. A transition between sources is managed
within the Ultra algorithms
Scale Factor - Orbits
Scale Factor - Clocks
APEX CORRECTIONS
The View/Differential/Apex Corrections view displays the Apex corrections received and
decoded by Verify QC.
Apex Corrections View
GPS
The Apex correction information is listed by GPS PRN number. The headings in the table
refer to: Rev No:
Date:
A
06.05.2015
Page 152
Verify QC v1.12B User Manual
Document title:
Document No.
Verify QC v1.12B User Manual
AB-V-MA-00585
PRN
IODE
SF
Age T50
Source
∆X
∆Y
∆Z
X
Y
Z
Age T51
Source
Clock
Pseudo Random Noise code. This is a unique identification number for each
GPS satellite. For example, if a satellite is referred to as PRN 13, this refers to
the satellite that transmits the 13th weekly portion of the P code
The Issue of Data Ephemeris identifies the set of ephemeris parameters and
gives the user a means of detecting any change in these parameters
Scale Factor, 0 or 1. The orbit corrections have a lower numerical resolution
when the scale factor is 1.
The age of the GPS orbit correction, i.e. the difference between the current
time and time that the correction values were generated, in seconds
Reference to the source (processing centre) of the Apex corrections within the
Veripos data network, i.e. 0-3. A transition between sources is managed
within the Apex algorithms
GPS orbit correction to the ECEF X coordinate of the broadcast ephemeris, in
metres
GPS orbit correction to the ECEF Y coordinate of the broadcast ephemeris, in
metres
GPS orbit correction to the ECEF Z coordinate of the broadcast ephemeris, in
metres
Rate of Change of the GPS orbit ECEF X coordinate correction
Rate of Change of the GPS orbit ECEF Y coordinate correction
Rate of Change of the GPS orbit ECEF Z coordinate correction
The age of the GPS clock correction, i.e. the difference between the current
time and time that the correction values were generated, in seconds
Reference to the source (processing centre) of the Apex corrections within the
Veripos data network, i.e. 0-3. A transition between sources is managed
within the Apex algorithms
The clock correction value relative to a proprietary reference, in metres
GLONASS
The Apex correction information is listed by Glonass Slot number. The headings in the
table refer to: Slot
X
Y
Identifies the GLONASS satellite slot number
Tb value in seconds divided by 900. Tb value is the index of a time interval
within current day according to UTC(SU) +03 hours 00 min
Scale Factor, 0 or 1. The orbit corrections have a lower numerical resolution
when the scale factor is 1.
The age of the GLONASS orbit correction, i.e. the difference between the
current time and time that the correction values were generated, in seconds
Reference to the source (processing centre) of the Apex corrections within the
Veripos data network, i.e. 0-3. A transition between sources is managed
within the Apex algorithms
GLONASS orbit correction to the ECEF X coordinate of the broadcast
ephemeris, in metres
GLONASS orbit correction to the ECEF Y coordinate of the broadcast
ephemeris, in metres
GLONASS orbit correction to the ECEF Z coordinate of the broadcast
ephemeris, in metres
Rate of Change of the GLONASS orbit ECEF X coordinate correction
Rate of Change of the GLONASS orbit ECEF Y coordinate correction
A
06.05.2015
Page 153
Verify QC v1.12B User Manual
Tb
SF
Age T38
Source
∆X
∆Y
∆Z
Rev No:
Date:
Document title:
Document No.
Verify QC v1.12B User Manual
AB-V-MA-00585
Z
Age T39
Source
Clock
Rev No:
Date:
A
06.05.2015
Rate of Change of the GLONASS orbit ECEF Z coordinate correction
The age of the GLONASS clock correction, i.e. the difference between the
current time and time that the correction values were generated, in seconds
Reference to the source (processing centre) of the Apex corrections within the
Veripos data network, i.e. 0-3. A transition between sources is managed
within the Apex algorithms
The clock correction value relative to a proprietary reference, in metres
Page 154
Verify QC v1.12B User Manual
Document title:
Document No.
E
Verify QC v1.12B User Manual
AB-V-MA-00585
QUALITY STANDARDS
A number of standards offer marine satellite navigation system users DGNSS
(DGPS/DGPS+DGLONASS) quality information. The most well known and frequently
referred to standards are:
1. UKOOA
2. NMEA-0183
Each standard is explained in more detail in the following sections.
NMEA have recently introduced the NMEA-2000 interface standard. This standard falls
outside the scope of this document. See www.nmea.org for further information.
References
E.1
[1]
Guidelines for the use of Differential GPS in offshore surveying, UKOOA, 1994
[2]
NMEA 0183 Standard for interfacing marine electronic devices, version 3.01,
January 1, 2002
UKOOA STANDARD
The UK Offshore Operator Association (UKOOA) issued ‘Guidelines for the use of
Differential GPS in offshore surveying’ in 1994. These guidelines set out what is generally
regarded as good practise in the offshore industry. They are not mandatory and operators
are free to adopt different guidelines or standards.
These guidelines are now dated in certain areas due to advancements in positioning
technology and algorithms. However, they contain useful suggestions for quality monitoring
as indicated below [see 1]: “To assist DGPS operators and client representatives to monitor the quality of the
DGPS system in real-time the following information should be continuously
available:
Pseudo-range residuals of all SV’s and observation weight values used
Unit variance
Number of satellites in view and number used in solution
Redundancy of least squares solution
DOP values (HDOP, PDOP and VDOP)
Latency of differential correction data
Position comparisons derived from different reference stations
Derived antenna height with respect to “known” height
Monitor station information, especially position error measured at the monitor
station. All data should be time tagged
Maximum external reliability figure and observation carrying it”
The UKOOA guidelines present a set of test statistics and quality measures recommended
for use with DGPS. In its final recommendations [see 1] it states: -
Rev No:
Date:
A
06.05.2015
Page 155
Verify QC v1.12B User Manual
Document title:
Document No.
Verify QC v1.12B User Manual
AB-V-MA-00585
“It is essential to assess the precision and reliability of each position in order to
ensure the quality of the DGPS measurements. Thus is recommends that the
following processing steps be implemented: w-test for outliers carried out for each position fix
F-test for unit variance carried out for each position fix
When no more outliers are identified in any fix, precision and reliability
measures will be calculated:
o Precision:
a-posteriori error ellipse
o Reliability:
external reliability (positional MDE using a power of
test of 80%)”
Where accuracy and precision statistical parameters are generated these all represent a
95% (2σ) confidence region.
Appendix A of the UKOOA guidelines emphasises this by listing ‘Suggested parameters to
be specified by a system user for typical marine survey operations’ and states that ‘In order
to carry out rigorous QC, the covariance matrix generated by the least squares computation
should be used to generate test statistics and quality measures’.
It recommends the following Test Statistics:
1. w-test
used to detect outliers
2. F-test
used to verify the model which is being used to account for
‘errors’ in the DGPS observations
It recommends also the following Quality Measures:
1. Error Ellipse
an approximate graphical representation of the positional
standard deviation in two dimensions
2. External Reliability
the effect of the maximum MDE (Marginally Detectable Error)
on the computed position
These recommendations are particularly aimed at survey applications but could be applied
equally to DP applications.
Rev No:
Date:
A
06.05.2015
Page 156
Verify QC v1.12B User Manual
Document title:
Document No.
E.2
Verify QC v1.12B User Manual
AB-V-MA-00585
NMEA-0183 STANDARD
The National Marine Electronics Association (NMEA) has developed a specification
defining the interface between various pieces of marine electronic equipment. The standard
permits marine electronics to send information to computers and to other marine equipment
via a serial interface. A full copy of this standard is available for purchase at their web site
(www.nmea.org). The current version of the standard is 3.01.
GPS receiver communication is defined within this specification. The idea of NMEA is to
send a line of data called a sentence that is totally self contained and independent from
other sentences. There are standard sentences for each device category and in addition
NMEA permits hardware manufactures to define their own proprietary sentences for
whatever purpose they see fit. All standard sentences have a two letter prefix defining the
device using that sentence type. For GPS receivers the prefix is GP followed by a three
letter sequence defining the sentence contents. All proprietary sentences begin with the
letter P and are followed with 3 letters identifying the manufacturer controlling that
sentence.
NMEA consists of sentences, the first word of which, called a data type, defines the
interpretation of the rest of the sentence. Each data type has its own unique interpretation
and is defined in the NMEA standard. Each sentence begins with a '$' and ends with a
carriage return/line feed sequence no longer than 80 characters of visible text (plus the line
terminators). The data is contained within this single line with data items separated by
commas. The data itself is ASCII text and may extend over multiple sentences in certain
specialized instances but is normally fully contained in one variable length sentence. The
data may vary in the amount of precision contained in the sentence. For example time
might be indicated to decimal parts of a second or location may be shown with 3 or even 5
digits after the decimal point. Programs reading the data should only use the commas to
determine the field boundaries and not depend on column positions. There is a provision
for a checksum at the end of each sentence which may or may not be checked by the unit
reading the data. The checksum field consists of a '*' and two hex digits representing the
exclusive OR of all characters between, but not including, the '$' and '*'. A checksum is
required on some sentences.
There have been several changes to the standard but for GPS use the only ones that are
likely to be encountered are 1.5 and 2.0 through 2.3. Version 2.3 added a mode indicator to
several sentences used to indicate the kind of fix the receiver currently has. The value can
be A=autonomous, D=differential, E=Estimated, N=not valid, S=Simulator. Sometimes
there can be a null value as well. Only the A and D values correspond to an active and
reliable sentence. This mode character has been added to the RMC, RMB, VTG, and GLL,
sentences and optionally some others including the BWC and XTE sentences.
The hardware interface for GPS receivers is designed to meet the NMEA requirements.
They are compatible also with most computer serial ports using RS232 protocols, however
strictly speaking the NMEA standard is not RS232. They recommend conformance to EIA422. The interface speed generally can be adjusted but the NMEA standard is 4800 baud
with 8 bits of data, no parity, and one stop bit. All GPS receivers supporting NMEA should
support this speed. Note that, at a baud rate of 4800, you can easily send enough data to
more than fill a full second of time.
At 4800 baud 480 characters per second can be sent. As an NMEA sentence can be as
long as 82 characters this can be limited to less than six different sentences. The actual
Rev No:
Date:
A
06.05.2015
Page 157
Verify QC v1.12B User Manual
Document title:
Document No.
Verify QC v1.12B User Manual
AB-V-MA-00585
limit is determined by the specific sentences used and it is easy to overrun the capabilities
for rapid sentence response.
A cable is required to connect to the GPS receiver output. Data can be output also via
Ethernet or wireless connection. For general NMEA use with a GPS receiver only two wires
are required in the cable, data out from the GPS receiver and ground.
Rev No:
Date:
A
06.05.2015
Page 158
Verify QC v1.12B User Manual
Document title:
Document No.
F
Verify QC v1.12B User Manual
AB-V-MA-00585
VERIFY QC OUTPUTS
Verify QC can output the following NMEA sentences (see [2]):
GGA (Default)
GGA (PPP)
GGA (DP)
GGA (Alstom)
GLL
GST
ZDA
GNS
VTG (Default)
VTG (Old)
GSA
GSV
In addition Verify QC can output the following advanced positioning and QC output
sentences:
WesternGeco TRINAV (see [4])
WesternGeco TRINAV V3 (see [5])
VERIPOS UKOOA Output (see [6])
VERIPOS UKOOA 2 Output (see [7])
GPLCT
Veripos Applications – (Axiom and Orion)
References
Rev No:
Date:
[2]
NMEA 0183 Standard for interfacing marine electronic devices, version 3.01,
January 1, 2002
[4]
GPS and RTCM Formats, Schlumberger, 2002
[5]
Third Party Equipment GPS Interface Format, WesternGeco, 23 February 2009
[6]
Document AB-R-MD-01673. Data Format Definition, UKOOA Format, 03 October
2005
[7]
Document AB-V-MD-00511. Data Format Definition, UKOOA 2 Format, 30 June
2006
A
06.05.2015
Page 159
Verify QC v1.12B User Manual
Document title:
Document No.
F.1
Verify QC v1.12B User Manual
AB-V-MA-00585
NMEA SENTENCES
This section describes the message structure of the following advanced positioning and QC
output messages:
GGA
GLL
GST
ZDA
GNS
VTG
GSA
GSV – GSV
NMEA GGA Sentence
The NMEA GGA sentence contains time and position fix related data for a GPS system. It
includes basic quality information, which is limited to ‘Fix Quality’, ‘Number of Satellites in
Use’, ‘HDOP’ and ‘Age of Differential GPS Data’.
Structure and Example: $GPGGA,hhmmss.ss,ddmm.mmmmmmm,a,dddmm.mmmmmmm,b,Q,s,p.p,h.h,M,g.g,M,x.x,nnnn*c<CR><LF>
$GPGGA,150207.00,5708.7100972,N,00217.1170486,W,2,10,0.9,137.44,M,50.72,M,6.4,0704*57
GGA sentence defined: GGA
hhmmss.ss
ddmm.mmmmmmm
a
dddmm.mmmmmmm
b
Q
s
p.p
h.h
M
g.g
M
x.x
nnnn
*c<CR><LF>
Global Positioning System Fix Data
UTC of position
latitude of position
N or S, latitude hemisphere
longitude of position
E or W, longitude hemisphere
GPS Quality indicator (0 = invalid, 1 = GPS SPS, 2 = DGPS fix, 3 = GPS
PPS, 4 = Fixed RTK, 5 = Float RTK, 6 = Estimated (dead reckoning), 7 =
Manual Input Mode, 8 = Simulation Mode)
number of satellites in use
horizontal dilution of precision
antenna altitude above mean-sea-level
units of antenna altitude, meters
Geoidal height
units of geoidal height, meters
age of differential GPS data
Differential reference station ID, 0000 to 1023
checksum, carriage return and line feed
Verify QC supports 4 variations of the NMEA GGA. These variations are: -
Rev No:
Date:
o
GGA (Default)
o
GGA-DP
A
06.05.2015
number of SV’s can exceed 12 and sentence length can exceed 82
characters. Increased precision (7 decimals for Lat & Lon)
fully NMEA-0183 compatible string. Number of SV’s is limited to 12
and the sentence length is restricted to 82 characters
Page 160
Verify QC v1.12B User Manual
Document title:
Document No.
Verify QC v1.12B User Manual
AB-V-MA-00585
o
GGA-Alstom
o
GGA-PPP
number of SV’s is limited to 12 and the sentence length can exceed
82 characters. The latency value equals the actual latency divided by
12 for DGNSS solutions and divided by 36 for the Ultra or Apex
solution
number of SV’s can exceed 12 and sentence length can exceed 82
characters. The DGPS QI parameter offers the full range from 0-9. It
will show 5 for an Apex or Ultra solution and 2 for a DGPS solution.
Increased precision (7 decimals for Lat & Lon)
NMEA GLL Sentence
The NMEA GGL sentence provides 2D position data.
Structure and Example:
$GPGLL,ddmm.mmmmmmm ,a, dddmm.mmmmmmm ,b,hhmmss.ss,S,I*cc<CR><LF>
$GPGLL,5708.7104685,N,00217.1169613,W,062859.00,A,D*72
GLL sentence defined:
GLL = Geographic position - Latitude and Longitude
ddmm.mmmmmmm
latitude of position
a
N or S
dddmm.mmmmmmm longitude of position
b
E or W
hhmmss.ss
UTC of position
S
status (A = data valid ; V = data not valid)
I
mode indicator (A = Autonomous, D = Differential, E = Estimated, M
= Manual, S = Simulator, N = data Not valid)
*cc<CR><LF>
checksum, carriage return and line feed
NMEA GST Sentence
The NMEA GST sentence provides error statistics of the position fix. These statistics follow
from the position calculation process.
Structure and Example:
$GPGST,hhmmss.ss,a.aa,b.bb,c.cc,ddd.dd,e.ee,f.ff,g.gg*hh<CR><LF>
$GPGST,024603.00,3.2,6.6,4.7,47.3,5.8,5.6,22.0*58
GST sentence defined:
GST = GNSS Pseudo-range Error Statistics
hhmmss.ss
UTC time in hours, minutes, seconds of the GPS position
a.aa
RMS value of the standard deviation of the range inputs to the
navigation process. Range inputs include pseudo-ranges and
differential DGNSS corrections
b.bb
Standard deviation of semi-major axis of error ellipse (meters)
c.cc
Standard deviation of semi-minor axis of error ellipse (meters)
ddd.dd
Orientation of semi-major axis of error ellipse (degrees)
e.ee
Standard deviation of latitude error (meters)
f.ff
Standard deviation of longitude error (meters)
g.gg
Standard deviation of altitude error (meters)
*hh<CR><LF>
checksum, carriage return and line feed
Rev No:
Date:
A
06.05.2015
Page 161
Verify QC v1.12B User Manual
Document title:
Document No.
Verify QC v1.12B User Manual
AB-V-MA-00585
NMEA ZDA Sentence
The NMEA ZDA sentence provides time and time zone information.
Structure and Example:
$GPZDA,hhmmss.ss,dd,mm,yyyy,xx,yy*hh<CR><LF>
$GPZDA,201530.00,04,07,2002,00,00*6E
ZDA sentence defined:
ZDA = Time & Date
hhmmss.ss
dd,mm,yyyy
xx
yy
*hh<CR><LF>
UTC time in hours, minutes, seconds of the GPS position
Day,Month,Year (UTC)
local zone hours (00 to +/-13 hrs)
local zone minutes (00 to 59)
checksum, carriage return and line feed
NMEA GNS Sentence
The NMEA GNS sentence contains time and position fix related data for a single or
combined satellite navigation system. Separate $GPGNS and $GLGNS sentences are
used to report data calculated from individual systems if a combined GPS+GLONASS
position is output. A single string will be output if no GLONASS data is in use.
Structure and Example:
$GPGNS,hhmmss.ss,ddmm.mmmmmmm,a,dddmm.mmmmmmm,b,Q,ss,p.p,h.h,g.g,l.l,nnnn*cc<CR><LF>
$GNGNS,104601.00,5707.7332018,N,00204.7778500,W,DD,12,0.71,24.743,50.284,,*45
$GPGNS,104601.00,,,,,,09,,,,3.0,0001*44
$GLGNS,104601.00,,,,,,03,,,,3.4,0001*56
GNS sentence defined:
GNS = GNSS Fix Data
hhmmss.ss
ddmm.mmmmmmm
a
dddmm.mmmmmmm
b
Q
ss
p.p
h.h
g.g
l.l
nnnn
*cc<CR><LF>
Rev No:
Date:
A
06.05.2015
UTC of position
latitude of position
N or S, latitude hemisphere
longitude of position
E or W, longitude hemisphere
Mode Indicator. First character is for the GPS system, the second
character for the GLONASS system. (N = No Fix, A = Autonomous,
D = Differential, P = Precise, R = Real Time Kinematic, F = Float
RTK, E = Estimated, M = Manual Input Mode, S = Simulation Mode)
number of satellites in use
horizontal dilution of precision
antenna altitude above mean-sea-level
Geoidal height
age of differential GPS data
Differential reference station ID, 0000 to 1023
checksum, carriage return and line feed
Page 162
Verify QC v1.12B User Manual
Document title:
Document No.
Verify QC v1.12B User Manual
AB-V-MA-00585
NMEA VTG Sentence
The NMEA VTG sentence provides the actual course and speed relative to the ground.
Structure and Example:
$GPVTG,p.p,T,q.q,M,r.r,N,s.s,K,u*hh<CR><LF>
$GPVTG,054.7,T,034.4,M,005.5,N,010.2,K*33
VTG sentence defined:
VTG = Course over ground and ground speed
p.p
course over ground
T
degrees True
q.q
course over ground
M
degrees Magnetic
r.r
speed over ground
N
knots
s.s
speed over ground
K
km/hr
U
mode indicator (A = Autonomous, D = Differential, E = Estimated)
*hh<CR><LF> checksum, carriage return and line feed
Verify QC supports 2 variations of the NMEA VTG sentence. These variations are:
o VTG (Default)
conforms to NMEA v3.0 standard and includes the mode indicator
o VTG (Old)
conforms to previous NMEA standards and does not include the
mode indicator
NMEA GSA Sentence
The NMEA GSA sentence contains the GNSS DOP and satellites used in the solution. If
only GPS SVs are used in the calculation the talker ID will be GP. If only Glonass SVs are
used in the calculation the Talker ID will be GL. If the GPS and Glonass SVs are used in a
combined solution the talker ID will be GN and multiple GSA sentences are produced.
Structure and Example:
$--GSA,a,n,xx,xx,xx,xx,xx,xx,xx,xx,xx,xx,xx,xx,pp.p,hh.h,vv.v*c<CR><LF>
$GNGSA,A,3,02,04,05,07,08,10,13,16,23,29,,,1.1,0.6,0.9*21
$GNGSA,A,3,68,69,70,78,79,80,85,86,,,,,1.1,0.6,0.9*2F
GSA sentence defined: GSA = GNSS DOP and Active Satellites
a
Mode M = Manual, forced to operate in 2D or 3D mode A = Automatic,
allowed to automatically switch 2D/3D
n
Mode: 1 = Fix not available, 2 = 2D, 3 = 3D
xx (x12)
ID numbers of satellites used in solution, up to the first 12 ID’s
pp.p
PDOP
hh.h
HDOP
v.vv
VDOP
*c<CR><LF> checksum, carriage return and line feed
Rev No:
Date:
A
06.05.2015
Page 163
Verify QC v1.12B User Manual
Document title:
Document No.
Verify QC v1.12B User Manual
AB-V-MA-00585
NMEA GSV Sentence
GNSS Satellites In View
Number of satellites (SV) in view, satellite ID numbers, elevation, azimuth, and SNR value.
Four
satellites maximum per transmission. Total number of sentences being transmitted and the
number of the sentence being transmitted are indicated in the first two fields.
If multiple GPS, GLONASS, etc. satellites are in view, use separate GSV sentences with
talker ID GP to show the GPS satellites in view and talker GL to show the GLONASS
satellites in view, etc. The GN identifier shall not be used with this sentence.
Notes:
1) Satellite information may require the transmission of multiple sentences all containing
identical field formats when sending a complete message. The first field specifies the total
number of sentences, minimum value 1.
The second field identifies the order of this sentence (sentence number), minimum value 1.
For efficiency it is recommended that null fields be used in the additional sentences when
the data is unchanged from the first sentence.
2) A variable number of "Satellite ID-Elevation-Azimuth-SNR" sets are allowed up to a
maximum of four sets per sentence. Null fields are not required for unused sets when less
than four sets are transmitted.
3) Satellite ID numbers. To avoid possible confusion caused by repetition of satellite ID
numbers when using multiple satellite systems, the following convention has been adopted:
a) GPS satellites are identified by their PRN numbers, which range from 1 to 32.
b) The numbers 33-64 are reserved for WAAS satellites. The WAAS system PRN
numbers are 120-138. The offset from NMEA WAAS SV ID to WAAS PRN number
is 87. A WAAS PRN number of 120 minus 87 yields the SV ID of 33. The addition of
87 to the SV ID yields the WAAS PRN number.
c) The numbers 65-96 are reserved for GLONASS satellites. GLONASS satellites are
identified by 64+satellite slot number. The slot numbers are 1 through 24 for the full
GLONASS constellation of 24 satellites, this gives a range of 65 through 88. The
numbers 89 through 96 are available if slot numbers above 24 are allocated to onorbit spares.
Rev No:
Date:
A
06.05.2015
Page 164
Verify QC v1.12B User Manual
Document title:
Document No.
Verify QC v1.12B User Manual
AB-V-MA-00585
Axiom Sentence – Veripos Applications
The Axiom message is a proprietary message containing the variables required for the
VERIPOS INS Module (Axiom).
Structure and Example:
$--INS,hhmmss.ss,ddmm.mmmmmmm,a,dddmm.mmmmmmm,b,D,P,hh.h,pp.p,vv.v,h.hh,
g.gg,l.ll,cc.c,ss.s,r.rr,t.tt,u.uu,w.ww,x.xx,y.yy,z.zz,nnnn,gp,xx (x gp),gl,xx (x gl) *c<CR><LF>
$GPINS,120102.00,5708.7102489,N,00217.1179453,W,1,1,0.6,1.1,0.9,137.57,50.72,27.20
,190.853,0.007,0.04,0.04,0.03,124.22,0.04,0.04,0.04,0081,10,02,04,05,07,10,16,20,23,29,
30,9,04,05,06,13,14,15,20,21,22*5A
INS = VERIPOS NMEA Super message
hhmmss.ss
UTC of position
ddmm.mmmmmmm
Latitude of position
a
N or S, latitude hemisphere
dddmm.mmmmmmm Longitude of position
b
E or W, longitude hemisphere
D
Differential indicator (0 = false, 1 = true)
P
Precise indicator (0 = false, 1 = true)
hh.h
HDOP (max 99.9)
pp.p
PDOP (max 99.9)
vv.v
VDOP (max 99.9)
h.hh
Antenna altitude above mean-sea-level
g.gg
Geoidal height
l.ll
Age of differential GPS data
cc.c
Course over ground
ss.s
Speed over ground
r.rr
RMS value of the standard deviation of the range inputs to the
navigation process. Range inputs include pseudo-ranges and
differential DGNSS corrections
t.tt
Standard deviation of semi-major axis (meters)
u.uu
Standard deviation of semi-minor axis (meters)
w.ww
Orientation of semi-major axis of error ellipse (degrees)
x.xx
Standard deviation of latitude error (meters)
y.yy
Standard deviation of longitude error (meters)
z.zz
Standard deviation of altitude error (meters)
nnnn
Differential reference station composite ID, 0000 to 1023
gp
Number of GPS satellites in use
xx (x gp)
ID numbers of GPS satellites used in solution
gl
Number of GLONASS satellites in use
xx (x gl)
ID numbers of GLONASS satellites used in solution
*c<CR><LF>
checksum, carriage return and line feed
Rev No:
Date:
A
06.05.2015
Page 165
Verify QC v1.12B User Manual
Document title:
Document No.
Verify QC v1.12B User Manual
AB-V-MA-00585
ADVANCED POSITIONING AND QC SENTENCES
This section describes the message structure of the following advanced positioning and QC
output messages: o
o
o
o
o
o
WesternGeco TRINAV
WesternGeco TRINAV v3
VERIPOS UKOOA Output
VERIPOS UKOOA 2 Output
GPLCT
Veripos Applications – Axiom
In order to provide the necessary outputs, VERIPOS have designed two proprietary formats
containing information relative to position information and statistical measure as
recommended by UKOOA. The VERIPOS UKOOA and VERIPOS UKOOA 2 outputs are in
line with the recommendations used within the UKOOA standard.
The primary objective of the formats is to provide an output containing all the main
proprietary advanced positioning and QC information used by the majority of navigation
systems and DP systems within industry.
The formats allow the transfer of enough information to produce statistical testing when
required and contain the positioning and QC information required by navigational systems.
The VERIPOS formats contain also extra information unique to the VERIPOS system.
The format is variable in length as it includes the number of satellites and the PRN
numbers of the satellites used in the calculation. Additionally, the number of reference
stations used and their ID’s are included. As these fields change, length of the message
changes also. To assist with integration to the other systems, the variable fields are
included at the end of the message and the length of the message is included at the start.
Rev No:
Date:
A
06.05.2015
Page 166
Verify QC v1.12B User Manual
Document title:
Document No.
Verify QC v1.12B User Manual
AB-V-MA-00585
WesternGeco TRINAV Sentence
Example:
[0102 1 Verify108 501 486140.0 2.0 23 56.73661N 096 17.34229W -4.2 0.8 1.6 1.28 0.06
0.00 0.06 0.48 0.3 3 10 3 2 10 12 15 18 21 24 26 29 30501502503]
WesternGeco TRINAV sentence defined:
Content
Format
Field
Unit
Start Character
A1
1……1
-
= [ (Open string)
Record Identifier
I2
2.…...3
-
= 01
Format Version
I2
4……5
-
= 02 for this version
I2
6……7
-
See comment 1
A10
8……17
-
See comment 2
I4
18…..21
-
GPS Week no. since 21/08/99
GPS Time of Fix
F9.1
18..…30
sec
Seconds into GPS week (GPS Time).
Age of Fix
F4.1
31..…34
sec
See comment 3
Latitude
A13
35..…47
dm
^dd^mm.mmmmmN (^=space)
Longitude
A14
48…..61
dm
^dd^mm.mmmmmE (^=space)
Height
F5.1
62…..66
m
Antenna
height
above
ellipsoid. See comment 4
HDOP
F5.1
67..…71
-
VDOP
F5.1
72..…76
-
Unit Variance
F6.3
77..…82
-
Variance Latitude
F6.3
83..…88
m²
See comment 5
Covariance Lat/Long
F6.3
89..…94
m²
See comment 5
Variance Long.
F6.3
95..…100
m²
See comment 5
Variance Height
F6.3
101…106
m²
See comment 5
External Reliability
F6.1
107…112
m
See comment 6
Fix Status
I2
113…114
-
See comment 7
No. of Satellites (n)
I3
115…117
-
No. of satellites used for this fix
No. of Ref. Stations (r)
I3
118…120
-
No. of ref. stations used for this fix.
See Comment 8
PRN’s of sats. used
I3*n
Variable
-
Satellites used for this fix
Idents of ref. stations
I3*r
Variable
-
Reference stations used for this fix
End Character
A1
-
Close string
CRLF
A2
Nav. Point No.
System Name/Version
GPS Week Number
Rev No:
Date:
Comments
A
06.05.2015
WGS84
Page 167
Verify QC v1.12B User Manual
Document title:
Document No.
Verify QC v1.12B User Manual
AB-V-MA-00585
Comments:
1. The "Nav point no." is a unique integer identifying the position. It should be input
manually to the software according to requests from Navigations System operators.
Alternatively it should start from 1 and be incremented if several positions are output
from the same system.
2. The system name should identify the system (or contractor) and software
3. The "Age of fix" is the time of the first character of the data string being output to
WesternGeco's positioning system minus the time of position
4. WGS84 ellipsoid and datum must be used. The height must be antenna height
above the WGS84 ellipsoid
5. The Variance and Covariance terms are elements from the variance-covariance
matrix of the position fix computation (un-scaled)
6. The External Reliability is the maximum positional effect of an undetectable error in
an observation. This quantity is related to the Power of the test (probability that the
MDE would be detected) and the Significance level used.
a. The values recommended by UKOOA should be used (see UKOOA
Guidelines for The use of Differential GPS in offshore surveying, Issue no. 1,
Sept. 1994) i.e. a Significance level of test 1% and the Power of the test
80%
b. If values other than those given above are used, this must be explicitly
stated by the contractor
c. If no statistical testing takes place in the software, or the value is not
computed, the external reliability must be set to -1
7. Fix status codes:
Single Frequency
Status Code
0
1
2
3
Meaning
No or Bad Fixes
Altitude Aiding (Weighted Height used in
Fix)
Altitude hold (2D Fix)
3D Fix
Dual Frequency
(4 is added to the above values when positioning is set-up for dual frequency
calculations)
Status Code
4
5
6
7
Meaning
No or Bad Fix
Altitude Aiding (Weighted Height used in
Fix)
Altitude hold (2D Fix)
3D Fix
8. "No. of ref. stations" gives the number of reference stations in use for this fix, not the
number of stations available. This field must be set to 0 if the fix is not differential. If
numerical data is missing or can not be computed, the value must be set to -1.
Rev No:
Date:
A
06.05.2015
Page 168
Verify QC v1.12B User Manual
Document title:
Document No.
Verify QC v1.12B User Manual
AB-V-MA-00585
Field Formats:
Ax
Ix
Fx.y
Alphanumeric text
Integer Field
Floating point field
Where:
x
y
gives the total length including the decimal point and decimals
the number of decimals
If a sign (+ or -) is included in the field, the sign must be immediately adjacent to the
number it relates to with no spaces in between i.e. -3.12
Alphanumeric text fields must be left justified, and numeric fields must be right justified.
The field sizes are selected with a space between each field. This aids manual readability
and protects against overflow.
Rev No:
Date:
A
06.05.2015
Page 169
Verify QC v1.12B User Manual
Document title:
Document No.
Verify QC v1.12B User Manual
AB-V-MA-00585
WesternGeco TRINAV V3 Sentence
The WesternGeco Third Party Equipment GPS Interface Format V3 was introduced on 23
February 2009. It describe a standard GPS interface format applying to all installations of
Third Party GPS equipment interfaced to WesternGeco Marine Positioning Systems.
Example:
$WGPOS,3,1,Verify1.08,501,486140.00,2.0,23 56.73661N,96 17.34229W,4.197,0.8,1.6,1.279,0.055265,0.002591,0.062898,0.482222,0.35,3,0,1,10,3,2,10,12,15,18,2
1,24,26,29,30,501,502,503,]
WesternGeco TRINAV V3 sentence defined:
Content
Rev No:
Date:
Format
Unit
Comments
Start Character
A6
[-]
$WGPOS
Format Version
I
[-]
= 3 for this version
Nav. Point No.
I
[-]
See comment 1
System Name/Version
A
[-]
Name + version of DGPS system. See comment 2
GPS Week Number
I
[-]
GPS Week no. since August 21 1999
GPS Time of Fix
F10.2
[s]
Seconds into GPS week (GPS Time).
Age of Fix
F4.1
[s]
See comment 3
Latitude
A13
[dm]
dd mm.mmmmmN, space between D and M
Longitude
A14
[dm]
dd mm.mmmmmE, space between D and M
Height
F7.3
[m]
Antenna height above ellipsoid. See comment 4
HDOP
F5.1
[-]
VDOP
F5.1
[-]
Unit Variance
F9.3
[m2]
See comment 5
Variance Latitude
F10.6
[m2]
See comment 5
Covariance Lat/Long
F10.6
[m2]
See comment 5
Variance Longitude
F10.6
[m2]
See comment 5
Variance Height
F10.6
[m2]
See comment 5
External Reliability
F7.2
[m]
See comment 6
Fix Status
I
[-]
See comment 7
Computation Type
I
[-]
See comment 8
Correction Type
I
[-]
See comment 9
No. of Satellites (n)
I
[-]
No. of satellites used for this fix
No. of Ref. Stations (r)
I
[-]
No. of ref. stations used for fix. See Comment 10
PRN’s of Sats. Used
I*n
[-]
Satellites used for this fix. Separated by commas
Ref. Station Idents
I*n
[-]
Ref. stations used for this fix. Separated by commas
End Character
A1
[-]
Close string
CRLF
A2
A
06.05.2015
Page 170
Verify QC v1.12B User Manual
Document title:
Document No.
Verify QC v1.12B User Manual
AB-V-MA-00585
Comments:
1. The "Nav point no." is a unique integer identifying the position. It should be manually
input to the software according to requests from Positioning Engineers.
Alternatively, this should start from 1 and be incremented if several positions are
output from the same system.
2. The system name should identify the system (or contractor) and software version
(e.g. "SEADIFF 2.1" or "MFIX 1.2.3")
3. The "Age of fix" is the time of the first character of the data string being output to
WesternGeco’s Positioning system minus the time of position
4. WGS84 ellipsoid and datum must be used. The Height must be antenna height
above the WGS84 ellipsoid
5. The Variance and Covariance terms are elements from the Variance-Covariance
matrix of the position fix computation (un-scaled)
6. The External Reliability is the maximum positional effect of an undetectable error in
an observation. This quantity is related to the Power of the test (probability that the
MDE would be detected) and the Significance level used.
a. The values recommended by UKOOA should be used (see UKOOA
Guidelines for The use of Differential GPS in offshore surveying, Issue no. 1,
Sept. 1994) i.e. a Significance level of test 1% and the Power of the test
80%
b. If values other than those given above are used, this must be explicitly
stated by the contractor
7. Fix Status Codes
Status Code
0
1
2
3
Meaning
No or Bad Fix
Altitude Aiding (Weighted Height used in Fix)
Altitude Hold (2D Fix)
3D Fix
8. Computation Type Codes
Type Code
0
1
2
3
Meaning
Single Frequency
Dual Frequency
GLONASS Augmented
Other
9. Correction Type Codes
Type Code
0
1
2
3
4
Meaning
No Corrections
Single Frequency pseudo range diff corrections
Dual Frequency pseudo range diff corrections
Satellite Orbit Corrections
Other
10. "No. of ref. stations" gives the number of reference stations in use for this fix, not the
number of stations available. This field must be set to 0 if the fix is not differential
Rev No:
Date:
A
06.05.2015
Page 171
Verify QC v1.12B User Manual
Document title:
Document No.
Verify QC v1.12B User Manual
AB-V-MA-00585
VERIPOS UKOOA Sentence
Example:
[ 239 1.06Verify 1 1392 491778.0 +0.4 +5.4 57 07.719007N 002 04.750811W 25.781
+50.28 1.389 0.775 1.152 3 19.258 0.781 0.13 1.398 +0.125 0.656 1.635 1.75 0.81
004.3 P 10{01 02 05 06 07 16 21 23 25 30} 4{0777 0701 0702 0705}]
VERIPOS UKOOA sentence defined:
Content
Format
Unit
Comments
Start Character
A1
1
-
Open string
Length of Message
I4
2….5
-
Number of characters
Software Version
A5
6….10
-
System Name
A6
11….16
-
Record Identifier
I2
17…18
-
See comment 1
GPS Week Number
I5
19…23
-
Since Jan 6th 1980
GPS Time of Fix
F9.1
24…32
sec
Seconds into current GPS Week
Age of Record
F5.1
33…37
sec
See comment 2
Latency
F6.1
38…43
sec
Latitude
F13.6
44…56
dm
A1
57
-
F13.6
58…71
dm
A1
72
-
E or W
Altitude above MSL
F7.3
73…79
m
Antenna height above mean sea level.
See comment 3
Geoid Separation
F8.2
80…87
m
See comment 4
PDOP
F7.3
88…94
-
HDOP
F7.3
95…101
-
VDOP
F7.3
102…108
-
I2
109…110
-
See comment 5
Internal Reliability
F7.3
111…117
m
See comment 6
External Reliability (m)
F8.3
118…125
m
See comment 7
Unit Variance
F5.2
126…130
m²
See comment 8
Variance Latitude
F7.3
131…137
m²
See comment 8
Covariance Lat/Long
F8.3
138…145
m²
See comment 8
Variance Longitude
F7.3
146…152
m²
See comment 8
Variance Height
F7.3
153…159
m²
See comment 8
95% Error Ellipse Semi
Major Axis
F6.2
160…165
m
See comment 9
95% Error Ellipse Semi
Minor Axis
F6.2
166…171
m
See comment 9
Orientation Of Semi
Major Axis of Error
F6.1
172…177
º
See comment 10
A2
178…179
-
See comment 11
Latitude Hemisphere
Indicator (N or S)
Longitude
Longitude Hemisphere
Indicator (E or W)
Fix Status
F
Test
F=Fail)
Rev No:
Date:
Field
A
06.05.2015
(P=Pass,
^dd^mm.mmmmm (^=space)
N or S
^dd^mm.mmmmm (^=space)
Page 172
Verify QC v1.12B User Manual
Document title:
Document No.
Verify QC v1.12B User Manual
AB-V-MA-00585
No of Satellites used in
the Fix (n)
Satellite PRN Numbers
of Satellites used in Fix
Number of Reference
Stations used for this
Fix (00 – 99)
Ids of the Reference
Stations used in the
Fix
End of Character
I3
180…182
-
{I3*(n-1)+I2}
Variable
-
I2
Variable
-
{I5*(n-1)+I4}
Variable
-
Station ID numbers have format I4 and
are space separated
A1
-
Close string
Carriage Return
¬
-
Line Feed
^
-
PRN numbers have format I2 and are
space separated
Field Formats:
Ax
Ix
Fx.y
Alphanumeric text
Integer Field
Floating point field
Where:
x
y
gives the total length including the decimal point and decimals
the number of decimals
If a sign (+ or -) is included in the field, the sign must be immediately adjacent to the
number it relates to with no spaces in between i.e. -3.12
Alphanumeric text fields must be left justified, and numeric fields must be right justified.
The field sizes are selected with a space between each field. This aids manual readability
and protects against overflow.
Rev No:
Date:
A
06.05.2015
Page 173
Verify QC v1.12B User Manual
Document title:
Document No.
Verify QC v1.12B User Manual
AB-V-MA-00585
Comments:
1. Record Identifier
2. Age of Record
3. Altitude Above MSL
4. Geoid Separation
shows the calculation used, as different calculations can be
labelled: 1, 2, 3 etc
time of the first character of the data string being output,
minus the time of position
the datum for height calculations
separation between mean sea level and the WGS84
reference ellipsoid, based on a Geoid model as for example
EGM96
5. Fix Status Codes:
Single Frequency
Status Code
0
1
2
3
Meaning
No or Bad Fixes
Altitude Aiding (Weighted Height used in
Fix)
Altitude hold (2D Fix)
3D Fix
Dual Frequency
(4 is added to the above values when positioning is set-up for dual frequency
calculations)
Status Code
4
5
6
7
6. Internal Reliability
7. External Reliability
8. (Co)-variance
9. 95% Error Ellipse
10. Orientation
11. F Test
Rev No:
Date:
A
06.05.2015
Meaning
No or Bad Fix
Altitude Aiding (Weighted Height used in
Fix)
Altitude hold (2D Fix)
3D Fix
smallest outlier that is likely to be detected by the current
solution
maximum positional effect of an undetectable error in an
observation. This quantity is related to the Power of the test
(probability that the MDE would be detected) and the
Significance level used.
The Variance and Covariance terms are elements from the
variance-covariance matrix of the position fix computation
(un-scaled)
Shows 95% confidence level of the semi-major and semiminor axis of the error ellipse
Orientation of the semi major axis (degrees from true North)
A test applied to the Unit Variance. A “Fail” may result from
large outliers in the measurements.
Page 174
Verify QC v1.12B User Manual
Document title:
Document No.
Verify QC v1.12B User Manual
AB-V-MA-00585
VERIPOS UKOOA 2 Sentence
Example:
[ P0 1741590150906006W570743144N0020445062E0256M
3010007175008005021001P01002200606090607101316212325300036477770170270500
0000000000000A6
VERIPOS UKOOA 2 sentence defined:
Content
Format
Field
Unit
Comments
A1
1
-
Open String
binary
2
-
Dependent - SVs
Message Type Identifier
A1
3
-
P
Message Version Identifier
I1
4
-
0
Message Dependent Byte
A1
5
-
Message Dependent Byte
A1
6
-
UTC Time of Fix
I7
7…13
HHMMSSs
Date of Fix
I6
14…19
DDMMYY
Age of Data
I3
20…22
SSs
See comment 1
Datum Indicator
A1
23
-
See comment 2
Latitude
I9
24…32
DDMMSSsss
Latitude Hemisphere
A1
33
-
Longitude
I10
34…43
DDDMMSSsss
Longitude Hemisphere
A1
44
-
Height
I4
45…48
HHHh
See comment 3
Height Reference Indicator
A1
49
-
See comment 4
Mode
A1
50
-
See comment 5
95% / 68% Error Ellipse Semi-major
Axis
I3
51…53
MMm
See comment 6
95% / 68% Error Ellipse Semi-minor
Axis
I3
54…56
MMm
See comment 6
95% / 68% Error Ellipse Max Direction
I3
57…59
DDD
See comment 7
95% / 68% Latitude s d / Precision
Value
I3
60…62
MMm
See comment 8
95% / 68% Longitude s d / Precision
Value
I3
63…65
MMm
See comment 8
95% / 68% Height s d / Precision
Value
I3
66…68
MMm
See comment 8
Unit Variance
I2
69…71
MMm
F Test (P=Pass, F=Fail)
A1
72
-
HDOP
I3
73…75
NNn
PDOP
I3
76…78
NNn
External Reliability
I3
79…81
m
See comment 10
LOP with External Reliability
I2
82…83
MMm
See comment 11
Number of SV’s used at the Mobile
(N)
I2
84…85
NN
{l2*n}
Variable
NN*n
Start Character
Length of Message
Satellite PRN Numbers
Rev No:
Date:
A
06.05.2015
N or S
E or W
See comment 9
Page 175
Verify QC v1.12B User Manual
Document title:
Document No.
Verify QC v1.12B User Manual
AB-V-MA-00585
W-Test Rejected LOP
I2
NN
See comment 12
Total Number of SV’s used in Solution
I2
NN
Approximately = N x V
for multi-reference
solution
Number of Reference Stations Used
(V)
I1
N
0-9, 9 = 9 or more
The Codes of the Reference Station
used.
{I3*n}
Variable
NNN*n
See comment 13
I0 or {I1*n}
Variable
Optional Additional Data Before
Checksum
Checksum
CS
Carriage Return
¬
Line Feed
^
Comments:
1. Age of Data
the time of the first character of the data string being output,
minus the time of position
2. Datum Indicator
this indicates which Datum is being used by the calculation.
(W=WGS 84, Z=Other Datum, ?=Datum Not Known)
3. Height
height ranges from -999.9 to 9999.9
4. Height Ref Indicator this shows which vertical datum is being used to calculate
height in the calculation. (S=Spheroidal Height, M=Height
above MSL i.e. Orthometric)
5. Mode
positioning mode used to derive height value. (H=Height
Aided, 3=3D Solution, ?=Unknown)
6. Error Ellipse
shows 95% confidence level (or 68% confidence level, if the
‘Output SD’s at 1 sigma’ box is ticked) of the semi-major axis
and semi-minor axis
7. Direction
orientation of the semi major axis from centre to largest error
detection (degrees from true North)
8. 95% / 68% SD
shows 95% precision value (or 68% precision value, if the
‘Output SD’s at 1 sigma’ box is ticked) of the latitude,
longitude and height coordinates
9. F Test
a test applied to the Unit Variance. A “Fail” may result from
large outliers in the measurements.
10. External Reliability
the External Reliability is the maximum positional effect of an
undetectable error in an observation. This quantity is related
to the Power of the test (probability that the MDE would be
detected) and the Significance level used. It is considered to
be a more useful concept than internal reliability, hence its
recommended use by UKOOA as the most suitable measure
of Reliability. External reliability is measured in metres
11. LOP
LOP (Line of Position) indicates the PRN of the last satellite in
the list with the External Reliability value. (SV PRN ‘01’ – ‘99’,
‘HT’ if Altitude, ‘00’ = OK)
12. w-test Rejected LOP w-test Rejected LOP gives the PRN of the last satellite in the
list that fails the W-Test (SV PRN ‘01’ – ‘99’, ‘HT’ if Altitude,
‘00’ = OK)
13. Reference Station ID this lists the station ID’s of stations being used in the
calculation. If a multi ref is being calculated, this field can be
padded with zeros to a fixed length if required by checking the
box in the UKOOA 2 output setup window.
Rev No:
Date:
A
06.05.2015
Page 176
Verify QC v1.12B User Manual
Document title:
Document No.
Verify QC v1.12B User Manual
AB-V-MA-00585
GPLCT Sentence
The GPLCT Sentence is particularly intended for use with the Ultra and Apex services as it
includes a Float RTK GPS Quality Indicator.
String name
GPLCT
General Description
This string is comma delimited but with fixed length fields. A checksum is included for extra
robustness. The string is 87 characters, including the “*” character and the checksum.
Sample
$GPLCT,2006365,170002.00,2859.836227,N,09304.171413,W,5, -025.13, 090.00,05.55,02.01*64
Pos
Field Name
Format or Units
Comment
0
Identifier
N/A
$GPLCT – fixed string that identifies the string
1
Date
yyyyjjj
Identifies year and Julian day.
2
Time
hhmmss.ss
Time
3
Latitude
ddmm.mmmmmm
Degrees and decimal minutes, 6 digits on the
decimal minutes
4
Latitude
Hemisphere
c
N or S
5
Longitude
dddmm.mmmmmm
Degrees and decimal minutes, 6 digits on the
decimal minutes
6
Longitude
Hemisphere
c
E or W
7
GPS Quality
indicator
n
0 = fix not valid
1 = Uncorrected GPS fix
2 = DGPS fix
5 = Ultra or Apex fix
8
Antenna Height
±mmm.mm
Relative to ellipsoid, meters;
Range: -999.99 to +999.99
9
Course
ddd.dd
Vessel course over ground, degrees from North
10
Velocity
ss.ss
Vessel speed over ground, knots;
Range: 0.00 to +999.99
11
PDOP
pp.pp
PDOP
*
Fixed end delimiter
Checksum
<CR><LF>
Rev No:
Date:
A
06.05.2015
Page 177
Verify QC v1.12B User Manual
Document title:
Document No.
Verify QC v1.12B User Manual
AB-V-MA-00585
Veripos Applications - Axiom
The Axiom (INS) message is a proprietary message containing the variables required for
the VERIPOS INS Module.
String name
Axiom (INS)
General Description
This string is comma delimited but with fixed length fields. A checksum is included for extra
robustness. The string is 87 characters, including the “*” character and the checksum.
Sample
$--INS,hhmmss.ss,ddmm.mmmmmmm,a,dddmm.mmmmmmm,b,D,P,hh.h,pp.p,vv.v,h.hh,
g.gg,l.ll,cc.c,ss.s,r.rr,t.tt,u.uu,w.ww,x.xx,y.yy,z.zz,nnnn,gp,xx (x gp),gl,xx (x gl) *c<CR><LF>
$GPINS,120102.00,5708.7102489,N,00217.1179453,W,1,1,0.6,1.1,0.9,137.57,50.72,27.20,190.8
53,0.007,0.04,0.04,0.03,124.22,0.04,0.04,0.04,0081,10,02,04,05,07,10,16,20,23,29,30,9,04,05,06
,13,14,15,20,21,22*5A
Pos Field Name
Format or Units
Comment
Rev No:
Date:
Identifier
$--INS
$--INS – fixed field that identifies the string
0
Time
hhmmss.ss
UTC of position
1
Latitude
ddmm.mmmmmm
m
Latitude of position
2
Latitude
Hemisphere
a
N or S, latitude hemisphere
3
Longitude
dddmm.mmmmmm
m
Longitude of position
4
Longitude
Hemisphere
b
E or W, longitude hemisphere
5
Differential
indicator
D
Differential indicator (0 = false, 1 = true)
6
Precise indicator
P
Precise indicator (0 = false, 1 = true)
7
HDOP
hh.h
HDOP (max 99.9)
8
PDOP
pp.p
PDOP (max 99.9)
9
VDOP
vv.v
VDOP (max 99.9)
10
Height
h.hh
Antenna altitude above mean-sea-level
11
Geoid Height
g.gg
Geoidal height
12
Age of
correction
l.ll
Age of differential GPS data
13
Course over
ground
cc.c
14
Speed over
ground
ss.s
15
RMS
r.rr
RMS value of the standard deviation of the range
inputs to the navigation process. Range inputs
include pseudo-ranges and differential DGNSS
corrections
16
Semi-major SD
t.tt
Standard deviation of semi-major axis (meters)
A
06.05.2015
Page 178
Verify QC v1.12B User Manual
Document title:
Document No.
Rev No:
Date:
Verify QC v1.12B User Manual
AB-V-MA-00585
17
Semi-minor SD
u.uu
Standard deviation of semi-minor axis (meters)
18
Semi-major Axis
orientation
w.ww
Orientation of semi-major axis of error ellipse
(degrees)
19
Lat SD
x.xx
Standard deviation of latitude error (meters)
20
Lon SD
y.yy
Standard deviation of longitude error (meters)
21
Altitude SD
z.zz
Standard deviation of altitude error (meters)
22
Reference
Station ID
nnnn
Differential reference station composite ID, 0000
to 1023
23
No. of GPS Svs
gp
Number of GPS satellites in use
24
GPS IDs
xx (x gp)
ID numbers of GPS satellites used in solution
25
No. of Glonass
Svs
gl
Number of GLONASS satellites in use
26
Glonass IDs
xx (x gl)
ID numbers of GLONASS satellites used in
solution
27
*c
Checksum
28
<CR><LF>
A
06.05.2015
Page 179
Verify QC v1.12B User Manual
Document title:
Document No.
Verify QC v1.12B User Manual
AB-V-MA-00585
G TIDES LOGGING FILE FORMATS
The Tides functionality will create three files in ASCII format:
Tideinfo.txt
Doodson.txt
SPRINT_Tides.txt
The structure of each of these files is outlined in the tables below.
Filename
Tideinfo.txt
General Description
The TideInfo.txt file contains current system height and tide information at the Averaging Period
as configured by the Verify QC user.
This file contains comma delimited strings with variable length fields. Null fields indicate that no
information is currently available; they should not be interpreted as ’zero’. A checksum is included
for extra robustness.
Negative tide is low tide and positive tide is high tide respectively.
Sample
$UltraTide,20070228,21:40:00,28,600,600,5236.2830,N,00143.5184,E,5.74,0.08,0.07,5.66,5.82,5.45,0.29,0.02,5.72,44.84
,0.00,0.27,EGM96*2B
Field
Number
Field Name
Format or Units
Description & Comments
0
TalkerID
-
$UltraTide or $VQC112Tide
(Dependant on user configuration)
1
Date
yyyymmdd
Identifies year, month and day for
which all information in the string is
valid.
2
Time (UTC or GPS)
hh:mm:ss (UTC)
Identifies time in UTC or GPS for
which all information in the string is
valid.
or
ssssssssss (GPS)
3
Sequence Number
numerical
Sequential number incrementing by
1 for every extra string. Maximum is
99999999 after which an automatic
reset back to 1 takes place.
4
Averaging Period
numerical
User selected period over which
VERIPOS Apex or Ultra heights are
averaged in seconds. Minimum is
60, maximum is 3600.
5
Sample Count
numerical
Number of VERIPOS Apex or Ultra
height samples that were included
to derive the antenna height
average. Minimum is 50% of
‘Averaging Period’, maximum is
‘Averaging Period’
6
Latitude
ddmm.mmmm
Location where height and tide
information is valid.
(degrees, minutes
and decimal minutes)
7
Rev No:
Date:
A
06.05.2015
Latitude Hemisphere
c
N or S
Page 180
Verify QC v1.12B User Manual
Document title:
Document No.
Verify QC v1.12B User Manual
AB-V-MA-00585
8
Longitude
dddmm.mmmm
(degrees, minutes
and decimal minutes)
Rev No:
Date:
Location where height and tide
information is valid.
9
Longitude Hemisphere
c
E or W
10
Mean Height
hh.hh (metres)
Mean of the VERIPOS Apex or
Ultra heights during the ‘Averaging
Period’
11
Mean of Height SD
hh.hh (metres)
Mean of the Height SD’s associated
with the VERIPOS Apex or Ultra
heights during the ‘Averaging
Period’. This is an indication of the
quality of the VERIPOS Apex or
Ultra heights
12
SD of Heights
hh.hh (metres)
Standard deviation of the VERIPOS
Apex or Ultra heights during the
‘Averaging Period’. This is an
indication if the variation of the
height due to vessel motion and
position quality.
13
Minimum of Heights
hh.hh (metres)
Minimum of the VERIPOS Apex or
Ultra heights during the ‘Averaging
Period’
14
Maximum of Heights
hh.hh (metres)
Maximum of the VERIPOS Apex or
Ultra heights during the ‘Averaging
Period’
15
Doodson
hh.hh (metres)
Estimated tide-less antenna height
above Mean Sea Surface from the
Doodson filter. First available after
39 hours.
16
MSS Tide
hh.hh (metres)
Local tide based on the Mean Sea
Surface derived from the Doodson
filter. First available after 39 hours.
17
Geoid Tide
hh.hh (metres)
Local tide relative to user selected
Geoid (see field 22). Available
instantaneously after user
configured ‘hold-off’ time
18
Antenna Height
hh.hh (metres)
User entered height of the antenna
above the waterline.
19
Geoid Separation
hh.hh (metres)
Local offset between the user
selected Geoid and the WGS84
reference ellipsoid.
20
Draft
hh.hh (metres)
The draft. Calculated as the current
Doodson value minus the Doodson
value for the first record.
21
Vertical Bias
hh.hh (metres)
The vertical bias detected between
MSS Tide and Geoid Tide.
Calculated as Antenna Height
minus Doodson plus Draft.
22
Geoid Model
-
EGM96, EGM08 or USER,
depending on user selection
*
c
Fixed end delimiter
A
06.05.2015
Page 181
Verify QC v1.12B User Manual
Document title:
Document No.
Verify QC v1.12B User Manual
AB-V-MA-00585
cc
Rev No:
Date:
A
06.05.2015
Checksum
Page 182
Verify QC v1.12B User Manual
Document title:
Document No.
Verify QC v1.12B User Manual
AB-V-MA-00585
Filename
Doodson.txt
General Description
The Doodson.txt file contains current system height and tide information at hourly intervals.
The information in this file is consistent with the information contained in the file TideInfo.txt but
information has been condensed to a fixed averaging period of one hour.
This file contains comma delimited strings with variable length fields. Null fields indicate that no
information is currently available; they should not be interpreted as ’zero’. A checksum is included
for extra robustness.
Negative tide is low tide and positive tide is high tide respectively.
Sample
$UltraTide,20070301,23:00:00,31,3600,3599,5236.2829,N,00143.5183,E,5.90,0.09,0.11,5.74,6.06,5.45,0.45,0.18,5.72,44.
84,0.00,0.27,EGM96*22
Field
Number
Field Name
Format or Units
Description & Comments
0
TalkerID
-
$UltraTide or $VQC112Tide
(Dependant on user configuration)
1
Date
yyyymmdd
Identifies year, month and day for
which all information in the string is
valid.
2
Time
hh:mm:ss (UTC)
Identifies time in UTC for which all
information in the string is valid.
or
ssssssssss (GPS)
3
Sequence Number
numerical
Sequential number incrementing by
1 for every extra string. Maximum is
99999999 after which an automatic
reset back to 1 takes place.
4
Averaging Period
numerical
Fixed period (3600 seconds) over
which the VERIPOS Apex or Ultra
heights are averaged in seconds.
5
Sample Count
numerical
Number of VERIPOS Apex or Ultra
height samples that were included
to derive the antenna height
average. Minimum is 50% of
‘Averaging Period’, maximum is
‘Averaging Period’
6
Latitude
ddmm.mmmm
Location where height and tide
information is valid.
(degrees, minutes
and decimal minutes)
7
Latitude Hemisphere
c
N or S
8
Longitude
dddmm.mmmm
Location where height and tide
information is valid.
(degrees, minutes
and decimal minutes)
9
Rev No:
Date:
A
06.05.2015
Longitude
Hemisphere
c
E or W
Page 183
Verify QC v1.12B User Manual
Document title:
Document No.
Rev No:
Date:
Verify QC v1.12B User Manual
AB-V-MA-00585
10
Mean Height
hh.hh (metres)
Mean of the VERIPOS Apex or
Ultra heights during the ‘Averaging
Period’
11
Mean of Height SD
hh.hh (metres)
Mean of the Height SD’s associated
with the VERIPOS Apex or Ultra
heights during the ‘Averaging
Period’. This is an indication of the
quality of the VERIPOS Apex or
Ultra heights
12
SD of Heights
hh.hh (metres)
Standard deviation of the VERIPOS
Apex or Ultra heights during the
‘Averaging Period’. This is an
indication if the variation of the
height due to vessel motion and
position quality.
13
Minimum of Heights
hh.hh (metres)
Minimum of the VERIPOS Apex or
Ultra heights during the ‘Averaging
Period’
14
Maximum of Heights
hh.hh (metres)
Maximum of the VERIPOS Apex or
Ultra heights during the ‘Averaging
Period’
15
Doodson
hh.hh (metres)
Estimated tide-less antenna height
above Mean Sea Surface from the
Doodson filter. First available after
39 hours.
16
MSS Tide
hh.hh (metres)
Local tide based on the Mean Sea
Surface derived from the Doodson
filter. First available after 39 hours.
17
Geoid Tide
hh.hh (metres)
Local tide relative to user selected
Geoid (see field 22). Available
instantaneously after user
configured ‘hold-off’ time
18
Antenna Height
hh.hh (metres)
User entered height of the antenna
above the waterline.
19
Geoid Separation
hh.hh (metres)
Local offset between the user
selected Geoid and the WGS84
reference ellipsoid.
20
Draft
hh.hh (metres)
The draft. Calculated as the current
Doodson value minus the Doodson
value for the first record.
21
Vertical Bias
hh.hh (metres)
The vertical bias detected between
MSS Tide and Geoid Tide.
Calculated as Antenna Height
minus Doodson plus Draft.
22
Geoid Model
-
EGM96, EGM08 or USER,
depending on user selection
*
c
Fixed end delimiter
cc
Checksum
A
06.05.2015
Page 184
Verify QC v1.12B User Manual
Document title:
Document No.
Verify QC v1.12B User Manual
AB-V-MA-00585
Filename
SPRINT_Tides.txt
General Description
The SPRINT_Tides.txt file contains the current UltraTide with the opposite sign compared to the
MSS Tide contained in the TideInfo.txt and Doodson.txt files.
This file contains comma delimited strings with variable length fields. Null fields indicate that no
information is currently available; they should not be interpreted as ’zero’. A checksum is included
for extra robustness.
Negative tide is high tide and positive tide is low tide respectively.
Sample
12,20,22,09,2006,-0.88
Field
Number
Rev No:
Date:
Field Name
Format or Units
Description & Comments
0
Hours
HH
Hours in the day (UTC). Time for
which all information in the string is
valid.
1
Minutes
MM
Minutes in the day (UTC). Time for
which all information in the string is
valid.
2
Day
DD
Day in the month.
3
Month
MM
Month in the year.
4
Year
YYYY
Year.
5
UltraTide
hh.hh (metres)
Local UltraTide based on the Mean
Sea Surface derived from the
Doodson filter. First available after
39 hours. Set as 99999.99 when no
UltraTide value is available.
*
c
Fixed end delimiter (real time
output only)
cc
Checksum (real time output only)
A
06.05.2015
Page 185
Verify QC v1.12B User Manual
Document title:
Document No.
Verify QC v1.12B User Manual
AB-V-MA-00585
H GNSS RECEIVER LIST
The table below lists the default baud rates used by the GNSS manufacturers of receivers
supported by Verify QC. VERIPOS recommends a baud rate of no less than 38400 for raw
GNSS measurements.
GNSS Receiver List
Default baud rate
Septentrio AsteRx1/2
115200
Septentrio AsteRx2eH1/2
115200
Topcon/Javad1
38400
Magellan ZX Sensor1/2
57600
Magellan DG14/161/2
38400
NovAtel OEM4-G21/2
9600
NovAtel OEMV2
9600
Veripos LD4
115200
Veripos LD5
115200
Veripos LD6
115200
Veripos LD7
115200
1
2
Rev No:
Date:
A
06.05.2015
– Internal Card inside LDx Receiver or External/Standalone Receiver
– External/Standalone Receiver
Page 186
Verify QC v1.12B User Manual
Document title:
Document No.
I
Verify QC v1.12B User Manual
AB-V-MA-00585
VERIPOS - CONTACT DETAILS AND OFFICE LOCATIONS
VERIPOS UK
Veripos House
1B Farburn Terrace
Dyce
Aberdeen, AB21 7DT Scotland, United Kingdom
Veripos Helpdesk:
Tel:
[email protected]
+44 (0)1224 965900
For regional office locations please visit www.veripos.com
Rev No:
Date:
A
06.05.2015
Page 187
Verify QC v1.12B User Manual