1
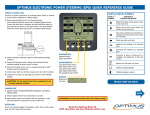
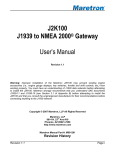
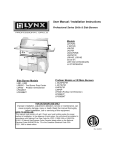
intelligent monitoring solutions
GEM Manual
ge n e r i c e n g i n e m o n i t o r ( G em )
USER GUIDE
The Engine Monitor
Engine Monitor
Before you start - what you should have
What you should have
(clockwise from top left):
•Mounting template/Packing list
•The Engine Monitor User Manual
•Front mounting kit (4 x studs/nuts)
•The CANtrak 2600/2610 Display
plus
Other Engine Monitor accessories
optionally available (clockwise from
top left):
•Trunnion Mounting Bracket (Part No. 930293)
• Protective Push on Front Cover
(Part No.165271)
•Behind Dash Mounting Kit (Part No. 900061)
•Power/CAN Harness (Part No. 510623)
•Power/CAN/ GPS harness (Part No. 510626)
(not shown)
page 2
1. The Engine Monitor User Manual
Thank you for choosing the Engine Monitor.
These pages provide operating instructions
for the Engine Monitor which displays J1939 or
J1587 - compatible engine/transmission data.
Please read through the guide before use.
The Engine Monitor user-configurable
application software creates graphical
instrument clusters to display parameters
and alarms - providing users with a timesaving solution for introducing equipment
incorporating higher degrees of electronic
display and control.
We hope you will be very happy with this
product and have many years of troublefree operation. If you have any problems or
ideas for improvement then we would like
to hear from you.
For more information please contact
us at: [email protected]
web site: www.kongsbergautomotive.com
page 3
Section/Contents
Page
2. Understanding The Engine Monitor
4
3. Getting Started
6
4. Soft Keys
7
5. The Tri Display
8
6. The Quad Display 11
7. The Uni Display
12
8. Data Parameters Monitored
13
9. Active and Stored Alarm Lists
18
10. Configuration Menu
20
11. Pop-Up Messages and Warnings
26
12. Adjusting Lighting and Contrast
27
13. Preferred Screen Store
28
14. Keypad Lock
28
15. Connector Pin-Out
29
16. Typical J1939 Wiring Topology
31
17. Installation
32
18. Maintenance and Troubleshooting
34
19. The CANtrak Platform
35
20. Software Development
36
21. Glossary
37
22. Important Safety and Legal Information 38
2. Understanding The Engine Monitor
The Engine Monitor software runs on a CANtrak display (see section 19 for further details on the
CANtrak platform) with five soft keys, providing a flexible and intuitive Human-Machine Interface
(HMI). The 5 soft keys access a graphical menu structure that uses standard and easily-understood
icons to indicate the key’s current function. This enables the operator to select the required engine/
transmission data and display it in the following formats:
• Analogue gauges
• Digital values
• Historical trend graphs
• Current and stored alarm messages
Additionally, various diagnostic screens are available, allowing detailed investigation of the engine
and transmission data stream. The underlying structure of the Engine Monitor and its interaction
with the soft keys may be understood by Figure 1. By accessing the Configuration menu, users can
customise some of the displayed data to show, for example, metric or imperial units, and various
parameters such as the full-scale reading of gauges.
page 4
Understanding The Engine Monitor - continued
The Engine Monitor presents a context dependent ‘button bar’ above the push
buttons if any key from 1 to 4 is pressed from left to right - it disappears after 5 seconds of
inactivity. This ‘top level’ button bar shows the basic structure of the Engine Monitor:
Figure 1
Key 1:
Key 2:
Key 3:
Key 4:
Key 5:
Tri Display, or
Main Engine
Display. Repeat
presses cycle the
fuel computer
through various
modes:
Quad
Display (user
configurable).
Repeat presses
cycle the
display around
3 different quad
view options:
Uni Display
showing
data history
(configurable).
Repeat presses
cycle display
through available
parameters:
Active Alarm
Display. Holding
the key brings up
Stored Alarms:
Contrast
and Lighting
adjustment, or
- if held for 3
seconds - the
Configuration
menu:
page 5
3. Getting Started
When power is applied to the display, a start-up screen displays for approximately 7 seconds
while the display performs a self test. If the display makes a ‘bleep-ing’ sound for longer than 1
second, self-test has failed. Users can attempt to rectify the fault by restoring factory defaults (see
Configuration menu/section 10 for details); if the fault persists, contact your supplier for guidance.
After the start-up screen disappears, the Engine Monitor starts displaying readings on its virtual
gauges if it is connected to an active source of data. The Engine Monitor displays the ‘main engine
display’ or tri-screen on initial start-up, but note that after use this changes to the screen that was
last displayed (see Preferred Screen Store/section 13 for details). The Engine Monitor display modes
are detailed in the following sections.
page 6
4. Soft Keys
The Engine Monitor’s soft keys simplify the operator interface. In use, the Engine Monitor displays a
‘button bar’ directly above the soft keys when any of the first 4 keys (keys 1 to 4, starting from the
left) are pressed - with icons representing the current function of each key. Figure 2. shows the top
level button bar, with icons 1 to 4 representing the gauges and alarms available, and icon 5 an ‘exit
door’. Repeat presses of these buttons toggles around the display options available. The button bar
will disappear after approximately 5 seconds if no further keys are pressed.
Figure 2. The Engine Monitor’s top level
button bar menu:
Key 1: Pages icon indicating that further
presses cycle through options for the
screen being viewed (in this instance fuel
computer modes for the main engine
display)
Key 2: Quad Display mode
Key 3: Uni Display mode
Key 4: Alarm Display mode
Key 5: Exit door
page 7
5. The Tri Display
This Engine Monitor display mode provides three independent windows, and is intended to show
the most frequently accessed vehicle data (RPM, speed, temperature and fuel). To select Tri Display,
press any of the first 4 keys to show the top level button bar, and then press key 1 (the left-hand
key). The parameter displayed in the top right gauge is user defined, to change the displayed data
press key 5 when the button bar is visible and then keys 1 and 2 to cycle through the available
parameters. Also the data displayed in the fuel computer window (Bottom left window) may be
changed by repeated pressing of key 1, This is explained in more detail in the following pages. Also,
attributes such as units and scales may be changed via the Configuration menu (See section 10 for
details).
The top window shows 2 analogue gauges;
Engine RPM and Speed (maximum RPM
and speed may be set via the Configuration
menu). If speed data is not available the right
hand gauge will display engine oil pressure.
The bottom right window shows coolant
temperature. The bottom left window displays
the fuel computer.
Figure 3.1. Tri Display, accessed via key 1.
Note. Metric units are shown as default, but others may be
selected via the Configuration menu.
It is also possible to display speed derived
from a GPS module with an NMEA 0183
output - interfaced via the display’s RS232
port (contact your Engine Monitor supplier for
further information).
page 8
5. The Tri Display (Fuel Computer Modes)
Figure 3.2. A fuel computer
display.
Note. Metric units are shown as
default, but others may be
selected via the configuration
menu.
The lower left display window provides access to the fuel computer
data and also shows fuel tank level. Upon pressing key 1 the fuel
computer is highlighted, when highlighted various data can be
displayed by repeat pressing of key 1. When first selected a small icon
will also appear in the centre of the screen with the text “Hold Reset”.
Holding key 1 at this time will perform a Trip Reset. After 2 seconds of
no key presses the fuel computer will go back to normal and the icon
will disappear.
Data Available is similar to an automotive in-car fuel computer.
Below is the list of parameters that can be displayed in the fuel computer window in alphabetical
order:
Distance Remaining: Calculated if Fuel Tank Capacity is set and Fuel Rate, Vehicle Speed and
Fuel Level are available [Distance]
Fuel Level: If available [Volume]
Fuel Rate: If available [Volume/Hour]
Fuel Remaining: Calculated if Fuel Tank Capacity is set and Fuel Level is availiable [Volume]
Instantaneous Fuel Economy: Calculated if Vehicle Speed and Fuel Rate are available
[Distance/Volume]
Total Engine Hours: If available [Hours]
Total Vehicle Distance: If available [Distance]
page 9
5. The Tri Display (Fuel Computer Modes) - continued
Trip Distance: Calculated since last Trip Reset if Total Vehicle Distance is availiable [Distance]
Trip Engine Hours: Calculated since last Trip Reset if Total Engine Hours is availiable [Hours]
Trip Fuel: Calculated since last Trip Reset if Total Fuel Used is availiable [Volume]
Trip Fuel Economy: Calculated since last Trip Reset if Total Fuel Used and Total Vehicle Distance
are available [Distance/Volume]
Trip Fuel Rate: Calculated since last Trip Reset if Total Engine Hours and Total Fuel Used are
available [Volume/Hour]
Note. A Trip Reset affects all reset-able fuel computer parameters and can be performed by holding
key 1 when the Hold Reset icon appears. The icon appears for approximately 2 seconds when
the fuel computer window is first selected. Setting Total Fuel Tank Data and Fuel Tank Reset is
performed via the Configuration menu.
page 10
6. The Quad Display
Quad Display mode provides 4 gauges. To select it, press any of the keys 1 to 4 to show the top
level button bar and then key 2. Repeat presses of key 2 cycle the display around 3 separate quad
screens: 4 digital gauges, 4 analogue gauges and 4 alternative analogue gauges. All 12 gauges
may be selected and configured by users, providing a simple means of creating application-specific
views of engine data. Gauges are selected via quad display’s ‘adjust mode’, by pressing key 5
(noted by an arrow icon) when the Engine Monitor is running quad display and the button bar is
visible. In adjust mode, corresponding key presses cycle the display through available parameters
(listed in section 8). The selected configuration is stored even when power is removed; adjust mode
is exited by pressing key 5.
Figure 4. Top row: the 3 default displays available in
quad-display, and adjust mode (right) which allows
users to select the gauges displayed.
Note. If a parameter is not available from the engine/
transmission, it will not be possible to select it. If the
parameter becomes unavailable while in view, ‘- - -‘ is
displayed.
page 11
7. The Uni Display
The Engine Monitor’s Uni Display mode plots
data history in one large window - in an X-Y
graph format similar to a pen plotter. This
mode is selected by pressing any of the first
4 keys to show the top level button bar and
then key 3.
Figure 5. Example graph display plotting battery
potential switched.
Note. If a parameter is not available from the
engine/transmission, it will not be possible
to select it. If the parameter becomes
unavailable while in view, ‘- - -’ is displayed.
Data is shown in graph form, with the most
recent data scrolling from right to left. The
viewed time range may be adjusted in the
Configuration menu from 2 minutes to 8
hours in six steps. Maximum and minimum
values of the Y axis (the reading span) are
adjusted automatically to give an optimum
view of data. The parameter displayed is
selectable by repeatedly pressing key 3
while in the Uni Display mode.
The parameters that may be displayed are
listed in section 8.
page 12
8. Data Parameters Monitored
This table lists the engine and transmission parameters that are monitored via the J1939 and/or
the J1587 datalinks. The parameters can be displayed by the Engine Monitor in user-configurable
Tri Display, Quad Display or Uni Display modes (√ indicates the parameter may be selected). DB
is an abbreviation for the Engine Monitor’s internal database, which stores all data transmitted
from the engine/transmission. The complete database list can be accessed on the display via the
Configuration menu.
Abbreviations: The units ‘MPG’ and ‘Gal’ denote US gallons. For non-US Imperial gallons (UK,
Canada, etc) the units are denoted as ‘IMPG’ or ‘IGal’. N = nautical. KTS = knots
Note. If a parameter is not available, it will not be possible to select it. If the parameter becomes
unavailable while in view, ‘- - -‘ is displayed.
Datalinks
Screens
Icon
Parameter
J1939 J1587 Tri Quad Uni
DB
ELECTRICAL (Volts or Amps)
page 13
Electrical Potential
√
√
√
√
√
√
Battery Potential Switched
√
√
√
√
√
√
Net Battery Current
√
√
√
√
√
√
Alternator Potential
√
√
√
√
√
√
Alternator Current
√
√
√
√
√
√
8. Data Parameters Monitored - continued
Datalinks
J1939 J1587
FUEL (L, Gal, lGal) or(L/h, Gal/h IGal/h) or (km/L, MPG or IMPG)
Fuel Remaining
√
√
Icon
Parameter
Tri
Screens
Quad Uni
√
DB
√
Fuel Rate
√
√
√
Instantaneous Fuel Economy
√
√
√
√
Trip Fuel Economy
√
√
√
√
Trip Fuel
√
√
√
√
Trip Fuel Rate
√
√
√
None
Total Fuel Used
√
√
None
Fuel Leakage 1
√
√
√
√
None
Fuel Leakage 2
DISTANCE (km, Miles or Nmiles)
Distance Remaining
√
√
√
√
√
√
√
√
√
√
Trip Distance
√
√
√
√
Total Vehicle Distance
√
√
√
√
page 14
8. Data Parameters Monitored - continued
Icon
Parameter
PRESSURE (kPa, PSI or bar)
Fuel Delivery Pressure
Datalinks
J1939 J1587
Tri
Screens
Quad Uni
√
√
√
√
Barometer Pressure
√
√
√
√
Auxiliary Pressure 1
√
√
√
Boost Pressure
√
√
√
√
Air Inlet Pressure
√
√
√
√
√
Air Filter 1 Differential Pressure
√
√
√
√
√
None
Injector Metering Rail 1 Pressure
√
√
None
Injector Metering Rail 2 Pressure
√
Coolant Pressure
√
√
√
√
√
√
Engine Oil Pressure
√
√
√
√
√
√
Transmission Oil Pressure
√
√
√
√
√
√
None
Clutch Pressure
√
√
√
None
Air Start Pressure
√
√
√
√
√
√
None
Injection Control Pressure
TEMPERATURE (ºC or ºF)
Engine Coolant Temperature
page 15
√
DB
√
√
√
√
√
√
√
√
√
√
√
Engine Intercooler Temperature
√
√
√
√
Engine Oil Temperature 1
√
√
√
√
√
√
√
√
√
8. Data Parameters Monitored - continued
Icon
Parameter
TEMPERATURE (ºC or ºF)
Transmission Oil Temperature
Tri
Screens
Quad Uni
√
√
√
√
√
√
√
√
√
Fuel Temperature
√
√
√
√
√
Intake Manifold 1 Temperature
√
√
√
√
Air Inlet Temperature
√
√
√
√
Exhaust Gas Temperature
√
√
√
√
Auxiliary Temperature 1
√
√
√
√
Acceleration Position
√
√
√
√
√
DB
Turbo Oil Temperature
None
Engine ECU Temperature
None
Exhaust Gas Port 1 Temperature
None
Exhaust Gas Port 2 Temperature
None
Turbo 1 Compressor Inlet Temperature
PERCENTAGE (%)
Fuel Level
None
Datalinks
J1939 J1587
√
√
√
√
√
√
√
√
√
√
√
√
√
√
√
√
√
√
√
√
Throttle Position
√
√
Engine Oil Level
√
√
√
√
√
√
page 16
8. Data Parameters Monitored - continued
Icon
Parameter
PERCENTAGE (%)
Coolant Level
Estimated Percent Fan Speed
Drivers Demand Percent Torque
Actual Engine Percent Torque
Torque Use at RPM
SPEED (RPM, km/h, MPH or KTS)
None
Input Shaft Speed
None
Output Shaft Speed
Engine Speed
None
Turbo 1 Speed
None
Engine Desired Operating Speed
Navigation Wheel Based Vehicle Speed
TIME (h)
Total Engine Hours
Trip Engine Hours
None
Service Hours
MISCELLANEOUS
None
Torque Converter Lock-Up Engaged
Current Gear
Selected Gear
None
CANTX Disable
page 17
Datalinks
J1939 J1587
√
√
√
√
√
√
√
√
√
√
√
√
√
√
√
√
√
√
√
√
√
√
√
Tri
Screens
Quad Uni
√
√
√
√
√
√
√
√
DB
√
√
√
√
√
√
√
√
√
√
√
√
√
√
√
√
√
√
√
√
√
√
√
√
√
√
√
√
√
√
√
√
√
Note. This list is current at the time of going to press, new parameters are continually being added
- the latest list may be found in the latest datasheet (available via www.congsbergautomotive.com).
9. Active and Stored Alarm Lists
Active alarms. When an active/current alarm is received, a flashing pop-up window appears
overlaid on the current screen in use, showing details of the current alarm. When an active alarm is
received, the Engine Monitor activates its internal sounder, and the external alarm output on Pin 11
(if available on the CANtrak you have chosen).
Figure 6. Example alarm message, plus alarm list screens showing unacknowledged conditions (black
background) and acknowledged alarms (grey background). After acknowledgement, the exit key (open
door icon) becomes active. J1939-standard abbreviations are used wherever possible, Note. “MS” = Most
Severe, “MOD”= Moderately Severe and “LS” = Least Severe.
The alarm list is accessed by pressing any key while an alarm pop-up is displayed, or by pressing
any of the first 4 keys to show the button bar, and then key 4. This screen displays all current active
alarms; when entered, Pin 11 External Alarm Output is deactivated (if the function is available).
Alarms not yet acknowledged are shown in grey on black. Alarms already acknowledged are shown
in black on grey. If engine hours data is available, the list indicates when the alarm was initiated.
page 18
9. Active and Stored Alarm Lists - continued
When first entering the screen, the list automatically displays the most recent alarm. The list can be
scrolled using keys 1 and 2. This screen cannot be exited until all alarms have been acknowledged
by pressing key 3. Alarm messages are automatically cleared from the list when no longer received
by the Engine Monitor.
Stored alarms. Alarms stored by engine/transmission ECU’s (i.e. not active or current but old/
historical alarms) may be viewed by pressing and holding key 4 while the active alarm list screen is
visible. On entry to this page, the Engine Monitor sends a data request to the engine/transmission.
The engine/transmission sends the stored alarm data to the Engine Monitor, which is decoded and
displayed in a similar fashion to active alarms. The Engine Monitor displays an error message if
there is no response from the engine/transmission. If the engine/ transmission supports the erasure
of stored alarms, they may now be erased by holding key 3.
Figure 7. An example Stored Alarm List
screen.
page 19
10. Configuration Menu
This mode allows users to set various Engine Monitor operating parameters such as imperial or
metric units, scale limits for speedometer, engine service interval, etc. The configuration menu is
entered by pressing and holding key 5 (the right hand key) for at least 3 seconds while the Engine
Monitor is in normal operating mode. The top level configuration menu will be displayed as shown.
Keys 1 and 2 then allow you to choose from SETTINGS, SYSTEM or Db VIEWER (The chosen item
is highlighted in bold with an arrow pointing to it). Pressing key 4 enters the chosen sub-menu.
SETTINGS allows the Engine Monitor to be configured according to user preferences. SYSTEM
accesses maintenance and low level system configuration settings. Db VIEWER allows the user to
view all data (including that that cannot be found in the graphical screens) that the Engine Monitor
decodes. Each of these sub-menus is described in more detail on the pages following. Pressing key
5 exits the current menu/sub-menu. Settings are automatically stored on exit.
---------
Figure 8. The top level Configuration menu and its three choices of SETTINGS, SYSTEM
and Db VIEWER sub-menus. Pressing Key 4 enters the menu highlighted. Key 5 (‘exit
door’ - the right hand button) returns you to the previous menu.
page 20
10. Settings Sub-Menu (2nd Level Configuration Menu)
The settings menu allows the user to enter sub-level screens
to configure:
Units: This menu enables the user to set the units used
for speed, distance, pressure, volume and temperature.
Language: Choose from various languages.
Bleep: When activated, the soft keys will emit an audible
“bleep”. Use this menu to switch the function on/off. An
audible “bleep” will still sound if an alarm occurs.
Display: The display menu allows the user to configure
certain visual parameters and controls of the display.
MAX RPM: This defines and restricts the upper limit of the RPM gauges displayed throughout
the Engine Monitor.
MAX SPEED: This defines and restricts the upper limit of the Speed gauges displayed
throughout the Engine Monitor.
GRAPH RANGE: This changes the resolution of the historic data displayed in the Uni Display.
QUAD ADJUST: This setting allows the user to disable the ‘adjust mode’ feature in the Quad
Displays. This is generally used for users who would like to fix the parameters displayed on the
screens once they are happy with them. This can be re-enabled at any time.
Service: Set the service interval in hours and reset the interval counter. It is important to
note that setting SERVICE to 0 will disable the service interval function and the word “OFF”
will be displayed.
Fuel Capacity: The fuel capacity screen allows the user to enter the fuel tank capacity of
the vehicle. By default the fuel tank capacity will be set to 0. Only after this has been set will the
parameters Fuel Remaining and Distance Remaining be calculated.
page 21
10. System Sub-Menu (2nd Level Configuration Menu)
The System menu allows the user to configure or view:
Demo: Switches between the Engine Monitor’s demonstration
modes and the normal mode of displaying live engine/
transmission data. Demo allows the Engine Monitor to operate
without live data and provides 3 levels of simulation data: 1 =
Speed On; 2 = Speed Off; 3 = Alarms On (0 = OFF). Demo is
automatically set to OFF if live data is received.
Restore Defaults: This allows
you to reset all configuration information to
default metric or imperial values. The default
settings are:
Setting
Metric
Language
English
Max. RPM
4000
Max. Speed
110 KmH
Graph range
*In MEM the defaults for speed and distance
is Knots and Nmiles respectively. This is the
same for metric and imperial.
Imperial
70 MPH
2 mins
Speed
KmH*
MPH*
Distance
Km*
Miles*
Pressure
kPa
PSI
Volume
L Gal
Temperature
ºC
ºF
Demo Mode
0
page 22
10. System Sub-Menu - continued
Com Viewer: Displays last messages received on J1939
(CAN), NMEA 0183 (GPS-derived speed over ground data) and
J1587 ports. System settings stored in memory can be seen in
the EEPROM Viewer.
Note. This is a diagnostic feature that displays the contents of the
EEPROM with the current values. This may be helpful for OEMs/
users diagnosing faults.
Datalink Settings:
This sub-menu allows the user to configure the common datalink
settings (Speed Source & Trip Source) as well as the individual
J1939/J1587 settings (such as source addresses).
J1939 Settings: This screen allows adjustments specific
to the J1939 Datalink.
Source Address 1 & 2: These settings allow the
display to filter which sources it will listen to for data. Every device
on a J1939 network will have a unique address (in the range
0-254) which the Engine Monitor can choose to listen to or not.
The Engine Monitor can listen to 2 sources of data simultaneously
(usually Engine 1 - address 0 and Transmission 1 - address
3). The filter can also be removed so that the Engine Monitor
will decode all incoming data regardless of its source. This is
accomplished by setting “Source Address 1” to 255.
page 23
10. System Sub-Menu - continued
Display Address: As mentioned previously, every device has a unique address and the
Engine Monitor is no different. In single engine setups the default display address is 40 (SAE
recommendation). If the Engine Monitor does not display all necessary data (which is supported)
please contact your engine manufacturer for advice on the value of this setting.
Alarm Filter: This setting specifies whether the Engine Monitor will monitor and display
alarms from all sources (GLB, global) or only the source address’ specified in the settings Source
Address 1 & 2 (SRC, source).
SPN version: Set the Suspect Parameter Number [Version 1, 2 or 3]. Version 4 is
automatically detected, but older engines will have to be set to 1, 2 or 3. Note. Consult your engine supplier to establish which SPN version is appropriate if you have
problems reading alarm data.
J1587 Settings: This screen allows adjustments specific
to the J1587 Datalink.
Source Address 1 & 2: J1587 supports source
addresses in the form of the MID (Message ID) and has values
defined from 128 (Engine 1) to 250 (Steering Column Unit) with
all other values reserved. 255 is a special case, it indicates all
data from all sources in its raw data form. Source Address 1
defaults to 128 and Source Address 2 defaults to 130.
Display Address: The display address allows values from 128-255.
Alarm Filter: This setting specifies whether the Engine Monitor will monitor and display
alarms from all sources (GLB, global) or only the source address’ specified in the settings
Source Address 1 & 2 (SRC, source).
page 24
10. System Sub-Menu - continued
Speed Source: There are currently 3 sources of speed data, which the Engine Monitor can
decode. The settings for this parameter are AUTO, NMEA, WHEEL, NAV and OFF. AUTO prioritises
the following sources (highest to lowest) NMEA, WHEEL (PGN 0xFEF1), NAV (PGN 0xFEF8). The
remaining settings force the Engine Monitor to listen only for that particular source (and OFF stops
the Engine Monitor listening to any source).
Pin Settings: By default this security feature is disabled within the software. By enabling this
feature the user will be prompted to enter a PIN every time the Configuration menu is entered.
This is to allow the unit’s settings to be preserved and not be accidentally
changed by an unauthorised user. To enable the PIN entry feature highlight
the corresponding setting in the PIN Setting’s menu and press key 4 to
select it. As an added security feature (to stop the pin being enabled
without knowing it) the current pin must be entered (default is “1111”).
Once this has been entered the feature will be enabled. It is possible
to change the pin using the Pin Change menu. This will then prompt
the user for the current pin and providing this is correct the Engine
Monitor will prompt the user for the new pin and finally confirmation of
the new pin.
About: Displays the following product information
ID: Serial number of the display
EEPROM: Number of writes on EEPROM
PART No: Unit part number
VERS: Software version number
CHK: Flash memory checksum
SOURCE: The source of received data
LIB1: Low level system library version
LIB2: Low level Graphical Display Interface library version (if used).
page 25
11. Pop-Up Messages and Warnings
Engine service warning. In the Configuration menu, users can set the engine service interval in
hours. When the Engine Monitor determines an engine service is due, it displays SERVICE REQUIRED
on the splash screen that appears at power-up.
Data communications failure. If the Engine Monitor cannot detect engine/transmission data
broadcasts, a pop-up window with a data communications failure warning icon will appear and
flash. Once engine/transmission data is detected the warning disappears and normal data display
resumes.
CAN TX disable. If CAN TX (transmission) is disabled, then the status will be displayed, with a
pop-up window flashing with a period of approximately 1 second on, 10 seconds off. Note. This
function is a requirement of the J1939 specification and is not normally of importance for the
Engine Monitor applications.
Data not supported. If the required data parameter is not available, the gauge will display
“ - - - “ near the units and parameter icon (see below centre for example)
Figure 9. Left to right. Pop-up warnings of: engine service required, a data communications failure, and
CAN TX is disabled.
page 26
12. Adjusting Lighting and Contrast
Pressing key 5 (the right-hand key) when the menu icons are not being displayed brings up the
lighting and contrast menu. The LCD has a number of back-lighting levels that allow the display
to be read in the dark. The appropriate level is selected by pressing keys 1 or 2 to decrease or
increase illumination. Contrast is adjusted in the same manner, using keys 3 and 4 (Figure 10).
Note. The Engine Monitor monitors the temperature of the LCD and automatically adjusts display
contrast as required, therefore it is not likely that a user will need to make a manual contrast
adjustment unless extreme climate changes occur. The menu is exited by pressing key 5. The
lighting and contrast settings are retained after the unit is switched off.
Note. Resetting contrast. If the contrast has been adjusted poorly, you may restore the
factory setting (a central value) by pressing keys 1 to 4 simultaneously. This action does
not change other user-configured settings.
Figure 10. The lighting and contrast adjust
screen, showing a contrast level adjustment
in progress.
page 27
13. Preferred Screen Store
The Engine Monitor automatically stores the current screen as a user’s preferred page, after a
delay of approximately 15 seconds (if no buttons are pushed). On next power-up the display will
start with the splash screen, and then go to the last stored screen. Note. Selecting Restore Defaults
on the Systems sub-menu of Configuration will set the main engine screen as the default display.
14. Keypad Lock
The Engine Monitor’s five keys can be locked, such that an operator cannot change any settings or
access any other display mode. (in a similar manner to the key lock functions on a mobile phone).
This is achieved by pressing and holding keys 1 and 5 simultaneously for one second. Repeating
this operation resets the Engine Monitor/CANtrak back to normal operation.
page 28
15. Connector Pin-Out
The Engine Monitor interfaces to data via the Deutsch DT0412PA connector on the rear of the
display - wired as shown. Kongsberg Automotive can supply 2 harnesses for this purpose:
A Power/CAN/Output* harness - Part No. 510623
A Power/CAN/GPS** harness - Part No. 510626
Alternatively, Kongsberg Automotive can supply the mating connector parts in kit form (Part No.
531006). Similarly you can source them from Deutsch (www.deutschecd.com):
DT0612SA, mating connector
W12S, wedgelock (one per connector)
0462-201-1631, pin sockets (note that different finishes and termination methods may be selected)
114017, sealing plug (one per unused pin location)
(*If supported by the hardware platform)
(**If supported by the software platform)
Note. A ferrite clamp must be placed over the harness to meet EMC radiated emission requirements
of BSEN60945 (Maritime navigation & radio communication equipment & systems). We recommend
that the clamp should be a TDK ZCAT2032-0930, a Multicomp 33RH17 5X28 5X10 7: core,
10.7MM ID or equivalent.
page 29
15. Connector Pin-Out - continued
Connector pin-out
6
1
7
12
Signal
1
Power -
2
Power +
3
TX (+)
4
TX (-)
5
RX (-)
6
RX (+)
7
CAN LO
(J1939 LO)
8
CAN HI
(J1939 HI)
9
RS485A
(J1587+)
10
RS485B
(J1587-)
11
Output
12
Not used
Notes
Ground & power (10-30V DC). Supply should be
protected by 500mA-rated circuit breaker/fuse
RS-232 serial port
CAN2.0B port
Serial port
Programmable digital output for activating alarm*
* Not available on all Engine Monitor models - refer to the datasheet for your display.
page 30
16. Typical J1939 Wiring Topology
Most Modern engine installations include a harness with built in J1939 backbone (Check engine
manufacturer’s documentation). If not, it is critical to use twisted shielded pair with a drain wire (max
length 40m) terminated with 120Ω resistors at each end. In addition, all stubs should not exceed
1m in length.
Termination
Resistor (120Ω)
CANtrak Display
Backbone
(Max length 40m)
Stub
(Max length 1m)
Engine and/or
Transmission
Termination
Resistor (120Ω)
page 31
17. Installation
Front mounting instructions. Most units will be mounted onto a bulkhead, dashboard or panel - a
method described below; the components required (4 x M4 studs and thumbnuts) are supplied with
every Engine Monitor.
Instructions:
• Decide on a location.
• Allow adequate clearance behind the display for cable connections, to ensure that the cables are
not unduly stressed, and for ventilation. Leave sufficient cable so that the unit may be removed for
servicing.
• Using the template supplied with the display as a guide, cut out the mounting hole, and drill four
ø4.3mm (0.170inch) holes for the M4 studs.
• Screw the studs into the rear case; longer studs can be used (not supplied).
• Connect the cable (not supplied). • Place the Engine Monitor in position, secure by screwing thumbnuts onto the studs.
The front mounting kit (M4 studs and
thumbnuts) supplied with the Engine
Monitor, which allows the display to be
mounted onto a panel or dashboard.
Warning. Take care not to over tighten
the studs/thumbnuts as this may damage
the unit.
page 32
17. Installation - continued
Front mounting template. A paper mounting template for marking drill holes etc, is supplied loose
with the Engine Monitor. After marking out,Kongsberg Automotive advises that dimensions are
verified by measurement, due to the limitations of the printing process. This is especially important if
the template has been photocopied.
Other mounting options
Rear mounting CANtrak 2600 and 2610 displays. Users can also mount most Engine Monitor’s
displays from the rear of a panel. Users can either fabricate their own mounting arrangements or
use Kongsberg Automotive’s Rear Mounting Bracket: Part Number 900061 (see datasheet at www.
www.kongsbergautomotive.com for details). Take the same precautions as when front mounting.
Contact Kongsberg Automotive if you require a mounting template.
Trunnion mounting
All Engine Monitor displays may,
optionally, be attached to a surface using
a Trunnion Mounting Bracket (see left).
A datasheet on this Kongsberg
Automotive Part (No. 930293) is
available via
www.kongsbergautomotive.com
page 33
18. Maintenance and Troubleshooting
No regular maintenance is required, except for cleaning the Engine Monitor lens as required
using a soft, damp cloth. Do not use abrasive materials or solvents, specifically white spirit, petrol
and acetone. Should any further attention be necessary, please contact your supplier. If you are
experiencing operating problems with the Engine Monitor, check these diagnostics:
Problem
Possible solution
Unit does not power up
Ensure connections to unit are correct.
Ensure power source is present.
Display is blank or black
Adjust/reset lighting and contrast settings.
Ensure temperature is within operating range of the unit.
Unit bleeps at start-up and does
not store settings
Unit has failed self-test. Contact your Engine Monitor
supplier
Unit fails to display any data
Ensure connections to unit are correct.
Ensure data source supports J1939 or J1587 message
protocol.
Unit fails to display certain
parameter(s)/unable to select
certain parameter(s)
Ensure the Engine Monitor supports required parameter(s)
Ensure data source provides required parameter(s).
Active alarm messages are not
displayed
Ensure data source provides alarm message data in the
following format: J1939 Active Diagnostic Trouble
Codes- Diagnostic Message 1 (DM1).
Stored alarm messages are not
displayed
Ensure data source provides alarm message data in the
following format: J1939 Active Diagnostic Trouble
Codes- Diagnostic Message 2 (DM2).
page 34
19. The CANtrak Platform
The Engine Monitor software runs on Kongsberg Automotive’ CANtrak LCD displays. These are
rugged 110x110mm DIN-format modules with 5 soft keys, and offer a 160 x 128 pixel display area.
This is large enough to provide great flexibility for managing the rich data available from modern
electronically controlled systems. CANtrak is now in its fourth generation: the latest CANtrak 2600
family employs design-for-manufacture techniques including chip-on-tab to minimise component
count and assembly operations. The CANtrak 2600 series of displays employ film supertwist
nematic LCDs for visibility in direct sunlight - with backlighting.
They offer a Deutsch connector interface to the network, and protection to IP67 which covers
immersion in water up to 1 meter. Units come with 3 serial interfaces: RS-232, RS-485, and a
CAN 2.0B port compatible with the J1939 protocol used by many manufacturers. There are 2
variants: CANtrak 2600 operates over a range of -25 to +75ºC; 2610 incorporates a heating
element, supporting automotive industry requirements of -40ºC. The CANtrak 2610 also includes a
programmable 500mA digital Output Driver. Datasheets via: www.kongsbergautomotive.com
page 35
20. Software Development Options for the CANtrak
Customers have a range of options for creating user interfaces on CANtrak:
Like a PC, a CANtrak needs application software to provide a useful function. The Engine Monitor
application software, written by Kongsberg Automotive, is just one example. CANtraks may be
programmed to perform an infinite number of display, control and data logging tasks. To help modify
existing software or write new application software Kongsberg Automotive has developed a software
development kit (SDK). This is available for programming the microcontroller used in CANtrak
- allowing complete control of the display hardware. Purchasers of a SDK and suitable compiler
are given a number of hours of free technical support from Kongsberg Automotive’s application
engineering team - which may be used to write some or all of the customer-specified application
software; alternatively the time may be used for training, trouble-shooting and advice.
As well as supplying and supporting the SDK, Kongsberg Automotive offers a fast-turnaround and
cost effective software development service for CANtraks using the same SDK. These projects
can range from something as simple as placing a customer’s logo on the splash screen, through
additional pages of data on a branded version of the Engine Monitor, to a full application with
custom user interfaces, control programs, communication protocols, etc.
If you would like to discuss the purchase of an SDK, or obtain a quote for custom application
software, please contact us. More information is available via www.kongsbergautomotive.com
page 36
21. Glossary
CAN
Controller Area Network (also referred to as CANbus); serial communications protocol for automotive use
CANtrak Intelligent CAN-compatible LCD display module
FMI Failure Mode Identifier
GPS
Global Positioning System
HMI
Human-Machine Interface
ISO International Standard Organisation
J1939
SAE engine data protocol using CAN 2.0B
J1587 Electronic Data Interchange between Microcomputer Systems in Heavy-Duty Vehicle
Applications
LCD
Liquid Crystal Display
NMEA
National Marine Electronics Association; serial communications protocol for
marine use
PID
Parameter Identifier
RS-232
Standard electrical interface for serial communications
RS-485
Standard differential electrical interface for serial communications
SAE
Society of Automotive Engineers Inc.
SID
Subsystem Identifier
Soft keys Push-button keys whose function changes according to use
SPN
Suspect Parameter Number: J1939-specific fault code ID number
Note. The messages, icons, error codes etc displayed by the Engine Monitor conform to
J1939 standards wherever possible. A copy of the relevant standards documents will be
important for developers - they may be accessed and purchased via:
www.sae.org/standardsdev/groundvehicle/j1939a.htm
page 37
22. Important Safety and Legal Information
Under no circumstances shall Kongsberg Automotive or any of its subsidiary companies accept
liability for any loss of data, income, incidental damage or consequential losses incurred as a result
of the use of the product howsoever caused when used as a monitor for electronically-controlled
engines/transmissions or other systems.
• Reproduction, transfer, distribution or storage of part or all of the contents in this document in
any form without written permission of Kongsberg Automotive is prohibited.
• Kongsberg Automotive operates a policy of continuous improvement. Kongsberg Automotive
reserves the right to alter and improve the CANtrak displays and the Engine Monitor software
without prior notice.
Liquid crystal safety. If the liquid crystal display (LCD) is broken, particular care must be taken with any leaking fluid. Urgent action must be taken:
• If the LCD fluid gets onto your skin wipe immediately with a suitable cloth and wash the area
well with mild soap and water.
• If the LCD fluid gets into your eye thoroughly rinse your eye with clean water for several minutes and then gain immediate medical assistance.
• If the LCD fluid is swallowed rinse your mouth thoroughly with clean water then drink a substantial
volume of water and make yourself vomit. Then gain immediate medical assistance.
CE EMC Directive 89/336/EE. This product has been designed to be compliant with this directive. Compliance can only be ensured by correct installation.
page 38
M a n u f a c t u r i n g an d E u r o p e a n S a les
Ma n ufa ctur in g & N orth Am eri can Sal es
Ch r i s t oph e r M a rti n R o a d ,
Ko ng sb erg A u t o mo t i ve
Bas
i l dfaon
90,
R u ec an S al es
M
anu
c t,u r i n g a n d E u ro p ea n S al es
No
rt h28e
A meri
Esse lxe,xMor s e E l ec tro n i c s ,
Grand
- Mère
) t ri c al,
Telef
Tel
efl exMo
rse(Qc
El ec
SS14
3 E S e r M a rti n R o a d ,
G9T 7E9
Chri
s t oph
6980
P ro fessi o nal P arkw ay East,
E n g ldaon
n d,
Basil
SCanad
araso taa,
Esse x ,
F l o ri d a,
Tel: 3+4
: 819-8414
533- 3201
SS14
E S4 ( 0 ) 1 2 6 8 5 2 2 8 6 1
FTel
L 34240Fax
+4
F ax:
En
gl:a n
d 4 (0)1268 282994
US
A 819- 533- 5317
Tel: +4 4 ( 0 ) 1 2 6 8 5 2 2 8 6 1
Tel : (001)941- 907- 1000
Ema +4
i l : 4c a(n0t)ra
Fax:
1 2k6. i8n f2o8@2k9a9- g
4 r o u p.com
F ax: (001)941- 907- 104 0
www. k on g s b e rga u to m o ti ve. c o m
R ese a rc h a n d D e v e l o p m en t
Telef l e xMor s e E l ec tro n i c s ,
G aun t s B u s i n es s C en tre,
G aun t s C omm o n ,
eu ro sal es@t el efl ex. c o m
Wim b or n e ,
www. c ant rak- i nt . c o m
D©Kongsberg
orse t ,
Automotive 2008. Specifications subject to change without notice.
BH
4JT
Any2 1
trademarks
used are recognised and are the property of their respective owners.
En gl a n d
Tel:
+4 4 ( 0806620
) 1 2 0 2 -8V3
85215
Part Number
Feb 2008
Fax:
+4 4 ( 0 ) 1 2 0 2 8 8 5 2 1 4