1
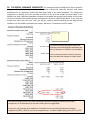
6. THE REGRESSION MODEL OUTPUT WORKSHEET: The regression results for each model are
stored on a new worksheet whose name is whatever model name was entered in the name box on the
regression input panel when the model was run (either a default name such as “Model n” or a custom
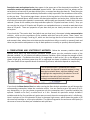
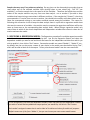
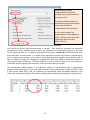
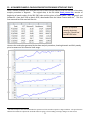
name of your choice). Here’s a picture of a portion of the regression output which appears at the top of
the model sheet for the regression of CASES_18PK on PRICE_18PK. More tables and charts are below it.
The results for each model are stored on a new worksheet. At the top, the usual regression summary table
appears. For a simple (1-variable) regression model, a line fit plot with confidence bands is included. Here the
estimated slope of the line is -93, suggesting that a $1 increase in price will lead to a 93 case decrease in sales.
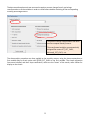
The confidence level in the upper right can be interactively adjusted and all statistics and charts on the sheet
will be instantly updated.
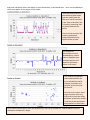
Every table and chart on the model sheet has a title that includes the model name, the dependent variable
name, and the sample size, allowing output to be traced to its source if it is copied to other documents.
11