1
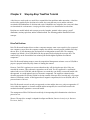
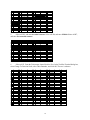
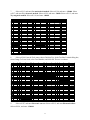
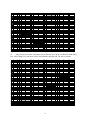
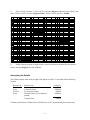
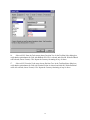
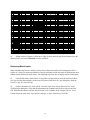
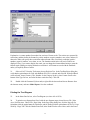
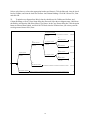
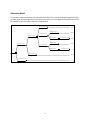
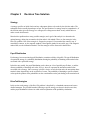
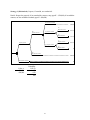
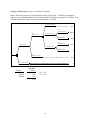
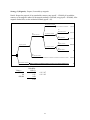
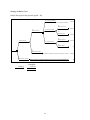
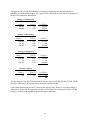
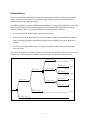
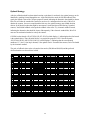
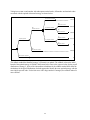
Decision Trees Using TreePlan Add-In for Microsoft Excel Contents Chapter 1 Quick Start........................................................................................2 TreePlan Installation.............................................................................................2 Occasional Use....................................................................................................2 Selective Use.......................................................................................................2 Steady Use..........................................................................................................2 Building a Decision Tree in TreePlan.....................................................................3 The Anatomy of a TreePlan Decision Tree............................................................5 Chapter 2 Step-by-Step TreePlan Tutorial ....................................................6 DriveTek Problem................................................................................................6 Nodes and Branches ............................................................................................7 Terminal Values...................................................................................................7 Building the Tree Diagram....................................................................................8 Interpreting the Results....................................................................................... 13 Formatting the Tree Diagram.............................................................................. 14 Displaying Model Inputs ..................................................................................... 16 Printing the Tree Diagram .................................................................................. 17 Alternative Model.............................................................................................. 19 Chapter 3 Decision Tree Solution.................................................................20 Strategy............................................................................................................. 20 Payoff Distribution ............................................................................................. 20 DriveTek Strategies ........................................................................................... 20 Strategy Choice ................................................................................................. 25 Certainty Equivalent ........................................................................................... 25 Rollback Method................................................................................................ 27 Optimal Strategy ................................................................................................ 28 Chapter 4 Sensitivity Analysis........................................................................30 One-Variable Sensitivity Analysis using an Excel data table .................................. 30 Two-Variable Sensitivity Analysis using an Excel data table .................................. 32 Chapter 1 Quick Start TreePlan is an Excel add-in that allows you to build decision trees in Excel. It was developed by Professor Michael R. Middleton at the University of San Francisco and modified for use at Fuqua (Duke) by Professor James E. Smith. TreePlan Installation All of TreePlan’s functionality is in a single file, TreePlan.xla. Depending on your preference, there are three ways to install TreePlan. (These instructions also apply to the other Decision ToolPak add-ins: SensIt.xla and RiskSim.xla.) Occasional Use If you plan to use TreePlan on an irregular basis, simply use Excel’s File | Open command to load TreePlan.xla each time you want to use it. You may keep the TreePlan.xla file on a floppy disk, your computer’s hard drive, or a network server. Selective Use You can use Excel’s Add-In Manager to install TreePlan. First, copy TreePlan.xla to a location on your computer’s hard drive. Second, if you save TreePlan.xla in the Excel or Office Library subdirectory, go to the third step. Otherwise, run Excel, choose Tools | Add-Ins; in the Add-Ins dialog box, click the Browse button, use the Browse dialog box to specify the location of TreePlan.xla, and click OK. Third, in the AddIns dialog box, note that TreePlan is now listed with a check mark, indicating that its menu command will appear in Excel, and click OK. If you plan to not use TreePlan and you want to free up main memory, uncheck the box for TreePlan in the Add-In Manager. When you do want to use TreePlan, choose Tools | Add-Ins and check TreePlan’s box. To remove TreePlan from the Add-In Manager, use Windows Explorer or another file manager to delete TreePlan.xla from the Library subdirectory or from the location you specified when you used the Add-In Manager’s Browse command. The next time you start Excel and choose Tools | Add-Ins, a dialog box will state “Cannot find add-in … treeplan.xla. Delete from list?” Click Yes. Steady Use If you want TreePlan’s options immediately available each time you run Excel, use Windows Explorer or another file manager to save TreePlan.xla in the Excel XLStart directory. Alternatively, in Excel you can use Tools | Options | General to specify an alternate startup file location and use a file manager to save TreePlan.xla there. When you start Excel, it tries to open all files in the XLStart directory and in the alternate startup file location. For additional information visit “TreePlan FAQ” at www.treeplan.com. 2 After opening TreePlan.xla in Excel, the command "Decision Tree" appears at the bottom of the Tools menu (or, if you have a customized main menu, at the bottom of the sixth main menu item). Building a Decision Tree in TreePlan You can start TreePlan either by choosing Tools | Decision Tree from the menu bar or by pressing Ctrl+t (hold down the Ctrl key and press t). If the worksheet doesn't have a decision tree, TreePlan prompts you with a dialog box with three options; choose New Tree to begin a new tree. TreePlan draws a default initial decision tree with its upper left corner at the selected cell. For example, the figure below shows the initial tree when $B$2 is selected. (Note that TreePlan writes over existing values in the spreadsheet: begin your tree to the right of the area where your data is stored, and do not subsequently add or delete rows or columns in the tree-diagram area.) In Excel 5 and 95 a terminal node is represented by a triangle instead of a vertical bar. A 1 2 3 4 5 6 7 8 9 10 11 B C D E F G H I Decision 1 0 0 0 1 0 Decision 2 0 0 0 Build up a tree by adding or modifying branches or nodes in the default tree. To change the branch labels or probabilities, click on the cell containing the label or probability and type the new label or probability. To modify the structure of the tree (e.g., add or delete branches or nodes in the tree), select the node or the cell containing the node in the tree to modify, and choose Tools | Decision Tree or press Ctrl+t. TreePlan will then present a dialog box showing the available commands. For example, to add an event node to the top branch of the tree shown above, select the square cell (cell G4) next to the vertical line at the end of a terminal branch and press Ctrl+t.. TreePlan then presents this dialog box. To add an event node to the branch, we change the selected terminal node to an event node by selecting Change to event node in the dialog box, selecting the number of branches (here two), and pressing OK. TreePlan then redraws the tree with a chance node in place of the terminal node. 3 A 1 2 3 4 5 6 7 8 9 10 11 12 13 14 15 16 B C D E F G H I J K L M 0.5 Event 3 0 Decision 1 0 0 0 0 0.5 Event 4 0 1 0 0 0 Decision 2 0 0 0 The dialog boxes presented by TreePlan vary depending on what you have selected when you choose Tools | Decision Tree or press Ctrl+t. The dialog box shown below is presented when you press Ctrl+t with an event node selected; a similar dialog box is presented when you select a decision node. If you want to add a branch to the selected node, choose Add branch and press OK. If you want to insert a decision or event node before the selected node, choose Insert decision or Insert event and press OK. To get a description of the available commands, click on the Help button. The Copy subtree command is particularly useful when building large trees. If two or more parts of the tree are similar, you can copy and paste "subtrees" rather than building up each part separately. To copy a subtree, select the node at the root of the subtree and choose Copy subtree. This tells TreePlan to copy the selected node and everything to the right of it in the tree. To paste this subtree, select a terminal node and choose Paste subtree. TreePlan then duplicates the specified subtree at the selected terminal node. Since TreePlan decision trees are built directly in Excel, you can use Excel's commands to format your tree. For example, you can use bold or italic fonts for branch labels: select the cells you want to format and change them using Excel's formatting commands. To help you, TreePlan provides a Select dialog box that appears when you choose Tools Decision Tree or press Ctrl+t without a node selected. You can also bring up this dialog box by pressing the Select button on the Node dialog box. From here, you can select all items of a particular type in the tree. For example, if you choose Probabilities and press OK, TreePlan selects all cells containing probabilities in the tree. You can then format all of the probabilities simultaneously using Excel's formatting commands. (Because of limitations in Excel, the Select dialog box will not be available when working with very large trees.) 4 The Anatomy of a TreePlan Decision Tree An example of a TreePlan decision tree is shown below. In the example, a firm must decide (1) whether to prepare a proposal for a possible contract and (2) which method to use to satisfy the contract. The tree consists of decision nodes, event nodes and terminal nodes connected by branches. Each branch is surrounded by cells containing formulas, cell references, or labels pertaining to that branch. You may edit the labels, probabilities, and partial cash flows associated with each branch. The partial cash flows are the amount the firm "gets paid" to go down that branch. Here, the firm pays $50,000 if it decides to prepare the proposal, receives $250,000 up front if awarded the contract, spends $50,000 to try the electronic method, and spends $120,000 on the mechanical method if the electronic method fails. PROBABILITIES: Enter numbers or formulas in these cells. DECISION NODES: TreePlan formula for which alternative is optimal. TERMINAL VALUES: TreePlan formula for sum of partial cash flows along path. Use mechanical method $80,000 PARTIAL CASH FLOWS: Enter numbers or formulas in these cells. 0.5 Awarded contract -$120,000 $80,000 2 $250,000 0.5 Electronic success $90,000 $150,000 Prepare proposal -$50,000 Try electronic method $0 -$50,000 0.5 Electronic failure $90,000 ROLLBACK EVs: TreePlan formula for expected value at this point in the tree. $20,000 $30,000 -$120,000 1 $20,000 BRANCH LABELS: Type text in these cells. 0.5 Not awarded contract $150,000 $30,000 EVENT NODES -$50,000 $0 -$50,000 TERMINAL NODES Don't prepare proposal $0 $0 $0 The trees are "solved" using formulas embedded in the spreadsheet. The terminal values sum all the partial cash flows along the path leading to that terminal node. The tree is then "rolled back" by computing expected values at event nodes and by maximizing at decision nodes; the rollback EVs appear next to each node and show the expected value at that point in the tree. The numbers in the decision nodes indicate which alternative is optimal for that decision. In the example, the "1" in the first decision node indicates that it is optimal to prepare the proposal, and the "2" in the second decision node indicates the firm should try the electronic method because that alternative leads to a higher expected value, $90,000, than the mechanical method, $80,000. TreePlan has a few options that control the way calculations are done in the tree. To select these options, press the Options button in any of TreePlan's dialog boxes. The first choice is whether to Use Expected Values or Use Exponential Utility Function for computing certainty equivalents. The default is to rollback the tree using expected values. If you choose to use exponential utilities, TreePlan will compute utilities of endpoint cash flows at the terminal nodes and compute expected utilities instead of expected values at event nodes. Expected utilities are calculated in the cell below the certainty equivalents. You may also choose to Maximize (profits) or Minimize (costs) at decision nodes; the default is to maximize profits. If you choose to minimize costs instead, the cash flows are interpreted as costs, and decisions are made by choosing the minimum expected value or certainty equivalent rather than the maximum. See the Help file for details on these options. 5 Chapter 2 Step-by-Step TreePlan Tutorial A decision tree can be used as a model for a sequential decision problems under uncertainty. A decision tree describes graphically the decisions to be made, the events that may occur, and the outcomes associated with combinations of decisions and events. Probabilities are assigned to the events, and values are determined for each outcome. A major goal of the analysis is to determine the best decisions. Decision tree models include such concepts as nodes, branches, terminal values, strategy, payoff distribution, certainty equivalent, and the rollback method. The following problem illustrates the basic concepts. DriveTek Problem DriveTek Research Institute discovers that a computer company wants a new tape drive for a proposed new computer system. Since the computer company does not have research people available to develop the new drive, it will subcontract the development to an independent research firm. The computer company has offered a fee of $250,000 for the best proposal for developing the new tape drive. The contract will go to the firm with the best technical plan and the highest reputation for technical competence. DriveTek Research Institute wants to enter the competition. Management estimates a cost of $50,000 to prepare a proposal with a fifty-fifty chance of winning the contract. However, DriveTek's engineers are not sure about how they will develop the tape drive if they are awarded the contract. Three alternative approaches can be tried. The first approach is a mechanical method with a cost of $120,000, and the engineers are certain they can develop a successful model with this approach. A second approach involves electronic components. The engineers estimate that the electronic approach will cost only $50,000 to develop a model of the tape drive, but with only a 50 percent chance of satisfactory results. A third approach uses magnetic components; this costs $80,000, with a 70 percent chance of success. DriveTek Research can work on only one approach at a time and has time to try only two approaches. If it tries either the magnetic or electronic method and the attempt fails, the second choice must be the mechanical method to guarantee a successful model. The management of DriveTek Research needs help in incorporating this information into a decision to proceed or not. [Source: The tape drive example is adapted from Spurr and Bonini, Statistical Analysis for Business Decisions, Irwin.] 6 Nodes and Branches Decision trees have three kinds of nodes and two kinds of branches. A decision node is a point where a choice must be made; it is shown as a square. The branches extending from a decision node are decision branches, each branch representing one of the possible alternatives or courses of action available at that point. The set of alternatives must be mutually exclusive (if one is chosen, the others cannot be chosen) and collectively exhaustive (all possible alternatives must be included in the set). There are two major decisions in the DriveTek problem. First, the company must decide whether or not to prepare a proposal. Second, if it prepares a proposal and is awarded the contract, it must decide which of the three approaches to try to satisfy the contract. An event node is a point where uncertainty is resolved (a point where the decision maker learns about the occurrence of an event). An event node, sometimes called a "chance node," is shown as a circle. The event set consists of the event branches extending from an event node, each branch representing one of the possible events that may occur at that point. The set of events must be mutually exclusive (if one occurs, the others cannot occur) and collectively exhaustive (all possible events must be included in the set). Each event is assigned a subjective probability; the sum of probabilities for the events in a set must equal one. The three sources of uncertainty in the DriveTek problem are: whether it is awarded the contract or not, whether the electronic approach succeeds or fails, and whether the magnetic approach succeeds or fails. In general, decision nodes and branches represent the controllable factors in a decision problem; event nodes and branches represent uncontrollable factors. Decision nodes and event nodes are arranged in order of subjective chronology. For example, the position of an event node corresponds to the time when the decision maker learns the outcome of the event (not necessarily when the event occurs). The third kind of node is a terminal node, representing the final result of a combination of decisions and events. Terminal nodes are the endpoints of a decision tree, shown as the end of a branch on hand-drawn diagrams and as a triangle on computer-generated diagrams. The following table shows the three kinds of nodes and two kinds of branches used to represent a decision tree. Type of Node Decision Event Terminal Written Symbol square circle endpoint Computer Symbol square circle triangle or bar 7 Node Successor decision branches event branches terminal value Terminal Values Each terminal node has an associated terminal value, sometimes called a payoff value, outcome value, or endpoint value. Each terminal value measures the result of a scenario: the sequence of decisions and events on a unique path leading from the initia l decision node to a specific terminal node. To determine the terminal value, one approach assigns a cash flow value to each decision branch and event branch and then sum the cash flow values on the branches leading to a terminal node to determine the terminal value. In the DriveTek problem, there are distinct cash flows associated with many of the decision and event branches. Some problems require a more elaborate value model to determine the terminal values. The following diagram shows the arrangement of branch names, probabilities, and cash flow values on an unsolved tree. Use mechanical method -$120,000 0.5 Electronic success 0.5 Awarded contract Try electronic method $0 -$50,000 0.5 Electronic failure $250,000 -$120,000 0.7 Magnetic success Prepare proposal Try magnetic method $0 -$80,000 0.3 Magnetic failure -$50,000 -$120,000 0.5 Not awarded contract $0 Don't prepare proposal $0 To build the decision tree, you use TreePlan’s dialog boxes to develop the structure. You enter a branch name, branch cash flow, and branch probability (for an event) in the cells above and below the left side of each branch. As you build the tree diagram, TreePlan enters formulas in other cells. 8 Building the Tree Diagram 1. Start with a new worksheet. (If no workbook is open, choose File | New. If a workbook is open, choose Insert | Worksheet.) 2. Select cell A1. From the Tools menu, choose Decision Tree. In the TreePlan New dialog box, click the New Tree button. A decision node with two branches appears. A 1 2 3 4 5 6 7 8 9 B C D E F G Decision 1 0 0 0 1 0 Decision 2 0 0 0 3. Do not type the quotation marks in the following instructions. Select cell D2, and enter Prepare proposal. Select cell D4, and enter –50000. Select cell D7, and enter Don't prepare proposal. A 1 2 3 4 5 6 7 8 9 B C D E F G Prepare proposal -50000 -50000 -50000 2 0 Don't prepare proposal 0 0 0 4. Select cell F3. From the Tools menu, choose Decision Tree. In the TreePlan Terminal dialog box, select Change To Event Node, select Two Branches, and click OK. The tree is redrawn. 9 A 1 2 3 4 5 6 7 8 9 10 11 12 13 14 B C D E F G H I J K 0.5 Event 3 -50000 Prepare proposal -50000 0 -50000 -50000 0.5 Event 4 -50000 2 0 -50000 0 Don't prepare proposal 0 0 0 5. Select cell H2, and enter Awarded contract. Select cell H4, and enter 250000. Select cell H7, and enter Not awarded contract. A 1 2 3 4 5 6 7 8 9 10 11 12 13 14 B C D E F G H I 0.5 Awarded contract J K 200000 Prepare proposal -50000 250000 75000 200000 0.5 Not awarded contract -50000 1 0 -50000 75000 Don't prepare proposal 0 0 0 6. Select cell J3. From the Tools menu, choose Decision Tree. In the TreePlan Terminal dialog box, select Change To Decision Node, select Three Branches, and click OK. The tree is redrawn. A 1 2 3 4 5 6 7 8 9 10 11 12 13 14 15 16 17 18 19 20 21 22 23 24 B C D E F G H I J K L M N O Decision 5 200000 0 0.5 Awarded contract 200000 Decision 6 1 250000 200000 Prepare proposal 200000 0 200000 Decision 7 200000 -50000 75000 0 200000 0.5 Not awarded contract 1 -50000 75000 0 -50000 Don't prepare proposal 0 0 0 10 7. Select cell L2, and enter Use mechanical method. Select cell L4, and enter –120000. Select cell L7, and enter Try electronic method. Select cell L9, and enter –50000. Select cell L12, and enter Try magnetic method. Select cell L14, and enter –80000. A 1 2 3 4 5 6 7 8 9 10 11 12 13 14 15 16 17 18 19 20 21 22 23 24 B C D E F G H I J K L M N O Use mechanical method 80000 -120000 0.5 Awarded contract 80000 Try electronic method 2 250000 150000 150000 -50000 Prepare proposal 150000 Try magnetic method 120000 -50000 50000 -80000 120000 0.5 Not awarded contract 1 -50000 50000 0 -50000 Don't prepare proposal 0 0 0 8. Select cell N8. From the Tools menu, choose Decision Tree. In the TreePlan Terminal dialog box, select Change To Event Node, select Two Branches, and click OK. The tree is redrawn. A 1 2 3 4 5 6 7 8 9 10 11 12 13 14 15 16 17 18 19 20 21 22 23 24 25 26 27 28 29 B C D E F G H I J K L M N O P Q R S Use mechanical method 80000 -120000 80000 0.5 Event 8 0.5 Awarded contract 150000 Try electronic method 0 150000 2 250000 150000 -50000 150000 0.5 Event 9 150000 0 150000 Prepare proposal -50000 50000 Try magnetic method 120000 -80000 120000 0.5 Not awarded contract 1 50000 -50000 0 -50000 Don't prepare proposal 0 0 0 9. Select cell P7, and enter Electronic success. Select cell P12, and enter Electronic failure . Select cell P14, and enter –120000. 11 A 1 2 3 4 5 6 7 8 9 10 11 12 13 14 15 16 17 18 19 20 21 22 23 24 25 26 27 28 29 B C D E F G H I J K L M N O P Q R S Use mechanical method 80000 -120000 80000 0.5 Electronic success 0.5 Awarded contract 150000 Try electronic method 0 150000 3 250000 120000 -50000 90000 0.5 Electronic failure 30000 -120000 30000 Prepare proposal -50000 35000 Try magnetic method 120000 -80000 120000 0.5 Not awarded contract 1 35000 -50000 0 -50000 Don't prepare proposal 0 0 0 10. Select cell N18. From the Tools menu, choose Decision Tree. In the TreePlan Terminal dialog box, select Change To Event Node, select Two Branches, and click OK. The tree is redrawn. A 1 2 3 4 5 6 7 8 9 10 11 12 13 14 15 16 17 18 19 20 21 22 23 24 25 26 27 28 29 30 31 32 33 34 B C D E F G H I J K L M N O P Q R S Use mechanical method 80000 -120000 80000 0.5 Electronic success 150000 0.5 Awarded contract Try electronic method 3 250000 -50000 90000 120000 0 150000 0.5 Electronic failure 30000 -120000 30000 0.5 Event 10 Prepare proposal 120000 Try magnetic method -50000 0 120000 35000 -80000 120000 0.5 Event 11 120000 0 1 120000 0.5 Not awarded contract 35000 -50000 0 -50000 Don't prepare proposal 0 0 0 12 11. Select cell P16, and enter .7. Select cell P17, and enter Magnetic success. Select cell P21, and enter .3. Select cell P22, and enter Magnetic failure . Select cell P24, and enter –120000. A 1 2 3 4 5 6 7 8 9 10 11 12 13 14 15 16 17 18 19 20 21 22 23 24 25 26 27 28 29 30 31 32 33 34 B C D E F G H I J K L M N O P Q R S Use mechanical method 80000 -120000 80000 0.5 Electronic success 150000 0.5 Awarded contract Try electronic method 2 250000 -50000 90000 90000 0 150000 0.5 Electronic failure 30000 -120000 30000 0.7 Magnetic success Prepare proposal 120000 Try magnetic method -50000 0 120000 20000 -80000 84000 0.3 Magnetic failure 0 -120000 1 0 0.5 Not awarded contract 20000 -50000 0 -50000 Don't prepare proposal 0 0 0 12. Double-click the sheet tab (or right-click the sheet tab and choose Rename from the shortcut menu), and enter Original. Save the workbook. Interpreting the Results The $30,000 terminal value on the far right of the diagram in cell S13 is associated with the following scenario: Branch Type Decision Event Decision Event Branch Name Prepare proposal Awarded contract Try electronic method Electronic failure (Use mechanical method) Terminal value Cash Flow –$50,000 $250,000 –$50,000 –$120,000 $30,000 TreePlan put the formula =SUM(P14,L11,H12,D20) into cell S13 for determining the terminal value. 13 Other formulas, called rollback formulas, are in cells below and to the left of each node. These formulas are used to determine the optimal choice at each decision node. In cell B26, a formula displays 1, indicating that the first branch is the optimal choice. Thus, the initial choice is to prepare the proposal. In cell J11, a formula displays 2, indicating that the second branch (numbered 1, 2, and 3, from top to bottom) is the optimal choice. If awarded the contract, DriveTek should try the electronic method. A subsequent chapter provides more details about interpretation. Formatting the Tree Diagram The following steps show how to use TreePlan and Excel features to format the tree diagram. You may choose to use other formats for your own tree diagrams. 13. From the Edit menu, choose Move or Copy Sheet (or right-click the sheet tab and choose Move Or Copy from the shortcut menu). In the lower left corner of the Move Or Copy dialog box, check the Create A Copy box, and click OK. 14. On sheet Original (2), select cell H9. From the Tools menu, choose Decision Tree. In the TreePlan Select dialog box, verify that the option button for Cells with Probabilities is selected, and click OK. With all probability cells selected, click the Align Left button. 15. Select cell H12. From the Tools menu, choose Decision Tree. In the TreePlan Select dialog box, verify that the option button for Cells with Partial Cash Flows is selected, and click OK. With all partial cash flow cells selected, click the Align Left button. With those cells still selected, choose Format | Cells. In the Format Cells dialog box, click the Number tab. In the Category list box, choose Currency; type 0 (zero) for Decimal Places; select $ in the Symbol list box; select -$1,234 for Negative Numbers. Click OK. 14 16. Select cell I12. From the Tools menu, choose Decision Tree. In the TreePlan Select dialog box, verify that the option button for Cells with Rollback EVs/CEs is selected, and click OK. With all rollback cells selected, choose Format | Cells. Repeat the Currency formatting of step 16 above. 17. Select cell S3. From the Tools menu, choose Decision Tree. In the TreePlan Select dialog box, verify that the option button for Cells with Terminal Values is selected, and click OK. With all terminal value cells selected, choose Format | Cells. Repeat the Currency formatting of step 16 above. 15 A 1 2 3 4 5 6 7 8 9 10 11 12 13 14 15 16 17 18 19 20 21 22 23 24 25 26 27 28 29 30 31 32 33 34 B C D E F G H I J K L M N O P Q R S Use mechanical method $80,000 -$120,000 $80,000 0.5 Electronic success $150,000 0.5 Awarded contract 2 $250,000 Try electronic method $0 -$50,000 0.5 Electronic failure $90,000 $90,000 $150,000 $30,000 -$120,000 $30,000 0.7 Magnetic success Prepare proposal -$50,000 $120,000 Try magnetic method $0 $120,000 -$80,000 0.3 Magnetic failure $20,000 $84,000 $0 -$120,000 1 $0 0.5 Not awarded contract $20,000 -$50,000 $0 -$50,000 Don't prepare proposal $0 $0 $0 18. Double-click the Original (2) sheet tab (or right-click the sheet tab and choose Rename from the shortcut menu), and enter Formatted. Save the workbook. Displaying Model Inputs When you build a decision tree model, you may want to discuss the model and its assumptions with coworkers or a client. For such communication it may be preferable to hide the results of formulas that show rollback values and decision node choices. The following steps show how to display only the model inputs. 19. From the Edit menu, choose Move or Copy Sheet (or right-click the sheet tab and choose Move Or Copy from the shortcut menu). In the lower left corner of the Move Or Copy dialog box, check the Create A Copy box, and click OK. 20. On sheet Formatted (2), select cell B1. From the Tools menu, choose Decision Tree. In the TreePlan Select dialog box, verify that the option button for Columns with Nodes is selected, and click OK. With all node columns selected, choose Format | Cells | Number. In the Category list box, select Custom. Select the entry in the Type edit box, and type ;;; (three semicolons). Click OK. 16 Explanation: A custom number format has four sections of format codes. The sections are separated by semicolons, and they define the formats for positive numbers, negative numbers, zero values, and text, in that order. When you specify three semicolons without format codes, Excel does not display positive numbers, negative numbers, zero values, or text. The formula remains in the cell, but its result is not displayed. Later, if you want to display the result, you can change the format without having to enter the formula again. Editing an existing format does not delete it. All formats are saved with the workbook unless you explicitly delete a format. 21. Select cell A27. From the Tools menu, choose Decision Tree. In the TreePlan Select dialog box, verify that the option button for Cells with Rollback EVs/CEs is selected, and click OK. With all rollback values selected, choose Format | Cells | Number. In the Category list box, select Custom. Scroll to the bottom of the Type list box, and select the three-semicolon entry. Click OK. 22. Double-click the Formatted (2) sheet tab (or right-click the sheet tab and choose Rename from the shortcut menu), and enter Model Inputs. Save the workbook. Printing the Tree Diagram 23. In the Name Box list box, select TreeDiagram (or select cells A1:S34). 24. To print the tree diagram from Excel, with the tree diagram range selected choose File | Print Area | Set Print Area. Choose File | Page Setup. In the Page Setup dialog box, click the Page tab; for Orientation click the option button for Landscape, and for Scaling click the option button for Fit To 1 Page Wide By 1 Page Tall. Click the Header/Footer tab; in the Header list box select None, and in the Footer 17 list box select None (or select other appropriate headers and footers). Click the Sheet tab; clear the check box for Gridlines, and clear the check box for Row And Column Headings. Click OK. Choose File | Print and click OK. 25. To print the tree diagram from Word, clear the check boxes for Gridlines and for Row And Column Headings on Excel’s Page Setup dialog box Sheet tab. Select the tree diagram range. Hold down the Shift key and from the Edit menu choose Copy Picture. In the Copy Picture dialog box, click the option button As Shown When Printed, and click OK. In Word select the location where you want to paste the tree diagram and choose Edit | Paste. Use mechanical method $80,000 -$120,000 0.5 Electronic success $150,000 0.5 Awarded contract Try electronic method $0 -$50,000 0.5 Electronic failure $250,000 $30,000 -$120,000 0.7 Magnetic success Prepare proposal $120,000 Try magnetic method $0 -$80,000 0.3 Magnetic failure -$50,000 $0 -$120,000 0.5 Not awarded contract -$50,000 $0 Don't prepare proposal $0 $0 18 Alternative Model If you want to emphasize that the time constraint forces DriveTek to use the mechanical approach if they try either of the uncertain approaches and experience a failure, you can change the terminal nodes in cells R13 and R23 to decision nodes, each with a single branch. Use mechanical method $80,000 -$120,000 0.5 Electronic success $150,000 0.5 Awarded contract Try electronic method $0 -$50,000 0.5 Electronic failure Use mechanical method $0 -$120,000 $250,000 $30,000 0.7 Magnetic success Prepare proposal $120,000 Try magnetic method $0 -$80,000 0.3 Magnetic failure Use mechanical method $0 -$120,000 -$50,000 $0 0.5 Not awarded contract -$50,000 $0 Don't prepare proposal $0 $0 19 Chapter 3 Decision Tree Solution Strategy A strategy specifies an initial choice and any subsequent choices to be made by the decision maker. The subsequent choices usually depend upon events. The specification of a strategy must be comprehensive; if the decision maker gives the strategy to a colleague, the colleague must know exactly which choice to make at each decision node. Most decision problems have many possible strategies, and a goal of the analysis is to determine the optimal strategy, taking into account the decision maker's risk attitude. There are four strategies in the DriveTek problem. One of the strategies is: Prepare the proposal; if not awarded the contract, stop; if awarded the contract, try the magnetic method; if the magnetic method is successful, stop; if the magnetic method fails, use the mechanical method. The four strategies will be discussed in detail below. Payoff Distribution Each strategy has an associated payoff distribution, sometimes called a risk profile. The payoff distribution of a particular strategy is a probability distribution showing the probability of obtaining each terminal value associated with a particular strategy. In decision tree models, the payoff distribution can be shown as a list of possible payoff values, x, and the discrete probability of obtaining each value, P(X=x), where X represents the uncertain terminal value associated with a strategy. Since a strategy specifies a choice at each decision node, the uncertainty about terminal values depends only on the occurrence of events. The probability of obtaining a specific terminal value equals the product of the probabilities on the event branches on the path leading to the terminal node. DriveTek Strategies In this section each strategy of the DriveTek problem is described by a shorthand statement and a more detailed statement. The possible branches following a specific strategy are shown in decision tree form, and the payoff distribution is shown in a table with an explanation of the probability calculations. 20 Strategy 1 (Mechanical): Prepare; if awarded, use mechanical. Details: Prepare the proposal; if not awarded the contract, stop (payoff = -$50,000); if awarded the contract, use the mechanical method (payoff = $80,000). Use mechanical method $80,000 0.5 Electronic success $150,000 0.5 Awarded contract Try electronic method 0.5 Electronic failure $30,000 0.7 Magnetic success Prepare proposal $120,000 Try magnetic method 0.3 Magnetic failure $0 0.5 Not awarded contract -$50,000 Don't prepare proposal $0 Value, x $80,000 -$50,000 Probability P(X=x) 0.50 0.50 1.00 21 Strategy 2 (Electronic): Prepare; if awarded, try electronic. Details: Prepare the proposal; if not awarded the contract, stop (payoff = -$50,000); if awarded the contract, try the electronic method; if the electronic method is successful, stop (payoff = $150,000); if the electronic method fails, use the mechanical method (payoff = $30,000). Use mechanical method $80,000 0.5 Electronic success $150,000 0.5 Awarded contract Try electronic method 0.5 Electronic failure $30,000 0.7 Magnetic success Prepare proposal $120,000 Try magnetic method 0.3 Magnetic failure $0 0.5 Not awarded contract -$50,000 Don't prepare proposal $0 Value, x $150,000 $30,000 -$50,000 Probability P(X=x) 0.25 0.25 0.50 1.00 = 0.5 * 0.5 = 0.5 * 0.5 22 Strategy 3 (Magnetic): Prepare; if awarded, try magnetic. Details: Prepare the proposal; if not awarded the contract, stop (payoff = -$50,000); if awarded the contract, try the magnetic method; if the magnetic method is successful, stop (payoff = $120,000); if the magnetic method fails, use the mechanical method (payoff = $0). Use mechanical method $80,000 0.5 Electronic success $150,000 0.5 Awarded contract Try electronic method 0.5 Electronic failure $30,000 0.7 Magnetic success Prepare proposal $120,000 Try magnetic method 0.3 Magnetic failure $0 0.5 Not awarded contract -$50,000 Don't prepare proposal $0 Value, x $120,000 $0 -$50,000 Probability P(X=x) 0.35 0.15 0.50 1.00 = 0.5 * 0.7 = 0.5 * 0.3 23 Strategy 4 (Don't): Don't. Details: Don't prepare the proposal (payoff = $0). Use mechanical method $80,000 0.5 Electronic success $150,000 0.5 Awarded contract Try electronic method 0.5 Electronic failure $30,000 0.7 Magnetic success Prepare proposal $120,000 Try magnetic method 0.3 Magnetic failure $0 0.5 Not awarded contract -$50,000 Don't prepare proposal $0 Value, x $0 Probability P(X=x) 1.00 1.00 24 Strategy Choice Since each strategy can be characterized completely by its payoff distribution, selecting the best strategy becomes a problem of choosing the best payoff distribution. One approach is to make a choice by direct comparison of the payoff distributions. Strategy 1 (Mechanical) Probability Value, x P(X=x) $80,000 0.50 -$50,000 0.50 1.00 Strategy 2 (Electronic) Probability Value, x P(X=x) $150,000 0.25 $30,000 0.25 -$50,000 0.50 1.00 Strategy 3 (Magnetic) Probability Value, x P(X=x) $120,000 0.35 $0 0.15 -$50,000 0.50 1.00 Strategy 4 (Don't) Probability Value, x P(X=x) $0 1.00 1.00 Another approach for making choices involves certainty equivalents. Certainty Equivalent A certainty equivalent is a certain payoff value which is equivalent, for the decision maker, to a particular payoff distribution. If the decision maker can determine his or her certainty equivalent for the payoff distribution of each strategy, then the optimal strategy is the one with the highest certainty equivalent. The certainty equivalent is the minimum selling price for a payoff distribution; it depends on the decision maker's personal attitude toward risk. A decision maker may be risk preferring, risk neutral, or risk avoiding. If the terminal values are not regarded as extreme (relative to the decision maker's total assets), if the decision maker will encounter other decision problems with similar payoffs, and if the decision maker has the attitude that he or she will "win some and lose some," then the decision maker's attitude toward risk may be described as risk neutral. If the decision maker is risk neutral, the expected value is the appropriate certainty equivalent for choosing among the strategies. Thus, for a risk neutral decision maker, the optimal strategy is the one with the highest expected value. 25 The expected value of a payoff distribution is calculated by multiplying each terminal value by its probability and summing the products. The expected value calculations for each of the four strategies of the DriveTek problem are shown below. Strategy 1 (Mechanical) Probability Value, x P(X=x) $80,000 0.50 -$50,000 0.50 Strategy 2 (Electronic) Probability Value, x P(X=x) $150,000 0.25 $30,000 0.25 -$50,000 0.50 Strategy 3 (Magnetic) Probability Value, x P(X=x) $120,000 0.35 $0 0.15 -$50,000 0.50 Strategy 4 (Don't) Probability Value, x P(X=x) $0 1.00 x * P(X=x) $40,000 -$25,000 $15,000 x * P(X=x) $37,500 7,500 -$25,000 $20,000 x * P(X=x) $42,000 $0 -$25,000 $17,000 x * P(X=x) $0 $0 The four strategies of the DriveTek problem have expected values of $15,000, $20,000, $17,000, and $0. Strategy 2 (Electronic) is the optimal strategy with expected value $20,000. A risk neutral decision maker's choice is based on the expected value. However, note that if strategy 2 (Electronic) is chosen, the decision maker does not receive $20,000. The actual payoff will be $150,000, $30,000, or -$50,000, with probabilities shown in the payoff distribution. 26 Rollback Method If we have a method for determining certainty equivalents (expected values for a risk neutral decision maker), we don't need to examine every possible strategy explicitly. Instead, the method known as rollback determines the single best strategy. The rollback algorithm, sometimes called backward induction or "average out and fold back," starts at the terminal nodes of the tree and works backward to the initial decision node, determining the certainty equivalent rollback values for each node. Rollback values are determined as follows: • At a terminal node, the rollback value equals the terminal value. • At an event node, the rollback value for a risk neutral decision maker is determined using expected value; the branch probability is multiplied times the successor rollback value, and the products are summed. • At a decision node, the rollback value is set equal to the highest rollback value on the immediate successor nodes. In TreePlan tree diagrams the rollback values are located to the left and below each decision, event, and terminal node. Terminal values and rollback values for the DriveTek problem are shown below. Use mechanical method $80,000 $80,000 0.5 Electronic success $150,000 0.5 Awarded contract Try electronic method $90,000 $90,000 $150,000 0.5 Electronic failure $30,000 $30,000 0.7 Magnetic success Prepare proposal $120,000 Try magnetic method $120,000 $20,000 $84,000 0.3 Magnetic failure $0 $0 0.5 Not awarded contract $20,000 -$50,000 -$50,000 Don't prepare proposal $0 $0 27 Optimal Strategy After the rollback method has determined certainty equivalents for each node, the optimal strategy can be identified by working forward through the tree. At the initial decision node, the $20,000 rollback value equals the rollback value of the "Prepare proposal" branch, indicating the alternative that should be chosen. DriveTek will either be awarded the contract or not; there is a subsequent decision only if DriveTek obtains the contract. (In a more complicated decision tree, the optimal strategy must include decision choices for all decision nodes that might be encountered.) At the decision node following "Awarded contract," the $90,000 rollback value equals the rollback value of the "Try electronic method" branch, indicating the alternative that should be chosen. Subsequently, if the electronic method fails, DriveTek must use the mechanical method to satisfy the contract. Cell B26 has the formula =IF(A27=E20,1,IF(A27=E34,2)) which displays 1, indicating that the first branch is the optimal choice. Thus, the initial choice is to prepare the proposal. Cell J11 has the formula =IF(I12=M4,1,IF(I12=M11,2,IF(I12=M21,3))) which displays 2, indicating that the second branch (numbered 1, 2, and 3, from top to bottom) is the optimal choice. If awarded the contract, DriveTek should try the electronic method. The pairs of rollback values at the relevant decision nodes ($20,000 and $90,000) and the preferred decision branches are shown below in bold. A 1 2 3 4 5 6 7 8 9 10 11 12 13 14 15 16 17 18 19 20 21 22 23 24 25 26 27 28 29 30 31 32 33 34 B C D E F G H I J K L M N O P Q R S Use mechanical method $80,000 $80,000 0.5 Electronic success $150,000 0.5 Awarded contract Try electronic method 2 $90,000 $90,000 $150,000 0.5 Electronic failure $30,000 $30,000 0.7 Magnetic success Prepare proposal $120,000 Try magnetic method $120,000 $20,000 $84,000 0.3 Magnetic failure $0 $0 1 0.5 Not awarded contract $20,000 -$50,000 -$50,000 Don't prepare proposal $0 $0 28 Taking into account event branches with subsequent terminal nodes, all branches and terminal values associated with the optimal risk neutral strategy are shown below. Use mechanical method $80,000 0.5 Electronic success $150,000 0.5 Awarded contract Try electronic method 0.5 Electronic failure $30,000 0.7 Magnetic success Prepare proposal $120,000 Try magnetic method 0.3 Magnetic failure $0 0.5 Not awarded contract -$50,000 Don't prepare proposal $0 The rollback method has identified strategy 2 (Electronic) as optimal. The rollback value on the initial branch of the optimal strategy is $20,000, which must be the same as the expected value for the payoff distribution of strategy 2. Some of the intermediate calculations for the rollback method differ from the calculations for the payoff distributions, but both approaches identify the same optimal strategy with the same initial expected value. For decision trees with a large number of strategies, the rollback method is more efficient. 29 Chapter 4 Sensitivity Analysis One-Variable Sensitivity Analysis using an Excel data table 1. Construct a decision tree model or financial planning model. 2. Identify the model input cell (H1) and model output cell (A10). 3. Modify the model so that probabilities will always sum to one. (That is, enter the formula =1-H1 in cell H6.) A 1 2 3 4 5 6 7 8 9 10 11 12 13 14 B C D E F G H I J K L 0.6 High sales Model Input Cell +$300 Introduce product -$300 +$600 +$100 +$300 =1-H1 0.4 Low sales -$200 1 +$100 -$200 +$100 Model Output Cell Don't introduce $0 $0 $0 4. Enter a list of input values in a column (N3:N13). 5. Enter a formula for determining output values at the top of an empty column on the right of the input values (=A10 in cell O2). 6. Select the data table range (N2:O13). 7. From the Data menu choose the Table command. M 1 2 3 4 5 6 7 8 9 10 11 12 13 14 N O +$100 P =A10 0.00 0.10 0.20 0.30 0.40 0.50 0.60 0.70 0.80 0.90 1.00 30 8. In the Data Table dialog box, select the Column Input Cell edit box. Type the model input cell (H1), or point to the model input cell (in which case the edit box displays $H$1). Click OK. 9. The Data Table command substitutes each input value into the model input cell, recalculates the worksheet, and displays the corresponding model output value in the table. 10. Optional: Change the formula in cell O2 to =CHOOSE(B9,”Introduce”,”Don’t”). M 1 2 3 4 5 6 7 8 9 10 11 12 13 14 N O P(High Sales) Exp. Value 0.00 0.10 0.20 0.30 0.40 0.50 0.60 0.70 0.80 0.90 1.00 P 0 0 0 0 0 50 100 150 200 250 300 31 Two-Variable Sensitivity Analysis using an Excel data table Strategy Region Table A 1 2 3 4 5 6 7 8 9 10 11 12 13 14 15 16 17 18 19 20 21 22 23 24 25 26 27 28 29 30 31 32 33 34 B C D E F G H I J K L M N O P Q R S Use mechanical method +$80,000 -$120,000 +$80,000 0.50 Electronic success +$150,000 0.50 Awarded contract 2 +$250,000 Try electronic method $0 -$50,000 0.50 Electronic failure +$90,000 +$90,000 +$150,000 +$30,000 -$120,000 +$30,000 0.70 Magnetic success Prepare proposal -$50,000 +$120,000 Try magnetic method $0 +$120,000 -$80,000 0.30 Magnetic failure +$20,000 +$84,000 $0 -$120,000 1 $0 0.50 Not awarded contract +$20,000 -$50,000 $0 -$50,000 Don't prepare proposal $0 $0 $0 Optional: Activate the Base Case worksheet. From the Edit menu, choose Move Or Copy Sheet. In the Move Or Copy dialog box, check the box for Create A Copy, and click OK. Double -click the new worksheet tab and enter Strategy Region Table . Setup for Data Table Select cell P11, and enter the formula =1–P6. Select cell P21, and enter the formula =1–P16. In cell U3 enter P(Elec OK). In cell V3 enter 1, and in cell V4 enter 0.9. Select cells V3:V4. In the lower right corner of cell V4, click the fill handle and drag down to cell V13. With cells V3:V13 still selected, click the Increase Decimal button once so that all values are displayed with one decimal place. Select columns V:AG. (Select column V. Click and drag the horizontal scroll bar until column AG is visible. Hold down the Shift key and click column AG.) From the Format menu choose Column | Width. In the Column Width edit box type 5 and click OK. In cell W1 enter P(Mag OK). In cell W2 enter 0 (zero), and in cell X2 enter 0.1. Select cells W2:X2. In the lower right corner of cell X2, click the fill handle and drag right to cell AG2. With cells W2: AG2 still selected, click the Increase Decimal button once so that all values are displayed with one decimal place. Select cell V2 and enter the formula =CHOOSE(J11,"Mech","Elec","Mag"). With the base case assumptions the formula shows Elec. 32 U 1 2 3 P(Elec OK) 4 5 6 7 8 9 10 11 12 13 V W X P(Mag OK) Elec 0.0 0.1 1.0 0.9 0.8 0.7 0.6 0.5 0.4 0.3 0.2 0.1 0.0 Y Z 0.2 0.3 AA AB 0.4 AC 0.5 0.6 AD 0.7 AE 0.8 AF 0.9 AG 1.0 Obtaining Results Using Data Table Command Select the entire data table, cells V2:AG13. From the Data menu, choose Table. In the Table dialog box, type P16 in the Row Input Cell edit box, type P6 in the Column Input Cell edit box, and click OK. With cells V2:AG13 still selected, click the Align Right button. U 1 2 3 P(Elec OK) 4 5 6 7 8 9 10 11 12 13 V Elec 1.0 0.9 0.8 0.7 0.6 0.5 0.4 0.3 0.2 0.1 0.0 W P(Mag 0.0 Elec Elec Elec Elec Elec Elec Mech Mech Mech Mech Mech X OK) 0.1 Elec Elec Elec Elec Elec Elec Mech Mech Mech Mech Mech Y Z AA AB AC 0.2 Elec Elec Elec Elec Elec Elec Mech Mech Mech Mech Mech 0.3 Elec Elec Elec Elec Elec Elec Mech Mech Mech Mech Mech 0.4 Elec Elec Elec Elec Elec Elec Mech Mech Mech Mech Mech 0.5 Elec Elec Elec Elec Elec Elec Mech Mech Mech Mech Mech 0.6 Elec Elec Elec Elec Elec Elec Mech Mech Mech Mech Mech AD AE AF AG 0.7 Elec Elec Elec Elec Elec Elec Mag Mag Mag Mag Mag 0.8 Elec Elec Elec Elec Elec Mag Mag Mag Mag Mag Mag 0.9 Elec Elec Elec Elec Mag Mag Mag Mag Mag Mag Mag 1.0 Elec Elec Elec Mag Mag Mag Mag Mag Mag Mag Mag Embellishments Select cells U1:AG13, and click the Copy button. Select cell AI1, right-click, and from the shortcut menu choose Paste Special. In the Paste Special dialog box, click the Values option button, and click OK. Rightclick again, choose Paste Special, click the Formats option button, and click OK. Select columns AJ:AU. Choose Format | Cells | Width, type 5, and click OK. Select cell AJ2, right-click, and from the shortcut menu choose Clear Contents. Select cells AK2:AU2, move the cursor near the border of the selection until it becomes an arrow, click and drag the selection down to cells AK14:AU14. Similarly, select cell AK1 and move its contents down to cell AP15. Also, move the contents of cell AI3 to cell AI8. Select cell AN1, and enter Strategy Region Table . 33 AI 1 2 3 4 5 6 7 8 P(Elec OK) 9 10 11 12 13 14 15 AJ 1.0 0.9 0.8 0.7 0.6 0.5 0.4 0.3 0.2 0.1 0.0 AK AL AM Elec Elec Elec Elec Elec Elec Mech Mech Mech Mech Mech 0.0 Elec Elec Elec Elec Elec Elec Mech Mech Mech Mech Mech 0.1 Elec Elec Elec Elec Elec Elec Mech Mech Mech Mech Mech 0.2 AN AO AP AQ Strategy Region Table Elec Elec Elec Elec Elec Elec Mech Mech Mech Mech Mech 0.3 Elec Elec Elec Elec Elec Elec Mech Mech Mech Mech Mech 0.4 Elec Elec Elec Elec Elec Elec Mech Mech Mech Mech Mech 0.5 P(Mag Elec Elec Elec Elec Elec Elec Mech Mech Mech Mech Mech 0.6 OK) AR AS AT AU Elec Elec Elec Elec Elec Elec Mag Mag Mag Mag Mag 0.7 Elec Elec Elec Elec Elec Mag Mag Mag Mag Mag Mag 0.8 Elec Elec Elec Elec Mag Mag Mag Mag Mag Mag Mag 0.9 Elec Elec Elec Mag Mag Mag Mag Mag Mag Mag Mag 1.0 Apply borders to appropriate ranges and cells to show the strategy regions. Apply shading to cell AR8 to show the base case strategy. AI 1 2 3 4 5 6 7 8 P(Elec OK) 9 10 11 12 13 14 15 AJ 1.0 0.9 0.8 0.7 0.6 0.5 0.4 0.3 0.2 0.1 0.0 AK AL AM Elec Elec Elec Elec Elec Elec Mech Mech Mech Mech Mech 0.0 Elec Elec Elec Elec Elec Elec Mech Mech Mech Mech Mech 0.1 Elec Elec Elec Elec Elec Elec Mech Mech Mech Mech Mech 0.2 AN AO AP AQ Strategy Region Table Elec Elec Elec Elec Elec Elec Mech Mech Mech Mech Mech 0.3 Elec Elec Elec Elec Elec Elec Mech Mech Mech Mech Mech 0.4 Elec Elec Elec Elec Elec Elec Mech Mech Mech Mech Mech 0.5 P(Mag Copyright 2001 by Michael R. Middleton Elec Elec Elec Elec Elec Elec Mech Mech Mech Mech Mech 0.6 OK) AR AS AT AU Elec Elec Elec Elec Elec Elec Mag Mag Mag Mag Mag 0.7 Elec Elec Elec Elec Elec Mag Mag Mag Mag Mag Mag 0.8 Elec Elec Elec Elec Mag Mag Mag Mag Mag Mag Mag 0.9 Elec Elec Elec Mag Mag Mag Mag Mag Mag Mag Mag 1.0 Michael R. Middleton, Ph.D. Professor of Decision Sciences School of Business and Management University of San Francisco 2130 Fulton Street San Francisco, CA 94117-1045 Email: [email protected] Web Site: http://www.usfca.edu/~middleton Decision Support Services 2105 Buchanan Street, #1 San Francisco, CA 94115-2339 Email: [email protected] Web Site: http://www.treeplan.com 34