1
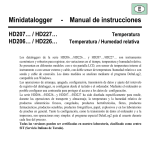
Minidatalogger – HD207… / HD227… HD206… / HD226… Instructions Manual Temperature Temperature / Relative Humidity HD206…/HD226… and HD207…/HD227… series dataloggers are low-cost, rugged instruments for a long-term reliable monitoring of temperature and temperature/relative humidity measurements. They are available in different versions: with or without LCD display, with sensors either inside or outside the instrument housing, or with cable connection. The analysis of logged data is made using Delta Log2 software for Windows. The datalogger functions of Start, Stop, Configuration, Data Download and Setting of logging interval are selectable either from keyboard or from a computer. Through a computer, you can define a password to enable the access to configuration data. Typical applications are: monitoring of temperature/humidity during transportation, storage of fresh or frozen foods, fruit, vegetable products and flowers, pharmaceuticals, sensitive and photographic products, paper, explosives, as well as laboratory activities in general. Configuration and data download to a PC or to a printer are very easy: DeltaLog2 dedicated software guides the operator step by step. SIT calibration certificates are available on all versions. HD207 and HD227 dataloggers with sensor inside the instrument housing are compliant to the European Standard EN 12830:1999 (S, T, C, D, 1) if operated in conjunction with the DeltaLog2 application software from version 2.5. 52 36 External temperature sensor Keyboard c o v e r 88 Display Socket for RSR232C or for external probes 2 9 Temperature or temperature/ h u m i d i t y external sensor/s Built-in temperature sensor 16 5 Description HD207 HD207-1 HD206-1 HD206-2 1 1 -199.9 2 3 6 7 2 3 4 5 8 9 4 5 1) 2) 3) 4) 5) 6) 7) 8) HD226... HD227... -199.9 16 13 Alarm 10 Log 11 8 14 17 12 15 18 Low battery: low battery indication ALRM symbol (ALARM): when alarms are active, it indicates that one or more than one of the acquired values have exceeded set limits. LOG symbol (LOGGING): it flashes when logging. T1 ON/OFF and ENTER key: it switches the instrument on and off; when programming, it confirms the step of the current program. T2 LOG key (LOGGING): it starts and stops data acquisition %RH symbol: it indicates that the display is showing a relative humidity measure °C/°F symbol: it indicates that the display is showing a temperature measure (°C / °F selection is made from PC) T4 PROG and key : this key is used to access the instrument different programming steps; when programming, it decreases the displayed value. 3 9) 10) 11) 12) 13) 14) 15) 16) 17) 18) 4 T3 F1/F2 and key: in HD206-1 and HD206-2 models, it selects the variable to be displayed between temperature (fixed) and relative humidity (fixed) or both of them, alternately. When programming, it increases the displayed value. Te symbol: it indicates that the display is showing the temperature of the external probe (optional). Ti symbol: it indicates that the display is showing the temperature of the built-in sensor. key: in HD207 and HD207-1 models, it selects the variable to be displayed T3 F1/F2 and between internal temperature (fixed), external one (fixed) or both of them, alternately. When programming, it raises the displayed value. Alarm LED (ALARM): the red LED flashes to indicate that one or more acquired values have exceeded the set-point and/or that battery is flat. During the battery test, it produces a series of close flashings indicating that battery is low and that it has to be replaced as soon as possible. T1 ON/OFF and LOGGING key: it starts and stops a logging session . T2 Key not used. LOG LED (Logging): the green LED flashes when the instrument is logging. During the battery test, it produces a series of close flashings indicating that the battery is charged. T4 BATTERY TEST key: key to be used to check the battery level. If the battery is charged, the green LED (LOG) makes a series of close flashings. If it is low, the red LED (Alarm) flashes. T3 Key not used Keyboard Protection Cover All datalogger models are provided with a 4-key keyboard: in HD226… and HD227… the two central keys are not used. The keyboard is protected by a cover indicating on the front the functions of the keys below. The cover is pressed in its lodgement: to access keys, open the cover using your nail as a lever on one of the two lateral slots. Connecting the External Probes Temperature and temperature/humidity external probes (according to the model), as well as the serial cable for the connection to a PC, have to be connected through the socket placed at the base of the instrument. As shown in the picture aside, on the instrument connector there is a triangle that helps the user in inserting the probes: the vertex of this triangle has to be aligned with the arrow on the probe connector. When inserting, keep the instrument socket and the probe connector aligned; do not try to insert the connector in a different position: the connector might be damaged irreparably. TRIANGLE ON THE INSTRUMENT ARROW ON THE CONNECTOR 5 View (for HD206… and HD207… models) To switch the instrument on, open the keyboard cover and press the ON/OFF key. On the models that measure two quantities (temperature and humidity or internal and external temperature), select the variable to be viewed by using the F1/F2 key. If the key is pressed repeatedly, either the first variable, the second one or, finally, the two variables alternately will be displayed. A triangle on the display indicates the variable currently viewed: temperature or humidity in correspondence with °C/°F and %RH; internal or external temperature in correspondence with Ti and Te. If you select the single-channel view and an alarm becomes true, the instrument will automatically turn to the alternating view to be able to display the alarm diagnostic. When the external probe with cable (temperature or temperature/humidity probe) isn't connected, the message "Und" appears on the display referred to the temperature channel and the message "ERR" referred to the R.H. channel: in this case use the F1/F2 key to let the unused measuring channel disappear. Programming from Keyboard (for HD206… and HD207… models) The logging operation requires the preventive setting of some parameters. The PROG key allows to access the programming functions: if pressed repeatedly, the different program steps will scroll from P00 to P10 and again to P00 in a circular routine. Once you have reached the desired step, press ENTER to change its value. To go back to the view mode, press ENTER from P00 step. The instrument programming can also be made from a PC using DeltaLog2 program. P00 P01 p02 … p10 p00 ENTER 6 It allows to Quit Programming and Jump to View. P00 199.9 ENTER Setting the Sampling Interval. Select the interval between two consecutive acquisitions through T3 and T4 keys. The following fixed intervals are available: 1, 5, 10, 30 seconds (“), 1, 5, 10, 15, 30 minutes (‘), 1 hour (H). Press ENTER (T1) to confirm. Sampling interval and display up-dating times are the same up to 30 seconds and have the same rate; for longer sampling intervals, the display updates every 30 seconds (fixed). 7 P01 “01 ...”30 ‘1 … ‘30, H0 1 [ ] ENTER “30 ENTER [ ] Selecting Logging Start and Stop Modes. Manual (“man” on display): acquisition start and stop are controlled by the LOG key. Auto (“dat” on display): acquisition start and stop are performed in accordance with the date and the time set from the instrument keyboard (see P04 and P05 steps) or from PC (see DeltaLog2 software). If the auto mode is enabled, P03, P04 and P05 steps are disabled, but the LOG key (instant start and stop) remains always enabled. P02 [ENTER] [ENTER] 2 8 [ ] [ ] 1 Setting the Instrument Time and Date. Time and date options are viewed according to the following order: year (“Y” followed by the ”), day (“d”), hours (“H”) and minutes (‘): use T3 and last two digits of the year), month (“ T4 keys to edit the different parameters, press ENTER (T1) to confirm. Warning: access to this step of the program is denied if P02 step has been set on auto (“dat”): to be able to edit time and date, P02 has to be configured as “man”. P03 y0 1 ENTER ENTER 12 [ ] 2 [ ] 1 ENTER YEAR 31 ENTER 2 [ ] 1 DAY ENTER 2 [ ] 1 MONTH H13 [ ] [ ] 2 ‘55 [ ] [ ] 1 HOUR ENTER 2 [ ] [ ] 1 MINUTES 9 Setting Time and Date of Automatic Logging Start. See the sequence of figures shown at step P03. Warning: access to this step of the program is denied if P02 step has been set on auto (“dat”): to be able to edit time and date, P02 has to be set on “man”. After setting start and stop time and date, P02 has to be set on “dat” to enable the auto logging mode. Setting Time and Date of Automatic Logging stop. Refer to the sequence of figures shown at step P03. Warning: access to this step of the program is denied if P02 step has been set on auto (“dat”): to be able to edit time and date, P02 has to be set on “man”. After setting start and stop time and date, P02 has to be set on “dat” to enable the auto logging mode. Setting Alarm Set-points for the First Input Channel (Temperature in HD206-1 and HD206-2 models and Internal Temperature in HD207 and HD207-1 models). symbol lights up When acquiring, if temperature exceeds set limits (either low or high), the in correspondence with the ALRM indication (on display): the indication remains even if temperature then falls into the limits again. This function is active if enabled through the P07 program. When at P06, press ENTER to set low temperature set-point (“LOU”): use T3 ( ) and T4 ( ) keys to set the desired value, corresponding to the alarm low limit, press ENTER (T1) to confirm. Then set high temperature set-point (“HIG”): use T3 ( ) and T4 ( ) keys to set the desired value, corresponding to the alarm high limit, press ENTER (T1) to confirm. 10 lou P06 ENTER 0.0 ENTER ENTER 2 [ ] 1 50.0 hig ENTER [ ] ENTER 2 [ ] [ ] 1 Activating Alarm Set-points for the First Input Channel (Temperature in HD206-1 and HD206-2 models and Internal Temperature in HD207 and HD207-1 models). The instrument indicates that temperature alarm limits (as set at P06 step) have been exceeded symbol in correspondence with the ALRM indication on display. To enby lighting up the able this function, use T3 ( ) and T4 ( ) keys to select ON and press ENTER (T1) to confirm. 11 off P07 ENTER ENTER 2 [ ] [ ] 1 Note: the alarm indication remains even if, after going out of range, the measurement returns to set limits. To reset previous alarm indications, set OFF and press ENTER (T1) to confirm. Setting Alarm Set-points for the Second Input Channel (relative humidity in HD206-1 and HD206-2 models and External Temperature in HD207 and HD207-1 models). When acquiring, if the measurement related to the second input channel exceeds set limits (eisymbol lights up in correspondence with the ALRM indication (on ther low or high), the display): the indication remains even if the measurement value then falls into the limits again. This function is active if enabled through P09 program. When at point P08, press ENTER to set the low set-point (“LOU”): use T3 ( ) and T4 ( ) keys to set the desired value, corresponding to the alarm low limit, press ENTER (T1) to confirm. Then set the high set-point (“HIG”): use T3 ( ) and T4 ( ) keys to set the desired value, corresponding to the alarm high limit, press ENTER (T1) to confirm. See the sequence of figures shown at P06 step. 12 Activating Alarm Set-points for the Second Input Channel/ (relative humidity in HD206-1 and HD206-2 models and External Temperature in HD207 and HD207-1 models). The instrument indicates that humidity and external temperature alarm set-points (as set at step symbol on display in correspondence with P08) have been exceeded and lights up the ALRM indication. To enable this function, use T3 ( ) and T4 ( ) keys to select ON, then press ENTER to confirm (T1). off P09 [ ] 2 [ ] 1 Note: the alarm indication remains even if, after going out of range, the measurement returns to set limits. To reset previous alarm indications, set OFF and press ENTER (T1) to confirm. Setting the Instrument in a Default Configuration. “deF” indication appears: press ENTER (T1) to confirm or T4 to jump to P0 without making any change. The default configuration allows to set the following parameters: • Sampling time: 5 sec • Manual Start • Endless Loop Memory: OFF • Alarm set-points for the first channel: OFF 13 • • Alarm set-points for the second channel: OFF Reset of latched alarms def P10 ENTER ENTER def p00 [T4] ENTER Logging (for HD206… and HD207… models) Two logging modes are available: manual and auto. In manual, the LOG key commands logging start symbol over and stop; in auto, they are managed by entering time and date. When logging, the the LOG indication flashes. While logging, setting of programming data is not accessible. Refer to DeltaLog2 program for the different programming modes through a PC. 14 Manual Logging: press the LOG key to start and stop logging. Here are the operations to be done on the instrument keyboard; the same settings can be made from a PC using DeltaLog2 program. 1. Activate the “man” function in P02 program. 2. Set the sampling interval with P01program. 3. Set alarms, if desired, with steps from P06 to P09. symbol on display, (in correspondence with 4. Start logging by pressing the LOG key: the the LOG indication), will start flashing. 5. Press LOG again to stop logging. Notes: A) If the instrument is not logging and you press LOG, logging will start. If the instrument built-in clock has been previously set on auto logging, the instrument will ignore the command and will go on logging. Pressing LOG or according to the automatic stop command (the first one between the two) will interrupt logging. B) If the instrument is already logging (either in manual or in auto), and you press LOG, logging will stop. The eventual automatic stop command will be ignored. Automatic Logging: storage start and stop are performed according to established time and date, previously set. Here are the steps to be made from the instrument keyboard; the same settings can be made from a PC, using DeltaLog2 program. 1. Make sure that the instrument date and time are properly set (program P03) 2. Activate the “man” function in P02 program. 3. Set the sampling time with P01 program. 4. Enter start time and date using P04 program. 5. Enter stop time and date using P05 program. 6. Set alarms, if desired, using the steps from P06 to P09. 7. Activate the “dat” function in P02 program. 15 The instrument is ready to store data at the established time and date. Note: if the stop date is prior to the start one, the instrument continues storing until memory is full. Then it stops. See the other notes of the previous paragraph. 22.9 22.9 Logging (for HD226… and HD227… models) Logging operation requires that some parameters, such as sampling interval, storage start/stop time and date (in case of auto logging) and alarm set-point setting, are previously set: all these operations are carried out by DeltaLog2 software. See the next paragraph about how to connect the instrument to a PC and on how to use the program (see page 23). Two logging modes are available: manual or auto. Logging start and stop are controlled by the LOGGING key in the first mode, and by entering time and date in the second one. When logging, the LOG green LED flashes every 8 seconds to remind the user that the instrument is working. 16 When alarms have been activated and one of the alarm set-points has been exceeded while logging (once, at least), or when battery is low, the ALARM red LED will also flash every 8 seconds. To check if the alarm indication is due to a low battery, press the BATTERY TEST key: the instrument will make a sequence of four green flashes if battery is charged (LOG LED) and of four red flashes if battery is low/flat (ALARM LED). The battery test can be made while logging and even when the instrument is off. When memory is full, the instrument switches off and, upon power-on, it makes 8 red flashes at intervals of one second. Manual Logging: press the LOGGING key to start and stop the logging function. HD226… and HD227… models have to be programmed from PC with DeltaLog2 program. Here are the steps to be followed: 1. Activate the manual function. 2. Set the sampling interval 3. Set the alarm limits, if desired. 4. Press the LOGGING key to start logging: the LOG green LED will start flashing. 5. Press the LOGGING key again to stop logging. Notes: A) If you press the LOGGING key and the instrument is not logging, logging will start. If the built-in clock has been previously configured for the auto logging, the instrument will ignore the command and will go on logging. Pressing LOG or according to the automatic stop command (the first one between the two) will interrupt logging. B) If the instrument is already logging (either in manual or in auto), and you press LOG, logging will stop. The following eventual automatic stop command will be ignored. Automatic Logging: logging start and stop are performed at an established time and date, previously set using DeltaLog2 program. 1. Make sure that the instrument date and time are properly set. 2. Activate the auto start and stop function (Start Mode = Date). 17 3. 4. 5. 6. Set the sampling interval. Enter start time and date. Enter stop time and date. Set alarm limits, if desired. Note: if the stop date is prior to the start one, the instrument continues logging until memory is full. Then it stops. See the other notes of the paragraph above. Low Battery Indication The instrument is provided with a battery charge control. The low battery indication activates to inform the user that the battery needs to be replaced as soon as possible: on the models equipped with display, the battery symbol lights up; on the models without display, the alarm red LED starts flashing. The alarm red LED also indicates that the alarm set-points have been exceeded: to understand which is the reason of the alarm, just press the BATTERY TEST key to make a battery test. If the green LED flashes, it means that the battery is charged and that one of the set limits has been exceeded causing the alarm. On the contrary (red LED flashing), it is necessary to check data with a computer to find out if an alarm limit has been exceeded. How to Replace the Battery The minidatalogger reduced consumption grants the battery that powers the circuit a long life; when the instrument indicates that the battery is low, it has to be replaced as soon as possible. The minidatalogger is powered by a 3.6V type ½AA Lithium battery (Diameter x Length = 14mm x 25mm) with axial rheophores. Before replacing battery, finish any running logging operation and switch the instrument off. In order to avoid losing the configuration data, the battery has to be replaced within a minute. Battery replacement has to be carried out when instrument is switched off. 18 Procedure 1) Loosen the screws on the rear side of the instrument. 2) Open the back of the minidatalogger. 3) Cut the rheophores of the new battery at an approx. length of 10mm. 1 LITHIUM 3.6V ~10mm 3 + 4) Take off the “tulip connector” from the flat battery. 5) Remove the flat battery from its seat. 6) Insert the “tulip connector” at the top of the red wire on the + (positive) rheophore of the new battery. 7) Insert the “tulip connector” at the top of the black wire on the - (negative) rheophore of the new battery. 8) Fix the battery in its slot on the cover. 9) Close the instrument rear side with the screws. 19 LITHIUM 3.6V BLACK WIRE (-) 20 + RED WIRE (+) Connecting to a PC The minidatalogger can be connected to a PC having a Windows operating system through a proper serial cable; DeltaLog2 software controls the instrument different functions directly from PC. You can, for example: • Program data acquisition intervals • Dump data contained in the minidatalogger memory • View data in graph or tabular format • Program alarm set-points for each input channel • Set a safety code (password) to protect data To connect the PC to the minidatalogger, use the provided HD206/54 serial cable. The connector at the base of the instrument is used to connect either the serial cable or the probes equipped with cable; HD206-2 and HD226-2 have an additional connector, inside the instrument, necessary to connect the serial cable when you have to make the relative humidity calibration of the temperature/humidity combined probe. The HD 206/54 serial cable is provided with a 9-pole connector: if the PC is equipped with a 25-pole connector, use a 9-pole/25-pole adaptor. When Should the Built-in Connector be Used? The built-in serial connector has to be used when you have to make the calibration of the relative humidity probe. To make the connection, open the rear side of the instrument, insert the serial connector and align it properly with the arrow near the connector. (See how to open the instrument in the paragraph concerning battery replacement). 21 HD206/54 INTERNAL SERIAL CONNECTOR LITHIUM 3.6V In all other cases, you just have to disconnect the external temperature or temperature/humidity probe, if any, and replace it with the serial cable supplied with DeltaLog2 program, as shown in the figure below. HD206S1 24.8 HD206/54 - RS232C 22 DELTALOG2® DeltaLog2 program allows to manage from your own PC all the minidatalogger functions in an easy and intuitive way: you can set logging start and stop times, alarm set-points, dump data and view them either in table or graphic format, display and save on file the measurements acquired from the instrument in real time, print data and export them in Excel® format, read the remaining battery charge… A password protects the instrument setup settings and prevents non-authorized changes. EN 12830 Compliance HD207 and HD227 dataloggers with sensor inside the instrument housing are compliant to the European Standard EN 12830:1999 (S, T, C, D, 1) if operated in conjunction with the DeltaLog2 application software from version 2.5. The data are stored in readable form (non-encrypted) but the file is provided with an encoded field which reveals any attempt to alter the original data, making the file unreadable when opened with the DeltaLog2 software (from ver.2.5). Only the reports generated by the original data will be marked as EN 12830 compliant. Any other use of the data generated by the instruments is possible under the responsibility of the user. To save the data in compliance with the standard, it is necessary to register the instrument indicating the measurement place in the "Instrument Location" field, the information will be saved together with the downloaded data. It is possible to change the "Instrument Location" field and register the instrument through the menu command "Instrument Manager" (see paragraph on page 54). DELTALOG2 Setup To install the program, insert the Cd-Rom in its drive, select Start – Run – Digit D:\setup.exe (“D” indicates the Cd-Rom drive) and press OK. Follow the on-screen instructions. During the setup procedure, the software licence agreement will be viewed: click ACCEPT to accept the agreement terms and continue with the setup operation. To add the program icon on your desktop, select “Shortcut on desktop” at the end of the setup. 23 On the same Cd-Rom there is a copy of the manual in PDF format, which can be read using Acrobat Reader® (this program can be downloaded free of charge from www.adobe.com/acrobat/ site). Uninstall DELTALOG2 When setting-up DeltaLog2 software, the “Uninstall DeltaLog2” command will be created in the DeltaOhm folder. Run it to uninstall the program and all of its components. Preliminaries - Starting DeltaLog2 Connect the instrument to one of the PC free serial port through the proper serial cable (HD206/54) provided with the program. Start the program with a double click on the desktop program icon, or select DeltaLog2 item in the DeltaOhm folder in the Start menu. Press the Connect key or select the “Instrument Connect” command: the program will automatically search the serial line to which the instrument is linked and will connect to it. If connection has succeeded, the following symbol will appear on the right side, at the bottom of the page: If connection has failed, the following symbol will appear: If the program cannot connect to the instrument, see “Failed Connection: How to Solve the Problem” at page 56. 24 Definition of Functional Areas After dumping data, DeltaLog2 appears as in the figure below: The following functional areas can be identified: 1. Main menu 2. Commands Bar 3. Information about the Report Lists 25 4. 5. 6. Data View View of Current Report Summary Data Indication of Serial Port Connection Status 1. Main Menu In the upper side of the window, there is the main menu that allows to access to all of the functions offered by DeltaLog2 program. To activate a function, open the pop-up menu related to the desired function and select it with the mouse. Different commands will then appear; to know how to use them, see the following paragraphs, where the main functions are described in details. A) File Menu Open It opens a file. Save It saves the File in the folder where it already is. Save As… It saves the File in a desired folder. Export to Excel It opens Microsoft Excel and exports data currently active to an Excel folder. In order this function to be active, Microsoft Excel has to have already been set-up on your PC. Up to 30000 samples per time are exported: for bigger quantities, you will be asked which data block has to be exported. Export as formatted text It exports data of the current report to a text file, separated by “;”. This file can be easily imported from other applications. 26 Close It closes a File previously opened Print… It prints the current report and, more precisely, the data displayed in the “Data View Area” and in “View Area of Current Report Summary Data”, as well as the comment eventually entered by the user through the Tool/ViewEdit Comments menu. Printer Setup… It opens the panel for printer setup setting. Exit It closes the program. B) Instrument Menu Connect It connects DeltaLog2 program to the instrument and sets the serial port parameters automatically. Disconnect It disconnects DeltaLog2 program from the instrument and enables the use of the serial port for other programs. Inst. Info (Information about the instrument) It opens a window containing the information about the instrument connected to the program. Read Temp/Hum. (Temperature/Humidity Reading) It starts the function to view on the PC monitor the measurements detected by the minidatalogger in real time. Start Recording It starts data logging on the minidatalogger. Stop Recording It stops data logging on the minidatalogger. 27 Dump Data It dumps to a PC the data the instrument has stored while operating. A window will appear indicating the download progress and the number of logged records. This window will also allow to interrupt the download operation. Clear Dumped Data It clears minidatalogger data dumped to a PC. The program will ask you in advance if you want to save measurements on a file. When in “endless loop memory”, the command does not clear data from the PC hard-disk, but only from the screen, as they are automatically saved while downloading. Instr. Setup It opens the setup window of the instrument connected to the PC. C) View Menu Graph It displays the selected data file in graph format. If a graph is already available, it refreshes it: this function is useful to bring the window to the start condition rapidly. Table It goes from the graph to the table view. Toolbar It activates or disables the toolbar described below. Status bar It activates or deactivates the status bar 28 D) Tool Menu Set limits It opens a window that allows to set an alarm low limit and an alarm high limit for each channel of the instrument. This option is particularly useful for a faster analysis of data when you are looking for any possible exceeded alarm limit. View Limits It activates the view of the alarm limits. This function acts on a single graph at any one time: to select a channel, click the line corresponding to that channel in the View of Current Report Summary Data. 29 Calc Avg It calculates the average value of a group of selected data in a table. To select a group of contiguous data, click the first datum and, holding the Shift key down, click the last one. To select a group of non-contiguous data, click the data to be selected holding the Ctrl key down. View/Edit Comments It opens a window to view, add or edit personal comments to the file containing dumped data. This comment will be printed together with data and, more precisely, together with the information summary. Change Channel Description It opens a window where you can change the channel description that appears on display. Zoom + It enlarges the area of the graph previously selected with the mouse. Holding the mouse left button down and passing on the graph, you will select the area to be enlarged. Once this area has been selected, use the Zoom+ command (or the Apply Zoom key) to enlarge. Zoom Goes back to standard view. Filter Setup… It opens the window of data filter setup when the table view is active. Apply Filter It applies the filter to current data viewed in table format. E) Menu Virtual Memory Instrument Manager (File Management on PC) Function to manage data related to the registered minidataloggers and to the files saved on PC in endless loop memory. 30 Split & Archive Dynamic Record File It opens a window to file data dumped while the instrument is in endless loop memory. Sort Data It sorts through the groups of dumped data when the instrument is in endless loop memory, according to the date (time, day, week, month, year) or to the logging session. View Overrun Info When the instrument is in continuous logging, this command resumes the time intervals where the new data, contained in the minidatalogger memory, have overrun the old ones. F) Options Menu Port Settings (Serial Port Setup) It opens the window to set or view the parameters of the serial port communication. This function is active only when no instrument is connected. Selecting “Autodetect”, the program automatically sets the port parameters. Lock Program This function locks the “Setup Instrument” item for the minidatalogger setup, but leaves all the other functions of the program active. It is useful to prevent other people changing the minidatalogger settings without prior permission. A password is required to unlock the program. Unlock Program It restores the program complete functionality by entering the password. Modify Prog. Password Command to be used to change the current password of the program. Enter the current password: if it is correct, a window will open where you can enter the new password. For safety reasons, the password has to be typed twice in the two available boxes. Warning: the password has to be typed exactly as it was first written, respecting capital and small letters. 31 Enable Emergency Dump When the instrument is in endless loop memory and you start dumping data, only data logged in the last session will be dumped. In particular cases (if, i.e., the previous data had been unintentionally deleted or spoiled) it might be necessary to dump the memory whole content. In this case the emergency dump has to be enabled, paying attention, because the operation might overrun other data already present on the PC, which will consequently go lost. Calibration It starts the calibration procedure of the relative humidity probe in HD206-2 and HD226-2 models. This item is disabled if the program setup lock has been entered, by means of the Lock Program command. G) ? Menu (Help) DeltaLog2 Info About software version DeltaLog2 Licence Software licence agreement with the end user. DeltaLog2 Handbook (User’s Manual) DeltaLog2 software user’s manual. 2. Toolbar In order to speed-up the use of the system, some operations accessible from menu are available also from toolbar placed immediately under the main menu (series of buttons). File/Open It opens a file of data previously saved. 32 File/Save as… It saves data downloaded from the instrument Instrument/New Session It starts a new session and deletes data downloaded to the PC: before closing, you will be asked if you want to save data. It does not clear the minidatalogger memory: to do it, use the “Clear Memory Now” command in the instrument setup (see Instrument Settings at page 38). Instrument/Connect It starts the instrument connection to the PC. Serial port settings are automatically made by the program and no operator’s action is required. Instrument/Disconnect It disconnects the instrument at the end of the working session. This command leaves the serial port available for other applications. Instrument/Read Instrument It reads the measurements detected by the instrument and displays them on the PC screen – see the related paragraph at page 41. Instrument/Dump data It starts data dump from minidatalogger to PC Instrument/Start Recording It starts data recording Instrument/Stop Recording It stops data recording 33 Instrument/Instr.Setup It opens the instrument setup window View/Table It views data dumped in table format. Tool/Filter Setup It opens the window of data filter setup when table view is active. Tool/Filter Apply It applies the filter to current data viewed in table format. View/Graph It displays the selected data file in graph format. To select a block of data, click the corresponding name in the Report List Area. Tool/View Limit It views on the graph the limits set through the ToolSet Limit command. The command is active when one channel only is viewed. Tool/Zoom + It enlarges an area of the graph. Tool/Zoom - It reduces an area of the graph. File/Export to Excel It opens Excel and sends current data to it. This function is active when data are viewed in table format. To be active, this function requires Microsoft Excel to be installed on your PC. 34 View/Edit comments It opens a window to view, add or edit personal comments to the file containing dumped data. Such a comment will be present even when printing data and, more precisely, in the summary information side. Tool/Calc Avg It calculates the mean value of data selected in the table. To select a group of contiguous data, click the first datum and, holding the Shift key down, click the last one. To select a group of non-contiguous data, use “Ctrl” instead of “Shift”. File/Print It prints current data as they are viewed (either table or graph). The operator is required to give a heading to the print. Option/Unlock Program It unlocks the setup functions of DeltaLog2 program by entering a password. Option/Lock Program It locks the setup functions of DeltaLog2 program. To unlock them, use the Unlock Program command. 35 3. Information Area about Downloaded Report Lists This is the area where the different stored or dumped from the instrument data are viewed. The view shows the logging start and stop date, as well as the number of logged samples. 4. Data View Area This is the area where the values of logged samples of the currently selected report are viewed . The values related to each sample concern: the acquisition date (in year – month – day format) and time (in hour – minutes – seconds format), as well as the values of the different channels with the corresponding unit of measurement. 36 5. View Area of Current Report Summary Data This is the area where summary information of each channel of the currently selected report are viewed. The following information appear, for each channel: • Description • Sampling time • Maximum Value • Minimum Value • Average Value 37 • • Type of sensor Other parameters 6. Serial Port Connection Status This is the symbol that indicates status and connection parameters of DeltaLog2 with the serial port. Depending on the connection status, the symbol can take the following values: DeltaLog2 is not connected with the serial port DeltaLog2 is not connected with the serial port because an error occurred while connecting. DeltaLog2 is properly connected with related parameters. Instrument Setup With the instrument connected, press the Setup key to open the parameter setting window. The window is composed of 5 cards : Current Settings: it resumes the instrument current settings – this card cannot be edited by the user. Info: it shows some information concerning the instrument: the user can enter a name in the user code box that helps him in identifying the instrument. 38 Date - Time: the upper side of the card (identified by Date - Time) is used to update, if necessary, the instrument date and time; selecting the “Update instrument Date-Time to PC Date-Time” item, the instrument date and time are automatically updated to the PC date and time. Sample time: it represents the interval between two subsequent loggings (sampling interval) and can be chosen in the range between 1 second and 1 hour. Start Mode: it indicates the mode logging will start: selecting the Manual item, logging will start when the operator presses the LOG key (or LOGGING key, depending on models) on the instrument. On the contrary, selecting the Start Mode=Date item, the Start Date-Time (delayed start) and Stop Date-Time boxes (logging delayed stop) will become active: here you can enter logging start and stop time and date. Anyhow, in both cases, you can start and stop logging from PC. Alarms: it manages the alarms of each channel. Selecting the different items, related alarms are enabled and you can enter in the dialog boxes the minimum and maximum values, or both of them. Each channel can be enabled independently of the other. 39 The rest of the card, presents the alarm current status: the red LED on shows the alarm limits that have been exceeded: if you press Reset, the corresponding alarm will be cleared. Battery level: it indicates the battery charge level: when the red LED is on, the battery has to be replaced as soon as possible (see the related paragraph on how to replace it). 40 Option: the card is divided into six areas: 1) Memory: A) Endless loop memory: it activates the endless loop memory function (see below the detailed description of this function). B) Clear memory now: it is the button used to clear the instrument memory content. When you press the key, you will be asked to confirm the operation: press YES to continue or NO to cancel. 2) Select channel to store: it selects the channel or the channels to be stored. If no change is made, the current setting will be held (visible in the first card - “Current Settings” -) 3) Select Unit measurement: it selects the temperature unit of measurement between °C and °F. 4) Display: it selects which channel to view on the instrument display : the first only, the second only, or both of them, alternately. 5) Lock keyboard: the instrument keyboard can be locked to prevent other non-authorized people changing the instrument operation. The lock can be: partial (partial lock: start button free) – only the function of start logging is accessible – or total (total lock) – all keys are locked and all operations can be managed from PC only. 6) Custom settings: it stores (save settings) and recalls (load settings) an instrument setup Press APPLY ALL to confirm, or Cancel to cancel the operation. Reading Measurements in Real Time on a PC With the instrument connected to the PC, press Read Instrument to read on the PC monitor the measurements detected by the minidatalogger in real time. The sampling time is automatically set at 1 second. The following window will appear: 41 Measurement registered by the two input channels of the instrument Diagram of the two channels The vertical yellow lines represent the storage interval activated through the “Store Data On File” command (see below). Alarm current status. The red LED turns on when the limit is exceeded. Press the Reset key to clear it. Alarm history: it registers all the alarms occurred since this window was opened Select the “Enable Storing” item to store the measurements registered by the two channels. If you disable it, or quit the function, you will be asked if you want to save data on a file. 42 Logging Start and Stop After setting the setup parameters (sampling interval, channels to be stored,…), press the “Start Recording” key to start with immediate logging. Recording will immediately start, independently on the type of Start Mode selected in the Setup. Press “Disconnect“ to disconnect the instrument, then disconnect the serial cable To stop logging, connect the serial cable, start DeltaLog2 program, connect the instrument and press the Stop Recording key. N.B.: If the keyboard has not been locked during setup, logging can be stopped by pressing the LOG key on the instrument. Data Dump To dump data contained in the minidatalogger memory, connect the serial cable to the PC, start DeltaLog2 program, connect the instrument (Connect key). Press the “Dump data on PC” key. Once data have been dumped, they will be shown in table format. Press the Disconnect key to disconnect the instrument. Disconnect the serial cable. 43 Data View in Graph or Table Format The content of the minidatalogger memory can be viewed in graph or table format. In the window on the left side (Report List) are shown the groups of data corresponding to the different logging sessions, together with the logging start and stop date and the number of samples. To select a group of data, you just have to click the name of the report list with the left button of the mouse. Data View in Table Format In the table view you find the list of measurements detected by the instrument, provided with date and time. A filter can be applied on these data. It extracts from the total of data a subgroup, according to the value of a high limit, of and a low limit or of the overlay of both of them . The filter can be applied to one of the two channels or to both of them: in this case, only the groups that respect contemporaneously the two conditions will be shown. After setting a filter using the “Filter Setup…” command, apply it by using the “Filter Apply” command: a window similar to the next one will be viewed. 44 In the upper side of the window there is the filter setup summary; while the summary of the groups of data that respect set limits appears below. The biggest group of data, the smallest one, as well as the total number of groups are viewed . The key on the bottom “Go to interval” brings directly to each interval of the list. When the filter is applied, the different groups are separated by dashes, as shown below.. 45 Data View in Graph Format Each group of measurements can be displayed in graphic form through the ViewGraph command or the equivalent key. Besides the view of the graph of the two channels, the program allows to display 46 separately the graph of each channel. To get it, you just have to select the desired channel with a click of the mouse on the desired channel in the “View of Current Report Data Summary” area. To go back to the view of all channels, just click again the “View Graph” key. The “overrun event” item displays on the graph the points where the overrun occurred. By means of the mouse right button, you can activate a menu with some useful commands: • • • • The view of sampling instants (Point marks) and the connection among the different points (Scatter Graph) The indication of coordinates (trace mouse coordinates) like [sampling instant, temperature or humidity] by tracing with the mouse. Zoom functions to enlarge a graph area. Fit functions (Fit…) that allow to adapt the graph in order to cover the whole height (Height) , width (Width) or window (Page) available. Endless Memory It is a logging mode that exploits the power of the PC hard disk to store big quantities of data. This function is activated in the Option card of the “Setup Instrument” item. 47 After setting the logging interval and clicking on the “Endless loop memory” item, start logging. Before the instrument memory gets full and without stopping recording, the memory content can be dumped: DeltaLog2 will link the new dumped data together with those already available on PC, related to prior recordings. In order to let everything work properly, when you first connect, the program will ask you to register the minidatalogger, so that it will be identified every time it will be connected to the same PC. Answer YES when you are asked to create a new registration. In the next screen, click the Register Instr.key: the new minidatalogger will be added to the list of the instruments registered on that PC. Press the Close key to close the Instrument Manager. If the endless loop memory function has been activated and a too long time has elapsed, the latest data will overrun the old one: in this case, when dumping data again, the program will signal an “overrun” indicating date and duration of this overrun. In this last case, there will be a “hole” in recording in correspondence with the first data of the last recording. N.B.: to grant data continuity, once the endless loop memory function has been activated, it shall not be deactivated. 48 This kind of logging works similarly to chart recorders. The minidatalogger memory can be compared with a complete turn of the chart roll. If logging starts at Ti1 instant, not to loose useful data, you just have to dump data before Ti1 goes beyond To, as you can seen in the drawing aside in correspondence with n°1 pen.. If, on the contrary, as in the second case, Ti2 starting instant goes beyond To, the data contained in the darker rectangle from Ti2 to To, will be overrun and thus can’t be recovered. Every time you dump data, the memory will be entirely available again for new loggings: it is as if a new sheet were applied to the chart recorder. 1 2 Ti1 T0 Ti2 Step-by-step procedure (the first 5 steps have to be made just the first time): 1) Start DeltaLog2. 2) Connect the minidatalogger serial cable to the serial port of the PC. 3) Connect the minidatalogger to the PC by pressing Connect on DeltaLog2 commands bar. If it is the first time that you carry out this operation, register the new instrument as explained at page 54. 4) Press Instrument Setup to get into the Setup and set sampling interval (Sample time), start mode (Start Mode), alarms, if required, (press the Reset key near each LED to clear prior alarms); then select “Endless loop memory”. Press Apply All to confirm. If you set a stop date prior to the start one, the instrument will go on logging data and, when no space is available anymore, it will overrun the oldest data. If, on the contrary, the stop data is subsequent to the start one, the instrument will stop logging when that date is reached. 49 5) Disconnect the instrument after having eventually started recording through the Start Recording key: recording can also be started in auto mode with the date or in manual mode with the LOG key on the instrument keyboard. 6) Before memory is completely full and without stopping recording, reconnect the instrument. Start data dump (Dump Data on PC) : a window will appear asking if just new measurements have to be dumped. Press OK to confirm. 7) Data will be dumped and displayed in table format after having been processed. The user will be informed of any Overrun. 8) If you wish to go on recording, simply disconnect the instrument (Disconnect key) without stopping recording. 9) Disconnect the serial cable. When connecting next time, repeat the steps starting from point 6. The quantity of available memory changes depending on the selected sampling interval and on the number of channels to be stored: the Setup Time - Date card shows memory left space. Remember that, when in endless loop memory, after each data dump, the whole minidatalogger memory is available again. There are cases where it is important to control a variable and, only if it has exceeded the set limit, its temporary trend in the last recording period will have to be checked. Suppose that, for example, you have to control a fridge temperature and that the limit is fixed at –15°C. The instrument will go on monitoring temperature and, only if an alarm will occur, you will check when did the alarm occur and which are the temperature changes. You will then dump data to get a report of what happened. On the contrary, that is, if no alarm occurs, the instrument will go on logging data. As the minidatalogger memory is organized in a cyclic way, you do not need to delete old data to get new memory space, because the most recent data cyclically replace the oldest ones. 50 To set the minidatalogger on this operating mode, follow the step-by-step description of the previous paragraph replacing step nr. 6 with the following one: 6) When an alarm occurs – shown on display by the arrow in correspondence with the ALRM indication or by the red LED flashing – start DeltaLog2 program. Connect the minidatalogger to the PC using the serial cable and press the Connect key. Start data dump (Dump Data on PC): a window will appear where it is asked whether to save the new measurements only. Press OK to confirm. Before disconnecting the instrument, clear the alarm indication in the Alarms folder of the Instrument Setup. Data Archive When you dump data on a PC using the endless loop memory function, the most recent data are queued to those already existing in the PC memory and they represent a single group of measurement consecutive sessions: this group of measurements appearing in the Report List is called “Dynamic Report File” and is indicated by the DRF abbreviation. For instance, a group might be composed of the seven daily measurements detected in a museum in a week time. When this block of measurements has been completed, the group of data can be conveniently stored: in this way, it will not appear anymore in the Report List every time a new dump is made. All data stored on a PC can be recalled to be viewed and, if needed, they can be deleted. Data dumped during an endless loop memory session, are reorganized by groups using the Sort Data command : every group of data will be composed of measurements detected at the same time, on the same day, in the same week, month or year, or according to the download data. 51 To be archived, a group of measurements has to form a complete block: if, for instance, data are sorted by day (By Day), the “Split & Archive data” function will be enabled only if data cover a whole day, at least. Furthermore, only completed intervals will be filed: in case of one day and a half of measurements, only the complete day will be filed. Remaining data will continue appearing in the Report List until the next storage or until the final storage that occurs using the Instrument Manager command “Close DRF & Archive”. Sort by download date is complete by itself, thus it will always be entirely filed. After two complete downloads of the minidatalogger memory, you will be asked to archive data before making a new download to prevent working with too big files. The same thing happens when some changes have been made to the instrument settings between a download and the next one: being the two groups of data not compatible with each other, it is necessary to file the old ones before dumping the new ones. 52 The “Split & Archive dynamic record file” command let the following window appear: In addition to the instrument parameters, it shows the logging functions: Date Time: current date and time Storing Interval: data sort criterion. Create new Archive: select it to enter the name of the new archive - Archive Name. Add to existing Archive: it allows to select an existing data archive among those listed in the pop-up window. Notes: enter any other note. Stored data can be recalled using the “Instrument Archive” command in File Manager (see the related paragraph below). 53 Instrument Manager The Instrument Manager function allows to manage data files stored on PC when the “endless loop memory” function is active. When first connecting, the instrument has to be registered: all registered instruments are listed in the “Instrument List”. Commands placed in the lower part of the window are applied to the instrument highlighted in that moment: to select it, click the description line in the “Instrument List”. On the left side there are the data of the instrument currently highlighted, while on the right side the Instrument Manager commands are grouped. Register Instrument: it registers the instrument actually connected to the PC and connected. Delete Instrument: it deletes the selected instrument and all files related to it. 54 Load DRF: (View the dynamic registration file) it recalls the list of data blocks previously downloaded to the PC up to the last archive. Data stored using the “Split & Archive data” command do not appear anymore in the “Report List”, but they can be recalled with the “Instrument Archive” command on the bottom. Close DRF & Archive: it closes the DRF file and archives it definitively. With respect to the “Split & Archive data” command, it also archives incomplete blocks of data. No blocks of data can be queued to this kind of archive. Instrument Archive: it opens the management window of the active instrument archives.. The selected archive can be opened (Open) to be either viewed or definitely deleted (Delete). 55 Troubleshooting 1) Connection failure If the program is unable to connect, proceed as follows: • Make sure that no other active programs on your PC are already using the serial ports (e.g.: Hyperterminal). If this is the case, close these applications and try again. • Make sure that the instrument battery is charged. • Make sure that the cables are properly connected to the connectors. 2) Print Problems If there are any problems during the print procedure, try to upgrade the printer driver by downloading it from the manufacturer's Web site. Modify the dimensions of printed image selecting File >> Print Graph Setting. Use the Copy to clipboard function to copy the active window and paste it in another application: for example, to print a graph, copy and paste it in Windows Paint and try to print it from there. 3) Battery replacement After the replacement of the battery, the keyboard of the instrument is unable to be used in order to avoid that the starting of a new storage can cancel any data already stored. Follow these instructions: • Connect the instrument to the PC, start the connection and, if necessary, download the data stored by the minidatalogger. • Press the Setup key and then select the slide Options. • Select the function Unlock as per the following picture. • Set date and hour in the Date-Time slide and then confirm the setup by means of the Apply All key 56 Calibration of the Relative Humidity Probe (HD206-2 and HD226-2 only) In the HD206-2 and HD226-2 minidatalogger models, operating with a combined external probe, the user can calibrate the humidity probe. To carry out this operation, you need DeltaLog2 program that guides the user step-by-step. To calibrate the probes properly, it is important to know and respect the laws of physics that are at the basis of measurement: for this reason it is strongly suggested to follow scrupulously the following indications and to carry out new calibrations only if you are familiar with a proper technical knowledge. Before starting the calibration procedure, you should check, with the help of 33%RH and 75.4%RH saturated solutions if the calibration is needed: the probe has to be newly calibrated only if a measurement error at one of these two points is detected. This calibration procedure deletes previous calibration data. To calibrate the probe properly, the first point has to be at 75%RH and the second one at 33%RH.. To carry out an accurate calibration, it is very important that the probe and saturated solutions be at the same temperature and that this is as stable as possible for the whole calibration. The whole calibration procedure is protected by the program password (Lock Program) and by a second password specific for this function, required when starting the procedure: while the first one can be changed by the user, the second one is fixed and can’t be modified.. Calibration Sequence: 1. Switch the minidatalogger on, connect the temperature/humidity combined probe to the external connector. 2. Open the minidatalogger rear side by unscrewing the four screws on the rear cover. 3. Connect the HD206/54 serial cable to the internal connector as explained at paragraph “When has the internal connector to be used” in the “Connecting to a PC” chapter at page 21. 4. Start DeltaLog2 program and press the “Connect” key to connect the instrument. 57 5. 6. 7. 58 If the instrument setup has been protected by a password (Lock Program), you have to unlock it before going on. Click Calibration in the Option menu: Enter CAL password (capital letters) and confirm. Select RH and confirm with OK. In the next window, select the first calibration point at 75%RH and press OK. The following window will appear. Warning: do not confirm immediately! 8. 9. 10. 11. 12. 13. 14. Loosen the sensor protection at the top of the probe. Replace it, with the perforated cap (screw it carefully) and its threaded metal ring (different measures are available according to the different kinds of probe), paying attention that it is well positioned in the base. Open the lid of the 75%RH saturated solution. Check that there are no drops of solution inside the measuring chamber: if any, blot them with paper. Insert the probe in the container, paying attention that the cap with the probe is in the base. The measuring chamber has to be perfectly closed, otherwise it won’t reach saturation: it is very important that no air passes through from outside to inside the chamber. Wait 30 minutes, at least. Then you can press OK to confirm: after some seconds, you will be asked to enter the humidity value really applied. This value is the value that appears in the table on the label of the container of saturated solution in correspondence with the temperature provided by the program. In the following example, at a 22.3°C temperature provided by the program, corresponds a relative humidity of about 75.3%: this is the value to be entered. 59 15. Select 33%RH in the next window. 16. Take out the probe from the container with the 75%RH solution and close it with its lid, open the container with the 33%RH saturated solution. Check that inside the measuring chamber there are drops of solution: if any, blot them with paper. 60 17. Insert the probe in the container, paying attention that the cap with the probe is in the base. The measuring chamber has to be perfectly closed, otherwise it won’t reach saturation. 18. Wait 30 minutes, at least and press OK to confirm. 19. In the next window, enter the humidity value actually applied and press OK. 20. Take out the probe from the container with the 33%RH solution, then close it with its lid. 21. Unscrew the ring with the cap and replace it with the sensor protection. Calibration is finished. 61 Important Notes: 1. 2. 3. 4. 5. 62 Do not touch the RH sensor with your hands. The base of the sensor is made of alumina, thus it can easily break. During the whole calibration cycle, operate at constant temperature as much as possible; normally, plastic materials have a poor heat conduction, thus they take some time before they reach a thermal equilibrium. In case you don’t get satisfactory results, check that: • The sensor is neither faulty nor corroded • When calibrating, the measuring chamber is perfectly closed • Saturated solutions are not exhausted. A 33%RH saturated solution is exhausted when, inside it, between the two walls, there is no salt anymore, but only a thick liquid: in this case the chamber cannot reach saturation anymore. For 75%RH saturated solutions, check that the salt is not dry (crystallized): to reach saturation, it has to be damp. Storage of saturated solutions: saturated solutions have to be possibly stored in the dark, at a steady temperature of approx. 20°C, with the container perfectly closed and in a dry room. Technical Specifications Versions with LCD HD207 HD207-1 HD206-1 HD206-2 Versions without LCD HD227 HD227-1 HD226-1 HD226-2 Temperature Sensor NTC 10KΩ @ 25°C RH Sensor --- Sensor Location Internally mounted Temperature Accuracy Measuring and Operating Range Relative Humidity Capacitive 150pF @23°C and 30%RH Externally mounted (fixed) Exter. mounted (fixed) Additional temperature probe: optional for HD226-1 model, not available for HD206-1 model Additional temperature probe available as an option Additional temperature probe available as an option --- --- Externally mounted (fixed) Internal temperature sensor on HD226-2 model Temperature and relative humidity combined probe with cable -30…+80°C instrument -30…+80°C instrument -30…+80°C instrument -30…+80°C instrument Temperature -40…+105°C probe with cable -40…+105°C probe with cable -40…+105°C probe with cable -40…+105°C probe with cable Relative Humidity --- --- 5%…98%RH 5%…98%RH ±0.3°C in the 0…70°C range Temperature Relative Humidity ±0.4°C outside the above range --- --- ±2.5%RH ±2.5%RH 63 HD207 HD227 HD207-1 HD227-1 HD206-1 HD226-1 HD206-2 HD226-2 Temperature 0.1°C 0.1°C 0.1°C 0.1°C Relative Humidity --- --- 0.1%RH 0.1%RH IP Protection 67 54 instrument 67 probe with cable 54 instrument 67 probe with cable 67 instrument 54 combined probe Number of Channels 1 + 1 external probe (optional) 1 + 1 external probe (optional) 2 (HD206-1) 2+1 (HD226-1) 2 (HD206-2) 2+1 (HD226-2) Resolution Versions with LCD Versions with LCD Storage/Logging Capacity 240.000 measurements with one channel active 120.000 measurements with two channels active 80.000 measurements per channel with three channels active Reading Interval Selectable among 1, 5, 10, 15, 30sec, 1, 5, 10, 15, 30min, 1hour PC Interface Software Display (where provided) LED (where provided) Power Supply Battery: typical life Dimensions / Weight Housing Instrument Connector Probe Connector Storage / Transport Temperature 64 Through a passive optoisolated RS232 serial port, 9600 bauds DeltaLog2 – Compatible with Windows® operating systems. 3½ digit LCD, battery low symbol, 4 indicators of functional modes LED for operating status indication (HD226… and HD227… models) 3.6V – 1Ah Replaceable lithium battery 3 years (with a measurement every 10sec) 52x88x36mm / 240g Polycarbonate / rubber 8-pole female minidin 8-pole male minidin -40…+85°C Ordering Code Minidatalogger (see below the detailed description of available models) HD206-2 No Indication = Internal sensor 1 = External Sensor/s 2 = Model with cable L = 1.5m 6 = Relative Humidity and Temperature Measurement 7 = Temperature Measurement 0 = LCD Display Version 2 = LED Version Ordering Codes of Minidatalogger Probes and Accessories TP207 immersion temperature probe with NTC sensor for measurements in liquids, powders and gas; total length: 45mm, diameter: 3mm, cable L = 1.5m, material: stainless steel. TP207P pointed/immersion temperature probe with NTC sensor for food industry applications; sheath length: 125mm, diameter: 4mm, cable L = 1.5m; material: stainless steel. 65 66 TP207A temperature probe with NTC sensor for a fast measurement of the air temperature; sheath length: 125mm, diameter: 3mm, cable: L = 1.5m; material: stainless steel. HD206S1 relative humidity/temperature combined probe, length: 109mm, diameter: 14mm; cable: L = 1.5m. HD206/54 RS232C serial connection cable; cable: L=1.5m; 9-pole standard connector/ 8 pole minidin. C.206 Serial connection cable with USB connector for PC and 8-pole MiniDin male connector for the instrument. The cable connects the mini-dataloggers HD 206, HD 226, HD 207 and HD 227 series directly to the USB port of the PC. HD75 Calibration saturated solution at 75%RH. HD33 Calibration saturated solution at 33%RH. DeltaLog2 Software to download and show data on PC for HD 206/226 – HD 207/227 series minidatalogger. Supplied with HD206/54 serial cable to connect the minidatalogger to a PC. Minidin 8-pole male connector and Sub D 9-pole female connector. Cable L= 1,5 m. BL.1 Li-SoCl2 3.6V 1Ah battery. Specifications of the Minidatalogger Optional Probes CODE IMMERSION PROBE (NTC) TERMINATION Probe for measurements in liquids, powders and gas NTC sensor position 4.8 3 L = 1.5m ~12 TP207 ~33 45 CODE POINTED PROBE (NTC) TERMINATION 4 Pointed/Immersion stainless steel probe for food industry applications L = 1.5m TP207P 125 15 67 CODE AMBIENT TEMPERATURE (AIR) PROBE (NTC) TERMINATION 3 Probe for ambient temperature (air) fast measuring L = 1.5m TP207A 125 ~10 HD206S1 L = 1.5m 109 HD206S1 PC – MINI DATALOGGER RS232C CONNECTION CABLE HD206/54 L = 1.5m 68 14 TEMPERATURE AND RELATIVE HUMIDITY COMBINED PROBE 4 Models with Display HD207 Internal Temperature sensor HD207-1 Temperature sensor placed under the front cover 199.9 199.9 Optional temperature probe cable L=1.5m Optional temperature probe cable L=1.5m IP54 IP67 HD206/54 RS232C HD206/54 RS232C HD206-1 Relative Humidity and Temperature sensor placed under the front cover HD206-2 Relative Humidity and Temperature probe HD206S1 199.9 199.9 IP67 IP54 HD206/54 RS232C HD206/54 RS232C Combined probe HD206S1cable L = 1.5m 69 Models without Display HD227 Internal Temperature sensor IP67 HD227-1 Temperature sensor placed under the front cover Optional temperature probe cable L=1.5m Optional temperature probe cable L=1.5m IP54 HD206/54 RS232C HD206/54 RS232C HD206S1 HD226-1 Relative Humidity and Temperature sensor placed under the front cover Optional temperature probe cable L=1.5m IP54 HD206/54 RS232C 70 IP67 HD206/54 RS232C HD206S1 cable L = 1.5m Table of Contents Description ....................................................................................................................3 Keyboard Protection Cover...........................................................................................5 Connecting the External Probes ....................................................................................5 View (for HD206… and HD207… models).................................................................6 Programming from Keyboard (for HD206… and HD207… models) ..........................6 Logging (for HD206… and HD207… models) ..........................................................14 Logging (for HD226… and HD227… models) ..........................................................16 Low Battery Indication ...............................................................................................18 How to Replace the Battery ........................................................................................18 Connecting to a PC .....................................................................................................21 DELTALOG2® ...........................................................................................................23 DELTALOG2 Setup ........................................................................................23 Uninstall DELTALOG2 ..................................................................................24 Preliminaries - Starting DeltaLog2 ..................................................................24 Definition of Functional Areas ........................................................................25 Instrument Setup ..............................................................................................38 Reading Measurements in Real Time on a PC.................................................41 Logging Start and Stop ....................................................................................43 Data Dump.......................................................................................................43 Data View in Graph or Table Format ..............................................................44 Endless Memory ..............................................................................................47 71 Data Archive ....................................................................................................51 Instrument Manager.........................................................................................54 Troubleshooting...............................................................................................56 Calibration of the Relative Humidity Probe (HD206-2 and HD226-2 only)...57 Technical Specifications .............................................................................................63 Ordering Code.............................................................................................................65 Specifications of the Minidatalogger Optional Probes ...............................................67 Models with Display ...................................................................................................69 Models without Display ..............................................................................................70 CE Conformity 72 Safety EN61000-4-2, EN61010-1 level 3 Electrostatic Discharge EN61000-4-2 level 3 Electric Fast Transients EN61000-4-4 level 3, EN61000-4-5 level 3 Voltage Variation EN61000-4-11 Electromagnetic Interference Susceptibility IEC1000-4-3 Electromagnetic Interference Emission EN55022 class B