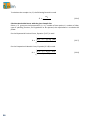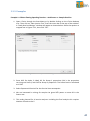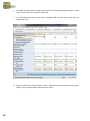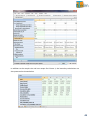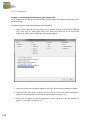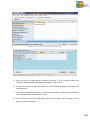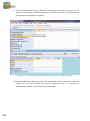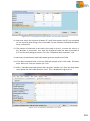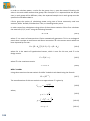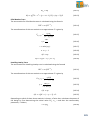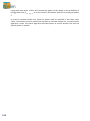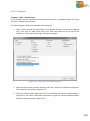
1
Power and Sample Size for Group Sequential Trials Version 2.0 User Manual 1 nTerim 2.0 User Manual Statistical Solutions Ltd. 4500 Airport Business Park, Cork, Ireland Web: www.statsol.ie Email: [email protected] Tel: +353 21 4839100 Fax: +353 21 4840026 Stonehill Corporate Center, Suite 104, 999 Broadway, Saugues, MA 01906 Web: www.statsolusa.com Email: [email protected] Tel: +1 (781) 231 7680 Fax: +1 (781) 231 7684 Printed in the Republic of Ireland No part of this manual may be reproduced, stored in a retrieval system, transmitted, translated into any other language, or distributed in any form by any means without prior permission of Statistical Solutions Ltd. Statistical Solutions Ltd. nTerim 2.0® License Agreement IMPORTANT: READ BEFORE PROCEEDING WITH INSTALLATION THIS DOCUMENT SETS FORTH THE TERMS AND CONDITIONS OF THE LICENSE AND THE LIMITED WARRANTY FOR nTerim®. PROCEEDING WITH THIS INSTALLATION CONSTITUTES YOUR ACCEPTANCE OF THIS LICENSE AGREEMENT WITH RESPECT TO ALL ACCOMPANYING nTerim® SOFTWARE RECEIVED BY YOU. IF YOU DO NOT ACCEPT THIS AGREEMENT, YOU MAY RETURN THIS SOFTWARE UNDAMAGED WITHIN 10 DAYS OF RECEIPT AND YOUR MONEY WILL BE REFUNDED. 1. GRANT OF LICENSE. In consideration of payment of the license fee, which is part of the price you paid for this product, Statistical Solutions Ltd., as LICENSOR, grants to you, the LICENSEE, a non-exclusive right to use this copy of nTerim ("SOFTWARE") on a single COMPUTER (i.e., with a single CPU) at a single location. THIS LICENSE SHALL NOT APPLY TO AND DOES NOT PERMIT THE ELECTRONIC TRANSFER OF THE SOFTWARE FROM ONE COMPUTER TO ANOTHER unless a Network Addendum to the Agreement is executed by Licensee and returned to LICENSOR. Licensor reserves all rights not expressly granted to LICENSEE. LICENSOR also agrees to provide free maintenance of the SOFTWARE for sixty (60) days. 2. TRIAL PERIOD. LICENSEE shall have sixty (60) days, commencing on day of receipt by LICENSEE, in which to return the SOFTWARE provided hereunder and shall be entitled to receive a full refund. All refunds are contingent upon receipt of LICENSOR, in undamaged condition, of all materials provided hereunder. 3. OWNERSHIP OF SOFTWARE. LICENSOR retains title to and ownership of the SOFTWARE. This LICENSE is not a sale of the original SOFTWARE or any copy. 4. COPY RESTRICTIONS. This SOFTWARE and the accompanying written materials are copyrighted. Unauthorised copying of the SOFTWARE, including SOFTWARE which has been modified, merged, or included with other software, or of the written materials is expressly forbidden. You may be held legally responsible for any copyright infringement that is caused or encouraged by your failure to abide by the terms of the LICENSE. Subject to these restrictions, you may make one (1) copy of the SOFTWARE solely for backup purposes. You may reproduce and include the copyright notice on the backup copy. 5. USE RESTRICTIONS. As the LICENSEE, you may physically transfer the SOFTWARE from one computer to another provided that the SOFTWARE is used on only one computer at a time. You may not translate, reverse engineer, decompile or disassemble the software. You may not distribute copies of the SOFTWARE or accompanying written materials to others. 6. TRANSFER RESTRICTIONS. This SOFTWARE is licensed only to you, the LICENSEE and may not be transferred to anyone without the prior written consent of LICENSOR. Any authorised transferee of the SOFTWARE shall be bound by the terms and conditions of this Agreement. 7. TERMINATION. This LICENSE is effective until terminated. This LICENSE will terminate automatically without notice from LICENSOR if you fail to comply with any provision of this LICENSE. Upon termination, you shall destroy the written materials and all copies of the SOFTWARE, including modified copies, if any, and shall notify LICENSOR of same. 8. GOVERNING LAW, MISCELLANEOUS. This Agreement is governed by the laws of Ireland. If any of the provisions or portions thereof of this License Agreement are invalid under any applicable statute or rule of law, they are to that extent to be deemed omitted. 9. DECISION OF ARBITRATORS. At the option of the LICENSOR, any dispute or controversy shall be finally resolved in accordance with the rules of the International Chamber of Commerce. The Arbitration shall be conducted in Ireland with 3 Arbitrators (unless Licensor opts for 1 Arbitrator). 10. LIMITED WARRANTY AND REMEDY. LICENSOR warrants that for ninety (90) days after purchase of SOFTWARE by the LICENSEE, SOFTWARE shall reasonably perform in accordance with the accompanying documentation (manuals and computer aided instructions). LICENSEE'S SOLE AND EXCLUSIVE REMEDY for a failure of SOFTWARE to perform in accordance with accompanying documentation is for LICENSEE to return SOFTWARE to LICENSOR and to notify LICENSOR in writing of the non-performance within ninety (90) days of purchase of the media. LICENSOR's sole obligation within a reasonable time after receiving notification of non-performance shall be, at LICENSOR's option to (i) correct demonstrable and significant program errors, (ii) provide the LICENSEE with functionally equivalent software, or (iii) provide or authorise a refund. 11. DISCLAIMER OF OTHER WARRANTIES. THE LICENSOR'S LIMITED WARRANTY SET FORTH IN PARAGRAPH 10 IS IN LIEU OF ANY OTHER WARRANTIES. LICENSOR DISCLAIMS ANY IMPLIED WARRANTY INCLUDING, BUT NOT LIMITED TO ANY IMPLIED WARRANTY OF FITNESS FOR A PARTICULAR PURPOSE OR MERCHANTABILITY. LICENSOR DISCLAIMS ALL OTHER WARRANTIES INCLUDING, BUT NOT LIMITED TO , THOSE MADE BY DISTRIBUTORS AND RETAILERS OF LICENSOR'S SOFTWARE. THIS LICENSE AGREEMENT GIVES YOU SPECIFIC LEGAL RIGHTS. YOU MAY HAVE OTHER RIGHTS, WHICH VARY FROM STATE TO STATE. 12. LICENSEE RESPONSIBILITY FOR SELECTION OF SOFTWARE. LICENSEE is solely responsible for selecting of SOFTWARE to achieve the LICENSEE'S intended results or for particular applications. 13. DISCLAIMER. IN NO EVENT SHALL LICENSOR OR ITS SUPPLIERS BE LIABLE TO LICENSEE FOR ANY SPECIAL INDIRECT, INCIDENTAL OR CONSEQUENTIAL DAMAGES IN ANY WAY RELATING TO THE USE OR ARISING OUT OT THE USE OF SOFTWARE, EVEN IF LICENSOR HAS BEEN ADVISED OF THE POSSIBILITY OF SUCH DAMAGES. LICENSOR'S LIABILITY SHALL IN NO EVENT EXCEED THE TOTAL AMOUNT OF THE PURCHASE PRICE/LICENSEE FEE ACTUALLY PAID BY THE LICENSEE FOR THE USE OF SOFTWARE. Acknowledgements We would like to sincerely thank all those who made the production of Statistical Solutions nTerim 2.0 possible. The Statistical Solutions Team: Eoghan Murphy, Andrew Grannell, Brian O’Toole, Aisling Noonan, Brendan Nyhan, Diana Scriven, Helen Murphy, Kevin Connolly, Caroline Costello, Kevin Sievewright, Mary Byrne. Special Thanks to: Brian Sullivan and Niall Fitzgerald. Contents Chapter 1 ................................................................................................................................... 1 Systems Guide ........................................................................................................................... 1 1.1 System Requirements ..................................................................................................... 2 1.2 Validation ......................................................................................................................... 2 1.3 Support............................................................................................................................. 2 Chapter 2 ................................................................................................................................... 4 Getting Started Guide ............................................................................................................... 4 2.1 Starting nTerim ................................................................................................................ 5 2.2 Home Window ................................................................................................................. 5 2.3 Menu Bar.......................................................................................................................... 6 2.4 Opening a New Design ..................................................................................................... 8 2.5 Selecting an nQuery Advisor Design Table through nTerim .......................................... 12 2.6 Using the Assistant Tables ............................................................................................. 13 2.7 Plotting ........................................................................................................................... 14 2.8 Help and Support ........................................................................................................... 17 Chapter 3 ................................................................................................................................. 18 Group Sequential / Interim Design ......................................................................................... 18 3.1 Two Means ..................................................................................................................... 19 3.1.1. Introduction ........................................................................................................... 19 3.1.2. Methodology Section ............................................................................................. 21 3.1.3. Examples ................................................................................................................ 23 3.2 Two Proportions............................................................................................................. 31 3.2.1. Introduction ........................................................................................................... 31 3.2.2. Methodology.......................................................................................................... 31 3.2.3. Examples ................................................................................................................ 36 3.3 Survival ........................................................................................................................... 43 3.3.1. Introduction ........................................................................................................... 43 3.3.2. Methodology.......................................................................................................... 43 3.3.3. Examples ................................................................................................................ 47 Chapter 4 ................................................................................................................................. 56 Fixed Term Design ................................................................................................................... 56 4.1 One-Way Repeated Measures Contrast (Constant Correlation) ................................... 57 4.1.1. Introduction ........................................................................................................... 57 4.1.2. Methodology.......................................................................................................... 58 4.1.3. Examples ................................................................................................................ 59 4.2 Repeated Measures Design for Two Means .................................................................. 71 4.2.1. Introduction ........................................................................................................... 71 4.2.2. Methodology.......................................................................................................... 72 4.2.3. Examples ................................................................................................................ 73 4.3 Repeated Measure for Two Proportions ....................................................................... 87 4.3.1. Introduction ........................................................................................................... 87 4.3.2. Methodology.......................................................................................................... 88 4.3.3. Examples ................................................................................................................ 89 4.4 One-Way Analysis of Variance (ANOVA)...................................................................... 100 4.4.1. Introduction ......................................................................................................... 100 4.4.2. Methodology........................................................................................................ 101 4.4.3. Examples .............................................................................................................. 102 4.5 Analysis of Covariance (ANCOVA) ................................................................................ 109 4.5.1. Introduction ......................................................................................................... 109 4.5.2. Methodology........................................................................................................ 110 4.5.3. Examples .............................................................................................................. 112 4.6. Multivariate Analysis of Variance (MANOVA) ............................................................ 122 4.6.1. Introduction ......................................................................................................... 122 4.6.2. Methodology........................................................................................................ 123 4.6.3. Examples .............................................................................................................. 127 Chapter 5 ............................................................................................................................... 143 References ............................................................................................................................. 143 Chapter 1 Systems Guide 1 1.1 System Requirements As with most software packages, there are a set of requirements on the various aspects of the users machine in order to achieve full functionality. For nTerim 2.0, the set of system requirements are listed in full below. Operating System: Windows 7 or later Windows Vista Windows XP (including .NET Framework Service Pack 2.0 or higher) Windows Server 2008 (R2 or later) Windows Server 2008 Windows Server 2003 Processor: Either 32-bit or 64-bit processor Minimum of 450MHz processor Hard Disc: 100MB for the nTerim software package (review when completed) RAM: 512MB Additional Software: Microsoft .NET Framework Service Pack 3.5 Note: Administrative privileges to the end users machine will be required for installation process only. 1.2 Validation The calculations contained within this software package have been widely and exhaustively tested. Various steps of each calculation along with the results have been verified using many text books and published journal articles. Furthermore, the calculations contained within this software package have been compared to, and verified against various additional sources when possible. 1.3 Support For issues pertaining to the methodology and calculations of each test in nTerim, there is a brief outline of how each test is calculated in the Methodology section of each test chapter of the manual. There are accompanying references for each test throughout the text and can be located in the References section of the manual. If further clarification is required, please contact our support statisticians by email at [email protected]. 2 If there are any issues with any aspect of the installation process, there are three approaches you can take: (i) you can check the system requirements outline in Section 1.1 of this manual, (ii) look up the installation help and FAQ’s on our website: http://www.statistical-solutions-software.com/, and (iii) you can email us for technical help at [email protected]. In order to help us address your questions in the best way possible, the more information you can provide us with, the better. If it is a technical question about one of our test tables, screen shots of the completed tables of issues you are having are very helpful. In order to address any installation issues or technical questions relating to the users machines, the more information provided about the type of machine in question can speed up the process by a great deal. Screen shots of installation issues are very helpful to us in solving any issue you may have. 3 Chapter 2 Getting Started Guide 4 This chapter is a guide to help users get acquainted with the layout and various aspects of the interface of nTerim 2.0. This chapter aims at getting the user a firm understanding of how to approach study design using nTerim, in a quick and easy way. Every aspect of the nTerim interface will be presented in this chapter, from the home window to the various plotting menus and side tables. 2.1 Starting nTerim There are two main ways to open nTerim on your desktop. By double-clicking on the desktop icon, nTerim will be automatically launched. Alternatively, if you chose not to have a desktop shortcut to nTerim, you can find it by clicking on the Windows Start button, and then select “All Programs”. A list of all the programs on the user’s machine will be listed in alphabetical order. You can locate nTerim under the title “nQuery Advisor + nTerim 2.0”. Click on this folder, and then select “nQuery Advisor + nTerim 2.0” to launch the program. 2.2 Home Window Once the user has launched nTerim, the home window will appear as illustrated below in Figure 2.2.1. From the home window, there are several options open to the user depending on what they want to do. The user can open a new fixed term or interim design table, open a previous design that was saved before, access the manual or access the Statistical Solutions support website for help or guidance. Figure 2.2.1. Home Window 5 2.3 Menu Bar The first aspect of the interface we will review is the menu bar and all the options available. There are eight options on the menu bar: File, Edit, View, Assistants, Plot, Tools, Window and Help. These are highlighted in Figure 2.3.1 below. Figure 2.3.1. Menu Bar The File menu allows the user to open a new or previously saved design table, as well as enabling the user to save a design and allowing the user to exit nTerim whenever they wish. Design tables can be saved as .nia format, which is the Statistical Solutions file format for nTerim. The Edit menu enables to user to fill a design table using the Fill Right option. This is where the user, when defining multiple columns, enters certain information into a column and can copy this information across the remaining empty columns. The View menu is initially unavailable until the user opens a design table. Once a table has been opened, several options appear enabling the user to view various plots, and toggle between various assistant tables, help/guides cards and notes. The Assistants menu is initially unavailable until the user opens a design table. Once a table has been opened, the menu enables the user to open and toggle between various side tables depending on the design table. Another side table located under the Assistants menu is the Specify Multiple Factor table. This table enables the user to specify a range of designs (or columns in a table). The Plot menu is initially unavailable until the user opens a design table. Once a table has been opened, the user can use this menu to create certain plots such as Power vs. Sample Size plots, Boundaries Plots and Spending Function Plots. The Tools menu allows the user to define certain settings before running any analysis such as defining the minimum cell count and outlining various assumptions in relation to group proportions and means. This also enables the user to save design tables and Looks tables as images for transporting. The Window menu is initially unavailable until the user opens a design table. Once a table has been opened, the menu enables the user to toggle between the various tables and plots they may be working on during their session. The Help menu gives access to the nTerim manual and supplies the nTerim version information and license agreement. 6 Below is a complete list of menu options from the menu bar: File –> New Open Fresh Table Save Save As Close Test Exit Edit –> Fill Right Clear Table Clear Column Clear Selection View –> [Option not available until a test window is opened] Looks Specify Multiple Factor Table Covariance Matrix (MANOVA design table only) Boundaries Graph Power vs. Sample Size Plot Boundaries Plot Spending Function Plot Output Help Notes Assistants –> Specify Multiple Factor Table Compute Effect Size Randomisation Distribution Function Windows Calculator Plot –> Power vs. Sample Size Plot Spending Function Plot Boundaries Plot Tools –> Print Main Table to Clipboard Print Looks Table to Clipboard Settings Windows –> [Close All if no test window open] Close All {List of Open Windows} Help –> Help About 7 2.4 Opening a New Design The next aspect of the interface we will review is opening a new design, both Fixed term and Interim. There are two ways in which the user can open a new design in nTerim; (i) by clicking on the File > Open option or (ii) using the shortcut buttons highlighted in Figure 2.4.1 below. Figure 2.4.1. New Design Tabs By using either of the steps outlined above, the user will then be presented with the “Study Goal and Design” window, as shown in Figure 2.4.2 below. In relation to selecting the term of their designs, the user must select either Fixed or Interim. The user will then be presented with a list of options to the type of design they require. Figure 2.4.2. Open New Fixed Term Design The options for Fixed term designs are presented in Figure 2.4.2 For example, If you want to choose the Analysis of Covariance (ANCOVA) table, you must first select “Means” as the Goal, “>Two” as the No. of Groups and “Test” as the Analysis Method. You can then select Analysis of Covariance (ANCOVA) from the list of tests. Once you click “OK”, the design table will be launched. 8 In this example, the Analysis of Covariance (ANCOVA) table was selected. A screen shot of this design table is given in Figure 2.4.3. Figure 2.4.3. Example of Fixed Term Design Interface As it can be seen from Figure 2.4.3, the Fixed term design window is split into three main sections: (i) the test table, (ii) Assistant Tables & Output and (iii) Help/Guide Cards. The main table represents the test table. In this example it is an ANCOVA table. Values for various parameters can be entered by the user. For some tests, additional values need to be calculated. This is provided for by using the Assistants tables, found at the bottom half of the interface. Additional calculations can be done and the appropriate values can be transferred from the Assistants tables to the main test table. Once all the appropriate information has been entered in the test table, the user must select the appropriate calculation to run, i.e. whether you want to solve for power given a specified sample size, or solve for sample size given a specified power. The user can select the appropriate calculation to run from the drop-down menu between the main test table and the Assistants table. Once the appropriate test is selected, the user must click on “Run” to run the analysis. If multiple columns have been specified by the user, there is an option to run the calculation for all the columns. This is achieved by simply ticking the “All columns” box beside the “Run” button before clicking “Run”. This will tell nTerim to concurrently run the calculations for all columns. Then, by simply clicking on a column, the output statement will be presented. 9 Similarly to opening a Fixed Term test, if the user clicks on the “New Interim Test” button below the menu bar, the “Study Goal and Design” menu window will appear with the list of interim designs available in nTerim. This “Study Goal and Design” window is presented below in Figure 2.4.4. Figure 2.4.4. Open New Interim Design The options for Interim term designs are presented in Figure 2.4.4. For example, if you want to choose the Group Sequential Test of Two Means table, you must first select “Means” as the Goal, “>Two” as the No. of Groups and “Test” as the Analysis Method. You can then select Group Sequential Test of Two Means from the list of tests. Once you click “OK”, the design table will be launched. As it can be seen from Figure 2.4.5, the Interim term design window is split into four main sections: (i) the test table, (ii) Looks Table & Output (iii) Boundary Graph and (iv) Help/Guide Cards. The main table represents the test table. In this example it is a Group Sequential Test of Two Means table. The top half of the main test table is for various parameters to be entered by the user. The bottom half is for the user to define the interim design such as number of looks, spending function, futility and so on. Once all the appropriate information has been entered in the test table, the user must select the appropriate calculation to run, i.e. whether you want to solve for power given a specified sample size, or solve for sample size given a specified power. The user can select the appropriate calculation to run from the drop-down menu between the main test table and the Looks table. Once the appropriate test is selected, the user must click on “Run” to run the analysis. 10 Figure 2.4.5. Example of an Interim Design Window If multiple columns have been specified by the user, there is an option to run the calculation for all the columns. This is achieved by simply ticking the “All columns” box beside the “Run” button before clicking “Run”. This will tell nTerim to concurrently run the calculations for all columns. Then, by simply clicking on a column, the output statement will be presented as well as the boundary graph for each column in the bottom right hand corner of the interface. 11 2.5 Selecting an nQuery Advisor Design Table through nTerim A new feature added to nTerim 2.0 is the ability to open an nQuery design table through nTerim. This enables the user to seamlessly transition between nTerim and nQuery. By opening the “Study Goal and Design” window using the options outlined in the previous section (Section 2.4), the user has the full range of design tables available in both nTerim and nQuery at their disposal. Figure 2.5.1. Study Goal and Design Window As shown in the “Study Goal and Design” window in Figure 2.5.1 above, the user has selected a One sample t test. This test is available in nQuery, therefore a message has appeared at the bottom of the “Study Goal and Design” window stating “Selected test is only available in nQuery Advisor. Clicking OK will open the test in nQuery Advisor”. This message is highlighted in the red box in Figure 2.5.1. Once the user clicks “OK”, this will prompt nQuery to open the specified test. 12 2.6 Using the Assistant Tables The Assistants tables are a new feature added to nTerim to aid the user in calculating various additional components of certain study designs. These tables are only associated with certain design tables. With nTerim, we know which Assistant table is associated with each test so they automatically pop up once a design table is opened. Figure 2.6.1. Assistants Menu Options The full list of Assistants tables is given in the menu bar, as shown in Figure 2.6.1, including; Compute Effect Size and Specify Multi Factor table. A very common Assistant table that is regularly required is the compute effect size table. Once the appropriate information is entered, nTerim will calculate the values required for the main test table. Once the user is happy with the values entered and calculated, they can click “Transfer” and the required values from the Assistant table will be transferred up to the main design table. An example of the “Compute Effect Size” assistant table is shown below in Figure 2.6.2. Figure 2.6.2. Example of Effect Size Assistant Table The “Specify Multi Factor” assistant table is used to define a range values to be filled in across several columns in the test design table. Once the user fills in this table with the range of values they require, by clicking “Run”, nTerim will fill out the required number of columns to satisfy the outlined range of parameters. 13 2.7 Plotting A plotting menu has been introduced to nTerim 2.0 for all the additional graphing features that have been added. Additional features have been added to the Power vs. Sample Size and Boundary plots including multiple plotting capabilities, highlighting various boundary functions of interest and scrolling features to enable users to pin-point exact values. The plotting menu bar is displayed in Figure 2.7.1 below. Figure 2.7.1. Plot Menu Options In relation to Interim designs, a boundary plot is automatically displayed after running the calculations. This is always displayed on the bottom right hand corner of the nTerim window. An example of an O’Brien-Fleming boundary is given in Figure 2.7.2 below. Figure 2.7.2. Example of a Boundary Plot In relation to Power vs. Sample Size plots, there is also a shortcut button provided in the tool bar, just below the menu bar as highlighted in Figure 2.7.3 below. 14 In order to use this function, the user must highlight the columns which they would like to compare and then click on the “Plot Power vs. Sample Size” button. Figure 2.7.3. Power vs. Sample Size Plot Shortcut Tab An example of the new Power vs. Sample Size plot is displayed in Figure 2.7.4 below. This plot shows three columns being compared. The legend on the right side of the window can be altered to label each line appropriately. Figure 2.7.4. Power vs. Sample Size Plot A crosshair is provided to enable the user to pin-point exact values for power and sample size at various points on each line. These exact values are given in the box in the bottom right hand corner of the plot window. 15 In order to save a plot in nTerim, simply right click anywhere on the plot window and a list of options will be presented as illustrated in Figure 2.7.5. The options include “Save Image”, “Print”, “Print Preview” and “Page Setup”. Select “Save Image” from this list to save the plot. Figure 2.7.5. Saving a plot A separate window will appear prompting the user to select the folder in which they would like to save the plot. Once the user has chosen the folder to save the plot in, they can select what format to save in. The format options available to save a plot are in a .JPEG or .PNG format. Once the location and format have been selected by the user, simply click “Save” to save the plot. This image can now be imported to many Microsoft applications such as MS Word for reporting or MS Powerpoint for presentation purposes. 16 2.8 Help and Support For issues pertaining to the methodology and calculations of each test in nTerim, there is a brief outline of how each test is calculated in the Methodology section of each test chapter of the manual. There are accompanying references for each test throughout the text and these can be located in the References section of the manual. In the nTerim window there are two useful shortcuts that have been added to the tool bar. The first shortcut is the “Open Manual” button which has been added to help the user find the appropriate chapter of the manual much easier. If the user is working in a particular design window, for example the MANOVA window, and the user clicks on the “Open Manual” button, a PDF of the MANOVA chapter in the manual will automatically open, providing the user with the background and technical information on MANOVA as well as examples in nTerim. The second shortcut is the “Statistical Solutions Support” button. If further clarification on any aspect of nTerim is required, please contact our support statisticians by clicking on this button. This shortcut takes the user to the Statistical Solutions support website where queries can be entered and sent directly to our support team. These support shortcuts are highlighted in the nTerim tool bar in Figure 2.8.1 below. Figure 2.8.1. Manual and Support Shortcut Tabs If there are any issues with any aspect of the installation process, there are three approaches you can take: (i) you can check the system requirements outline in Section 1.1 of this manual, (ii) look up the installation help and FAQ’s on our website: http://www.statistical-solutions-software.com/, and (iii) you can email us for technical help at [email protected]. In order to help us address your questions in the best way possible, the more information you can provide us with, the better. If it is a technical question about one of our test tables, screen shots of the completed tables of issues you are having are very helpful. In order to address any installation issues or technical questions relating to the users machines, the more information provided about the type of machine in question can speed up the process by a great deal. Screen shots of installation issues are very helpful to us in solving any issue you may have. 17 Chapter 3 Group Sequential / Interim Design 18 3.1 Two Means 3.1.1. Introduction nTerim 2.0 is designed for the calculation of Power and Sample Size for both Fixed Period and Group Sequential design. In relation to Group Sequential designs, calculations are performed using the Lan-DeMets alpha spending function approach (DeMets & Lan, 1984; DeMets & Lan, 1994) for estimating boundary values. Using this approach, boundary values can be estimated for O'Brien-Fleming (O’Brien & Fleming, 1979), Pocock (Pocock, 1977), Hwang-Shih-DeCani (Hwang, Shih & DeCani, 1990) and the Power family of spending functions. Calculations follow the approach of Reboussin et al (1992) and Jennison & Turnbull (2000). Calculations can be performed for studies that involve comparisons of means, comparisons of proportions and survival studies as well as early stopping for Futility. Group Sequential Designs Group Sequential designs differ from Fixed Period designs in that the data from the trial is analyzed at one or more stages prior to the conclusion of the trial. As a result the alpha and beta values applied at each analysis or `look', an adjusted is needed to preserve the overall type-1 and type-2 errors. The alpha and beta values used at each look are calculated based upon the test hypothesis, the spending function chosen, the number of looks to be taken during the course of the study as well as the overall type-1 and type-2 error rates. For a full introduction to group sequential methods see Jennison & Turnbull (2000) and Chow et al (2008). Spending Function There are four alpha and beta spending functions available to the user in nTerim 2.0 as well as an option to manually input boundary values. As standard all alpha spending functions have the properties that ( ) and ( ) . Similarly, all beta spending functions have the properties that ( ) and ( ) . Functionally the alpha and beta spending functions are the same. In Table 3.1.1 we list the alpha spending functions available in nTerim 2.0. Table 3.1.1. Spending Function Equations O’Brien-Fleming ( ) Pocock ( ) ( ( √ ( )) ) ) ( ) Power Hwang-Shih-DeCani ( ( ) [ ( ( ) ] ) The parameter represents the time elapsed in the trial. This can either be as a proportion of the overall time elapsed or a proportion of the sample size enrolled. 19 The common element among most of the different spending functions is to use lower error values for the earlier looks. By doing this it means that the results of any analysis will only be considered significant in an early stage if it gives an extreme result. Boundaries The boundaries in nTerim 2.0 represent the critical values at each look. These boundaries are constructed using the alpha and beta spending functions. Users in nTerim 2.0 are given the option to generate boundaries for early rejection of the null hypothesis, , using the alpha spending function, or to generate boundaries for early rejection of either the null or alternative hypothesis, or , using a combination of both the alpha and beta spending functions. The notion of using an alpha spending function approach to generate stopping boundaries for early rejection of was first proposed by Lan and DeMets (1983), we refer to such boundaries in nTerim 2.0 as efficacy boundaries. Building on the work of Lan and DeMets, Pampallona, Tsiatis, and Kim (1995, 2001) later put forward the concept of using a beta spending approach to construct boundaries for early rejection of , we refer to these boundaries in nTerim as futility boundaries. Essentially, if a test statistic crosses an efficacy boundary then it can be concluded that the experimental treatment shows a statistically significant effect, the trial can be stopped with rejection of the null hypothesis. If the test statistic crosses a futility boundary then this indicates with high probability that an effect will not be found, that the trial can be terminated by rejecting the alternative hypothesis. In the case where the user wishes to generate boundaries for early rejection of either the null or alternative hypothesis, or , they are given two options; either to have the boundaries binding, or non-binding. With binding boundaries, if the test statistic crosses the futility boundary, the test must be stopped, otherwise the type-1 error may become inflated. The reason for this is that there is an interaction between the efficacy and futility boundaries in their calculation that could cause the efficacy boundary to shift. In the case of non-binding boundaries; the efficacy boundaries are calculated as normal, that is, as if the futility boundaries did not exist. This eliminates the danger of inflating the type-1 error when the futility boundary is overruled. The downside of the non-binding case is that it may increase the required sample size relative to the binding case. The boundaries calculated in nTerim 2.0 follow the procedures outlined by Reboussin et al (1992) and Jennison & Turnbull (2000). 20 3.1.2. Methodology Section The variables are defined as Symbol Description Probability of Type I error Probability of Type II error Power of the Test Group Means Group Standard Deviations Group Sample Sizes Ratio of to Drift Parameter Number of Time-points (Looks) Calculate Sample Sizes for a given Power Using the number of time-points ( ), number of sides, type of spending function, the ), the drift parameter hypothesis to be rejected, the type 1 error ( ), and the power ( ( ) can be obtained using the algorithms and procedures outlined by Reboussin et al (1992) and Jennison & Turnbull (2000). The test statistic is defined as; √ {3.1.1} The user supplies the means ( ), the group standard deviations ( , ) and either or . Since it follows that a value of indicates equal sample sizes. The approach to solving this problem is dependent on what information the user supplies. Given any two of or , the unknown is obtained by solving Equation {3.1.1}. Calculate Attainable Power with the given Sample Sizes Given , , group means ( ), group standard deviations ( ), (or ), time-points and type of spending function. The requirement is to obtain the power. The steps are: Obtain by solving Equation {3.1.1} (given that and are known), Obtain power using the algorithms and procedures outlined by Reboussin et al (1992) and Jennison & Turnbull (2000) 21 Calculate Means given all other information Given , , group standard deviations ( ), (or ), power ( type of spending function. The requirement is to obtain either or steps are: Obtain by solving Equation {3.1.1} (given that Equation {3.1.1} can be expressed as a quadratic in unknown . By default, nTerim assumes that 22 or ), time-points and , given the other. The and are known), . The roots give the and will select the appropriate root. 3.1.3. Examples Example 1: O'Brien-Fleming Spending Function This example is adopted from Reboussin et al (1992) using the O'Brien-Fleming spending function. 1. Open nTerim through the Start Menu or by double clicking on the nTerim desktop icon. Then click on “New Interim Test” from the tool bar at the top of the window. A “Study Goal and Design” window will appear as shown below. Select the options as mapped out in Figure 3.1.1, then Click “OK”. Figure 3.1.1. Study Goal and Design Window 2. Now you have opened the test table, as illustrated in Figure 3.1.2, you can begin entering values. 3. Enter 0.05 for alpha, 2 sided, 220 for Group 1 mean, 200 for Group 2 mean. The difference in means is calculated as 20. 4. Enter 30 for Standard Deviation for Group 1 and Group 2. We are interested in solving for sample size given 90% power so enter 90 in the Power row. 23 5. This study planned for 4 interim analyses. Including the final analysis this requires Number of Looks to be 5. 6. The looks will be equally spaced and the O'Brien-Fleming spending function is to be used. There will be no truncation of bounds. Figure 3.1.2. Two Means Test Table 7. It is estimated that the cost per unit is roughly $250, so enter 250 in the Cost per sample unit row. 8. Once all the values have been entered, select “Calculate required sample size for given power” from the drop-down menu and click “Run”. 24 Figure 3.1.3. Completed Two Means Test Table 9. The boundaries calculated are shown in Figure 3.1.4. Figure 3.1.4. Boundary Table for Two Means Test 25 10. Finally, the boundaries calculated in the table in Figure 3.1.4 are automatically plotted as illustrated in Figure 3.1.5. Figure 3.1.5. Boundary Plot for Two Means Test By clicking on the Output tab at the bottom of the screen you can see a statement giving details of the calculation: “Sample sizes of 49 in group 1 and 49 in group 2 are required to achieve 90.36% power to detect a difference in means of 20 (the difference between group 1 mean, 1, of 220 and group 2 mean, 2, of 200) assuming that the common standard deviation is 30 using a 2sided z-test with 0.05 significance level. These results assume that 5 sequential tests are made and the O'Brien-Fleming spending function is used to determine the test boundaries. Drift: 3.29983” 26 Example 2: Pocock Spending Function and Unequal N’s This example is taken from Reboussin et al (1992) using the Pocock spending function. 1. Open nTerim through the Start Menu or by double clicking on the nTerim desktop icon. Then click on “New Interim Test” from the menu bar at the top of the window. A “Study Goal and Design” window will appear as shown below. Select the options as mapped out in Figure 3.1.6, then Click “OK”. Figure 3.1.6. Study Goal and Design Window 2. Setup the table as in the Example 1. 3. We will again use 5 looks but this time change the Spending Function to Pocock in the dropdown box. 27 Figure 3.1.7. Complete Two Means Test Table 4. Select Run and the sample size along with the boundary values will be calculated. 5. The boundaries that are calculated will be automatically plotted. Clicking on the Output tab at the bottom of the screen you can see a statement giving details of the calculation: “Sample sizes of 57 in group 1 and 57 in group 2 are required to achieve 90.33% power to detect a difference in means of 20 (the difference between group 1 mean, 1, of 220 and group 2 mean, 2, of 200) assuming that the common standard deviation is 30 using a 2sided z-test with 0.05 significance level. These results assume that 5 sequential tests are made and the Pocock spending function is used to determine the test boundaries. Drift: 3.55903” 6. In the main table, in Column 2, enter the same parameter values again except enter a value of 2 for the Ratio parameter. Don’t forget to change the spending function to Pocock. 7. Select Run and the sample size will be re-calculated as shown in Figure 3.1.8 below. 28 Figure 3.1.8. Comparison of two separate Means Tests 8. Also the boundary values will be recalculated and boundary plot will automatically be plotted as shown in Figure 3.1.9 and 3.1.10 below. Figure 3.1.9. Boundary Table for Column 2 29 Figure 3.1.10. Boundary Plot for Column 2 Likewise, by clicking on the Output tab at the bottom of the screen you can see a statement giving details of the calculation: Output Statement – Column 2: “Sample sizes of 43 in group 1 and 86 in group 2 are required to achieve 90.5% power to detect a difference in means of 20 (the difference between group 1 mean, 1, of 220 and group 2 mean, 2, of 200) assuming that the common standard deviation is 30 using a 2sided z-test with 0.05 significance level. These results assume that 5 sequential tests are made and the Pocock spending function is used to determine the test boundaries. Drift: 3.56942” 30 3.2 Two Proportions 3.2.1. Introduction nTerim 2.0 is designed for the calculation of Power and Sample Size for both Fixed Period and Group Sequential design. In relation to Group Sequential designs, calculations are performed using the Lan-DeMets alpha spending function approach (DeMets & Lan, 1984; DeMets & Lan, 1994) for estimating boundary values. Using this approach, boundary values can be estimated for O'Brien-Fleming (O’Brien & Fleming, 1979), Pocock (Pocock, 1977), Hwang-Shih-DeCani (Hwang, Shih & DeCani, 1990) and the Power family of spending functions. Calculations follow the approach of Reboussin et al (1992) and Jennison & Turnbull (2000). Calculations can be performed for studies that involve comparisons of means, comparisons of proportions and survival studies as well as early stopping for Futility. Group Sequential Designs Group Sequential designs differ from Fixed Period designs in that the data from the trial is analyzed at one or more stages prior to the conclusion of the trial. As a result the alpha and beta values applied at each analysis or `look', an adjusted is needed to preserve the overall type-1 and type-2 errors. The alpha and beta values used at each look are calculated based upon the test hypothesis, the spending function chosen, the number of looks to be taken during the course of the study as well as the overall type-1 and type-2 error rates. For a full introduction to group sequential methods see Jennison & Turnbull (2000) and Chow et al (2008). Spending Function There are four alpha and beta spending functions available to the user in nTerim 2.0 as well as an option to manually input boundary values. As standard all alpha spending functions have the properties that ( ) and ( ) . Similarly, all beta spending functions have the properties that ( ) and ( ) . Functionally the alpha and beta spending functions are the same. In Table 3.1.1 we list the alpha spending functions available in nTerim 2.0. Table 3.1.1. Spending Function Equations O’Brien-Fleming ( ) Pocock ( ) ( ( √ ( )) ) ) ( ) Power Hwang-Shih-DeCani ( ( ) [ ( ( ) ] ) The parameter represents the time elapsed in the trial. This can either be as a proportion of the overall time elapsed or a proportion of the sample size enrolled. 31 The common element among most of the different spending functions is to use lower error values for the earlier looks. By doing this it means that the results of any analysis will only be considered significant in an early stage if it gives an extreme result. Boundaries The boundaries in nTerim 2.0 represent the critical values at each look. These boundaries are constructed using the alpha and beta spending functions. Users in nTerim 2.0 are given the option to generate boundaries for early rejection of the null hypothesis, , using the alpha spending function, or to generate boundaries for early rejection of either the null or alternative hypothesis, or , using a combination of both the alpha and beta spending functions. The notion of using an alpha spending function approach to generate stopping boundaries for early rejection of was first proposed by Lan and DeMets (1983), we refer to such boundaries in nTerim 2.0 as efficacy boundaries. Building on the work of Lan and DeMets, Pampallona, Tsiatis, and Kim (1995, 2001) later put forward the concept of using a beta spending approach to construct boundaries for early rejection of , we refer to these boundaries in nTerim as futility boundaries. Essentially, if a test statistic crosses an efficacy boundary then it can be concluded that the experimental treatment shows a statistically significant effect, the trial can be stopped with rejection of the null hypothesis. If the test statistic crosses a futility boundary then this indicates with high probability that an effect will not be found, that the trial can be terminated by rejecting the alternative hypothesis. In the case where the user wishes to generate boundaries for early rejection of either the null or alternative hypothesis, or , they are given two options; either to have the boundaries binding, or non-binding. With binding boundaries, if the test statistic crosses the futility boundary, the test must be stopped, otherwise the type-1 error may become inflated. The reason for this is that there is an interaction between the efficacy and futility boundaries in their calculation that could cause the efficacy boundary to shift. In the case of non-binding boundaries; the efficacy boundaries are calculated as normal, that is, as if the futility boundaries did not exist. This eliminates the danger of inflating the type-1 error when the futility boundary is overruled. The downside of the non-binding case is that it may increase the required sample size relative to the binding case. The boundaries calculated in nTerim 2.0 follow the procedures outlined by Reboussin et al (1992) and Jennison & Turnbull (2000). 32 3.2.2. Methodology The variables are defined as Symbol Description Probability of Type I error Probability of Type II error Power of the Test Group Means Group Standard Deviations Group Sample Sizes Ratio of to Drift Parameter Number of Time-points (Looks) Calculate Sample Sizes for a given Power Using the number of time-points ( ), number of sides, type of spending function, the hypothesis to be rejected, the type 1 error ( ), and power ( ), the drift parameter ( ) can be obtained using algorithms and procedures outlined by Reboussin et al (1992) and Jennison & Turnbull (2000). The test statistic is defined as | ̅( √ where ̅ Since | ̅) ̅( . The user supplies the proportions ( it follows that a value of {3.2.1} ̅) ), and either or . indicates equal sample sizes and that ̅ . The approach to solving this problem is dependent on what information the user supplies. For the case of continuity correction the formula can be written as: | | √ ( ̅( ̅ )( ) ) {3.2.2} as per Fleiss (1981). The validity of this formula relies on the assumption of minimum expected cell count being above a pre-specified threshold. As a rule of thumb, the normal approximation to the binomial will hold if the following conditions are met: where ( ) ( ) {3.2.3} is a predefined threshold. 33 User supplies only The requirement is to obtain {3.2.2} obtained is: and . Using that ( ̅( ̅) ( The steps involved are: • Obtain • Solve Equation {3.2.4} for the result from Equation ̅( ̅) {3.2.4} ) and User supplies only and selects Continuity Correction If the user has selected to use the continuity correction then apply the formula from Fleiss et al (1980). ( to obtain . It follows that continuity correction then √ is then and ( ( )| ) | ) {3.2.5} . If the user has NOT selected to use . User specifies only or only When the user specifies , then Equation {3.2.1} can be re-expressed as a quadratic in from which two roots are obtained, one less than and one greater than . Similarly, if is specified the roots gives the values of . Calculate Attainable Power with the given Sample Sizes Given , proportions ( ) ( ), time-points and type of spending function, the requirement is to obtain the power. If the user has NOT selected to use continuity correction The steps are: • Obtain by solving Equation {3.2.1} (given that ̅ are known) • Obtain power using the algorithm by Reboussin et al (1992) and Jennison & Turnbull (2000) If the user has selected to use continuity correction The steps are: • Obtain by solving Equation {3.2.2} (given that ̅ are known) • Obtain power using the algorithm by Reboussin et al (1992) and Jennison & Turnbull (2000) 34 Calculate missing proportion given power and the other proportion. Calculate given In order to solve for given and all other information Equation {3.2.1} can be reexpressed as a quadratic with respect to the roots of which give . Similarly if is specified the roots give the values of . Calculate given with Continuity Correction In order to solve for given and all other information Equation {3.2.2} can be reexpressed as a quadratic with respect to the roots of which give . Similarly if is specified the roots give the values of . 35 3.2.3. Examples Example 1: Pocock Spending Function This example is adopted from Reboussin et al (1992) using Pocock spending function. 1. Open nTerim through the Start Menu or by double clicking on the nTerim desktop icon. Then click on “New Interim Test” from the menu bar at the top of the window. A “Study Goal and Design” window will appear as shown below. Select the options as mapped out in Figure 3.2.1, then Click “OK”. Figure 3.2.1. Study Goal and Design Window 2. Now you have opened the test table, as illustrated in Figure 3.2.2, you can begin entering values. 3. Enter 0.05 for alpha, 1 sided, 0.4 for Group 1 proportion, 0.6 for Group 2 proportion. The odds ratio is calculated as 2.25. 4. Select Off for the Continuity Correction. We are interested in solving for sample size given 90% power so enter 90 in the Power row. 5. This study planned for 4 interim analyses. Including the final analysis this requires Number of Looks to be 5. 36 6. The looks will be equally spaced and the Pocock spending function is to be used. There will be no truncation of bounds. 7. It is estimated that the cost per unit is roughly $180, so enter 180 in the Cost per sample unit row. Figure 3.2.2. Two Proportions Test Table 8. Once all the values have been entered, select “Calculate required sample size for given power” from the drop-down menu and click “Run”. 37 Figure 3.2.3. Completed Two Proportions Test Table 9. The boundaries calculated are shown in Figure 3.2.4. Figure 3.2.4. Boundary Table for Pocock Spending Function 38 10. Finally, the boundaries calculated in the table in Figure 3.2.4 are automatically plotted as illustrated in Figure 3.2.5. Figure 3.2.5. Boundary Plot for Two Proportions (one-sided) Test By clicking on the Output tab at the bottom of the screen you can see a statement giving details of the calculation: “Sample sizes of at least 129 in group 1 and 129 in group 2 are required to achieve 90.12% power to detect an odds ratio of 2.25 (for proportions of 0.4 in group 1 and 0.6 in group 2) using a 1-sided z-test with 0.05 significance level. These results assume that 5 sequential tests are made and the Pocock spending function is used to determine the test boundaries.” 39 Example 2: Power Family spending function with truncated bounds This example is an adaptation from Reboussin et al (1992) using Power Family spending function with truncated bounds. 1. Open nTerim through the Start Menu or by double clicking on the nTerim desktop icon. Then click on “New Interim Test” from the menu bar at the top of the window. A “Study Goal and Design” window will appear as shown below. Select the options as mapped out in Figure 3.2.6, then Click “OK”. Figure 3.2.6. Study Goal and Design Window 2. Enter 0.05 for alpha, 2 sided, 0.41 for Group 1 proportion, 0.465 for Group 2 proportion. The odds ratio is calculated as 1.25074. 3. Select On for the Continuity Correction. We are interested in solving for power given a sample size of 1400 per group so enter 1400 in the Group 1 size row. 4. This study planned for 4 interim analyses. Including the final analysis this requires Number of Looks to be 5. 5. The looks will be equally spaced and the Power Family spending function is to be used. Enter 3 for Phi. 6. For this example we want to truncate the boundaries so as not to be overconservative. Enter Yes for truncate bounds and then enter 3 for the value to truncate at. 7. Select “Calculate the attainable power with the given sample sizes” from the dropdown menu and then click “Run”. 40 Figure 3.2.7. Completed Two Proportions Test using Power Family Spending Function 8. Also the boundary values will be recalculated and boundary plot will automatically be plotted as shown in Figure 3.2.8 and 3.2.9 below. Figure 3.2.8. Boundary Table for Power Family Spending Function 41 Figure 3.2.9. Boundary Plot for Power Family Spending Function Finally, by clicking on the Output tab at the bottom of the screen you can see a statement giving details of the calculation: “Sample sizes of at least 1400 in group 1 and 1400 in group 2 are required to achieve 81.17% power to detect an odds ratio of 1.25074 (for proportions of 0.41 in group 1 and 0.465 in group 2) using a 2-sided continuity corrected test with 0.05 significance level. These results assume that 5 sequential tests are made and the Power Family spending function is used to determine the test boundaries.” 42 3.3 Survival 3.3.1. Introduction nTerim 2.0 is designed for the calculation of Power and Sample Size for both Fixed Period and Group Sequential design. In relation to Group Sequential designs, calculations are performed using the Lan-DeMets alpha spending function approach (DeMets & Lan, 1984; DeMets & Lan, 1994) for estimating boundary values. Using this approach, boundary values can be estimated for O'Brien-Fleming (O’Brien & Fleming, 1979), Pocock (Pocock, 1977), Hwang-Shih-DeCani (Hwang, Shih & DeCani, 1990) and the Power family of spending functions. Calculations follow the approach of Reboussin et al (1992) and Jennison & Turnbull (2000). Calculations can be performed for studies that involve comparisons of means, comparisons of proportions and survival studies as well as early stopping for Futility. Group Sequential Designs Group Sequential designs differ from Fixed Period designs in that the data from the trial is analyzed at one or more stages prior to the conclusion of the trial. As a result the alpha and beta values applied at each analysis or `look', an adjusted is needed to preserve the overall type-1 and type-2 errors. The alpha and beta values used at each look are calculated based upon the test hypothesis, the spending function chosen, the number of looks to be taken during the course of the study as well as the overall type-1 and type-2 error rates. For a full introduction to group sequential methods see Jennison & Turnbull (2000) and Chow et al (2008). Spending Function There are four alpha and beta spending functions available to the user in nTerim 2.0 as well as an option to manually input boundary values. As standard all alpha spending functions have the properties that ( ) and ( ) . Similarly, all beta spending functions have the properties that ( ) and ( ) . Functionally the alpha and beta spending functions are the same. In Table 3.1.1 we list the alpha spending functions available in nTerim 2.0. Table 3.1.1. Spending Function Equations O’Brien-Fleming ( ) Pocock ( ) ( ( √ ( )) ) ) ( ) Power Hwang-Shih-DeCani ( ( ) [ ( ( ) ] ) The parameter represents the time elapsed in the trial. This can either be as a proportion of the overall time elapsed or a proportion of the sample size enrolled. 43 The common element among most of the different spending functions is to use lower error values for the earlier looks. By doing this it means that the results of any analysis will only be considered significant in an early stage if it gives an extreme result. Boundaries The boundaries in nTerim 2.0 represent the critical values at each look. These boundaries are constructed using the alpha and beta spending functions. Users in nTerim 2.0 are given the option to generate boundaries for early rejection of the null hypothesis, , using the alpha spending function, or to generate boundaries for early rejection of either the null or alternative hypothesis, or , using a combination of both the alpha and beta spending functions. The notion of using an alpha spending function approach to generate stopping boundaries for early rejection of was first proposed by Lan and DeMets (1983), we refer to such boundaries in nTerim 2.0 as efficacy boundaries. Building on the work of Lan and DeMets, Pampallona, Tsiatis, and Kim (1995, 2001) later put forward the concept of using a beta spending approach to construct boundaries for early rejection of , we refer to these boundaries in nTerim as futility boundaries. Essentially, if a test statistic crosses an efficacy boundary then it can be concluded that the experimental treatment shows a statistically significant effect, the trial can be stopped with rejection of the null hypothesis. If the test statistic crosses a futility boundary then this indicates with high probability that an effect will not be found, that the trial can be terminated by rejecting the alternative hypothesis. In the case where the user wishes to generate boundaries for early rejection of either the null or alternative hypothesis, or , they are given two options; either to have the boundaries binding, or non-binding. With binding boundaries, if the test statistic crosses the futility boundary, the test must be stopped, otherwise the type-1 error may become inflated. The reason for this is that there is an interaction between the efficacy and futility boundaries in their calculation that could cause the efficacy boundary to shift. In the case of non-binding boundaries; the efficacy boundaries are calculated as normal, that is, as if the futility boundaries did not exist. This eliminates the danger of inflating the type-1 error when the futility boundary is overruled. The downside of the non-binding case is that it may increase the required sample size relative to the binding case. The boundaries calculated in nTerim 2.0 follow the procedures outlined by Reboussin et al (1992) and Jennison & Turnbull (2000). 44 3.3.2. Methodology Sequential Log-Rank test of survival in to groups, the variables are defined as: Symbol Description Probability of Type I error Probability of Type II error Power of the Test Group Survival Proportions Number of Events Sample Size Ratio of to Drift Parameter Number of Time-points (Looks) Calculate Sample Size for a given Power Using the number of time-points ( ) number of sides, type of spending function, the ), the drift parameter hypothesis to be rejected, the type 1 error ( ), and the power, ( ( ) can be obtained using algorithms and procedures outlined by Reboussin et al (1992) and Jennison & Turnbull (2000). ( ) {3.3.1} For the Exponential Survival Curve, this is defined by the expression below. ( This can be solved for )√ {3.3.2} , the required number of events using the equation below. [ ( )] {3.3.3} Then, to calculate the Proportional Hazards Curve, Equation {3.3.4} is employed. √ This can be solved for {3.3.4} , the required number of events using Equation {3.3.5}. [ ( ( ) ] ) {3.3.5} 45 To calculate the sample size, , the following formula is used. {3.3.6} Calculate Attainable Power with the given Sample Size ) number of time-points, K, number of sides, Given , group survival proportions ( type of spending function, the hypothesis to be rejected, the requirement is to obtain the power. For the Exponential Survival Curve, Equation {3.3.7} is used. √ ( ) ( ) {3.3.7} For the Proportional Hazards Curve, Equation {3.3.8} is used. √ 46 ( )( ( ) ) {3.3.8} 3.3.3. Examples Example 1: O’Brien-Fleming Spending function – with Power vs. Sample Size Plot 1. Open nTerim through the Start Menu or by double clicking on the nTerim desktop icon. Then click on “New Interim Test” from the menu bar at the top of the window. A “Study Goal and Design” window will appear as shown below. Select the options as mapped out in Figure 3.3.1, then Click “OK”. Figure 3.3.1. Study Goal and design Window 2. Enter 0.05 for alpha, 2 sided, 0.3 for Group 1 proportion (this is the proportion surviving until time t) and 0.45 for Group 2 proportion. The hazard ratio is calculated as 1.508. 3. Select Exponential Survival for the Survival time assumption. 4. We are interested in solving for sample size given 90% power so enter 90 in the Power row. 5. This study planned for 4 interim analyses. Including the final analysis this requires Number of Looks to be 5. 47 6. The looks will be equally spaced and the O'Brien-Fleming spending function is to be used. There will be no truncation of bounds. 7. It is estimated that the cost per unit is roughly $100, so enter 100 in the Cost per sample unit row. Figure 3.3.2. Survival Test Table 8. Once all values have been entered, select “Calculate required sample size for given power” from the drop-down menu and click “Run”. 48 Figure 3.3.3. Complete Survival Table for One test In addition to the sample size and cost output for Column 1, the boundary calculations are also presented as shown below. Figure 3.3.4. Boundary Table for Column 1 49 9. In the second column enter the same parameters as above but change the Group 2 proportion to 0.40. Select “Run”. Figure 3.3.5. Complete Survival Table for Two tests In addition to the sample size and cost output for Column 2, the boundary calculations are also presented as shown below. Figure 3.3.6. Boundary Table for Column 2 50 Finally, in terms of output, the boundaries that were calculated as shown in Figure 3.3.4 and 3.3.6 were automatically plotted by nTerim, the boundary plot for Column 1 is given below. Figure 3.3.7. Boundary Plot for Column 1 10. Click on the column title for Column 1 and drag across to highlight both Columns 1 and 2. 11. Select Plot Power-Sample Size from the toolbar, (it may take a moment to generate the plot as multiple calculations are performed) Figure 3.3.8. Power vs. Sample Size Plot 51 As it can be seen in Figure 3.3.8, an illustration of the comparison between Column 1 and Column 2 in relation to Power vs. Sample Size performance can be created. The cross on the graph illustrates how the user can identify what the sample size is for a corresponding power value for each column. In the bottom right corner of the plot indicated the exact values for Power and Sample Size for each identifier on the graph. Finally, by clicking on the Output tab at the bottom of the screen you can see a statement giving details of the calculation: Column 1 – Output Statement “A total sample size of at least 409 (256 events) is required to achieve 90.07% power to detect a hazard ratio of 1.508 (for survival rates of 0.3 in group 1 and 0.45 in group 2), using a 2-sided log rank test with 0.05 significance level assuming that the survival times are exponential. These results assume that 5 sequential tests are made and the O Brien-Fleming spending function is used to determine the test boundaries.” 52 Example 2: Pocock Spending Function – with Non-equally Spaced Looks 1. Open nTerim through the Start Menu or by double clicking on the nTerim desktop icon. Then click on “New Interim Test” from the menu bar at the top of the window. A “Study Goal and Design” window will appear as shown below. Select the options as mapped out in Figure 3.3.9, then Click “OK”. Figure 3.3.9. Study Goal and design Window 2. Enter 0.05 for alpha, 2 sided, 0.5 for Group 1 proportion, 0.4 for Group 2 proportion. The hazard ratio is calculated as 0.756. 3. Select Proportional Hazards for the Survival Time Assumption. We are interested in solving for power given a sample size of 1000, so enter 1000 in the Total Sample Size row. 4. This study planned for 4 interim analyses. Including the final analysis this requires Number of Looks to be 5. 5. The Pocock spending function is to be used, however the looks will not be evenly spaced. 6. For Information Times, select User Input. Then in the Times row in the lower table enter the values 0.1, 0.2, 0.3, 0.6 and 1. 7. It is estimated that the cost per unit is roughly $100, so enter 100 in the Cost per sample unit row. 53 Figure 3.3.10. Complete Survival Table with Pocock Spending Function 8. Once all the values have been entered, select “Calculate the attainable power with the given sample sizes” from the drop-down menu and click “Run”. 9. The boundaries calculated are shown in Figure 3.3.11. Figure 3.3.11. Boundary Table for Pocock Spending Function 54 10. Finally, the boundaries calculated in the table displayed in Figure 3.3.11 are automatically plotted as illustrated in Figure 3.3.12. Figure 3.3.12. Boundary Plot for Proportional Hazard Survival Test By clicking on the output tab at the bottom of the screen you can see a statement giving details of the calculation: “A total sample size of at least 1000 (550 events) is required to achieve 85.32% power to detect a hazard ratio of 0.756 (for survival rates of 0.5 in group 1 and 0.4 in group 2), using a 2-sided log rank test with 0.05 significance level assuming that the hazards are proportional. These results assume that 5 sequential tests are made and the Pocock spending function is used to determine the test boundaries.” 55 Chapter 4 Fixed Term Design 56 4.1 One-Way Repeated Measures Contrast (Constant Correlation) 4.1.1. Introduction This table facilitates the calculation of power and sample size for a one-way repeated measures contrast design. Calculations are performed using the methods outlined by Overall and Doyle (1994). A one-way repeated measures contrast is used to analyse specific planned contrasts in a repeated measures one-way analysis of variance (ANOVA) design. This is an experimental design in which multiple measurements are taken on a group of subjects over time or under different conditions. This design is the same as the one-way ANOVA but for related not independent groups. It can be viewed as an extension of the dependent t-test. To give an example of such a design; consider a study of a three month intervention aimed at raising self-esteem in children. Self-esteem will be measured before, after one month, after two months, and after three months of the intervention. It is assumed that self-esteem will increase monotonically over time. Thus, for this study it may be of interest to test for a linear trend in self-esteem. The contrasts -3, -1, 1, 3 would be appropriate for such a study. Such planned contrasts are useful because they provide a more sharply focused analysis compared to overall tests. This usually makes tests of planned contrasts easier to interpret and more powerful. 57 4.1.2. Methodology Power and sample size is calculated using central and non-central F-distributions and follows the procedures outlined by Overall, and Doyle (1994) To calculate power and sample size the user must specify the test significance level, , and the number of levels, . The user must then enter values for the contrast, , and the Scale, . Alternatively, the user can enter the expected means at each level and the respective contrast coefficients using the compute effect size assistant. nTerim will then calculate the contrast and scale using the following formulas for contrast: ∑ {4.1.1} √∑ {4.1.2} and scale, Once the contrast and the scale have been entered, the user must input values for the common standard deviation, , and the between level correlation, . The standard deviation at each level is assumed to be the same and the correlation between each pair of levels is assumed to be the same. Given these four values, nTerim will automatically calculate the effect size using the following formula: | | √( ) {4.1.3} In order to calculate power, a value for the total sample size, , must be entered. nTerim then calculates the power of the design by first determining the critical value . ( ) ( ) is the Where, is the numerator degrees of freedom, and denominator degrees of freedom. The non-centrality parameter, , is then calculated using the equation: {4.1.4} Using these two values, nTerim calculates the power of this design as the probability of being greater than on a non-central F-distribution with non-centrality parameter . In order to calculate sample size a value for power must be specified. nTerim does not use a closed form equation. Instead a search algorithm is used. This search algorithm calculates power at various sample sizes until the desired power is reached. 58 4.1.3. Examples Example 1: Examining the specific contrast between high and low doses of a new drug This test can be incorporated when examining different levels within a certain variable. In this example we want to examine the contrast between high doses and low doses of a specific new drug. The following steps outline the procedure for Example 1. 1. Open nTerim through the Start Menu or by double clicking on the nTerim desktop icon. Then click on “New Fixed Term Test” from the menu bar at the top of the window. A “Study Goal and Design” window will appear. Figure 4.1.1. Study Goal and Design Window 2. Once the correct test has been selected, click “OK” and the test window will appear. 3. There are two main tables required for this test, the main test table illustrated in Figure 4.1.2 and the effect size assistant table shown in Figure 4.1.3. 4. Enter 0.05 for alpha, the desired significance level, and enter 3 for the number of levels, M, as shown in Figure 4.1.4. 5. Now you are required to complete the “Compute Effect Size Assistant” table in order to calculate values for the Contrast ( ) and Scale ( ) parameters. 59 Figure 4.1.2. One-way Repeated Measures Contrast Test Table Figure 4.1.3. Compute Effect Size Assistant Table 6. Once you enter a value for the number of levels, M, the “Compute Effect Size Assistant” table automatically updates as shown in Figure 4.1.4. 7. In order to calculate a value for Effect Size, two parameters need to be calculated first, the Contrast ( ) and Scale ( ). 8. The mean for each level and the corresponding coefficient value need to be entered in the “Compute effect Size Assistant” table. 9. For the “Mean” values for each level, enter 12 for level 1, 12 for level 2 and 14 for level 3. 10. For the “Coefficient” values for each level, enter 0 for level 1, -1 for level 2 and 1 for level 3. The sum of these values must always equate to zero. This is illustrated in Figure 4.1.5 below. 60 Figure 4.1.4. Automatically Updated Compute Effect Size Assistant Table 11. Once the table in Figure 4.1.5 is completed, and values for Contrast ( ) and Scale ( ) are computed, click on “Transfer” to automatically transfer these values to the main table. Figure 4.1.5. Completed Compute Effect Size Assistant Table 61 12. Now that values for Contrast ( ) and Scale ( ) have been computed we can continue with filling in the main table. For the Standard Deviation, enter a value of 6. For the between level correlation, enter a value of 0.2. 13. We want to calculate the sample size required obtain a power of 90%. Therefore enter 90 in the Power row. 14. It has been estimated that it will cost $100 per sample unit in this study. Therefore enter 100 in the “Cost per sample unit” row. 15. Select “Calculate required sample size for given power” from the drop-down menu below the main table and click “Run”. This is displayed in Figure 4.1.6. Figure 4.1.6. Completed One-way Repeated Measures Contrast Table It can be seen from Figure 4.1.6 that a sample size of 152 per group (for each of the three groups, thus a total sample size, N, of 456) is required to obtain a power of 89.95%. Due to the cost per sample unit of $100, the overall cost of sample size required has amounted to $45,600. By clicking on the Output tab at the bottom of the screen you can see a statement giving details of the calculation: “When the group sample size (n) is 152, the test of a single contrast at the 0.05 level in a one way repeated measures analysis of variance with 3 levels will have 89.95% power to detect a contrast C = ∑ci·μi of 2, with a scale D = SQRT(∑ci²) of 1.41421, assuming a standard deviation at each level of 6 and a between level correlation of 0.2.” 62 Example 2: Examining M Period Crossover Design This design may require treatments to appear an equal number of times per each sequence. It can be assumed these sequences are chosen in order to prevent confounding from occurring between treatment and period effects. Therefore this is ensuring the design is balanced. In this example, we will investigate a three period, two treatment design of ABB and BAA. The following steps outline the procedure for Example 2. 1. Open nTerim through the Start Menu or by double clicking on the nTerim desktop icon. Then click on “New Fixed Term Test” from the menu bar at the top of the window. A “Study Goal and Design” window will appear. Figure 4.1.7. Study Goal and Design Window 2. Once the correct test has been selected, click “OK” and the test window will appear. 3. There are two main tables required for this test, the main test table illustrated in Figure 4.1.8 and the effect size assistant table shown in Figure 4.1.9. 4. Enter 0.05 for alpha, the desired significance level, and enter 3 for the number of levels, M, as shown in Figure 4.1.10. 5. Now you are required to complete the “Compute Effect Size Assistant” table in order to calculate values for the Contrast ( ) and Scale ( ) parameters. 63 Figure 4.1.8. One-way Repeated Measures Contrast Test Table Figure 4.1.9. Compute Effect Size Assistant Table 6. Once you enter a value for the number of levels, M, the “Compute Effect Size Assistant” table automatically updates as shown in Figure 4.1.10. 7. In order to calculate a value for Effect Size, two parameters need to be calculated first, the Contrast ( ) and Scale ( ). 8. The mean for each level and the corresponding coefficient value need to be entered in the “Compute effect Size Assistant” table. 9. For the “Mean” values for each level, enter 6 for level 1, 3 for level 2 and 3 for level 3. 10. For the “Coefficient” values for each level, enter 2 for level 1, -1 for level 2 and -1 for level 3. The sum of these values must always equate to zero. This is illustrated in Figure 4.1.11 below. 64 Figure 4.1.10. Automatically Updated Compute Effect Size Assistant Table 11. Once the table in Figure 4.1.11 is completed, and values for Contrast ( ) and Scale ( ) are computed, click on “Transfer” to automatically transfer these values to the main table. Figure 4.1.11. Completed Compute Effect Size Assistant Table 65 12. Now that values for Contrast ( ) and Scale ( ) have been computed we can continue with filling in the main table. For the Standard Deviation, enter a value of 3.677. For the between level correlation, enter a value of 0. 13. We want to calculate the attainable power given the sample size, therefore enter 30 in the “Group size, n” row. 14. The cost per sample unit cannot be estimate yet in this study so we will leave this row blank for this calculation. This value has no impact on the sample size or power calculation. 15. Select “Calculate attainable power with the given sample sizes” from the drop-down menu below the main table and click “Run”. This is displayed in Figure 4.1.12. Figure 4.1.12. Completed One-way Repeated Measures Contrast Table It can be seen from Figure 4.1.12 that a sample size of 30 per group (for each of the three groups, thus a total sample size, N, of 90) is required to obtain a power of 94.82%. By clicking on the Output tab at the bottom of the screen you can see a statement giving details of the calculation: “When the group sample size (n) is 30, the test of a single contrast at the 0.05 level in a one way repeated measures analysis of variance with 3 levels will have 94.82% power to detect a contrast C = ∑ci·μi of 6, with a scale D = SQRT(∑ci²) of 2.44949, assuming a standard deviation at each level of 3.677 and a between level correlation of 0.” 66 Example 3: Investigating Self-Esteem Scores over time In this example we will be examining self-esteem scores over time. For the researchers involved, they expect the self-esteem scores to increase monotonically over time. Therefore, the researchers would wish to test the linear contrast following the repeated measures ANOVA to assess what sample size is requires for the contrast to have 90% power. The following steps outline the procedure for Example 3. 1. Open nTerim through the Start Menu or by double clicking on the nTerim desktop icon. Then click on “New Fixed Term Test” from the menu bar at the top of the window. A “Study Goal and Design” window will appear. Figure 4.1.13. Study Goal and Design Window 2. Once the correct test has been selected, click “OK” and the test window will appear. 3. There are two main tables required for this test, the main test table illustrated in Figure 4.1.14 and the effect size assistant table shown in Figure 4.1.15. 4. Enter 0.05 for alpha, the desired significance level, and enter 4 for the number of levels, M, as shown in Figure 4.1.16. 5. Now you are required to complete the “Compute Effect Size Assistant” table in order to calculate values for the Contrast ( ) and Scale ( ) parameters. 67 Figure 4.1.14. One-way Repeated Measures Contrast Test Table Figure 4.1.15. Compute Effect Size Assistant Table 6. Once you enter a value for the number of levels, M, the “Compute Effect Size Assistant” table automatically updates as shown in Figure 4.1.16. 7. In order to calculate a value for Effect Size, two parameters need to be calculated first, the Contrast ( ) and Scale ( ). 8. The mean for each level and the corresponding coefficient value need to be entered in the “Compute effect Size Assistant” table. 9. For the “Mean” values for each level, enter 55 for level 1, 56.5 for level 2, 58 for level 3 and 59.5 for level 4. 10. For the “Coefficient” values for each level, enter -3 for level 1, -1 for level 2, 1 for level 3 and 3 for level 4. The sum of these values must always equate to zero. This is illustrated in Figure 4.1.17 below. 68 Figure 4.1.16. Automatically Updated Compute Effect Size Assistant Table 11. Once the table in Figure 4.1.17 is completed, and values for Contrast ( ) and Scale ( ) are computed, click on “Transfer” to automatically transfer these values to the main table. Figure 4.1.17. Completed Compute Effect Size Assistant Table 69 12. Now that values for Contrast ( ) and Scale ( ) have been computed we can continue with filling in the main table. For the Standard Deviation, enter a value of 10. For the between level correlation, enter a value of 0.7. 13. We want to calculate the sample size required obtain a power of 90%. Therefore enter 90 in the Power row. 14. The cost per sample unit cannot be estimate yet in this study so we will leave this row blank for this calculation. This value has no impact on the sample size or power calculation. 15. Select “Calculate required sample size for given power” from the drop-down menu below the main table and click “Run”. This is displayed in Figure 4.1.18. Figure 4.1.18. Completed One-way Repeated Measures Contrast Table It can be seen from Figure 4.1.18 that a sample size of 29 per group (for each of the three groups, thus a total sample size, N, of 116) is required to obtain a power of 90.32%. By clicking on the Output tab at the bottom of the screen you can see a statement giving details of the calculation: “When the group sample size (n) is 29, the test of a single contrast at the 0.05 level in a one way repeated measures analysis of variance with 4 levels will have 90.32% power to detect a contrast C = ∑ci·μi of 15, with a scale D = SQRT(∑ci²) of 4.47214, assuming a standard deviation at each level of 10 and a between level correlation of 0.7.” 70 4.2 Repeated Measures Design for Two Means 4.2.1. Introduction A repeated measures design is an experimental design in which multiple measurements are taken on one or more groups of subjects over time or under different conditions. This type of design leads to a more precise estimate of an endpoint and can avoid the bias from a single measure. For example, an individual’s blood pressure is known to be sensitive to many temporary factors such as amount of sleep had the night before, mood, excitement level, exercise, etc. If there is just a single measurement taken from each patient, then comparing the mean blood pressure between two groups could be invalid as there could be a large degree of variation in the single measures of blood pressure levels among patients. However, by obtaining multiple measurements from each individual and comparing the time averaged difference between the two groups, the precision of the experiment is increased. This table facilitates the calculation of power and sample size for the time averaged difference between two means in a repeated measures design. Power and sample size is computed using the method outlined by Liu and Wu (2005). 71 4.2.2. Methodology Power and sample size are calculated using standard normal distributions and follow the procedures outlined by Liu and Wu (2005). To calculate power and sample size the user must first specify the test significance level, , and choose between a one or a two sided test. The user must then enter a value for the number of levels, . This value corresponds to the number of measurements that will be taken on each subject. Values must then be provided for the difference in means, , the standard deviation at each level, , and the between level correlation, . The difference in means that must be specified is the smallest meaningful time-averaged difference to be detected. Given the above values, in order to calculate the power for this design the user must enter the expected sample size for each group, and . nTerim then uses the total sample size, , to calculate the power of the design using the following equation: ( ( (√ ))) ( (√ ( where, {4.2.1} )) ) () is the standard normal density function, and {4.2.2} {4.2.3} In order to calculate sample size for a given power the following formula is used: ( ) ( ( ( ( where, ) )( )) ) {4.2.4} is the probability of a type II error. {4.2.5} 72 4.2.3. Examples Example 1: Comparing the Difference in Sample Size due to change in Significance Level In this example we are going to investigate how a difference in the level of significance for a study design can impact the sample size required to obtain a given power. The following steps outline the procedure for Example 1. 1. Open nTerim through the Start Menu or by double clicking on the nTerim desktop icon. Then click on “New Fixed Term Test” from the menu bar at the top of the window. A “Study Goal and Design” window will appear. Figure 4.2.1. Study Goal and Design Window 2. Once the correct test has been selected, click “OK” and the test window will appear. This test table is illustrated in Figure 4.2.2. 3. Enter 0.05 for alpha, the desired significance level, and enter 4 for the number of levels, M, as shown in Figure 4.2.4. 4. Two sided test is the default setting in nTerim as well as a Ratio value of 1 for the group sizes. 73 5. In this example we will examine a study where the difference in means is 10 and the standard deviation at each level is 20. Therefore, enter a value of 10 in the “Difference in Means” row and a value of 20 in the “Standard deviation at each level” row. Figure 4.2.2. Repeated Measures for Two Means Test Table 6. We also know that the between level correlation is 0.5 so enter 0.5 into the “Between level correlation” row. Figure 4.2.3. Completed Repeated Measures Design for Two Means 74 7. We want to calculate the required sample size for each group in order to obtain 90% power. To do this, enter 90 in the “Power (%)” row. 8. It has also been estimated that the associated cost per unit in this study will amount to $90. Therefore enter 90 in the “Cost per sample unit” row in order to calculate the Total study cost associated with the sample size. 9. Then select “Calculate required sample size for given power” from the drop-down menu below the main table and click “Run”. This is displayed in Figure 4.2.3 above. By clicking on the Output tab at the bottom of the screen you can see a statement giving details of the calculation: “When the sample size is 53 in group 1 and 53 in group 2, a test for the time averaged difference between two means in a repeated measures design with a 0.05 significance level will have 90% power to detect a difference in means of 10 in a design with 4 repeated measurements when the standard deviation is 20 and the between level correlation is 0.5.” Figure 4.2.4. Re-run calculations to update Column 2 10. Now we are going to repeat the same study design example except we’re going to enforce a stricter level of significance. In the second column, enter 0.025 in the “Test Significance Level” row. Now we are looking for a 2.5% level of significance instead of a 5% level as in the first column. 11. We want to see the effects of changing the level of significance has on sample size, and perhaps the total study cost. 75 12. Enter the same information for number of levels, Difference in Means, standard deviation at each level, between level correlation, power and cost per sample unit. 13. Select “Calculate required sample size for given power” from the drop-down menu below the main table and click “Run”. This is displayed in Figure 4.2.4 above. It can be seen from Figure 4.2.4 that sample size has increase be 20 (10 per group) and the estimated cost has increased by $1,800. 14. Another feature that enables us to compare designs side-by-side is by using the Power vs. Sample Size plot. Multiple columns can be plotted together by simply highlighting the desired columns and clicking on the “Plot Power vs Sample Size” button on the menu bar. Figure 4.2.5. Highlight desired columns for plotting 15. To highlight the desired columns, click on the column title for Column 1 and drag across to Column 2 as illustrated in Figure 4.2.5. 16. Then click on the “Plot Power vs Sample Size” button on the menu bar. The multiple column plot is displayed in Figure 4.2.6. 76 Figure 4.2.6. Power vs. Sample Size Plot It can be seen from the legend on the left-hand side (legend can be altered manually) that the blue line represents Column 1 and the orange line represents Column 2. The cross on the graph illustrates how the user can identify what the sample size is for a corresponding power value for each column. In the bottom right corner of the plot indicated the exact values for Power and Sample Size for each identifier on the graph. It can be seen in Figure 4.2.6 that Column 1 reaches an acceptable power level faster than the design in Column 2. The researcher can now make an assessment as to which design they would prefer to use. 77 Example 2: Differences in Power and Between Level Correlations In this example we investigate how a change in Power and a change in Between Level Correlation has an effect on sample size. The following steps outline the procedure for Example 2. 1. Open nTerim through the Start Menu or by double clicking on the nTerim desktop icon. Then click on “New Fixed Term Test” from the menu bar at the top of the window. A “Study Goal and Design” window will appear. Figure 4.2.7. Study Goal and Design Window 2. Once the correct test has been selected, click “OK” and the test window will appear. This test table is illustrated in Figure 4.2.8. 3. Enter 0.05 for alpha, the desired significance level, and enter 4 for the number of levels, M, as shown in Figure 4.2.9. 4. Two sided test is the default setting in nTerim as well as a Ratio value of 1 for the group sizes. 5. In this example we will examine a study where the difference in means is 15 and the standard deviation at each level is 25. Therefore, enter a value of 10 in the “Difference in Means” row and a value of 20 in the “Standard deviation at each level” row as shown in Figure 4.2.9. 78 Figure 4.2.8. Repeated Measures for Two Means Test Table 6. The between level correlation is estimated as 0.4, so enter 0.4 in the “Between level correlation” row. 7. We want to calculate the required sample size to obtain a power of 90% so enter 90 on the “Power” row. Figure 4.2.9. Design Entry for Two Means Repeated Measures Study 79 8. The cost per sample unit has been estimated as $65 in this particular study. Therefore to calculate the overall cost associated with the sample size, enter 65 in the “Cost per sample unit” row as shown in Figure 4.2.9. 9. As we want to try several different parameter values for both Power and between level correlation, we can use the “Fill Right” function to fill out multiple columns with the same information entered in Column 1. 10. Once all the parameter information has been entered, click on Edit and Fill Right as shown in Figure 4.2.10. Figure 4.2.10. Fill Right function 11. As shown in Figure 4.2.11, all columns have been filled in with the same parameter information contained in Column 1. We want to alter the other columns (Columns 2 to 5) to see how the sample size is affected by various parameter changes. Figure 4.2.11. Altered columns for comparison 80 12. Firstly we want to investigate how the sample size will be affected by a change in Power. To do this we will enter 85 and 80 in the “Power” row for Columns 2 and 3 respectively as shown in Figure 4.2.11. 13. We also would like to examine how the sample size is affected by an increase or decrease in the between level correlation. Therefore we will change the between level correlation to 0.7 and 0.2 in Columns 4 and 5 respectively as shown in Figure 4.2.11. 14. As we want to calculated the required sample size to obtain the given power, select “Calculate required sample sizes for given power” from the drop-down menu below the test table. 15. As we want to run this calculation for multiple columns, tick the “All Columns” box beside the “Run” button as shown in Figure 4.2.12, then click Run. Figure 4.2.12. Completed multiple design Repeated Measures for Two Means Table As it can be seen in Figure 4.2.12, there is a drop in sample size of 5 units per group if you reduce the power to 85% and a further drop of 4 units per group when reducing power to 80%. Depending on the different constraints on the study design, 80% power may be acceptable and would reduce costs by approximately 25% when compared with the same study design with 90% power. When we examined the volatility in relation to the between level correlation (and keeping the power fixed at 90%), we can see that as the between level correlation increases, so does the sample size required. With a lower between level correlation, a lower sample size is required. 81 Example 3: Differences in Group Size Ratios In this example we investigate how the sample size ratio between Group 1 and Group 2 affects the overall sample size required to obtain a given power. The following steps outline the procedure for Example 3. 1. Open nTerim through the Start Menu or by double clicking on the nTerim desktop icon. Then click on “New Fixed Term Test” from the menu bar at the top of the window. A “Study Goal and Design” window will appear. Figure 4.2.13. Study Goal and Design Window 2. Once the correct test has been selected, click “OK” and the test window will appear. This test table is illustrated in Figure 4.2.14. 3. Enter 0.05 for alpha, the desired significance level, and enter 5 for the number of levels, M, as shown in Figure 4.2.15. 4. Two sided test is the default setting in nTerim as well as a Ratio value of 1 for the group sizes. 5. In this example we will examine a study where the difference in means is 40 and the standard deviation at each level is 80. Therefore, enter a value of 40 in the “Difference in Means” row and a value of 80 in the “Standard deviation at each level” row as shown in Figure 4.2.15. 82 Figure 4.2.14. Repeated Measures for Two Means Test Table 6. The between level correlation is estimated as 0.5, so enter 0.5 in the “Between level correlation” row. 7. We want to calculate the required sample size to obtain a power of 85% so enter 85 in the “Power” row. Figure 4.2.15. Design Entry for Two Means Repeated Measures Study 83 8. The cost per sample unit has been estimated as $75 in this particular study. Therefore to calculate the overall cost associated with the sample size, enter 75 in the “Cost per sample unit” row as shown in Figure 4.2.15. 9. As we want to try several different parameter values for sample size Ratio (R), we can use the “Fill Right” function to fill out multiple columns with the same information entered in Column 1. Figure 4.2.16. Fill Right Function Shortcut 10. Once all the parameter information has been entered, right click on the Column 1 heading and select “Fill Right” from the drop-down menu as shown in Figure 4.2.16. 11. As illustrated in Figure 4.2.17, all columns have been filled in with the same parameter information contained in Column 1. We want to alter the other columns (Columns 2 to 4) to see how the sample size is affected by various parameter changes. 12. In this example we want to investigate how the sample size will be affected by a change in the Ratio between the two groups’ sample sizes. To do this we will enter Ratio values of 2, 3, and 4 in Columns 2, 3 and 4 respectively. 84 13. As we want to calculated the required sample size to obtain the given power, select “Calculate required sample sizes for given power” from the drop-down menu below the test table. Figure 4.2.17. Altered columns for comparison 14. As we want to run this calculation for multiple columns, tick the “All Columns” box beside the “Run” button as shown in Figure 4.2.17, then click Run. Figure 4.2.18. Completed multiple design Repeated Measures for Two Means Table 85 15. Another feature that enables us to compare designs side-by-side is by using the Power vs. Sample Size plot. Multiple columns can be plotted together by simply highlighting the desired columns and clicking on the “Plot Power vs Sample Size” button on the menu bar. 16. To highlight the desired columns, click on the column title for Column 1 and drag across to Column 4. 17. Then click on the “Plot Power vs Sample Size” button on the menu bar. The multiple column plot is displayed in Figure 4.2.19. Figure 4.2.19. Power vs. Sample Size Plot It can be seen from the legend on the left-hand side (legend can be altered manually) that the blue line represents Column 1, the orange line represents Column 2, the red line represents Column 3 and the navy line represents Column 4. The cross on the graph illustrates how the user can identify what the sample size is for a corresponding power value for each column. In the bottom right corner of the plot indicated the exact values for Power and Sample Size for each identifier on the graph. It can be seen in Figure 4.2.19 that Column 1 reaches an acceptable power level faster than the design in Column 2, 3 or 4. The researcher can now make an assessment as to which design they would prefer to use. 86 4.3 Repeated Measure for Two Proportions 4.3.1. Introduction A repeated measures design is an experimental design in which multiple measurements are taken on one or more groups of subjects over time or under different conditions. This type of design leads to a more precise estimate of an endpoint and can avoid the bias from a single measure. For example, an individual’s blood pressure is known to be sensitive to many temporary factors such as amount of sleep had the night before, mood, excitement level, exercise, etc. If there is just a single measurement taken from each patient, then comparing the mean blood pressure between two groups could be invalid as there could be a large degree of variation in the single measures of blood pressure levels among patients. However, by obtaining multiple measurements from each individual and comparing the time averaged difference between the two groups, the precision of the experiment is increased. This table facilitates the calculation of power and sample size for the time averaged difference between two proportions in a repeated measures design. Power and sample size is computed using the method outlined by Liu and Wu (2005). 87 4.3.2. Methodology Power and sample size are calculated using standard normal distributions following procedures outlined in Liu and Wu (2005). To calculate power and sample size the user must first specify the test significance level, , and choose between a one or a two sided test. The user must then enter a value for the number of levels, . This value corresponds to the number of measurements that will be taken on each subject. Values must then be provided for the between level correlation, , and any two of group 1 proportions, , group 2 proportions, , and odds ratio, . Given two of nTerim will compute the other using the following equation: ( ( ) ) {4.3.1} Given the above values, in order to calculate the power for this design the user must enter the expected sample size for each group, and . nTerim then uses the total sample size, , to calculate the power of the design using the following equation: The formula used to calculate power is: [( ( √ ( √ ( where, )( ) ( ) ( ( ))( ) {4.3.2} ) ( ) ) )] () is the standard normal density function, and {4.3.3} {4.3.4} {4.3.5} {4.3.6} {4.3.7} In order to calculate sample size a value for power must be specified. nTerim does not use a closed form equation to calculate sample size. Instead a search algorithm is used. This search algorithm calculates power at various sample sizes until the desired power is reached. 88 4.3.3. Examples Example 1: Investigate how Group Proportion affects Sample size for a given Power In this example we examine how the group proportion affects sample size values for a given power. The following steps outline the procedure for Example 1. 1. Open nTerim through the Start Menu or by double clicking on the nTerim desktop icon. Then click on “New Fixed Term Test” from the menu bar at the top of the window. A “Study Goal and Design” window will appear. Figure 4.3.1. Study Goal and Design Window 2. Once the correct test has been selected, click “OK” and the test window will appear. 3. Enter 0.05 for alpha, the desired significance level, and enter 3 for the number of levels, M, as shown in Figure 4.3.3. 4. Two sided test is the default setting in nTerim as well as a Ratio value of 1 for the group sizes as shown in Figure 4.3.2. 5. In this example we will examine a study where the group 1 proportion is estimated as 0.45 and the group 2 proportion is estimated as 0.55. Enter 0.45 in the “Group 1 Proportion” row and enter 0.55 in the “Group 2 Proportion” row. 89 Figure 4.3.2. Repeated Measures for Two Proportions Test Table 6. We also know that the between level correlation is 0.5 so enter 0.5 into the “Between level correlation” row. 7. We want to calculate the required sample size for each group in order to obtain 90% power. To do this, enter 90 in the “Power (%)” row. Figure 4.3.3. Design Entry for Two Proportions Repeated Measures Study 90 8. The cost per sample unit has been estimated as $120 in this particular study. Therefore to calculate the overall cost associated with the sample size, enter 120 in the “Cost per sample unit” row in order to calculate the total study cost associated with the sample size. 9. Then select “Calculate required sample size for given power” from the drop-down menu below the main table and click “Run”. This is displayed in Figure 4.3.4. Figure 4.3.4. Completed Repeated Measures Design for Two Proportions 10. Now we are going to repeat this study design example except we’re going to explore how the sample size varies as we alter the proportion in both Group 1 and Group 2. Previously, in Column 1 we had a Group 1 proportion of 0.45 and Group 2 proportion of 0.55. Next we are going to proportions 0.40 and 0.55 for Group 1 and Group 2 respectively. 11. We want to see the effects of changing the group proportion levels has on sample size and perhaps total study cost. 12. In Column 2, enter the same information for level of significance, number of levels, between level correlation, Group 2 proportion, power and cost per sample unit. 13. Now enter 0.4 for Group 1 Proportion in the “Group 1 Proportions” row. 14. Select “Calculate required sample size for given power” from the drop-down menu below the main table and click “Run”. This is displayed in Figure 4.3.5. 91 Figure 4.3.5. Re-run calculation for Column 2 15. Figure 4.3.5 illustrates the impact of reducing Group 1 proportion. We would also like to see the effect of altering the Group 2 proportion. 16. Similar to step 12, enter the same information from Column 1 into Column 3. This time enter 0.45 for Group 1 proportion and 0.50 for the Group 2 proportion. This is displayed in Figure 4.3.6. Figure 4.3.6. Re-run calculation for Column 3 92 It can be seen from Figure 4.3.6 that when the Group 1 Proportion was reduced (Column 2), the difference between the two groups increased, the odds ratio in turn increased and the sample size was dramatically reduced. When the Group 2 Proportion was reduced (Column 3), the difference between the two groups reduced and the odds ratio in turn was reduced. The sample size was subsequently increased quite substantially. This all had an knock on effect on the total study cost associate with the sample size. 17. Another feature that enables us to compare designs side-by-side is by using the Power vs. Sample Size plot. Multiple columns can be plotted together by simply highlighting the desired columns and clicking on the “Plot Power vs Sample Size” button on the menu bar. 18. To highlight the desired columns, click on the column title for Column 1 and drag across to Column 3. 19. Then click on the “Plot Power vs. Sample Size” button on the menu bar. The multiple column plot is displayed in Figure 4.3.7 below. Figure 4.3.7. Power vs. Sample Size Plot It can be seen from the legend on the left-hand side (legend can be altered manually) that the blue line represents Column 1, the orange line represents Column 2 and the red line represents Column 3. The cross on the graph illustrates how the user can identify what the sample size is for a corresponding power value for each column. In the bottom right corner of the plot indicated the exact values for Power and Sample Size for each identifier on the graph. 93 Example 2: Specifying and Comparing Multiple Designs In this example we use the Multiple Factor table to specify multiple designs and then compare the designs appropriately. The following steps outline the procedure for Example 2. 1. Open nTerim through the Start Menu or by double clicking on the nTerim desktop icon. Then click on “New Fixed Term Test” from the menu bar at the top of the window. A “Study Goal and Design” window will appear. Figure 4.3.8. Study Goal and Design Window 2. Once the correct test has been selected, click “OK” and the test window will appear. This test table is illustrated in Figure 4.3.8. 3. An additional table that will be used in this example is the Specify Multiple Factors table displayed in Figure 4.3.9. This is used to generate multiple columns and designs by entering a range of values for particular parameters. 4. For this example it is known that the proportion of interest in Group 1 ranges from 0.45 to 0.55 and the proportion of interest in Group 2 ranges from 0.39 to 0.51. Therefore, we want to see what the required samples sizes would be at the extremes of these ranges. For example at the maximum proportion for Group 1 and the minimum proportion for Group 2. 94 Figure 4.3.8. Repeated Measures for Two Proportions Test Table 5. By incorporating the Specify Multiple Factors table shown in Figure 4.3.9, the user can specify many designs (columns) by entering the desired parameter values and ranges in the provided boxes. 6. We just want to define a two-sided test design. Enter 2 in the “1 or 2 sided test” box. In this study we want 3 levels so enter 3 in the “Number of levels, M” box. We also know that the between level correlation is 0.4 so enter 0.4 in the “Between level correlation” box. Figure 4.3.9. Specify Multiple Factors Table 7. We know that the Group 1 proportion ranges from 0.45 to 0.55 so enter 0.45 0.55 in the “Group 1 Proportions” box with a space separating the two numbers. We also know that the Group 2 proportion ranges from 0.39 to 0.51 so enter 0.39 0.51 in the “Group 2 Proportions” box. These entries are displayed in Figure 4.3.10 below. 95 8. We want a 5% level of significance so enter 0.05 in the “Test Significance Level” box. We want an equal sample size for each group so enter 1 in the “Ratio: N2/N1” box. We would like to obtain 90% power in this study design so enter 90 in the “Power (%)” box. 9. Finally, it has been projected that the cost per sample unit will be $100, therefore, enter 100 in the “Cost per sample unit” box. Figure 4.3.10. Completed Specify Multiple Factors Table 10. Once all the parameter values and ranges have been entered correctly, click on “Fill Table” at the bottom right side of the Specify Multiple Factors table. 11. This will automatically fill in the required amount of columns in the test table as illustrated in Figure 4.3.11. In this example we require four columns. Figure 4.3.11. Design Entry for Multiple columns 96 12. It can be seen from Figure 4.3.11 that different designs have been created for each combination of the proportions for both groups. 13. In order to calculate appropriate sample size calculations, tick the “All columns” box beside the run button, then select “Calculate required sample sizes for given power” from the drop-down menu below the main table and click “Run”. Figure 4.3.12. Comparison of four Repeated Measures Designs It can be seen in Figure 4.3.12 that all combinations of the minimum and maximum values for Group 1 and 2 proportions are created. This allows us to evaluate how the sample size varies as the values of the group proportions change. We can see from Columns 1 and 2 that if we fix the Group 2 proportion at the minimum value of 0.39, and increase the Group 1 proportion, the required sample size decreases. We can also see from Columns 3 and 4 that if we fix the Group 2 proportion at the maximum value of 0.51 and increase the Group 1 proportion, the sample size also increases. With this approach we are able to quantify how the sample size is affected by changes in both Group 1 and 2 proportions. 97 14. Another feature that enables us to compare designs side-by-side is by using the Power vs. Sample Size plot. Multiple columns can be plotted together by simply highlighting the desired columns and clicking on the “Plot Power vs Sample Size” button on the menu bar. 15. To highlight the desired columns, click on the column title for Column 1 and drag across to Column 4. 16. Then click on the “Plot Power vs Sample Size” button on the menu bar. The multiple column plot is displayed in Figure 4.3.13. Figure 4.3.13. Power vs. Sample Size Plot It can be seen from the legend on the left-hand side (legend can be altered manually) that the blue line represents Column 1, the orange line represents Column 2, the red line represents Column 3 and the navy line represents Column 4. The cross on the graph illustrates how the user can identify what the sample size is for a corresponding power value for each column. In the bottom right corner of the plot indicated the exact values for Power and Sample Size for each identifier on the graph. 98 17. Finally, by clicking on the Output tab at the bottom of the screen you can see a statement giving details of the calculation depending on which column you have clicked on. Figure 4.3.14. Output statement The output statement in Figure 4.3.14 is for Column 1. This statement can be copied and pasted into any report. 99 4.4 One-Way Analysis of Variance (ANOVA) 4.4.1. Introduction This table facilitates the calculation of power and sample size for a one-way analysis of variance (ANOVA) design. Calculations are performed using the methods outlined by O’Brien and Muller (1993). A one-way ANOVA compares means from two or more groups in order to determine whether any of those means are significantly different from each other. Note if we were to compare just two means using the one-way ANOVA then this would be equivalent to a t-test for two independent means. In fact the one-way ANOVA can be viewed as being an extension of a two group t-test. To give an example of a one-way ANOVA design; consider a study on cholesterol. Suppose we wanted to compare the reduction in cholesterol resulting from the use of a placebo, the current standard drug, and a new drug. The one-way ANOVA tests the null hypothesis that the mean reductions in cholesterol in all three groups are equal. The alternative hypothesis is that the mean reductions in cholesterol in the three groups are not all equal. 100 4.4.2. Methodology Power and sample size are calculated using central and non-central F-distributions and follow the procedures outlined by O’Brien and Muller (1993) To calculate power and sample size the user must specify the test significance level, , and the number of groups . The user must then enter a value for the variance of means, . Alternatively, the user can enter the expected means in each group using the compute effect size assistant. nTerim will then calculate the variance of means using the formula: ∑ ( ∑ ̅) {4.4.1} where, ̅ ∑ {4.4.2} The compute effect size assistant also allows the user to enter the expected sample sizes in each group or the expected ratio to group 1 for each group, . This is particularly useful when you expect unequal sample sizes per group. Once the variance in means is calculated the user must input a value for the common standard deviation, . This is a measure of the variability between subjects within a group and is assumed to be the same for all groups. Given the common standard deviation and variance of means nTerim will automatically calculate the effect size using the formula: {4.4.3} In order to calculate power, a value for the total sample size, , must be entered (remember this can also be read in from the effect size assistant). nTerim then calculates the power of the design by first determining the critical value . Where, is the numerator degrees of freedom, and is the denominator degrees of freedom. The non-centrality parameter, , is then calculated using the equation: {4.4.4} Using these two values, nTerim calculates the power of this design as the probability of being greater than on a non-central F-distribution with non-centrality parameter . In order to calculate sample size a value for power must be specified. nTerim does not use a closed form equation. Instead a search algorithm is used. This search algorithm calculates power at various sample sizes until the desired power is reached. 101 4.4.3. Examples Example 1: One-way ANOVA with unequal n’s in a Blood Pressure Study In this example we will compare the reduction in blood pressure resulting from the use of three potential treatments: (i) Placebo, (ii) current Standard Drug and (iii) New Drug. According to similar previous studies on the Standard Drug, we have approximated the reduction in blood pressure as roughly 12mmHg with a standard deviation of 6mmHg. Likewise, in previous studies, the Placebo has resulted in an estimated reduction of 5mmHg. This example will examine using a One-way Analysis of Variance with a 0.05 level of significance. The following steps outline the procedure for Example 1. 1. Open nTerim through the Start Menu or by double clicking on the nTerim desktop icon. Then click on “New Fixed Term Test” from the menu bar at the top of the window. A “Study Goal and Design” window will appear. Figure 4.4.1. Study Goal and Design Window 2. Once the correct test has been selected, click “OK” and the test window will appear. 3. There are two main tables required for this test, the main test table illustrated in Figure 4.4.2 and the effect size assistant table shown in Figure 4.4.3. 4. Enter 0.05 for alpha, the desired significance level, and enter 3 for the number of groups, G, as shown in Figure 4.4.4. 102 Figure 4.4.2. One-way Analysis of Variance Test Table Figure 4.4.3. Compute Effect Size Assistant Window 5. Once you enter a value for the number of groups, G, the “Compute Effect Size Assistant” table automatically updates as shown in Figure 4.4.4. 6. In order to calculate a value for Effect Size, the Variance of Means ( ) needs to be calculated first. 7. The mean for each level and the corresponding sample size need to be entered in the “Compute effect Size Assistant” table. 8. For the “Mean” values for each group, enter 5 for group 1, 12 for group 2 and 12 for group 3. 9. For the group sample size ( ) values for each group, enter 20 for group 1, 12 for group 2 and 18 for group 3. As a result, the ratio ( ) is calculated for each group as a proportion of group 1. 103 Figure 4.4.4. Automatically updated Compute effect size Assistant Table 10. Once the table in Figure 4.4.5 is completed, and values for Variance of Means ( ) and total Sample Size ( ) are computed, click on “Transfer” to automatically transfer these values to the main table. Figure 4.4.5. Completed Compute Effect Size Assistants Table 104 11. Now that values for Variance of Means ( ) and total Sample Size ( ) are computed we can continue with filling in the main table. For the Common Standard Deviation, enter a value of 6. Now the Effect Size is automatically calculated. 12. We want to calculate the attainable power given the sample size of 50. 13. It has been estimated that it will cost $85 per sample unit in this study. Therefore enter 85 in the “Cost per sample unit” row. 14. Select “Calculate attainable power with the given sample size” from the drop-down menu below the main table and click “Run”. This is displayed in Figure 4.4.6. Figure 4.4.6. Completed One-Way Analysis of Variance Test Table It can be seen from Figure 4.4.6 that a sample size of 50 is required to obtain a power of 94.82%. Due to the cost per sample unit of $85, the overall cost of sample size required has amounted to $4,250. By clicking on the Output tab at the bottom of the screen you can see a statement giving details of the calculation: “When the total sample size across the 3 groups is 50, distributed across the groups as specified, a one-way analysis of variance will have 94.82% power to detect at the 0.05 level a difference in means characterized by a Variance of means, V = ∑ri·(μi-μm)² / (∑ri) of 11.76, assuming that the common standard deviation is 6.” 105 In this example we can also perform sensitivity analysis to see how volatile this study is to slight changes in a particular parameter. For example, let us examine how the attainable power alters under slight changes in Standard Deviation. 1. Firstly, we must copy the information in Column 1 to Column 2. To do this, highlight Column 1 by clicking on the column title as shown in Figure 4.4.7. Then right click and select “Copy”. Figure 4.4.7. Copy Column 1 2. Then right click on the first cell in Column 2 and select “Paste” as illustrated in Figure 4.4.8 below. Figure 4.4.8. Paste contents of Column 1 into Column 2 106 3. Once the contents of Column 1 have been copied over to Column 2, you can change the value of the Common Standard Deviation to 4 and click “Run”. This will update Column 2 to its new attainable value for power, as seen in Figure 4.4.9. Figure 4.4.9. Re-run calculations to update Column 2 4. Repeat Steps 2 & 3 except paste the contents of Column 1 into Column 3, change the Common Standard Deviation to 8 and click “Run”. This is displayed in Figure 4.4.10. Figure 4.4.10. Re-run calculations for Column 3 5. Now it can be seen from Figure 4.4.10 that there is a change in Effect Size and ultimately Power due to both increasing and decreasing the Common Standard Deviation. It’s easy to compare the implications of a slight increase or decrease in the Common Standard Deviation. 107 6. Another feature that enables us to compare designs side-by-side is by using the Power vs. Sample Size plot. Multiple columns can be plotted together by simply highlighting the desired columns and clicking on the “Plot Power vs Sample Size” button on the menu bar. 7. To highlight the desired columns, click on the column title for Column 1 and drag across to Column 3. Then click on the “Plot Power vs Sample Size” button on the menu bar. The multiple column plot is displayed in Figure 4.4.11. Figure 4.4.11. Multiple Column Power vs. Sample Size Plot It can be seen from the legend on the left-hand side (legend can be altered manually) that the blue line represents Column 1, the orange line represents Column 2 and the red line represents Column 3. The cross on the graph illustrates how the user can identify what the sample size is for a corresponding power value for each column. In the bottom right corner of the plot indicated the exact values for Power and Sample Size for each identifier on the graph. It can be seen in Figure 4.4.11 that Column 2 reaches an acceptable power level much faster than the other two designs as it has the lowest value for Common Standard Deviation. This plot also shows us how volatile this study design is to any change in Common Standard Deviation. 108 4.5 Analysis of Covariance (ANCOVA) 4.5.1. Introduction This table facilitates the calculation of power and sample size for analysis of covariance (ANCOVA) designs. Calculations are performed using the procedures outlined by Keppel (1991. An analysis of covariance (ANCOVA) design can be viewed as an extension of the one-way analysis of variance (ANOVA). In ANOVA, differences in means between two or more groups are tested on a single response variable. An ANCOVA, on the other hand, does the same analysis while adjusting for covariates. These covariates provide a way of statistically controlling the effect of variables one does not want to examine in a study. It is assumed that the inclusion of these covariates will increase the statistical power of a design. However, it must be noted that adding a covariate also reduces the degrees of freedom. Therefore, adding a covariate that accounts for very little variance in the response variable may actually reduce power. To give an example of an ANCOVA design; consider a study where we are examining test scores among students. In this study it is found that boys and girls test scores for a particular subject differ. However, it is known that girls take more classes in the subject than boys. We can use ANCOVA to adjust the test scores based on the relationship between the number of classes taken and the test score. Thus, enabling us to determine whether boys and girls have different test scores while, adjusting for the number of classes taken. 109 4.5.2. Methodology Power and sample size are calculated using central and non-central F-distributions and follow the procedures outlined by Keppel (1991). To calculate power and sample size the user must specify the test significance level, , and the number of groups . The user must then enter a value for the variance of means, . Alternatively, the user can enter the expected means in each group using the compute effect size assistant. nTerim will then calculate the variance of means using the formula: ∑ ( ̅) ∑ {4.5.1} where, ̅ ∑ {4.5.2} The compute effect size assistant also allows the user to enter the expected sample sizes in each group or the expected ratio to group 1 for each group, . This is particularly useful when you expect unequal sample sizes per group. Once the variance in means is calculated the user must input a value for the common standard deviation, . This is a measure of the variability between subjects within a group and is assumed to be the same for all groups. The user must then also enter the number covariates, , to be used in the study along with the average r-squared value between the response and the covariates, . In order to calculate power, a value for the total sample size, , must be entered (remember this can also be read in from the effect size assistant). nTerim then calculates the power of the design by first determining the critical value . The non-centrality parameter, , is then calculated using the equation: ̅ {4.5.3} where, ̅ {4.5.4} and, ( 110 ) {4.5.5} where is the within-group variance after considering the covariates and coefficient of multiple determination (estimated by ). is the Using these two values, nTerim calculates the power of this design as the probability of being greater than on a non-central F-distribution with non-centrality parameter . In order to calculate sample size nTerim does not use a closed form equation. Instead a search algorithm is used. This search algorithm calculates power at various sample sizes until the desired power is reached. 111 4.5.3. Examples Example 1: Calculating Attainable Power given Sample Size In this example we are going to calculate the attainable power for a given sample size for an ANCOVA design. The following steps outline the procedure for Example 1. 1. Open nTerim through the Start Menu or by double clicking on the nTerim desktop icon. Then click on “New Fixed Term Test” from the menu bar at the top of the window. A “Study Goal and Design” window will appear. Figure 4.5.1. Study Goal and Design Window 2. Once the correct test has been selected, click “OK” and the test window will appear. 3. There are two main tables required for this test, the main test table illustrated in Figure 4.5.2 and the effect size assistant table shown in Figure 4.5.3. 4. Enter 0.05 for alpha, the desired significance level, and enter 4 for the number of groups, , as shown in Figure 4.5.4. 112 Figure 4.5.2. Analysis of Covariance Test Table Figure 4.5.3. Compute Effect size Assistant Window 5. Once you enter a value for the number of groups, , the “Compute Effect Size Assistant” table automatically updates as shown in Figure 4.5.4. 6. In order to calculate a value for Effect Size, the Variance of Means ( ) needs to be calculated first. 7. The mean for each level and the corresponding sample size need to be entered in the “Compute Effect Size Assistant” table. 8. For the “Mean” values for each group, enter 15 for group 1, 20 for group 2, 25 for group 3 and 18 for group 4. 113 9. For the group sample size ( ) values for each group, enter 30 for group 1, 45 for group 2, 45 for group 3 and 30 for group 4. As a result, the ratio ( ) is calculated for each group as a proportion of group 1. Figure 4.5.4. Automatically updated Compute effect size Assistant Window 10. Once the table illustrated in Figure 4.5.5 is completed, and the values for Variance of Means ( ) and Total sample size ( ) are computed, click on “Transfer” to automatically transfer these values to the main table. 114 Figure 4.5.5. Completed Compute Effect size Assistant Window 11. Now that values for Variance of Means ( ) and Total sample size ( ) are computed we can continue with filling in the main table. For the Common Standard Deviation, enter a value of 25. 12. The number of covariates to be used in this study is set at 1, so enter the value 1 in the “Number of covariates” row. Also the R-Squared value has been estimated as 0.75 for this study design so enter 0.75 in the “R-Squared with covariates” row. 13. We want to calculate the attainable power give the sample size of 150. 14. It has been estimated that it will cost $100 per sample unit in this study. Therefore enter 100 in the “Cost per sample unit” row. 15. Select “Calculate attainable power with the given sample size” from the drop-down menu below the main table and click “Run”. This is displayed in Figure 4.5.6. Figure 4.5.6. Completed ANCOVA Test Table 115 It can be seen from Figure 4.5.6 that a sample size of 150 is required to obtain a power of 85.37%. Due to the cost per sample unit of $100, the overall cost of sample size required has amounted to $15,000. By clicking on the Output tab at the bottom of the screen you can see a statement giving details of the calculation: “When the total sample size across the 4 groups is 150, distributed across the groups as specified, an analysis of covariance will have 85.37% power to detect at the 0.05 level a difference in means characterized by a Variance of means of 13.29, assuming that the common standard deviation is 25, and assuming the covariate(s) has an R-squared of 0.75.” Example 2: Investigating the effects of R-squared on attainable Power In this example we will examine how the R-squared with covariates value has an impact on the attainable power given a certain sample size. The following steps outline the procedure for Example 2. 1. Open nTerim through the Start Menu or by double clicking on the nTerim desktop icon. Then click on “New Fixed Term Test” from the menu bar at the top of the window. A “Study Goal and Design” window will appear. Figure 4.5.7. Study Goal and Design Window 2. Once the correct test has been selected, click “OK” and the test window will appear. 116 3. There are two main tables required for this test, the main test table illustrated in Figure 4.5.8 and the effect size assistant table shown in Figure 4.5.9. 4. Enter 0.05 for alpha, the desired significance level, and enter 3 for the number of groups, , as shown in Figure 4.5.10. Figure 4.5.8. Analysis of Covariance Test Table Figure 4.5.9. Compute Effect size Assistant Window 5. Once you enter a value for the number of groups, , the “Compute Effect Size Assistant” table updates automatically as shown in Figure 4.5.10. 6. In order to calculate a value for Effect Size, the Variance of Means ( ) needs to be calculated first. 7. The mean for each level and the corresponding sample size need to be entered in the “Compute Effect Size Assistant” table. 117 8. For the “Mean” values for each group, enter 31 for group 1, 41 for group 2 and 45 for group 3. 9. For the group sample size ( ) values for each group, enter 40 for group 1, 45 for group 2 and 35 for group 3. As a result, the ratio ( ) is calculated for each group as a proportion of group 1. Figure 4.5.10. Automatically updated Compute effect size Assistant Window 10. Once the table in Figure 4.5.11 has been completed, the values for Variance of Means ( ) and Total sample size ( ) are computed, click on “Transfer” to automatically transfer these values to the main ANCOVA test table. 118 Figure 4.5.11. Completed Compute Effect size Assistant Window 11. Now that values for Variance of Means ( ) and Total sample size ( ) are computed we can continue with filling in the main table. For the Common Standard Deviation, enter a value of 30. 12. The number of covariates to be used in this study is set at 1, so enter the value 1 in the “Number of covariates” row. Also the R-Squared value has been estimated as 0.5 for this study design so enter 0.5 in the “R-Squared with covariates” row. 13. We want to calculate the attainable power give the sample size of 120. 14. It has been estimated that it will cost $80 per sample unit in this study. Therefore enter 80 in the “Cost per sample unit” row. 15. As we want to compare the effects that the R-Squared value has on the Power of the study, we will re-run this design for several values of R-Squared. To do this, right click on Column 1 as shown in Figure 4.5.12 and select “Fill Right”. This will replicate the information in Column 1 across all the columns in this window. Figure 4.5.12. Fill Right Shortcut Feature 119 16. Now we want to change the R-Squared values in Columns 2, 3 and 4 to represent the remaining possible estimated R-Squared values for our study design. We would like to investigate R-Squared ranging from 0.5 (in Column 1) to 0.8 (in Column 4). To do this, enter 0.6 in the “R-Squared with covariates” row in Column 2, 0.7 in Column 3 and 0.8 in Column 4 as illustrated in Figure 4.5.13 below. Figure 4.5.13. Altered columns for R-Squared Comparison 17. Now that all the information in each column has been entered, we are ready to run the calculations. In order to calculate the power for all the columns together, tick the “All columns” box beside the “Run” button as shown in Figure 4.5.13. 18. Now select “Calculate attainable power given sample size” from the drop-down menu below the main table and click “Run”. Figure 4.5.14. Completed multiple design ANCOVA Table 120 As the results show in Figure 4.5.14, as the R-Squared value is increase from 0.5 up to 0.8, the corresponding power also increase dramatically, almost doubling from 42.91% to 83.02%. It can be seen from this approach that we would want an R-Squared value approximately equal to 0.8 to obtain a credible value for power. 19. Another feature that enables us to compare designs side-by-side is by using the Power vs. Sample Size plot. Multiple columns can be plotted together by simply highlighting the desired columns and clicking on the “Plot Power vs Sample Size” button on the menu bar. 20. To highlight the desired columns, click on the column title for Column 1 and drag across to Column 4. Then click on the “Plot Power vs Sample Size” button on the menu bar. The multiple column plot is displayed in Figure 4.5.15. Figure 4.5.15. Power vs. Sample Size Plot It can be seen from the legend on the left-hand side (legend can be altered manually) that the blue line represents Column 1, the orange line represents Column 2 and the red line represents Column 3. The cross on the graph illustrates how the user can identify what the sample size is for a corresponding power value for each column. In the bottom right corner of the plot indicated the exact values for Power and Sample Size for each identifier on the graph. 121 4.6. Multivariate Analysis of Variance (MANOVA) 4.6.1. Introduction This table facilitates the calculation of power and sample size for multivariate analysis of variance (MANOVA) designs. In multivariate models there are several test statistics that can be used. In nTerim we provide the option for power and sample size calculations using three common test statistics; Wilks’ likelihood ratio statistic, Pillai-Bartlett trace, and HotellingLawley trace. Calculations are performed using the approximations outlined by Muller and Barton (1989), and Muller, LaVange, Ramey and Ramey (1992). Multivariate analysis of variance (MANOVA) analysis is very similar to its univariate counterpart, analysis of variance (ANOVA). MANOVA can be described simply as an ANOVA with several response variables. In ANOVA, differences in means between two or more groups are tested on a single response variable. In MANOVA the number of response variables is increased to two or more. The purpose of MANOVA is to test for the difference in the vectors of means for two or more groups. To give an example; we may be conducting a study where we are comparing two different treatments; a new treatment and a standard treatment, and we are interested in improvements in subjects scores for depression, life satisfaction and physical health. In this example, improvements in depression, life satisfaction and physical health are the response variables and our null hypothesis is that a subject’s treatment has no effect on any of the three different ratings. As there are three response variables, MANOVA is used to test this hypothesis. 122 4.6.2. Methodology Power and sample size is calculated using central and non-central F-distributions and follows the procedures outlined by Muller and Barton (1989), and Muller, LaVange, Ramey and Ramey (1992). To calculate power and sample size the user must first enter the number of response variables, . The user must then specify the number of levels (categories) per factor in their design using the Factor Level Table assistant. Note if you wish to not use a factor in your design then you can simply leave the number of levels blank for that factor. Using this same table the alpha value and desired power per factor, and per factor interaction, must also be specified. Note if you are solving for power then you must leave the power fields blank. Having specified the number of response variables and the number of levels per factor, the Means Matrix, , becomes populated with empty cells that must be filled in by the user. The numbered rows of this matrix represent the response variables, and the columns represent the factors, or to be more specific the number of groups that a subject can be classified in to, . Where For example if you had a design with two response variables and 2 factors (Factor A and Factor B), each with two levels. This design would give a matrix with 2 rows and columns. [ ] {4.6.1} Where, for example is the mean of the second response of subjects in the third group. Note the matrix is in this form for ease of user input. The transpose of this inputted matrix is used in the power calculations. In the means matrix there is also a row labelled . This row is used to specify the number of subjects per group. This row need only be specified when solving for power and it is anticipated that the sample size per group will be unequal. The next step for the user is to input values for the standard deviation, , and the correlation, . These two values are used by nTerim to calculate the covariance matrix . {4.6.2} [ Where is a ] matrix. 123 In order to calculate power, a value for the group size, , must be entered. Entering this value in the main table assumes that group sizes are equal. If it is expected that the sample sizes in each group will be different, then, the expected sample size in each group must be specified in the Means Matrix. nTerim gives the option of calculating power using one of three commonly used test statistics; Wilks’ lambda, Pillai-Bartlett Trace, or Hotelling-Lawley trace. In order to perform calculations using either of these three statistics nTerim first calculates the matrices and using the following formulas: {4.6.3} where is a matrix of contrasts that nTerim automatically generates. This is an orthogonal matrix that is unique to each factor and factor interaction. is the means matrix which has been inputted by the user. (̂ )[ ( ) ] (̂ ) {4.6.4} where is the matrix of hypothesised means, which is zero for this test, and design matrix. ̂( ) is the {4.6.5} where ̂ is the covariance matrix. {4.6.6} Wilks’ Lambda Using these matrices the test statistic for Wilks’ lambda is calculated using the formula | | {4.6.7} The transformation of this test statistic to an approximate ( is given by {4.6.8} ) where, {4.6.9} ( ) {4.6.10} {4.6.11} 124 {4.6.12} [( ) ( ) ] ( ) {4.6.13} Pillai-Bartlett Trace The test statistic for Pillai-Bartlett trace is calculated using the formula ( ) {4.6.14} The transformation of this test statistic to an approximate ( is given by {4.6.15} ) {4.6.16} ( ) {4.6.17} {4.6.18} {4.6.19} ) [( ] {4.6.20} Hotelling-Lawley Trace The test statistic for Hotelling-Lawley trace is calculated using the formula ( ) {4.6.21} The transformation of this test statistic to an approximate ( is given by {4.6.22} ) {4.6.23} {4.6.24} [( ) ] {4.6.25} Depending on which of these three statistics is chosen, nTerim then calculates the power of the design by first determining the critical value and then the noncentrality parameter, . Where, {4.6.26} 125 Using these two values, nTerim will calculate the power of this design as the probability of being greater than on a non-central F-distribution with non-centrality parameter . In order to calculate sample size, values for power must be specified in the Factor Level Table. nTerim does not use a closed form equation to calculate sample size, instead a search algorithm is used. This search algorithm calculates power at various sample sizes until the desired power is reached. 126 4.6.3. Examples Example 1: Pillai – Bartlett Trace In this example we will calculate the attainable power given a specified sample size using the Pillai – Bartlett trace method The following steps outline the procedure for Example 1. 1. Open nTerim through the Start Menu or by double clicking on the nTerim desktop icon. Then click on “New Fixed Term Test” from the menu bar at the top of the window. A “Study Goal and Design” window will appear. Figure 4.6.1. Study Goal and Design Window 2. Once the correct test has been selected, click “OK” and the test window will appear. This window is illustrated in Figure 4.6.2. 3. There are several tables required for this test including; the main test table shown in Figure 4.6.2, the Factor Level table illustrated in Figure 4.6.4 and the Means Matrix assistant table presented in Figure 4.6.5. 127 4. To begin we first need to specify the number of response variables to be used in the study. In this example we are using 2 so enter 2 in the “Number of response variables, p” row as shown in Figure 4.6.3. Figure 4.6.2. Multivariate Analysis of Variance Design Window 5. Once a value for the number of response variables, p, is entered, the next step in this process is to specify the number of levels per factor. This can be done using the Factor Level Assistant table illustrated in Figure 4.6.4. 6. In this example we are going to specify 4 levels for Factor A and 3 levels for Factor B. Seeing as we only highlighted two response variables in this example, we can leave Factor C empty. 7. We can also alter the default settings of 0.05 for the alpha value. This represents the significance level for each factor. In this example we will leave it at 0.05. 8. Finally, as we are calculating attainable power, the Power (%) is where our output power values for each factor will appear, thus we leave this column empty. 128 Figure 4.6.3. Enter Number of Response variables 9. Once the number of levels for each factor has been specified, click the “Fill” button at the bottom right corner of the Factor Level Table as shown in Figure 4.6.4. 10. The word “Filled” will now be displayed in the main table, as shown in Figure 4.6.5, telling you the Factor Level Table has been completed. Figure 4.6.4. Factor Level Table 129 11. The Means Matrix assistant table will also automatically appear, guiding the user to fill out the next step in the MANOVA process. Depending on the values entered in the Factor Level table, the size of the means matrix will be created. Figure 4.6.5. Means Matrix / Group Sizes Assistants Table 12. As we have defined 2 response variables, one with 4 levels and one with 3 levels, we will require a Means Matrix with 2 rows and 3x4 columns. There is an extra row included to enable the user to specify the individual level sample size (only needed if unequal sample sizes per level). 13. The next step is to fill in all the values for each part of the Means Matrix. In this example we will define the Means Matrix as below (first column of matrix are row names): [ ] 14. Enter this matrix in the Means Matrix Assistant table as illustrated in Figure 4.6.6 and then click the “Fill” button at the bottom right corner of the Means Matrix assistant table. 130 Figure 4.6.6. Completed Means Matrix Assistant Table 15. Once the user clicks on “Fill”, the “Means Matrix” row in the main table displays “Filled” to signify that the matrix has been completed. In this example we have also entered the sample size for each group. Therefore the “Group size, n” row displays the average group sample size and the “Total sample size, N” is also provided. 16. The next step in this MANOVA process is to generate the Covariance Matrix. This is done by entering values for the “Common Standard Deviation” and “Between Level Correlation”, where nTerim will automatically calculate the Covariance Matrix and display it in the Covariance Matrix window, as shown in Figure 4.6.7. 131 Figure 4.6.7. Completed MANOVA Design Table 17. In this example we know from similar studies that the common standard deviation is equal to 2 and the between level correlation is 0.5. To generate the Covariance Matrix simply enter 2 in the “Common standard deviation” row and 0.5 in the “Between level correlation” row as shown in Figure 4.6.7. To view the generated covariance matrix, click on the “Covariance Matrix” tab at the bottom of the assistants table. Figure 4.6.8. Covariance Matrix Window 132 18. Now we have entered all the information required to calculate the attainable Power given a specified sample size. 19. The final step is to select which method we want to use. In this case we want to use the Pillai – Bartlett Trace approach. 20. In order to do this simply select the “Calculate power using Pillai – Bartlett trace” and the click on “Run” as shown in Figure 4.6.9 below. Figure 4.6.9. Selecting Type of Test to Run 21. Once the “Run” button is clicked, the Factor Level Table appears again in the Assistants window. This is where the output Power values are displayed as illustrated below in Figure 4.6.10. 133 Figure 4.6.10. Output Power values calculated 22. Finally, the output statement can be obtained by clicking on the Output tab on the bottom of the nTerim window. Output Statement: “A multivariate analysis of variance design with 2 factors and 2 response variables has 12 groups. When the total sample size across the 12 groups is 61, distributed across the groups as specified, a multivariate analysis of variance will have: 80.63% power to test Factor A if a Pillai Bartlett Trace test statistic is used with 0.05 significance level. 50.12% power to test Factor B if a Pillai Bartlett Trace test statistic is used with 0.05 significance level. 94.19% power to test Factor AB if a Pillai Bartlett Trace test statistic is used with 0.05 significance level.” 134 Example 2: Wilks’ Lambda In this example we will calculate the attainable power given a specified sample size using the Wilks’ Lambda method The following steps outline the procedure for Example 2. 1. Open nTerim through the Start Menu or by double clicking on the nTerim desktop icon. Then click on “New Fixed Term Test” from the menu bar at the top of the window. A “Study Goal and Design” window will appear. Figure 4.6.11. Study Goal and Design Window 2. Once the correct test has been selected, click “OK” and the test window will appear. This window is illustrated in Figure 4.6.12. 3. There are several tables required for this test including; the main test table shown in Figure 4.6.12, the Factor Level table illustrated in Figure 4.6.4 and the Means Matrix assistant table presented in Figure 4.6.5. 4. To begin we first need to specify the number of response variables to be used in the study. In this example we are using 3 so enter 3 in the “Number of response variables, p” row as shown in Figure 4.6.13. 135 Figure 4.6.12. Multivariate Analysis of Variance Table 5. The next step in this process is to specify the number of levels per factor. This can be done using the Factor Level Assistant table illustrated in Figure 4.6.14. 6. In this example we are going to specify 3 levels for Factor A, 3 levels for Factor B and 3 levels for Factor C. 7. We can also alter the default settings of 0.05 for the alpha value. This represents the significance level for each factor. In this example we will leave it at 0.05. 8. Finally, the as we are calculating attainable power, the Power (%) is where our output power values for each factor will appear, thus we leave this column empty. 136 Figure 4.6.13. Enter Number of Response variables 9. Once the number of levels for each factor has been specified, click the “Fill” button at the bottom right corner of the Factor Level Table as shown in Figure 4.6.14. 10. The word “Filled” will now be displayed in the main table in the Factor Level Table row, telling the user that the Factor Level table has been completed. Figure 4.6.14. Factor Level Table 137 11. The Means Matrix assistant table will also automatically appear, guiding the user to fill out the next step in the MANOVA process. Depending on the values entered in the Factor Level table, the size of the means matrix will be created. Figure 4.6.15. Means Matrix / Group Sizes Assistants Table 12. As we have defined 3 response variables, all with 3 levels each, we will require a Means Matrix with 3 rows and 3x3x3 columns. There is an extra row included to enable the user to specify the individual level sample size (only needed if unequal sample sizes per level). 13. The next step is to fill in all the values for each part of the Means Matrix. In this example we will define the Means Matrix as below (first column of matrix are row names): [ ] 138 Figure 4.6.16. Completed Means Matrix / Group Sizes Assistant Table 14. Enter this matrix in the Means Matrix Assistant table as illustrated in Figure 4.6.16 and then click the “Fill” button at the bottom right corner of the Means Matrix assistant table. 15. The bottom row is summed to give the total sample size required and automatically entered into the main design table. In this case we are leaving the bottom row empty as we are going to specify that all groups have equal sample size. In this event, nTerim will automatically update this matrix once we have entered a value for Group Size in the main design table. 16. The next step in the MANOVA process is to generate the Covariance Matrix. We can do this by to entering values for common standard deviation and correlation so nTerim can create the matrix automatically. 139 17. In the “Common standard deviation” row enter a value of 2. In the “Between level correlation” row, enter a value of 0.6. The next step is to enter the Group Size and as the groups will have equal sizes in this example of 4, enter 4 in the “Group size, n” row. The total sample size is also automatically calculated and given in the “Total sample size, N” row. (Notice that the Means Matrix in Figure 4.6.17 has now been updated with the sample size per group) Figure 4.6.17. Completed MANOVA Design Table 18. The generated covariance matrix can be viewed in the Covariance Matrix window as shown in Figure 4.6.18. Figure 4.6.18. Covariance Matrix Window 140 19. The final step is to select which method we want to use. In this case we want to use the Wilks’ Lambda approach. In order to do this simply select the “Calculate power using Wilks’ Lambda” and the click on “Run” as shown in Figure 4.6.19 below. Figure 4.6.19. Selecting the Wilks’ Lambda option 20. In order to view the results for Power for each level, the power values are displayed in the Factor Level Assistants table as illustrated below in Figure 4.6.20. 141 Figure 4.6.20. Output Power values calculated 21. Finally, the output statement can be obtained by clicking on the Output tab on the bottom of the nTerim window. Output Statement: “A multivariate analysis of variance design with 3 factors and 3 response variables has 27 groups. When the total sample size across the 27 groups is 108, distributed across the groups as specified, a multivariate analysis of variance will have: 30% power to test Factor A if a Wilks’ Lambda test statistic is used with 0.05 significance level. 30% power to test Factor B if a Wilks’ Lambda test statistic is used with 0.05 significance level. 98.07% power to test Factor C if a Wilks’ Lambda test statistic is used with 0.05 significance level. 100% power to test Factor AB if a Wilks’ Lambda test statistic is used with 0.05 significance level. 66.77% power to test Factor AC if a Wilks’ Lambda test statistic is used with 0.05 significance level. 66.77% power to test Factor BC if a Wilks’ Lambda test statistic is used with 0.05 significance level. 100% power to test Factor ABC if a Wilks’ Lambda test statistic is used with 0.05 significance level.” 142 Chapter 5 References 143 Chow, S.C., Shao, J., and Wang, H., (2008) “Sample Size Calculations in Clinical Research”, Second Edition, Chapman & Hall DeMets, D.L., and Lan, K.K.G., (1984) “An Overview of Sequential Methods and their Applications, in Clinical Trials”, Communications in Statistics, Theory and Methods, 13, pp 2315-2338 DeMets, D.L., and Lan, K.K.G., (1994) “Interim Analysis: The Alpha Spending Function Approach”, Statistics in Medicine, 13, pp 1341-1352 Fleiss, J.L., Tytun, A., Ury, S.H.K., (1980) “A Simple Approximation for Calculating Sample Sizes for Comparing Independent Proportions”, Biometrics, 36, pp 343-346 Fleiss, J.L., (1981) “Statistical Methods for Rates and Proportions”, Second Edition, Wiley Hwang, I,K., Shih, W.J., and deCani, J.S., (1990) “Group Sequential Designs using a Family Type I Error Probability Spending Functions”, Statistics in Medicine, 9, pp 1439-1445 Jennison, C., and Turnbull, B.W., (2000) “Group Sequential Methods with Applications to Clinical Trials”, Chapman & Hall Keppel, G., (1991) “Design and Analysis - A Researcher's Handbook”, Third Edition, Prentice Hall Liu, H.H., Wu, T.T., (2005) “Sample Size Calculation and Power Analysis for Time-Averaged Difference”, Journal of Modern Applied Statistical Methods, 4(2), pp 434-445 Muller, K.E., and Barton, C.N., (1989) “Approximate Power for Repeated Measures ANOVA Lacking Sphericity”, Journal of the American Statistical Association, 84, pp 549–555 (with correction in volume 86 (1991), pp 255–256) Muller, K.E., LaVange, L.M., Ramey, S.L., and Ramey, C.T., (1992) “Power Calculations for General Linear Multivariate Models Including Repeated Measures Applications”, Journal of the American Statistical Association, 87, pp 1209–1226 O’Brien, P.C., and Fleming, T.R., (1979) “A Multipe Testing Procedure for Clinical Trials”, Biometrika, 35, pp 549-556 O’Brien, R.G., Muller, K.E., (1993) “Unified Power Analysis for t-tests through Multivariate Hypotheses”, Edwards, L.K., (Ed.), Applied Analysis of Variance in Behavioral Science, Marcel Dekker, pp 297-344 Overall, J.E., Doyle, S.R., (1994) “Estimating Sample Sizes for Repeated Measures Designs”, Controlled Clinical Trials, 15, pp 100-123 144 Pampallona, S., Tsiatis, A.A., and Kim, K., (1995) “Spending functions for type I and type II error probabilities of group sequential trials”, Technical report, Dept. of Biostatistics, Harvard School of Public Health, Boston Pampallona, S., Tsiatis, A.A., and Kim, K., (2001) “Interim monitoring of group sequential trials using spending functions for the type I and type II error probabilities”, Drug Information Journal, 35, pp 1113-1121 Pocock, S.J., (1977) “Group Sequential Methods in the Design and Analysis of Clinical Trials”, Biometrika, 64, pp 191-199 Reboussin, D.M., DeMets, D.L., Kim, K., and Lan, K.K.G., (1992) “Programs for Computing Group Sequential Boundaries using the Lan-DeMets Method”, Technical Report 60, Department of Biostatistics, University of Winconsin-Madison Rencher, A.C., (1998). “Multivariate Statistical Inference and Applications”, John Wiley 145 146 North/Central/South America & Canada Statistical Solutions, Stonehill Corporate Center, Suite 104, 999 Broadway, Saugus, MA 01906 Tel: Fax: Toll-free: Email: Europe, Middle East, Africa & Asia Statistical Solutions, 4500 Airport Business Park, Cork, Rep. of Ireland +1 (781) 231 7680 +1 (781) 231 7684 1800 262 1171 [email protected] Tel: +353 21 4839100 Fax: + 353 21 4840026 Email: [email protected] www.statistical-solutions-software.com 147