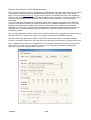
1
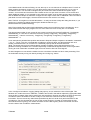
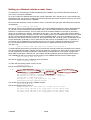
The resulting file is a simple, tab-separated-value file that can easily be opened with the spreadsheet
application of your choice (e.g. OpenOffice Calc, KSpread, Excel, Numbers etc.).
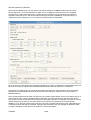
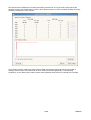
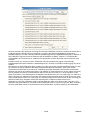
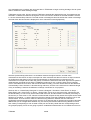
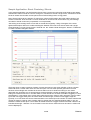
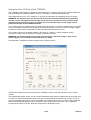
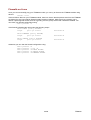
Now that we are sure that we receive timetag data, lets have a look at the timing distribution. Click on
“Create Delay Histogram” to open a histogram window.
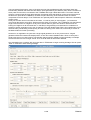
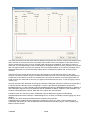
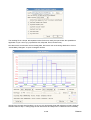
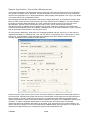
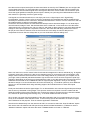
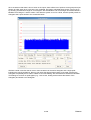
We only have a single signal at Stop1, so we can only look at this signal with reference to itself. We shall
therefore select a Stop1 – Rising Edge as both Start Event and Stop Event. TTMViewer will immediately
21/60
TTM8000