1
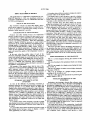
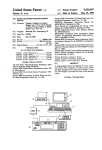
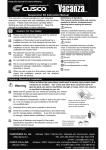
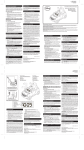
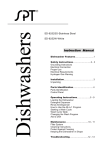
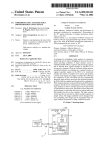
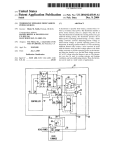
USO05757356A
United States Patent [19]
[11]
Patent Number:
Takasaki et al.
[45]
Date of Patent:
[54] INPUT DATA DISPLAY DEVICE
[75]
Inventors :
Yukio Takasaki. Kyoto: Takashi
Imamura. Kyoto-fu. both of Japan
[73] Assignee: Omron Corporation. Kyoto. Japan
[21] Appl. No.: 654,016
May 28, 1996
[22] Filed:
Related US. Application Data
[63]
[3 01
Continuation of Ser. No. 386,173, Feb. 9. 1995, abandoned,
which is a continuation of Ser. No. 40.989, Mar. 31. 1993,
abandoned.
[5 1]
[52]
[58]
[JP]
rm. 01.6
Japan .................................. .. 4-076875
. . . ..
. . . . . ..
G09G 5/36
U.S. c1. ................... ..
345/133; 345/145
Field Of Search ................................... .. 345/173. 174.
345/163. 157.156. 145. 146. 133. 134.
135. 139.140; 178/18. 19
References Cited
[5 6]
5,757,356
May 26, 1993
252171
390164
H1988
10/1990
European Pat. O?. .
European Pat. OE. .
0164405
12/1991
Japan ................................... .. 364/188
OTHER PUBLICATIONS
“User Manual”. 1992. pp. 118 to 125.
IBM. “Method for converting charts in interactive display
system”. C.C. Himelstein. Feb. 1985. pp. 5060—5061.
IBM Techiniccal Disclosure Bulletin. v01. 33. No. 6A. Nov.
1990. pp. 291-293.
IBM Technical Disclosure Bulletin. vol. 33. No. 7. Dec.
1990. pp. 120-122.
Patent Abstracts of Japan. vol. 6. No. 100. (P-l21) JP-A-57
031 031. Feb. 1982.
Primary Examiner—Xiao Wu
Attorney, Agent, or Firm—Dickstein Shapiro Morin &
Foreign Application Priority Data
Mar. 31. 1992
‘
U.S. PATENT DOCUMENTS
Oshinsky LLP
ABSTRACT
[57]
An input data display device makes it easier to input
properly correlated relative corrections for a number of
parameters. Relative amounts by which each of a number of
parameters is to be adjusted can be displayed on the screen
in a manner which shows their ranges and possible corre
lation. The data are input when the operator touches spots
which he selects on the display screen. The pressure of his
?nger causes data to be generated which represent those
5,005,116
5,093,796
4/1991
Fujital ................................... .. 364/188
input positions. A calculation device calculates output-ready
3/1992
Takada .
relative correction values for the various parameters based
5,122,957
6/1992 Hattori .
5,239,458
8/1993
Suzuki .................
...... .. 364/188
364/424.02
...... .. 364/188
on these input position data. These values are transmitted to
the connected device.
FOREIGN PATENT DOCUNIENTS
043201
1/1982
2 Claims, 4 Drawing Sheets
European Pat. Off. .
OVERSHOOT
Pa
a A
G
RESPONSE
a“,
B
Pbc
HUNTING
U.S. Patent
May 26, 1998
F
_
—
_
_
—
_
_
—
Sheet 1 0f 4
_
_
“
_
_
_
_
w
5,757,356
_
_
_
'——"l
I
I
I
OPERATING l
MEMORY V/
I
I
I
I
I
INPUT
UNIT 2 /‘f\
'
3
5
Il
/_T 4
:
CPU
I
—
I
CRT
I
---—-——
,1
L/
I
I
l
‘
I
I
TRANSMISSION
I
I
UNIT
~—r/
I
I
L
I
_
_
_ _
_ _
_
_
_
_
_
1I»~
_ _
_
_
..____
_
_ _
__...|
___
TEMPERATURE
"L CONTROLLER f’
10"‘ r
“"1
5!‘ FURNACE
JR
6
US. Patent
May 26, 1998
(
START
Sheet 2 0f 4
5,757,356
)
INITTAL
DISPLAY
5‘
S2
,
INPUT
NO
DATA
FIG. 2
DISPLAY TNPUT
POSITION
S3
CALCULATION OF
OUTPUT-READY
RELATNE CORRECTIONS
84
S5
$6
S7
DISPLAY RELATIVE
CORRECTION
VALUES
TRANSMIT
DATA '?
No
TRANSMTT
NO
58
YES
US. Patent
May 26, 1998
Sheet 3 0f 4
OVERSHOOT
RESPONSE
B
Pb C
HUNTING
FIG. 3
OVERSHOOT
A
RESPONSE B
pb
A
C HUNTING
FIG. 4
5,757,356
US. Patent
May 26, 1998
Sheet 4 of 4
AV
FIG. 5
START
21
R.l
mMmEHEM\\mmEm
0
V
SE
.R5nHlSuRRE MDDNIFNN
7i|,
WL
EGgWlS
S$
%
m
L
M
F
5,757,356
5.757.356
2
1
It is another object of this invention to display the relative
INPUT DATA DISPLAY DEVICE
correction values on the display screen.
continuation application of Ser. No. 08/040989. ?led Mar.
It is another object of this invention to provide a display
of the graph of each of the control parameters on the display
screen so that the operator can con?rm by graph how the
31. 1993. now abandoned.
corrections on the controlled device are done.
This application is a continuation of application Ser. No.
8886.173. ?led Feb. 9. 1995. now abandoned. which is a
Brie?y described those and other objects are accom
FIELD OF THE INVENTION
plished in accordance with its apparatus aspects by provid
This invention concerns an input data display device
which can be connected to various types of control devices.
ing an input data display device with a screen on which
relative amounts by which each of a number of parameters
is to be adjusted. The parameters can be displayed in a
manner which shows their ranges and possible correlations.
The invention further includes a means to input relative
It allows an operator to input data more visually so that an
interactive input operation is possible.
BACKGROUND OF THE INVENTION
Furnaces and other heating devices use temperature
corrections. When input occurs in a position on the screen
which the user selects. the device generates data represent
ing that position. A means to compute relative corrections is
adjusters (control devices) to control the heat sources so as
to maintain heat at a given temperature. The control param
also provided such that when the input display device
receives the data representing input position. it uses those
data to compute and output relative corrections for each of
eters for this type of temperature control include overshoot.
response and hunting parameters. When the temperature
control is faulty. it will be necessary to make relative
adjustments in the control parameters corresponding to the
20
the parameters. The device also has a means to transmit the
aforesaid relative corrections to equipment connected to the
existing quality of temperature control. If. for example. a
input data display device.
proportional-integral-derivative (PID) control circuit is
normal.
In the past. when the relative values of each of the
With these and other objects; advantages and features of
the invention that may become hereinafter apparent. the
nature of the invention may be further understood by refer
ence to the following detailed description of the invention.
the appended claims and to the several drawings attached
herein.
aforesaid parameters needed to be changed. the corrected
values were actually input via a keyboard. However. chang
ing the relative values entails taking into account the cor
FIG. 1 is a block diagram showing the structure of the
being used to control temperature. changing the relative
values of each parameter and properly adjusting the PID
gains will return the quality of the temperature control to
relation of the corrected values with various other param
eters. It is dif?cult and extremely time-consuming to
determine. in a correlative fashion. the relative correction to
be applied to each parameter.
25
BRIEF DESCRIPTION OF THE DRAWINGS
invention;
FIG. 2 is a ?owchart of the operations which occur during
35
FIG. 3 is an example of a display screen during the input
steps of FIG. 2;
For example. if the operator knew that the state of the
temperature control involved no hunting. a large overshoot.
and a response which is slightly faulty. then he would
FIG. 4 is an example of another screen display during the
input steps of FIG. 2;
FIG. 5 is an example of a graphic display produced
according to this invention; and
modify the relative values so as to make a large correction
in the overshoot and a small correction in the response.
However. the corrected values for overshoot and response
must be determined in a correlative fashion. Determining a
relative correction of the value for each parameter requires
a great deal of skill acquired through experience.
SUMMARY AND OBJECTS OF THE
INVENTION
In view of the di?iculty of correlating corrections to
parameter behavior. as evidenced by the above example. this
invention provides. as its primary object. an input data
display device which enables an operator to input values for
the relative correction of a number of parameters which are
properly correlated. When this invention is used. correlated
FIG. 6 is a flow chart of the operations for producing the
graphic display of FIG. 5.
45
DETAILED DESCRIPTION OF THE
INVENTION
Referring to the drawings. wherein like reference num
bers refer to like elements. FIG. 1 illustrates a block diagram
50
corrections for a number of parameters are input via a 55
display screen. Data representing these input positions are
used to compute output values for relative corrections for
each parameter. The values which have been computed are
then transmitted to equipment connected to the input data
input;
showing the con?guration of this invention. Speci?cally. it
illustrates an input data display device 1 which includes an
input unit 2 for entering the relative corrections for input
parameters; a display 3. a central processor 4 which pref
erably consists of a microcomputer (although any suitable
processor may be employed); a memory 5. in which the
operating program for the CPU 4 and other various data are
stored; a transmission unit 6. which acts to transmit the data;
and an operating unit 9. In the illustrated embodiment. the
input device 1 is connected to a temperature controller 11. in
display device.
order to control the temperature of the furnace 10. However.
It is another object of the invention to provide an input
data display device that is equipped with a means to display
each of the aforesaid relative correction values which are to
it is contemplated that the input device 1 can be employed
to control any suitable device.
The input unit 2 can be of any construction. A preferable
construction however involves a transparent laminated resis
65 tive sheet for the X/Y coordinates and a ?lm electrode sheet
under the resistive sheet. Such construction effectively cre
data display device having a means to display a control
ates a digitizer. Such a digitizer would produce a signal
status graphically over time on a display.
be output.
It is yet another object of the invention to provide an input
5,757,356
3
4
encoding the coordinates of the position when the pressure
one black triangle on the response axis B to represent the
produced by. for example. an operator‘s ?nger touching that
relative correction values (Step 5).
point. is detected. The cathode ray tube (CHI) 3 is the
When the operator views the display. if he believes that
the above degree of correction values. are the appropriate
preferred display device although any conventionally known
display can be used The aforesaid input unit 2 is installed on
top of the CRT 3 to form a single unit. This combined unit.
with its screen capable of receiving input as well as for
display. constitutes the device to input the relative correc
ones to rectify the current state of control. he uses the
operating unit 9 to initiate a “transmit data” command (Step
6). This command causes the relative correction value
corresponding to the display to be sent to the data transmis
sion unit (Step 7). The correction values are then transmitted
to temperature controller 11. If the operator on viewing the
tions. The CPU 4 serves as the device which computes the
relative values for correction. The CPU 4 receives the input
position data from input unit 2 and computes from these data
the relative corrected values to output for each parameter. In
addition. it controls display on the CR1‘ 3 of the relative
display feels that the values are not correct. he uses the
operating unit 9 to initiate a “reset” command (Step 8). This
will cause the CRT screen to resume its initial display. and
corrections of each parameter in a manner which shows how
those corrections are correlated. Finally. the CPU 4 sends
output values to the transmission unit 6 and then causes
these values to be transmitted from unit 6 to the temperature
controller 11.
With reference to the ?owchart in FIG. 2 the operations of
input device 1 are shown and the current state displays of the
device are shown in FIGS. 3 and 4. In the exempli?ed
application. the current state of control of the temperature of
furnace 10. as mediated by temperature controller 11. is as
follows: (at) There is no hunting; (b) there is a considerable
overshoot; and (c) the response is slightly defective. As a
result. the operator must make (a) a large correction in the
overshoot and (b) a small correction in the response. No
correction in hunting is necessary.
Before any correction data are input. the initial display
(shown in FIG. 3) appears on the screen (Step 1). This
display shows the distribution of correlated degrees of
control applied to the various parameters. As shown in FIG.
3. in the center of the screen 30 is a slightly ?attened circle
E with an origin G. Radiating from origin G are overshoot
axis A. response axis B and hunting axis C. which roughly
divide the circle into three segments. Origin G represents
20
he can then input di?erent relative corrections.
As a consequence with input unit 2. pressing a single spot
makes it possible for a number of properly correlated
relative correction values to be output to the temperature
controller 11. Furthermore. these values can be confirmed by
CRT 3 before being output. These relative correction values.
then. offer an effective way to rectify the state of control.
In the embodiment discussed above. data were input via
a digitizer overlaid on the screen of CRT 3. However. it
would also be possible to use either a mouse. key input. or
move a cursor to enter the correction data.
25
30
Furthermore. the input data display device 1 is usually
separate from the devices to which it is connected. such as
a temperature controller 11. However. the present invention
can include an input data display device 1 which is built into
the controlled equipment.
Referring now to FIG. 5. the graph display operation
performed by CRT 3 in the example discussed above. is
shown. This display operation can be performed before the
relative correction values discussed above have been output.
35
It is initiated by a “display graph" command input via the
operating unit 9. The graph of FIG. 5 is based on temperature
variation data associated with the state of control (for
zero relative correction for each of the axes A. B and C. The
example. control temperature. heating temperature and
points where the axes meet the periphery of the circle E
ambient temperature). which are received from the tempera
represent maximum relative corrections. Input unit 2. which
ture controller 11.
as described with reference to FIG. 1. is mounted on the
Speci?cally. FIG. 5 shows a graphic display with three
sets of temperature data. (a). (b) and (c). which were
received from the temperature controller 11. The dotted line
surface of CRT 3. has ?xed coordinate positions which
match those of circle E. origin G and axes A. B and C.
L on the screen erases whatever vertical line (x coordinate n)
is written in and writes in a new vertical line L on the line
Using this input data display device. and the above control
conditions. the user desires to make a large correction in the
overshoot and a small correction in the response. The
operator will then press point P on the surface of input unit
2 (Step 2). This point is in the area in circle E between
overshoot axis A and response axis B. It is close to overshoot
axis A (thus representing a small correction in the response
axis B) and near the periphery of the circle E for that axis as
well. The position to press is chosen intuitively to corre
spond to the desired correction. Pressing the screen 3 causes
the input unit 2 to generate a signal which represents the
coordinates of the position that was pressed. When this
signal is generated. the spot which was touched is displayed
on CRT 3 (Step 3). Vector T. which has origin G as its
starting point and the coordinate position as its endpoint. is
analyzed into its vector components in order to calculate
relative correction value Pa for overshoot and relative cor
rection value P,b for response. These relative correction
values are then further re?ned. and finally output-ready
relative correction values are calculated as integer values
from 1 through 5 (Step 4). In this example. the ?nal relative
45
50
where the old data are written. one line width to the right (x
coordinate: n+1). The latest data received are written in
where the vertical line was erased (x coordinate: n).
FIG. 6 is a ?owchart illustrating the operations for gen
erating the graph of FIG. 5. If the graph has a grid line V in
the location where the vertical line was erased in Step 1. this
grid line V is written in as Step 2. Line Y indicates the
reference level. As the operation described in Steps 1 to 4 is
performed repeatedly. vertical line L moves from left to right
on the screen as time elapses. As line L moves. the old data
55
are replaced by the most recent data. This type of display
allows the display of data graphically over time with mini
mum rewriting.
As explained. this invention has a graphic display which
allows the operator to use his intuition to input correlated
relative corrections for a number of parameters. This system
makes it easy to obtain properly correlated relative correc
tions for each of the parameters. It allows relative correction
values to be determined in a correlative fashion without
requiring a high degree of operator skill. Furthermore.
correction value for the overshoot parameter is 30 “3.” and
for the response parameter is “1.” Based on these output 65 displaying the relative values allows the displayed data to be
veri?ed. thus enabling the operator to determine the relative
values for relative correction. the CR1" 3 displays. as shown
corrections more accurately.
in FIG. 4. three black triangles M on overshoot axis A and
5,757,356
6
5
Although only a preferred embodiment is speci?cally
means responsive to said selected location for adjusting
illustrated and described herein. it will be appreciated that
one or more of the output values for said parameters in
modi?cations and variations of the present invention are
accordance with the selected location;
possible in light of the above teachings and within the
purview of the appended claims without departing from the
spirit and intended scope of the invention.
means for outputting said plurality of adjusted output
parameter values; and
said display device displaying said plurability of adjusted
What is claimed is:
1. An input data display device for entering parameter
output parameter values respectively on said axes;
control data for a controller. said input data display device
comprising:
a display device for displaying respective axes. each of
which represents an associated output control
parameter. said axes having a common origin at the
center of a substantial circular shape and terminating at
the perimeter of said substantially circular shape. said
axes forming between them wedge shaped areas on said
display device;
said axes respectively representing interrelated control
parameters for a controller. which parameters include
overshoot. hunting and response;
means for selecting a location on said display device to
thereby input position data which position data. by
virtue of its location on said display device and rela
tionship to each of said axes. represents simultaneous
corrections to be made in said interrelated control
parameters;
10
wherein selection of a said location within one of said
wedge shaped areas corrects control parameters asso
ciated with the axes bordering said one wedge shaped
area.
2. The input data display device of claim 1. further
comprising:
means to display a plurality of variation data corrected by
said plurality of output parameters graphically over
time; and
transmission means for transmitting said plurality of
output values to said controller.
*
*
*
*
‘F