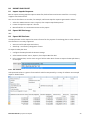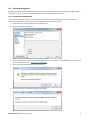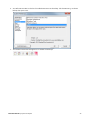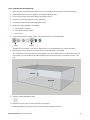
1
IRIS 1.1 User Manual 29 May 2015 IRIS User Manual TABLE OF CONTENTS 1.0 INTRODUCTION .............................................................................................................................................................1 1.1 Summary of this Manual ....................................................................................................................................1 2.0 IRIS KIT..............................................................................................................................................................................2 2.1 IRIS Kit Contents ...................................................................................................................................................2 2.1.1 STP Microphone Cable ............................................................................................................................2 2.2 Additional Equipment .........................................................................................................................................3 2.3 Computer Requirements....................................................................................................................................3 2.3.1 USB 3.0........................................................................................................................................................3 2.4 USB Drive Contents .............................................................................................................................................3 2.5 Calibration Documents .......................................................................................................................................4 2.6 Loudspeaker Requirements ..............................................................................................................................4 2.7 Software Installation Procedure .......................................................................................................................5 2.7.1 HASP Dongle Driver .................................................................................................................................5 2.7.2 MOTU 4pre Driver ....................................................................................................................................5 2.7.3 IRIS Software Installation ........................................................................................................................6 2.8 IRIS Demo Mode ...................................................................................................................................................7 3.0 CONDUCT A 3-D MEASUREMENT ..............................................................................................................................8 3.1 IRIS Hardware Overview .....................................................................................................................................8 3.2 Measurement Controller Setup ........................................................................................................................9 3.3 Receiver Setup ................................................................................................................................................... 12 3.4 Source Setup ...................................................................................................................................................... 14 3.5 Create a New IRIS Project ................................................................................................................................ 15 3.6 Configure Audio Settings ................................................................................................................................. 16 3.7 Configure Stimulus Settings............................................................................................................................ 17 3.8 Add Measurement ............................................................................................................................................ 18 3.9 Record Measurement ...................................................................................................................................... 19 3.9.1 Acoustic Background Noise ................................................................................................................ 20 3.10 Completed Measurement ............................................................................................................................... 21 3.11 Check Measurement Quality .......................................................................................................................... 21 3.12 Delete Measurement ....................................................................................................................................... 23 4.0 IRIS PLOT....................................................................................................................................................................... 24 4.1 IRIS Plot Display ................................................................................................................................................. 25 4.2 IRIS Plot Generation .......................................................................................................................................... 26 4.3 Level Reference ................................................................................................................................................. 28 4.4 Discussion on Time Windows......................................................................................................................... 29 4.5 Analysis of Individual Events........................................................................................................................... 29 IRIS User Manual 4.5.1 Select Vector ........................................................................................................................................... 29 4.6 Directional Accuracy ......................................................................................................................................... 30 5.0 ACOUSTIC PARAMETERS ........................................................................................................................................... 31 5.1 Signal-To-Noise Ratio ....................................................................................................................................... 31 5.2 Time Parameters ............................................................................................................................................... 31 5.3 Strength Parameters ........................................................................................................................................ 31 5.4 Spatial Parameters............................................................................................................................................ 31 5.5 Energy Parameters ........................................................................................................................................... 32 5.6 Stage Parameters .............................................................................................................................................. 32 6.0 CALIBRATION ............................................................................................................................................................... 33 6.1 Core Sound TetraMic ........................................................................................................................................ 33 6.2 Audio Device/MOTU 4pre ............................................................................................................................... 33 6.3 Sound Strength .................................................................................................................................................. 33 6.4 Import Calibration Data ................................................................................................................................... 34 6.4.1 Import TetraMic Calibration Data ...................................................................................................... 34 6.4.2 MOTU 4pre Calibration ........................................................................................................................ 34 6.4.3 Sound Strength Calibration ................................................................................................................. 34 6.4.4 Calibration Data on Disk ...................................................................................................................... 34 7.0 SOUND STRENGTH CALIBRATION .......................................................................................................................... 35 7.1 Hardware Requirements ................................................................................................................................. 35 7.2 Diffuse Field Method ........................................................................................................................................ 35 7.2.1 Theory ...................................................................................................................................................... 36 7.3 Free Field Method ............................................................................................................................................. 37 7.3.1 Theory ...................................................................................................................................................... 38 7.4 Apply Sound Strength Calibration Document ............................................................................................ 39 8.0 IMPORT AND EXPORT ................................................................................................................................................ 40 8.1 Import Impulse Response ............................................................................................................................... 40 8.2 Export IRIS Plot Image ...................................................................................................................................... 40 8.3 Export IRIS Plot Data ......................................................................................................................................... 40 8.3.1 TSV Format.............................................................................................................................................. 40 8.4 SketchUp Integration........................................................................................................................................ 41 8.4.1 Install SketchUp Extension .................................................................................................................. 41 8.4.2 Load IRIS Plot into SketchUp ............................................................................................................... 43 8.4.3 Show/Hide Time Intervals ................................................................................................................... 44 8.4.4 Extend Rays to Boundaries ................................................................................................................. 44 8.4.5 Remove Extension Lines ...................................................................................................................... 45 8.4.6 Delete IRIS Plot from Model ................................................................................................................ 46 IRIS User Manual 9.0 CONDUCT A MONO MEASUREMENT ..................................................................................................................... 47 10.0 TROUBLESHOOTING.................................................................................................................................................. 48 IRIS User Manual 1.0 INTRODUCTION IRIS is an integrated hardware and software room acoustics measurement system developed by Marshall Day Acoustics. 1.1 Summary of this Manual 2.0 IRIS Kit describes the contents of the IRIS kit and how to install the necessary drivers and software 3.0 Conduct a 3-D Measurement walks through the steps of setting up an IRIS kit and conducting a measurement 4.0 IRIS Plot describes the IRIS plot visualisation and how to manipulate and interpret it 5.0 Acoustic Parameters describes the standard acoustic parameters that IRIS can calculate 6.0 Calibration describes the parts of the IRIS kit which require calibration 7.0 Sound Strength Calibration steps through the process of calibrating an IRIS kit for measuring sound strength 8.0 Import and Export describes the import and export features of the IRIS software, including a plugin for visualising IRIS plots in SketchUp 9.0 Conduct a Mono Measurement describes how to conduct a single channel measurement 10.0 Troubleshooting has some tips on how to resolve various issues with your IRIS system IRIS User Manual | Introduction 1 2.0 IRIS KIT This section describes the IRIS kit components, additional hardware which is required to conduct measurements, and the procedures for installing the IRIS software and drivers. 2.1 IRIS Kit Contents The full IRIS kit is shipped in a compact Pelican Storm case. The case contents are listed below: Core Sound TetraMic microphone array Microphone stand clip for the TetraMic TetraMic cable (6-pin female mini-XLR to 6-pin male standard XLR) Core Sound PPAc (Phantom Power Adapter Compact) IRIS CBM (Connection Box MOTU) 30 metre shielded Cat5e (STP) cable with Neutrik etherCon connectors. MOTU 4pre USB audio interface IRIS software on a USB flash drive HASP USB protection dongle 2.1.1 STP Microphone Cable The STP Cat5e cable used by IRIS is a special type of Ethernet cable, but it is not passing digital signals. It is effectively being used as an analog 4-channel multi-core “snake”. Common Ethernet cables – UTP – are not shielded and will not work with IRIS. Lengths of STP cable longer than 30 metres are also available, which may be necessary in very large spaces. IRIS has been tested with up to 90 metres of STP cable without any issues, but longer than this is not advised. Multiple STP cables may be joined together (using Neutrik NE8FF etherCon couplers). Contact your distributor for more information. IRIS User Manual | IRIS Kit 2 2.2 Additional Equipment In addition to the IRIS kit, you must provide the following equipment: Laptop computer (requirements below) Microphone stand Source loudspeaker, power amplifier and the necessary cabling AC power extension lead Headphones for checking the microphone signals Paper and pen Tape measure Electrical insulation tape or gaffer tape is always useful to have on hand Hearing protection 2.3 Computer Requirements Windows 7, Windows 8 or Windows 8.1. IRIS is a 32 bit application and will run on 32 or 64 bit versions of Windows. .NET Framework 4.5.2 and Visual C++ 2013 Runtime (The IRIS installer will download and install these from the internet if necessary) Intel Core i5 or i7 CPU is recommended. At least 4 GB of RAM 2x USB 2.0 ports (for the MOTU 4pre and the HASP protection dongle) 2.3.1 USB 3.0 There are known issues when connecting the MOTU 4pre to a USB 3.0 port on a PC running Windows 7. Please refer to the troubleshooting section for more information. If your PC has only one available USB port, you can try using a USB (2 or 3) hub and connect both the MOTU 4pre and HASP dongle to it. This is not ideal, but it may work just fine. From experience, some hubs appear to work without trouble while others cause drivers to crash – your mileage may vary. 2.4 USB Drive Contents The included USB flash drive contains the following files: Calibration contains the calibration documents for your specific IRIS kit. During installation the data in this folder is transferred automatically to the correct place on the local disk. Example Project contains an example IRIS project with three measurements conducted in the Auckland Town Hall in New Zealand. IRIS User Manual | IRIS Kit 3 HASP Dongle Driver contains the installer for the HASP dongle driver. MOTU Driver contains the installer for the MOTU 4pre driver (version 4.0.5.8373). Plugins contains plugins for other software to communicate with IRIS. Currently there is an extension for SketchUp. IRIS User Manual.pdf is this document. This can also be accessed from the Help menu in IRIS software. IRIS.msi is the Windows Installer MSI package for IRIS. Do not open this to install IRIS, use setup.exe README.txt contains some brief instructions for installing IRIS. setup.exe is the IRIS installer program. 2.5 Calibration Documents Each IRIS kit is shipped with calibration data unique to that kit. There are two calibration certificates issued with each kit, for the included TetraMic and the MOTU 4pre. The TetraMic calibration document is generated by Core Sound when they manufacture the unit. It contains information specific to that TetraMic and used by IRIS to generate a correct set of 3-D signals (1st order B-format) after each recording. It is not an absolute level type of calibration. The MOTU 4pre calibration document is used to ensure each channel is set with precisely the same preamplifier gain. 2.6 Loudspeaker Requirements IRIS generates excitation signals for playing through a loudspeaker – you will need to provide this loudspeaker. Other forms of excitation (e.g. impulsive sources) are not currently supported. You should normally conduct room acoustic measurements in accordance with ISO 3382-1:2009, which requires an omnidirectional source – typically a dodecahedron loudspeaker. It is highly recommended to drive a dodecahedron loudspeaker with a power amplifier which has recallable settings (e.g. a fixed, stepped or digitally controlled gain setting). This is especially important for sound strength measurement, where the gain structure of the system must be set to a known value – whatever was used when the system was calibrated for sound strength measurement. Several modern dodecahedron units on the market have built-in power amplifiers with fixed or recallable gain settings. These are the most practical units – a perfect match for an IRIS measurement system. In some situations a dodecahedron loudspeaker may not be an appropriate source. It comes down to how sound is typically generated and perceived in the room under test. For example: A control room or post-production studio. Sound in such a space will almost always be generated from the installed studio monitor loudspeakers, and thus these should be used for playing back the excitation signal. Investigating an echo in a large auditorium which is excited by the installed sound system. Assessing a room’s response to different loudspeakers with directional characteristics. For example, IRIS could be used to compare the performance of a basic loudspeaker box to a steerable column array in a highly reverberant space. IRIS User Manual | IRIS Kit 4 2.7 Software Installation Procedure You will need to install driver software for the HASP dongle and MOTU 4pre before connecting any hardware and running the IRIS software. These drivers and the IRIS software can be found on the included USB flash drive, or downloaded from www.iris.co.nz/download. If you are just trialling the IRIS software it is not necessary to install these drivers. 2.7.1 HASP Dongle Driver The HASP USB protection dongle contains the IRIS kit license. The serial number for your IRIS kit is printed on this key. Before connecting the dongle, run the HASPUserSetup.exe program and follow the prompts. After this has completed, connect the dongle to your computer and Windows will finish the driver installation. (You may be asked to restart your PC after this process has completed). We will endeavour to keep the HASP driver on the IRIS website up to date, but if you have any issues please try the installer from the official Sentinel website - go to the URL below and download the item labelled “Sentinel HASP/LDK – Windows GUI Run-time Installer”: http://sentinelcustomer.safenet-inc.com/sentineldownloads/?s=&c=all&p=Sentinel+HASP&o=Windows&t=R untime+%26+Device+Driver&l=all The IRIS software will start in evaluation mode if the dongle is not connected. 2.7.2 MOTU 4pre Driver A driver must be installed and configured for the MOTU 4pre to communicate with your computer: 1. Do not connect the 4pre yet. 2. Locate and run SetupAudio.exe in the MOTU Driver folder and follow the prompts. The recommended driver version is 4.0.5.8373. 3. During installation, when prompted which products to install, ensure “Firewire/USB 2 Audio” is selected, as shown below: 4. Connect the 4pre to power and a USB port on your computer. 5. Power it on (single press the right-most button on the front panel). Windows will finish off the driver installation. IRIS User Manual | IRIS Kit 5 6. Driver configuration 7. While the 4pre is connected and powered on, open the application “MOTU Audio Console” 8. Set the “Samples Per Buffer” setting to the maximum value (1024), as shown below. Further information about the MOTU 4pre and the driver installation process can be found on the MOTU website: Product page: http://www.motu.com/products/motuaudio/4pre User Guide: http://cdn-data.motu.com/manuals/firewire-usb-audio/4pre_User_Guide_Win.pdf 2.7.3 IRIS Software Installation 1. Ensure your computer is connected to the internet. 2. Run setup.exe on the USB flash drive to install. 3. If necessary, the IRIS setup program will fetch two components from the internet: .NET Framework 4.5.2 and Visual C++ 2013 Runtime. Follow the prompts to install. You may have to restart your computer during this process – setup will continue automatically when Windows loads again. 4. The IRIS installer will now launch, as shown below. Follow the prompts to install. IRIS User Manual | IRIS Kit 6 5. After IRIS has installed successfully it will appear in the Start Menu in Windows 7 or Windows 8 Start screen under “All Programs”. (If you have trouble finding it, click Start and type IRIS). If you ran setup.exe from the USB flash drive included with your kit, the installer will also setup the calibration information specific for your kit. When you run IRIS for the first time it will automatically select the correct calibration data. Of course, you should verify this before you conduct any measurements. 2.8 IRIS Demo Mode If the HASP dongle is not connected the IRIS software will run in demo mode. It effectively behaves as a viewer – you are able to open and view existing projects, but conducting or importing measurement data is disabled. IRIS User Manual | IRIS Kit 7 3.0 CONDUCT A 3-D MEASUREMENT This section guides you through the steps to set up the IRIS kit equipment, create an IRIS project and conduct a measurement. Ensure the necessary software and drivers have been installed (see Section 2.7). 3.1 IRIS Hardware Overview The measurement system can be divided into three main components – the measurement controller, the source and the receiver. The diagram below illustrates these components and how they are interconnected: Measurement Controller From Receiver (STP Cat5e cable) To Source (TRS Line Level) CBM Line 4 Output MOTU 4pre Source DC Power USB Receiver From MOTU PPAc To CBM (STP Cat5e cable) TetraMic Cable IRIS User Manual | Conduct a 3-D Measurement 8 3.2 Measurement Controller Setup The measurement controller consists of the computer running IRIS software and the MOTU 4pre audio interface. 1. Find a suitable place to set up the measurement controller equipment. Unpack the computer but do not power it on yet. It is very important to ensure the measurement controller and source loudspeaker are being powered from the same AC power outlet. This reduces chance of buzzing in the input and output audio signals due to ground loops. 2. Ensure the CBM box is properly inserted into the back of the MOTU 4pre. 3. Connect power to the 4pre using the included DC power, and connect it to the computer using the USB cable. 4. Power on the 4pre by pressing the right-most button on the front panel. Some lights should appear on the front panel. 5. Connect the HASP protection dongle to a USB port on the computer. 6. Power on the computer and log in to Windows. 7. Open the MOTU software “CueMix FX”. This software is used to configure the 4pre. Note – if CueMix displays an error message saying “No MOTU Audio Devices that support CueMix found”, check that the 4pre is connected and powered on. If the message persists, restart your computer and try again. 8. Click “File”, “Load Hardware Preset…”, select “IRIS” in the list of presets and select OK. This will automatically configure the 4pre for use with IRIS. IRIS User Manual | Conduct a 3-D Measurement 9 9. If there is no IRIS preset for some reason, you will need to configure the 4pre manually. It’s also a good idea to check the following even if you selected the IRIS preset in step 7. a. Set the TRIM of the first four channels to +30 b. Enable 48V (Phantom Power) on the first four channels. This will also enable four red LED 48V indicators on the front panel of the 4pre. CueMix should now look like this: We must also check the internal routing to ensure the inputs are not being sent directly to the outputs, which could cause feedback ringing: c. Locate the “MIX” dropdown box and select “Mix 1”. d. Ensure each channel in CueMix is muted, as shown below. The mute switches turn yellow when enabled. e. Repeat steps c and d for “Mix 2” and “Mix 3”. “Mix 4” will be configured next. 10. Later on it will be useful to monitor the microphone signals over headphones. To set this up: a. Locate the “MIX” dropdown box and select “Mix 4”. b. Ensure the first four input channels and the output is not muted. c. Select the “Phones” menu and ensure “Phones 1-2” is selected d. On the front panel of the 4pre, locate the knob labelled “PHONES” and turn it all the way down. IRIS User Manual | Conduct a 3-D Measurement 10 CueMix should look like this: 11. Please disconnect your computer from wired and wireless networks during an IRIS measurement session. This is very computer dependent, but there is small chance network traffic may cause a glitch in the audio stream during a measurement recording. Note that the 4pre will remember its settings when you power it down and back up again. However, please do check each time. It is crucial that each input channel is configured correctly for IRIS to operate. If you think you accidentally knocked one of the front panel knobs after configuring the 4pre it is a wise idea to repeat the above steps. If you wish to save these settings for recalling later, select “File” and “Save Hardware Preset”. Hardware presets are stored internally in the 4pre and can be recalled independent of the computer it is connected to. IRIS User Manual | Conduct a 3-D Measurement 11 3.3 Receiver Setup The receiver consists of the TetraMic connected to the PPAc transmitter with both mounted on a microphone stand. 1. Mount the TetraMic in an upright position on the microphone stand (i.e. the microphone stem should be vertical with the array at the top). The Core Sound logo on the TetraMic – “CORE” – indicates the forward x-direction. There are two types of microphone stand clips that may be included in your kit: a basic hard clip or a custom Rycote shock mount clip. The latter is highly recommended as it is shock isolated and holds the TetraMic very securely, especially when moving the microphone stand around. a. The Rycote clip supports both 5/8” and 3/8” microphone stand thread sizes. To insert the TetraMic into the Rycote clip: Place the two rubber grommets around the base of the TetraMic with the logo visible, as shown: The Rycote clip has two red clips (appropriately named “Lyre” by Rycote) which fit around the rubber grommets on the TetraMic. Carefully pry open each clip and insert the TetraMic, one clip at a time. It is much easier to do this before attaching to the microphone stand. The result should look like this: IRIS User Manual | Conduct a 3-D Measurement 12 b. If you must use the hard clip, ensure it is attached beneath the knurling as to not scratch the knurling, as shown in the photo below. The hard clip has a 5/8” 27 TPI thread. 2. Attach the PPAc unit to the microphone stand using electrical tape or gaffer tape. 3. Connect the TetraMic to the PPAc using the included TetraMic cable. The mini-XLR 6-pin female end attaches to the TetraMic, and the standard sized 6-pin male XLR connector attaches to the PPAc. 4. Connect the receiver assembly to the measurement controller via the included 30 metre STP Cat5e cable – one end connects to the PPAc (receiver), the other connects to the CBM box (controller). Ensure each end “clicks” securely in place. 5. It is highly recommended to tie the STP cable to one of the microphone stand legs with tape – a strain relief while moving the microphone stand around. 6. The completed receiver assembly should look something like this: TetraMic in Rycote clip TetraMic Cable PPAc (attached with tape) Strain relief STP Cat5e Cable 7. Place the receiver in the first position. ISO 3382-1:2009 specifies a receiver height of 1.2 m above the floor – measure to the centre of the TetraMic array. 8. The horizontal rotation of the TetraMic is not critical, but it is good practice to point it approximately to the source in each position. That is, the side with the “CORE” logo – the positive X-direction – should be directed to the source. Tip: When packing away the receiver, be careful not to unscrew the Rycote clip from its thread adapter, otherwise you may leave the thread adapter behind on the microphone stand. IRIS User Manual | Conduct a 3-D Measurement 13 3.4 Source Setup The source consists of the excitation loudspeaker, loudspeaker amplification and cabling – this is all provided by you. Loudspeaker requirements are given in Section 2.6. 1. If you are using a dodecahedron loudspeaker or other type of portable loudspeaker, set it up in the initial position. ISO 3382-1:2009 specifies that the acoustic centre of the source should be 1.5 m above the floor. 2. As mentioned earlier, ensure that the source and measurement controller are connected to the same AC power outlet. 3. Check the source system (loudspeaker or installed sound system) is powered off or turned down so you don’t generate any clicks or pops while connecting the equipment. 4. Connect the source to output “LINE 4” on the 4pre (see below). LINE 4 The outputs on the 4pre are line level and balanced using 6.35 mm TRS sockets. Loudspeaker amplifiers and sound systems often have XLR inputs – a short TRS male to XLR male cable can be a very practical addition to your IRIS kit (this is not included). IRIS uses LINE 4 because its output gain is fixed from the 4pre’s point of view and cannot be adjusted using CueMix or the front panel knobs. This gives IRIS complete control of the output level which simplifies sound strength measurement (G and related parameters). If you are measuring sound strength, ensure you connect the source in the same way as when you calibrated the system for sound strength (e.g. the same types of cables and adapters). 5. After the source has been connected, you are safe to power it on. If you are measuring sound strength, make sure you set the amplifier at the value that was used at the time of calibration. IRIS User Manual | Conduct a 3-D Measurement 14 3.5 Create a New IRIS Project With the physical IRIS equipment set up, you are now ready to open IRIS software and conduct a measurement. The IRIS software has a concept of projects and measurements. A project typically represents a single space or measurement session, and consists of a collection of measurements. To create a new project: 1. Start IRIS software. The easiest way to locate it is to click Start and type IRIS. 2. The initial window is shown below. 3. Click NEW PROJECT to open the new project window and fill in the necessary details. At least a name should be provided. 4. Click OK to create the project. IRIS creates a new folder within the specified “Projects Folder” path with the name of the project. All project and measurement data is stored in this folder. The project file is found in this folder with the *.iris extension. Before adding a measurement to this project, we must check the IRIS software is configured to record measurements correctly. IRIS User Manual | Conduct a 3-D Measurement 15 3.6 Configure Audio Settings 1. Click on AUDIO SETTINGS in the toolbar. This window is used to configure the audio hardware and the corresponding calibration documents. On first load IRIS will attempt to enter in the correct details for your kit automatically, but you should check these before conducting any measurements. An example is shown below: 2. Set the RECEIVER TYPE to TetraMic. 3. The section labelled IRIS SYSTEM CALIBRATION is for selecting the calibration data specific for your kit. a. MOTU 4pre – check the serial number for your MOTU 4pre (printed on underside of 4pre) is selected here. If this dropdown box is disabled, check the MOTU 4pre is connected and powered on, and restart IRIS. For details about the MOTU 4pre calibration, refer to the Calibration section of this manual. b. TetraMic – the number in this field must match the serial number of your TetraMic (printed on the back of the TetraMic). For details about the TetraMic calibration, refer to the Calibration section of this manual. c. Strength Calibration – if you have calibrated your IRIS kit with a specific dodecahedron loudspeaker for sound strength measurements, you may select the corresponding calibration document here. This calibration process is described in Section 7.0. Select “None” if you are not interested in measuring sound strength. 4. The final setting to check is the sample rate – either 44100 Hz or 48000 Hz. Select your preference. 5. The remaining fields (ASIO Driver, and the output and input channels of the audio device) will be set automatically when you specify the 4pre calibration. 6. Click OK to accept the audio settings. IRIS User Manual | Conduct a 3-D Measurement 16 Please ensure the 4pre and TetraMic calibration documents are correctly specified – measurements cannot be re-processed with a different set of calibration data after they have been recorded. However, this is not true for the strength calibration – this can be applied before or after the measurement is recorded. If the calibration documents for your kit are not available in Audio Settings, you probably didn’t install IRIS from the included USB drive. Import the calibration data from your USB drive (see Section 6.4) and then follow these steps again. 3.7 Configure Stimulus Settings IRIS currently uses just one type of excitation signal – a single exponentially swept sine wave. It must be configured correctly so that a recording fully captures the room’s response, as well as providing adequate signal-to-noise ratio. 1. Select STIMULUS SETTINGS in the toolbar. 2. Sweep Time - specify an adequate sweep time in seconds. Recommended settings are: a. For a small rehearsal space, recording studio or classroom type spaces – 10 seconds. b. For medium to large sized spaces, such as a large concert hall or auditorium – 30 seconds. The sweep time affects the resulting signal-to-noise ratio (SNR) of the recorded impulse response – a longer sweep injects more energy into the room and thus increases the SNR. The level of the room response signal is consistent with changes in sweep time – it’s only the noise level which changes. That means energy parameters (e.g. sound strength) will not be affected by changing the sweep time as long as the SNR is sufficient. Note: The SNR is also affected by the volume of the source – it must be sufficiently loud for the recommended times above to apply. The source power amplifier should be fixed to a certain level and never changed throughout a measurement session. The volume of the source can still be adjusted from within IRIS as IRIS can compensate for it. This will be discussed shortly – see Record Measurement. After a measurement has been recorded, the first step is to check the decay range (a measure of the SNR) in each band is acceptable. If not, you must increase the sweep time or the volume of the source. Note that the maximum allowable sweep time is fixed to 30 seconds. This should be more than enough for most circumstances. IRIS User Manual | Conduct a 3-D Measurement 17 3. Impulse Response Time – specify an impulse response time in seconds which is sufficiently longer than the room’s decay time. This is the length of the impulse response recording. A good rule of thumb is to clap in the room, count how long it takes for sound to decay and then add a couple of seconds to this number. 4. Advanced Sweep Settings – this section allows you to control the start and end frequencies of the exponentially swept sine wave. In almost every circumstance these should be set to 20 Hz and 20 kHz, respectively. This will almost always be wider than the loudspeaker’s response, to ensure the room is excited with the widest range of frequencies as possible. If there is concern about damaging the source loudspeaker, you may reduce this frequency range as necessary. If you reduce the range you risk losing information and SNR in some bands. The rule of thumb – don’t change these frequencies. 5. Click OK to save changes. 3.8 Add Measurement 1. To add a measurement to the project, click on the ADD MEASUREMENT button in the toolbar. This adds an empty (i.e. not-yet-recorded) measurement to the list on the left hand side. 2. Enter in details for the measurement – a description, source position, receiver position, and any notes. IRIS User Manual | Conduct a 3-D Measurement 18 3.9 Record Measurement The RECORD button should now be enabled – you are ready to record this measurement. 1. Click RECORD button to bring up the record measurement window. 2. If the hardware is connected and working correctly, you should see some activity on the input level meters – clap your hands to check. 3. At this point, it is highly recommended you listen to the microphone signals over headphones – this will reveal any issues with noise or buzzing which may not be apparent by inspecting the level meters. a. The 4pre should already be set up for monitoring signals over headphones (see Section 3.2). b. Connect headphones to the PHONES socket on the front of the 4pre. Adjust the knob directly above this socket to change the volume of the headphones. You should hear only acoustic background noise as it is picked up by the TetraMic – if there is severe buzzing or other unusual noises there may be an issue with AC power, interference from something or a problem with the IRIS hardware. See the troubleshooting section for more information. 4. Before you record the first measurement, you must also set the source loudspeaker to a suitable volume. a. Set the source power amplifier to an appropriate level. If you are using a system calibrated for sound strength you will need to set the amplifier to precisely the same setting as when it was calibrated. b. In IRIS, set the Output Gain to its minimum setting. c. Click the TEST TONE button to play a test sweep. d. Slowly increase the Output Gain slider until the test sweep is sufficiently loud. e. Click the same button (it now says STOP) to stop the test sweep. Note the test sweep also stops automatically after 30 seconds. IRIS User Manual | Conduct a 3-D Measurement 19 If you need to adjust the volume of the source during a measurement session, use the Output Gain slider. Do not adjust the power amplifier once it is set as IRIS will not know a change has been made. IRIS takes into account the Output Gain slider value when calculating results. That means, for example, the measured sound strength at a position will be consistent regardless of the source volume – assuming there is sufficient SNR. 5. You are now ready to record the measurement. Click the RECORD button and wait for the measurement to complete. IRIS will play a sweep followed by a period of silence. Ensure the room is as quiet as possible for the duration of the recording – until the progress bar reaches the end. 6. If the measurement completes successfully, the record window will disappear and IRIS will display the results. If the resulting recording is excessively noisy (i.e. almost noise and no signal) IRIS will show an error message like the one below. This is probably a result of the hardware kit being improperly connected, a very quiet source loudspeaker, or a very short sweep. 3.9.1 Acoustic Background Noise Ideally the space will be completely silent during a recording, but in practice this is unlikely. The most common type of noise encountered is probably low level steady-state broadband noise, such as from a ventilation system. IRIS is particularly robust to this type of noise – when the recorded sweep is deconvolved into an impulse response, this type of noise is attenuated significantly. Impulsive noise, on the other hand, should be avoided as much as possible. This could be talking, footsteps, a door closing or a loud truck passing by. If an event like this occurs and it is considerably loud, please cancel and repeat the recording. IRIS User Manual | Conduct a 3-D Measurement 20 3.10 Completed Measurement After the measurement has completed successfully, IRIS will look something like the screenshot below. The IRIS window can be divided into four sections: 1 2 3 4 1. List of measurements – click a measurement to view it. 2. Measurement information – details of the source and receiver locations, a summary of the results, and also details of the recording setup. 3. Detailed results display – either IRIS 3D PLOT or PARAMETERS 4. Waveform view – this displays the pressure impulse response signal as either a linear or log waveform. When the IRIS 3D PLOT is displayed, the waveform will be filtered according to whatever is specified in the IRIS plot settings (note this uses a zero-phase filter). When PARAMETERS is being displayed, you can apply a filter to the waveform using the Band setting in the waveform display (note this uses a typical IIR minimum-phase type filter). The waveform is also annotated with the decay curve for that band (i.e. the backward integrated impulse response). 3.11 Check Measurement Quality Before analysing the measurement, you must check the quality of recorded impulse response. There are two things to inspect – the decay range and the onset time. Decay Range The decay range is the effective signal-to-noise ratio of the measurement (specifically, of the omnidirectional impulse response signal). 1. Click on the PARAMETERS tab to view the table of acoustic parameters IRIS User Manual | Conduct a 3-D Measurement 21 2. Inspect the decay range (first row) in each band of interest, for example: You should aim to have at least 45 dB in each band for calculating the IRIS plot and most acoustic parameters. In the example above, this requirement was easily met in each band except 63 Hz – this is expected as the loudspeaker used (a dodecahedron) is very inefficient at 63 Hz. To increase the decay range, you can increase the sweep time (in Stimulus Settings window) or increase the volume of the loudspeaker using the output gain slider in the Record Measurement window. Keep in mind that most loudspeakers will not sufficiently radiate sound at 63 Hz unless there is a subwoofer in your source setup. If the decay range is extremely large, it might be worthwhile to decrease the sweep duration and save some measuring time. Onset Time The onset time is the start of the impulse response – the moment when the direct sound first arrives. All calculations depend on this time so it is very important it is correct. IRIS automatically detects the onset, but it can be fooled into choosing an earlier time if there was excessive crosstalk in the measurement hardware. To check for the presence of crosstalk: 1. Zoom in to the start of the waveform where time = 0 (use buttons or mouse wheel to zoom). 2. Crosstalk will present itself a peak before the actual start of the impulse response, for example: Here IRIS thinks time = 0 is at this crosstalk peak, but the actual onset is clearly slightly later. 3. Manually adjust the onset time by clicking on “Edit Onset Time”. Use the cursor to select on the waveform where the actual onset is, for example: It is usually quite easy to avoid crosstalk peaks in the first place – if you are using an external power amplifier to drive the source, make sure the amplifier and the cable driving the loudspeaker are physically far away from any of the other cables and equipment (a few metres or more). Keep this in mind as you move the receiver around the room. Alternatively, use an active (dodecahedron) loudspeaker, as the power amplifier is contained within the unit. IRIS User Manual | Conduct a 3-D Measurement 22 3.12 Delete Measurement To delete a measurement, open that measurement and select the “DELETE MEASUREMENT” button. Click OK when the confirmation window appears If you wish to repeat a recording, you do not need to delete the measurement first. Recording again will overwrite the existing data. IRIS User Manual | Conduct a 3-D Measurement 23 4.0 IRIS PLOT IRIS provides an intuitive and interactive visualisation of the 3-D impulse response data in the form of an “IRIS plot” – an example is shown below. This plot illustrates sound energy arriving at the receiver position (the origin) as a series of vectors or spikes, where the length of each vector indicates level, the angle is the incoming direction, and colour corresponds to time of arrival. IRIS plots can be useful for Visualising the link between the architecture of a space and how it sounds Comparing the acoustical characteristics at different positions (in the same room or in different rooms) Observing the directional distribution of early and late energy, for example seeing how laterally distributed the early reflections are, or how diffuse the sound field becomes Identifying acoustic anomalies A word of caution – it is important you understand what the IRIS plot represents and how it is generated before making any conclusions. At one level an IRIS plot is very intuitive, but you should also be aware of its limitations. Please read through the following sections before analysing the IRIS plots generated from your own measurements. The best way to become familiar with IRIS plots is through examples – please spend some time to read through the case studies here: http://www.iris.co.nz/case-studies/ IRIS User Manual | IRIS Plot 24 4.1 IRIS Plot Display The IRIS 3D PLOT display is used for manipulating and interacting with the IRIS plot. To rotate the IRIS plot in 3-D about the origin (i.e. the receiver position), hold the left mouse button and drag. Alternatively, use the buttons: Zoom using the mouse wheel or the magnifying class buttons: To view the IRIS plot in any of the 2-D planes, use the XY, XZ and YZ buttons: If you push one of these buttons again, it will look at the plane from the opposite direction. Select orthographic or perspective views using the following buttons: IRIS User Manual | IRIS Plot 25 4.2 IRIS Plot Generation 1. The four tetrahedral cardioid signals from the TetraMic are not used directly – after a recording they are converted into another 3-D system called first order B-format. B-format encodes the pressure (omnidirectional) and three particle velocity (figure-of-8) signals in the X, Y and Z directions. 2. IRIS identifies the relevant part of the recording to analyse – from the onset of the direct sound to where the impulse response decays into noise. 3. The four B-format signals are filtered according to the “Filter” selection: A zero-phase filtering process is used, which does not delay energy in time – this is so spikes on the IRIS plot represent the same slices of time, regardless of which band is selected. The waveform display will show the filtered signal, using the same zero-phase filter. Typical octave band filters are provided, as well as a 1-8 kHz filter which may be useful for measurements in control room studios. 4. The filtered B-format impulse response is then divided into a series of non-overlapping rectangular windows. The length of these windows is determined by the Resolution control. The recommended resolution for most situations is 2 ms. For very small rooms, such as a control room, a resolution of 1 ms is probably more appropriate. These slices are annotated on the waveform if you zoom in – note the tick marks along the top, which indicate the start of each window. Short time windows introduce a low frequency limitation – for example, the lowest frequency a 2 ms window can encapsulate is 500 Hz. This is why the two bands below 500 Hz are disabled in the Filter selection box in the previous step. This is also means a broadband IRIS plot with a 2 ms resolution is actually only showing 500 Hz and higher. Lower frequencies behave more like DC offset. IRIS User Manual | IRIS Plot 26 5. The RMS sound pressure level for each window is calculated. There are two factors which control how the level in decibels is calculated: a. The “Level Reference” determines what 0 dB means in the IRIS plot – either the broadband level of the first window (i.e. the direct sound) of this measurement or another measurement (“Global”). b. The “Range” control determines the dynamic range of the IRIS plot. The default is 40 dB and this may be adjusted in 10 dB increments. For example, a range of 40 dB means spikes of levels less than -40 dB are ignored and not displayed. Levels greater than 0 dB will still be displayed, however, such as when focusing occurs (resulting in a level greater than the direct sound). This means the actual dynamic range of an IRIS plot may be larger than what is stated in the Range control. 6. The average direction of sound energy flow in each window is determined using a sound intensity technique – the product of pressure and particle velocity. 7. The data for each window forms a single spike on the IRIS plot. The RMS pressure level in dB translates to the spike length, the spike points in the average direction of the incoming energy, and the spike is coloured according to its time-of-arrival. 8. There are three options for colouring the spikes according to their time of arrival. These can be adjusted using the “Time Intervals” control. Music Speech Studio These time intervals are also shaded in their respective colours on the pressure waveform. The number in brackets following “Inf” in the key is the actual time IRIS stops analysing the impulse response – the point at which the signal decays into noise. Note this point changes with the selected filter. 9. It is often useful to rotate an IRIS plot so that its direct sound vector is aligned in a certain direction, especially for comparing multiple measurement positions. By selecting “Align direct sound xy to xaxis”, the IRIS plot will be rotated in the horizontal (xy) plane so that its direct sound is aligned with the X-axis. IRIS User Manual | IRIS Plot 27 4.3 Level Reference By default, the broadband direct sound (i.e. the first window) of an IRIS plot is assigned a level of 0 dB, and subsequent reflected energy is relative to this. This means IRIS plots from multiple measurement positions in a room will always look a similar size – the direct sound vector is always the same length. In reality, however, the direct sound level at a position far from the source will normally be attenuated compared to a position close to the source. If you wish to see this on the IRIS plots, you can assign a global level reference: 1. Identify and open a measurement which you would like to use as the reference. The loudest one, closest to the source, is usually a good choice. 2. With that measurement selected, from the “Measurement” menu, select “Set as IRIS Plot Reference”. 3. This measurement is now set as the global level reference. The reference measurement is indicated by an “R” in the list of measurements. 4. Over in the IRIS plot view, the “Level Reference” control is now set with the global reference. The number in brackets is the index of the measurement. Now when you open other measurements in the project, the IRIS plots will be drawn relative to the reference measurement. A plot for a position far from the source will generally look smaller than one closer to the source. To clear the level reference, select the “Measurement” menu and then select “Clear IRIS Plot Reference”. Note that this level reference feature only works if the source amplifier was not adjusted in any way during a measurement session. If you need to adjust the volume of the source, use the Output Gain slider in the Record window – these changes will be taken into account. IRIS User Manual | IRIS Plot 28 4.4 Discussion on Time Windows As stated earlier, increasing the window size will improve bandwidth, but at the loss of time resolution. A 2 ms resolution seems like a suitable compromise for most medium to large rooms. In very small rooms, where reflection density increases very quickly, 1 ms may be more appropriate. The anechoic impulse response of a real loudspeaker will never be a perfect Dirac delta function. It will be spread in time and take in the order of a few milliseconds for most of its energy to decay. Thus it seems appropriate to choose a window size on the order of this loudspeaker decay time. A window time much smaller than this would seem inappropriate – what does a small segment of one arrival mean? The reflection density in the early part of a large room should also be sparse enough that a 2 ms window could enable the analysis of individual early reflections. A larger window size would limit this ability somewhat. In the later part, when the reflection density is very high, we also want a short enough window size to assess the diffuse nature of the field. A larger window would result in fewer spikes and make the IRIS plot look sparse – perhaps a misleading representation of the sound field. There is no obvious method for how to window and analyse the impulse response in time. IRIS uses nonoverlapping rectangular windows, which was partly chosen because it is very straightforward to calculate. There may be other windowing techniques which are more suitable, but regardless, the key thing here is to understand how the windowing process works and interpret the results accordingly. 4.5 Analysis of Individual Events Despite the spiky appearance of the IRIS plot, individual spikes do not necessarily correspond to individual reflections – in fact this is almost never the case. In the very early part of a large room, where reflections are well separated in time, there is a small chance that a time window will encapsulate one reflection and nothing else. This is quite unlikely, however. Even in the early part, it is likely that multiple events will occur within one window. As time progresses and the reflection density increases, there may be hundreds of reflections occurring within one window. The resultant spike for such a window shows the average direction (i.e. the vector addition) of all energy contained within that window. IRIS can be used – with care – to analyse the direction of a problematic echo. If the echo is sufficiently louder than the surrounding energy (which should be the case), then it would be suitable to look at direction of the spike(s) representing that echo. First locate the echo in the waveform and then select the nearest time window(s) to identify the corresponding spikes in the IRIS plot (see next section). It is recommended that you conduct multiple measurements at nearby receiver positions to refine the localisation of an echo. 4.5.1 Select Vector IRIS allows you to select a specific vector and see its corresponding segment in the waveform display. There are two approaches to select a vector: Hold Ctrl and left mouse click a vector on the IRIS plot, or Hold Ctrl and left mouse click a time window on the waveform. You should be sufficiently zoomed in on the waveform before attempting this. IRIS will highlight both the vector (by increasing the diameter of the spike) and its corresponding segment of the waveform (by shading). IRIS will also display the level, direction and time information for that specific vector in the lower right corner of the IRIS plot display – “Selected Vector”. An example is shown in the screenshot below. Here the red vector – the direct sound – was selected. The red vector is now enlarged on the IRIS plot, and its corresponding segment of the waveform has been highlighted. The “Selected Vector” section gives the specific details for that slice of energy. IRIS User Manual | IRIS Plot 29 4.6 Directional Accuracy The accuracy of directional information captured by IRIS and the TetraMic relies on the microphone capsules being at the same point in space or “coincident”. This holds true for low frequencies where the wavelength is much larger than the spacing of the capsules. However, as wavelength decreases the capsules appear to be increasingly less coincident, and the accuracy of directional information begins to decrease. This becomes an issue above about 5 kHz for a TetraMic. When the broadband or “1-8 kHz” filter is selected, IRIS calculates directional information from signals which have been low-pass-filtered at 5 kHz. The magnitude information is calculated from the original signals. From measurements in anechoic chamber, it was found that IRIS was generally accurate to within ±7.5 degrees for horizontally arriving sounds. For detailed results, please consult this paper: http://www.iris.co.nz/media/14459/ISRA2013.pdf. IRIS User Manual | IRIS Plot 30 5.0 ACOUSTIC PARAMETERS IRIS calculates acoustic parameters in octave bands according to ISO 3382-1:2009. IRIS uses a window-then-filter approach, as recommended by the standard. IRIS uses IIR octave band filters (unlike the zero phase filters used by the IRIS plot) of order 6. The various parameters are listed below: 5.1 5.2 Signal-To-Noise Ratio Decay range – the range of the backwards integrated impulse response in dB. Time Parameters Early Decay Time (EDT) Reverberation Time (T20, T30) 5.3 Strength Parameters Strength (G) Early Strength (G Early) Late Strength (G Late) These values will appear blank unless you have calibrated your IRIS system for measuring sound strength. 5.4 Spatial Parameters Lateral Fraction (LF) Lateral Fraction Cosine (LFC) Late Lateral Strength (GLL) IRIS is able to calculate LF, LFC and GLL directly. This is very straightforward – much more so than a traditional dual-microphone system. The TetraMic is a purpose built microphone array - you don’t need to consider microphone spacing, custom mounting arrangements or the potential error due to multiple microphones obstructing each other. The array is sufficiently coincident within the frequency range of interest (125 Hz to 1 kHz octave bands). The individual capsules of the TetraMic are precisely matched in sensitivity (part of the TetraMic calibration process performed by Core Sound) – you don’t need to perform any calibration measurements. IRIS automatically aims a virtual lateral figure-of-8 microphone in post-processing. It detects the direct sound direction using the first 2 ms of the recorded impulse response and points the null of the virtual figure-of-8 microphone in this direction. This assumes the TetraMic is in an upright position. This is not critical, but you should still attempt to aim the TetraMic’s positive X-direction to the source. The GLL parameter requires the system to be calibrated for sound strength. The LF measurement ability of IRIS was thoroughly tested in a simulated sound field and compared to two popular dual-microphone techniques. IRIS was found to be accurate to within one just-noticeable-difference for LF. If you are interested in the technical details and results of this experiment, you can find them here: http://www.springer.com/-/0/998145cae90e47d98050b70130556064 IRIS User Manual | Acoustic Parameters 31 5.5 Energy Parameters Clarity (C80 and C50) Definition (D50) Centre Time (Ts) 5.6 Stage Parameters ST Early ST Late IRIS User Manual | Acoustic Parameters 32 6.0 CALIBRATION Three aspects of the IRIS kit are calibrated in some way: Core Sound TetraMic MOTU 4pre The entire IRIS kit for measuring sound strength 6.1 Core Sound TetraMic Each TetraMic is tested after it is manufactured and a set of calibration data specific to that unit is generated. IRIS uses this data to generate the correct set of 3-D signals after a recording. Note this is not an absolute level type of calibration. The TetraMic calibration data is included on the USB drive for your kit. The installer will copy this to the correct location, as long as you run setup.exe from the USB drive. We have found that the TetraMic is very robust with time, but it is suggested that you return your TetraMic for re-calibration as necessary – ideally every 3 years if you use your kit regularly. Contact your distributor for more information. 6.2 Audio Device/MOTU 4pre The MOTU 4pre calibration ensures the four input channels are set at precisely the same gain – a critical requirement for the TetraMic to work correctly. Each channel must be gain-matched to within 0.1 dB. Even though each input channel on the 4pre is configured with the same gain (+30 dB), in practice they are not precisely the same – sometimes different by (slightly) more than 0.1 dB. The MOTU 4pre calibration document is also included on the USB drive for your kit. The installer will copy this to the correct location, as long as you run setup.exe from the USB drive. This is an electrical calibration and should not change with time unless your unit becomes damaged. Contact your distributor if you have any concern. 6.3 Sound Strength If you wish to measure sound strength, you may calibrate your entire IRIS system (including the source which is provided by you). Details are given in the Sound Strength Calibration section. IRIS User Manual | Calibration 33 6.4 Import Calibration Data Calibration documents can be imported into IRIS using the “Import Calibration Data” window. This can be found in the Edit menu. 6.4.1 Import TetraMic Calibration Data The TetraMic calibration data includes a text file and a folder, both named with the serial number of the TetraMic. For example: The folder contains eight files with the extension *.IIR. To import the TetraMic Calibration data, click the + button and then locate the text file. 6.4.2 MOTU 4pre Calibration The MOTU 4pre calibration document is a single XML file named with the serial number of the 4pre. 6.4.3 Sound Strength Calibration The sound strength calibration document is a single XML file. 6.4.4 Calibration Data on Disk The calibration data is stored in the user profile. If you wish to get access to it – for example transferring the sound strength calibration document you created to another computer - select the “Click to view calibration data on disk” link in the “Advanced” section of the import window. IRIS User Manual | Calibration 34 7.0 SOUND STRENGTH CALIBRATION This section outlines the steps to calibrate your IRIS kit to measure sound strength (G) and related parameters (G Early, G Late and GLL). The sound strength parameter compares the energy of the measured impulse response to the energy of the response measured in a free field at a distance of 10 metres from the source. The formal definition is given in ISO 3382-1:2009. The purpose of this calibration process is to determine the relative level of the source at 10 metres in a free field. Note that absolute levels are not considered here as sound strength is a relative quantity. These calibration measurements can be conducted in either a free field or a diffuse field. The diffuse field method is preferable as it takes into account the directivity of the source and receiver elegantly and requires considerably fewer measurements than the free field technique. 7.1 Hardware Requirements It is crucial you use a source amplifier which has a fixed or recallable gain control – the gain setting used for the calibration measurements must be recalled exactly for conducting room measurements. It is also critical you use the same type of cables and adapters to connect the source to the MOTU 4pre for any subsequent measurements. For example, you can’t use an unbalanced cable if you calibrated with a balanced cable – this will send a 6 dB quieter signal to the loudspeaker. 7.2 Diffuse Field Method The diffuse field method requires a reverberation chamber. This technique is rather elegant in that the directional responses of the source and receiver are taken into account in a single measurement. However, you must still conduct several measurements at different positions as the sound field may not become perfectly diffuse (especially at low frequencies). 1. Set up IRIS kit as described in the Conduct a 3-D Measurement section. Ensure the microphone preamps are always set at +30 dB. 2. Set the source amplifier gain sufficiently high and fix it. This setting must be recalled precisely for any future measurements. Attenuate the output as necessary in the IRIS software. You should always leave room for more output gain in the IRIS software – the level required to excite a large dead room might cause the microphones to overload in a reverberation chamber. 3. Identify the source and receiver positions you will use in the reverberation chamber. Aim for at least 2 source positions and 3 receiver positions (totalling 6 measurements). Try and avoid placing the source and receiver too close to any boundary. The orientation (rotation) of the source and receiver are not important. 4. Create a new project in IRIS which will contain only these calibration measurements. 5. Configure stimulus settings – 30 second sweep time and a suitably long impulse response time (typically at least 10 seconds for a reverberation chamber). A sweep time of 30 seconds is probably over-the-top for a reverberation chamber, but it’s a good thing to aim for very high quality calibration measurements. ISO 3382-1:2009 specifies the measurements should have at least 30 dB of decay range. This should be very easily attainable (except for maybe 63 Hz). 6. Record the measurements. 7. Your IRIS project should now have a collection of recorded calibration measurements and nothing else. Please delete any test or duplicate measurements before continuing. 8. Select “Project” menu and click “Create Strength Calibration Document” 9. Check the “diffuse field” radio button 10. Enter the air volume of the reverberation chamber IRIS User Manual | Sound Strength Calibration 35 11. Click the CALCULATE button. This will calculate the relative sound pressure level at 10 metres from the source in a free field. It may take a few seconds. 12. Enter a description for this strength calibration document 13. IRIS detects the receiver ID (the TetraMic serial number) and the audio device ID (name of the ASIO driver), which will be included with the calibration document. 14. Click SAVE. IRIS will create the calibration document and add it to its internal list. An example of the “Create Strength Calibration Document” window is shown below. 7.2.1 Theory The relative sound pressure level measured 10 metres from the source in a free field ( from spatially averaged diffuse field measurements using the following formula: ) is calculated where is the spatially averaged sound pressure exposure level measured in the reverberation chamber. is the air volume of the reverberation chamber in cubic metres. is equal to . is the reverberation time of the room in seconds. IRIS User Manual | Sound Strength Calibration 36 7.3 Free Field Method The free field method ideally requires an anechoic chamber, but a sufficiently large reverberant space may be an acceptable approximation. Anechoic Chamber ISO 3382-1:2009 specifies placing the receiver at least 3 metres from the source. The standard also says it is necessary make measurements at 12.5° around the sound source to smooth out the directional response of the source. The above two requirements imply you will need an anechoic chamber of wedge-tip dimensions of at least 6 metres. You may have to compromise on the source-receiver distance if your anechoic chamber is not this large. Alternatively, it may be acceptable to place the source on a turntable and rotate the source in discrete increments of 12.5°. Large Reverberant Space If you are planning to measure in a large reverberant space, you should place the receiver no further than the reverberation radius from the source, even if it is within 3 metres. Set up the source and receiver far away from any boundaries. The challenge is the floor – place the source and receiver on stands at their highest practical height. If possible, find a large piece of highly absorptive material and place this on the ground between the source and receiver – hopefully this will help to reduce the floor reflection. You should attempt to make measurements around the source at 12.5°, but it may be more practical to keep the receiver stationary and rotate the source on its axis (for example, using a turntable). This is to smooth the directional response of the source. This solution is an approximation at best and the sound strength results must be interpreted accordingly – with a grain of salt. Ideally the calibration will be performed in a laboratory. Calibration Steps 1. Set up IRIS kit as described in the Conduct a 3-D Measurement section. Ensure the microphone preamps are always set at +30 dB. 2. Set the source amplifier gain sufficiently high and fix it. This setting must be recalled precisely for any future measurements. Attenuate the output as necessary in the IRIS software. You should always leave room for more output gain in the IRIS. 3. Set up the source and receiver following the guidelines above. Accurately measure the sourcereceiver distance. The front of the TetraMic (positive X-direction) should be facing the source. 4. Create a new project in IRIS which will contain only these calibration measurements. 5. Configure stimulus settings – 30 second sweep time and an appropriate impulse response time. If you are measuring in a reverberant space, capture the whole decay as you can window the response later. 6. Record the measurements. 7. Your IRIS project should now have a collection of recorded calibration measurements and nothing else. Please delete any test or duplicate measurements before continuing. 8. Step through each measurement and inspect the direct sound part of the waveform. This is for the purpose of defining a suitable window size to isolate the direct sound –a critical step if you measured in a reverberant space. Pick the latest possible time after the direct sound has decayed but before the first (floor) reflection occurs. IRIS User Manual | Sound Strength Calibration 37 9. Select “Project” menu and click “Create Strength Calibration Document” 10. Select the “free field” radio button. 11. Enter the source-receiver distance in metres. 12. Enter the direct sound window time duration you decided from step 8 in milliseconds. 13. Click the CALCULATE button. This will calculate the relative sound pressure level at 10 metres from the source in a free field. It may take a few seconds. 14. Enter a description for this strength calibration document 15. IRIS detects the receiver ID (the TetraMic serial number) and the audio device ID (name of the ASIO driver), which will be included with the calibration document. 16. Click SAVE. IRIS will create the calibration document and add it to its internal list. 7.3.1 Theory The relative sound pressure level measured 10 metres from the source in a free field ( from the directionally averaged free field measurements using the following formula: ) is calculated where is the directionally averaged sound pressure exposure level measured at a distance in a free field. IRIS User Manual | Sound Strength Calibration from the source 38 7.4 Apply Sound Strength Calibration Document After you have a successfully calibrated your kit for sound strength, IRIS adds the corresponding strength calibration document to its internal list. You must then explicitly tell IRIS which calibration document to use when processing results (because you may have several strength calibration documents loaded in IRIS). There are two ways to do this: Pre-recording – in AUDIO SETTINGS select your desired sound strength calibration document in the “Strength Calibration” box. When you record a measurement, IRIS will calculate G according to this document. Post-recording – you can apply a strength calibration to a measurement or the entire project of measurements retrospectively (i.e. after they have been recorded). 1. Select “Measurement” menu and then “Change Strength Calibration” 2. Select the strength calibration document from the dropdown list. 3. In most cases, you probably want to apply this strength calibration document to the whole project – check the box “Apply to all…” 4. Press OK. The measurement will be recalculated taking into account the newly selected strength calibration document. If you attempt to apply a strength calibration document to a measurement which was conducted with different equipment (i.e. a different receiver and audio device ID), IRIS will let you proceed but will give you a warning. IRIS User Manual | Sound Strength Calibration 39 8.0 IMPORT AND EXPORT 8.1 Import Impulse Response IRIS can import existing impulse response wave files, both B-format and mono wave files. It currently supports standard wav files. You can use this feature to visualise, for example, a B-format impulse response generated in Odeon. 1. Select the “Measurement” menu, “Import”, then “Import Impulse Response”. 2. Locate the impulse response *.wav file 3. IRIS will add this as a new measurement to the project. 8.2 Export IRIS Plot Image TBC. 8.3 Export IRIS Plot Data The IRIS plot data can be exported in various formats for the purpose of visualising plots in other software. Two formats are currently supported: Generic text file (tab separated values) SketchUp – see Sketchup Integration section. To export the IRIS plot data: 1. Configure the IRIS plot with the desired settings 2. Select “Measurement” menu, “Export”, then “Export IRIS Plot data” 3. In the save window, use the “Save as type” field to select which format to export the IRIS plot data in, for example: 8.3.1 TSV Format Tab separated values is a generic format which could be interpreted by a variety of software. An example export is shown below: IRIS User Manual | Import and Export 40 8.4 SketchUp Integration IRIS plots may be loaded into SketchUp via a custom extension for the purpose of visualising a plot inside a model of the room, and also extending the plot rays to the boundaries of the room. 8.4.1 Install SketchUp Extension The extension should work on a variety of SketchUp versions, but install the latest (2015 at the time of writing) if you have any trouble. You can use the Make (free) or the Pro version. 1. Open SketchUp, select “Window” then “Preferences”. 2. Select “Extensions” on the left. 3. Click “Install Extension” and locate the IRIS.rbz file. You can find this on the USB drive in your IRIS kit or you can download it from www.iris.co.nz/download. 4. Click “Yes” when asked about file system access. 5. Click “OK” after the extension installed successfully. IRIS User Manual | Import and Export 41 6. You will now see “IRIS” in the list of installed extensions in SketchUp. Tick the IRIS entry, as shown below, then press “OK”. 7. The installed extension will appear as a toolbar in SketchUp: IRIS User Manual | Import and Export 42 8.4.2 Load IRIS Plot into SketchUp 1. Open the IRIS measurement you wish to view, and configure the plot with the desired settings. 2. Select “Measurement” menu, “Export”, then “Export IRIS Plot data” 3. In the “Save as type” field, select “IRIS to SketchUp text file”. 4. Save this *.txt file somewhere on your computer. 5. In Sketchup, load the corresponding room model. 6. Enable the “Styles” toolbar if it is hidden: a. Select “View”, “Toolbars…” b. Scroll down and tick “Styles” c. Click “Close” 7. On the Styles toolbar, enable “X-Ray” and “Shaded” buttons, as shown below. X-Ray Shaded “Shaded” is not essential – just ensure “Wireframe” is not selected when you import IRIS plots. 8. Identify the correct source and receiver points for the IRIS plot in your model. One technique is to use the line tool. For example, if you know where the source was with respect to some point, you can draw lines of know lengths from that point to help you locate the source – like this: Source Receiver 9. Click the “Import IRIS Plot” button 10. Click the receiver point, and then click the source point. 11. A dialog will pop up. Open the *.txt file you saved previously from step 4. IRIS User Manual | Import and Export 43 12. A message should appear saying the IRIS plot has imported successfully – the IRIS plot is now in the room model. 13. It may help to now enable the “Wireframe” style, so that you can see the IRIS plot without obstruction. You may load multiple IRIS plots into the room model – simply repeat the preceding steps. 8.4.3 Show/Hide Time Intervals The vectors for one plot are organised in layers according to their time interval (colour), and these are listed in the “Layers” window in SketchUp. Use the “Visible” tick box to selectively show and hide different layers. 8.4.4 Extend Rays to Boundaries The IRIS plot rays may be extended to the boundaries of the room. Please be careful how you interpret this – as discussed earlier, spikes are not usually individual reflections (see Section 4.5). To extend the rays: 1. Select the IRIS plot in SketchUp IRIS User Manual | Import and Export 44 2. Click on the “Extend IRIS Plot” button 3. Extension lines are now added to the IRIS plot 4. This looks a bit ridiculous, so it is a wise idea to view one or two time intervals at a time. For example, here is the same plot above, but only the first two intervals showing (0 to 20 ms) 8.4.5 Remove Extension Lines To remove the extension lines, select the extended IRIS plot and click the “Remove Extension Lines” button in the toolbar: IRIS User Manual | Import and Export 45 8.4.6 Delete IRIS Plot from Model 1. Select the IRIS plot and push delete on the keyboard (or go to the “Edit” menu and select “Delete”) 2. This does not remove the layers, but the layers are now empty. To clean up empty layers, select the arrow in the Layers window and click “Purge” IRIS User Manual | Import and Export 46 9.0 CONDUCT A MONO MEASUREMENT For your convenience, you may also use IRIS software to conduct single channel measurements. The strict hardware requirements of 3-D measurements do not apply here – you can use any microphone and any audio interface (as long as it has ASIO drivers). It is highly recommended you read the “Conduct a 3-D Measurement” section first, this saves repeating a number of sections which are applicable to mono measurements too. 1. Create or open an IRIS project 2. Configure Audio Settings a. Click AUDIO SETTINGS button in the toolbar b. Set the RECEIVER TYPE to “Mono” c. Select your audio device and configure the necessary channels d. Optional: Define a strength calibration document if you are interested in measuring sound strength and you had previously calibrated this set of hardware. 3. Configure STIMULUS SETTINGS 4. Add a measurement to the project 5. Open the RECORD window from the toolbar 6. Test the output level using the TEST TONE feature (only necessary the first time) 7. Click RECORD to conduct the measurement The IRIS plot view is disabled for mono measurements in an IRIS project. Only the PARAMETERS display is available. IRIS User Manual | Conduct a Mono Measurement 47 10.0 TROUBLESHOOTING MOTU 4pre is not responding This may have the following symptoms: IRIS does not recognise the MOTU 4pre even though it is connected in and powered on There is an error message or unusual behaviour when you attempt to record a measurement The 4pre does not respond to changes in the CueMix FX software, for example, you enable +48 on a channel but the corresponding LED indicator on the front panel doesn’t light up. To resolve: Almost all 4pre issues are resolved by restarting your PC and the 4pre. To power off the 4pre hold down the power button until the device turns off. There are known issues when a 4pre is connected to USB 3.0 on a PC running Windows 7. Try the following: - Connect the 4pre to a USB 2.0 port if available - Update the USB 3.0 chipset driver for Windows 7 - Upgrade to Windows 8 which has native USB 3.0 support. The sweep signal glitches during a recording It’s very easy to detect when a sine wave signal is interrupted. If this happens, try the following: Ensure “Samples Per Buffer” is set to the maximum value in the MOTU Audio Console program (refer back to MOTU 4pre driver installation in this manual). Disconnect any unnecessary USB devices Disable network adapters Restart your PC Noise or buzz in the microphone signals You should listen to the microphone signals with headphones before recording any measurements. If there is a serious noise or buzz issue: Ensure that all aspects of the measurement system are connected to the same AC power outlet (including the source and measurement controller). This should reduce the chance of buzzing due to ground loops. Check all cables are properly inserted. Try a different AC power outlet. In some rare circumstances, audio induction loop systems for hearing aids are known to cause interference. Disable the loop system if possible. IRIS User Manual | Troubleshooting 48