1
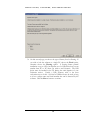
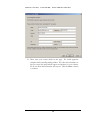
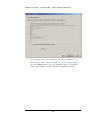
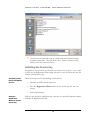
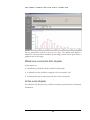
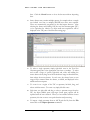
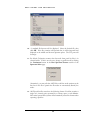
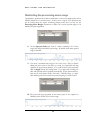
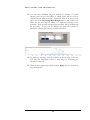
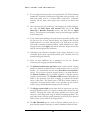
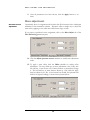
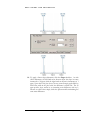
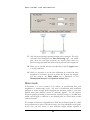
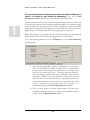
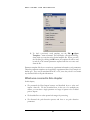
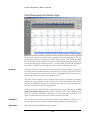
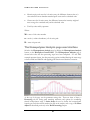
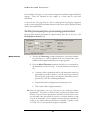
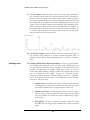
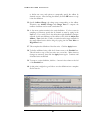
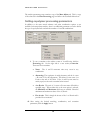
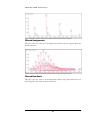
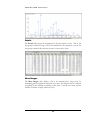
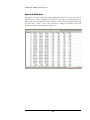
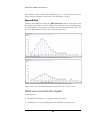
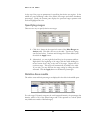
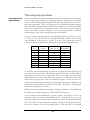
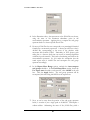
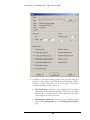
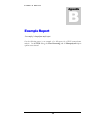
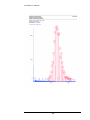
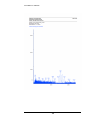
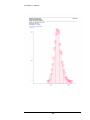
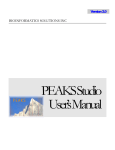
R E L A T I V E
A R E A
At the top of the page are parameters for specifying the relative area regions. In the
middle is a pane containing a table of the relative area ranges and relative abundance
percentages. Finally, the bottom pane displays the processed target spectrum with
each area highlighted in color.
Specifying ranges
There are two ways to specify relative area ranges.
1. Click the + button in the upper left corner of the Mass Ranges to
Analyze table. This adds a new row to the table. Type the m/z range
start and end values. Continue until all ranges have been defined, and
then click the Apply button.
2. Alternatively, you may right-click and drag in the spectrum window.
Right-click at the beginning of the range, and then while holding the
mouse button down, drag to the end of the range. Repeat this for
each new range. The ranges will automatically be added to the table.
If you wish, you may fine-tune the range setting by editing the table
afterward. Click the Apply button to calculate the percentages.
Relative Area results
The relative areas and their percentages are displayed in the table in the middle pane.
For each range, Polymerix computes the total integrated intensity, the percentage that
intensity reflects of all of the defined ranges and of the spectrum as a whole (which
may include area outside of defined ranges).
89