1
Atherosclerosis
Risk
in
Communities
Manual
Study
Protocol
15
Echocardiography
Visit
Version
August,
3
oi.0
1994
For Copies,
Please
Contact
ARIC Coordinating
Center
Department
of Biostatistics
(CSCC)
-University
of North Carolina
CB# 8030, Suite 203, NationsBank
Plaza
137 E. Franklin
Street
Chapel
Hill, NC 27514
FOREWORD
This manual,
entitled
EchocardioaraDhv
is one of a series of
protocols
and manuals
of operation
for the Atherosclerosis
Risk
in Communities
(ARIC)
Study.
The complexity
of the ARIC Study
requires
that a sizeable
number
of procedures
be described,
thus
this rather
extensive
list of materials
has been organized
into
the set of manuals
listed
below.
Manual
1 provides
the
background,
organization,
and general
objectives
of the ARIC
Study.
Manuals
2 and 3 describe
the operation
of the Cohort
and
Surveillance
Components
of the study.
Detailed
Manuals
of
Operation
for specific
procedures,
including
those of reading
centers
and central
laboratories,
make up Manuals
4 through
ii
and 13 through
15. Manual
12 on Quality
Assurance
contains
a
general
description
of the study’s
approach
to quality
assurance
as well as the details
for quality
control
for the different
study procedures.
ARIC
Study
Protocols
and
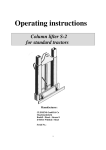
MANUAL
Manuals
of Operation
TITLE
1
General
Description
and
2
Cohort
Component
3
Cohort
and
4
Pulmonary
5
Electrocardiography
6
Ultrasound
Assessment
a. Ultrasound
Scanning
Procedures
b. Ultrasound
B-mode
Image
Reading
c. Distensibility
Scanning
Protocol
d. Distensibility
Reading
Protocol
Function
Collection
Lipid
and
Hemostasis
Management
Procedures
Community
Blood
Study
Surveillance
Assessment
and
Lipoprotein
- (Retired)
Protocol
- (Retired)
- (Retired)
Processing
Determinations
Determinations
i0
Clinical
Chemistry
ii
Sitting
Blood
12
Quality
Assurance
13
Magnetic
Resonance
Imaging
a. Magnetic
Resonance
Imaging
b. Magnetic
Resonance
Imaging
14
Retinal
15
Echocardiography
Determinations
- (Retired)
Pressure
Photography
and
Quality
Control
Protocol
Reading
Protocol
i
TABLE
INTRODUCTION
AND
MANUAL
15
OF CONTENTS
GENERAL
OBJECTIVES
...............
2.
RATIONALE
............................
3.
SPECIFIC
4.
ECHOCARDIOGRAPHY
EQUIPMENT
AND GENERAL OPERATING
FEATURES
....
4.1
Echocardiography
instrumentation
- General
........
4.2
Echocardiography
instrumentation
- Transducers
......
4.3
Echocardiography
instrumentation
- Digital image storage .
4.4
Workstation Instrumentation
- Analysis at the reading
center
..........................
4.5 Reading
Center
Database
for analysis
results
.......
OBJECTIVES
PAGE 1
PAGE 2
PAGE 3
.......................
PAGE
PAGE
PAGE
PAGE
4
5
5
5
PAGE 6
PAGE 7
TECHNICIAN
TRAINING,
CERTIFICATION,
QUALITY
MONITORING
.....
PAGE 8
5.1
Technician
training
....................
PAGE 8
5.2
Technician
Certification
.................
PAGE 8
5.2
Monitoring
........................
PAGE 9
5.3
Recertification
.....................
PAGE i0
5.4
Quality
assessment
...................
PAGE 11
5.4.1 GENERAL
5.4.2 Essential features
5.4.3 Technician
Quality Assessment Procedures
5.4.3.1 Assessment of Intra- and Inter-technician
Variability during the Pilot Phase.
5.4.3.2 Assessment of Intra- and Inter-reader
Variability During the Pilot Phase.
5.4.3.3 Assessment
of Intra-technician
Variability
during the Examination Period
5.5
Overview
of data
handling
................
PAGE 13
5.6
Monitoring
technician
performance
............
PAGE 14
THE
6.1
6.2
6.3
6.4
6.5
ECHOCARDIOGRAPHIC
EXAMINATION
...............
Presets
on the
instruments
...............
6.1.1 ECHO MACHINE’S APPLICATION
PRESETS
6.1.2 DIGITAL STORAGE SYSTEM PROTOCOLS
Equipment
preparation
prior
to each study
........
6.2.1 ECHO MACHINE PREPARATION
6.2.2 DIGITAL STORAGE SYSTEM PREPARATION
Participant
Preparation
.................
Imaging
Views
and Information
Sought
..........
6.4.1 Parasternal
Views
6.4.1.1
Parasternal Long Axis View
6.4.1.2
Right ventricular inflow view
6.4.1.3
Parasternal Short Axis View
6.4.2 Apical Views
6.4.2.1 Apical 4 chamber view
6.4.2.2 Apical 2 chamber and long axis views
6.4.3 Supplementary
views
Completing
the
study
..................
6.5.1 Completing
data storage
6.5.2 Completing the participant
encounter
TRANSMITTAL
ARIC
PROTOCOL
OF
DATA
TO
THE
15. Echocardiography
READING
- Version
CENTER
1.0.
...........
VISIT
3. 07/94
PAGE 14
PAGE 15
PAGE 16
PAGE 17
PAGE 17
PAGE 21
PAGE 22
PAGE
The
i.
Atherosclerosis
Risk In Communities
Echooardiography
Operations
Manual
INTRODUCTION
AND
GENERAL
ARIC participants
comprising
will have an echocardiographic
of the study.
1
Study
OBJECTIVES
the Jackson,
examination
Mississippi,
cohort
as a part of Visit
3
As its general
objectives,
the echocardiography
study will
(1) characterize
a variety
of cardiac
structural
and functional
parameters
in a large population-based
sample of black men and
women,
ages 51 to 70, and (2) examine
these data for
relationships
with conventional
risk factors
for cardiovascular
disease,
prevalent
cardiovascular
disease,
and cardiovascular
disease
incidence,
adding to similar
information
collected
in
other important
population-based
studies.
The echocardiography
protocol
will incorporate
currently
accepted
standard
echocardiographic
techniques
to enhance
comparison
with
preceding
and future
studies.
Structural
parameters
to be
studied
include
left ventricular
(LV) wall and chambers
dimensions,
and LV mass (calculated
from dimensions).
Cardiac
functional
data will be derived
from measurements
of systolic
performance
such as fractional
shortening,
regional
wall motion,
and wall stress,
and from Doppler
data describing
left
ventricular
diastolic
filling.
Responsibility
for various
procedural
aspects
of the ARIC Echo
Study will be shared
with the ARIC Coordinating
Center.
The
Jackson
center will be responsible
for technician
and reader
training,
for exam performance,
interpretation,
and data entry,
and for internal
quality
control
functions.
The Coordinating
Center
will be responsible
for developing
and maintaining
the
official
analysis
file and for official
analyses
of the data, and
will provide
support
for publications,
including
primary
responsibility
for statistical
analyses.
Some data analysis
may
be done locally
at the Jackson
center as well, and its
investigators
will have primary
responsibility
for scientific
publications.
The echocardiographic
examination
will be conducted
in the ARIC
Clinic
facilities
in Jackson.
Two staff nurses
will be training
to perform
the echo studies.
The clinical
echo lab in the
University
Hospital,
located
about 1 block from the ARIC Clinic,
may be used to facilitate
a high volume of studies
in the early
months
of the study,
and will be available
as backup
in the event
of equipment
failure
or ARIC staff absences.
The Hospital’s
lab,
staffed
by two experienced
technicians,
and the ARIC lab have
identical
echo equipment.
The "reading
center"
will also be
located
in the University
Hospital’s
Heart Station
at the offices
ARIC PROTOCOL 15. Echocardiography
- Version 1.0. VISIT 3. 07/94
PAGE
2
of Drs. Skelton
and Waterer
who will be analyzing
all the echo
studies.
Facilities
for data entry,
backup,
and archival
will
also be located
at the reading
center,
and will be managed
by Dr.
Skelton.
2.
RATIONALE
LV hypertrophy
detected
by electrocardiography
is associated
with
1,
a 2
significant
risk of cardiovascular
morbidity
and mortality.
More recently,
echocardiography
has provided
a more sensitive
tool for determination
of LV hypertrophy.
In addition,
the
3,4,~,6
method is quantitative,
reproducible,
and noninvasive.
Echocardiographically
measured
LV hypertrophy
improves
the
prediction
of cardiovascular
disease
compared
with the prediction
using only blood pressure
and ECG-LVH
criteria
in a
representative
population
of black men and women aged 51-70.
Reference
values
for LV mass and criteria
for LV hypertrophy
were
established
in the large study population
of the Framingham
Heart
Study. 7 To date, there are no outcome-guided
criteria
for
defining
the presence
of LV hypertrophy.
Echocardiography
provides
an objective
means of prospectively
studying
the
relationship
between
LV mass and cardiovascular
events.
The pathophysiology
of LV hypertrophy
in a population
may be
rather
diverse.
The impact of age~ obesity 9, I0,
alcohol
intake
body size, physical
activity,
and blood pressure 11 on LV mass
have been examined.
A small proportion
of LV hypertrophy
is
associated
with valvular
heart disease,
but most is not, and the
overall
prevalence
of hypertrophy
based on Fram~ngham
criteria
in
their population
was about 15-20%. 12 Dannenberg
suggested
that
the increase
in LV mass associated
with aging was prominently
related
to extracardiac
factors
(such as obesity
and
hypertension)
that accompany
advancing
age and "not by virtue of
an intrinsic
myocardial
aging process".
Importantly,
several
reports
have documented
an increased
risk of
cardiovascular
events
and mortality
in subjects
with LV
hypertrophy
and some show the risk to be independent
of the other
known risk factors
for coronary
heart disease.
For the black population,
there are insufficient
data on the
distribution
of LV mass and its association
with cardiovascular
risk.
As the genetic
influence
of race is seen on some aspects
of
essential
hypertension,
so might the risk associated
with LV
hypertrophy
in blacks vary from that of a general
or
predominantly
white population.
Also, the impact
of other
factors
such as age, obesity,
and alcohol
intake
has not been
studied
in blacks.
ARIC PROTOCOL 15. Echocardiography
- Version 1.0. VISIT 3. 07/94
PAGE
3
In essential
hypertension,
LV hypertrophy
may be thought
of as
one type of end-organ
damage
often leading
to two predominant
sequelae,
congestive
heart failure
and arrhythmias ~ including
sudden death.
Georgiou
and Brundage 19 published
a cogent review
of the significance
and pathophysiology
of hypertensive
LV
hypertrophy
and of factors
influencing
its regression.
Several
animal and human studies
point to the multiple
hemodynamic,
humoral,
and structural
factors
that influence
hypertension
and
the development
of LV hypertrophy
and of its sequelae.
Perhaps
as a result,
antihypertensive
therapy
appears
to have diverse
effects
on the regression
of LV mass. Data are not yet available
from current
long-term
clinical
studies
designed
to assess the
change in cardiovascular
risk associated
with regression
of
hypertensive
LV hypertrophy.
Despite
complex
interactions
among the factors
that influence
it,
the presence
of LV hypertrophy
may be a clinically
useful
summary
of the integrated
adverse
effects
of hemodynamic
loads and
2°
vascular
disease on the heart.
Recent years have seen a surge of interest
in the diastolic
function,
and dysfunction,
of the left ventricle
and in the
hemodynamic
characterization
of this "diastolic
dysfunction"
from
both invasive
and noninvasive
techniques.
Hypertensive
left
ventricular
hypertrophy,
now well defined
as a risk factor for
cardiovascular
morbidity
and mortality
is an important
cause of
diastolic
dysfunction,
but some other prevalent
disorders
such as
ischemic
heart disease
are causes
as well. There is an important
need for population
data which may improve
our understanding
of
the relationship
between
cardiovascular
events
and diastolic
dysfunction
in general.
Data from the Framingham
study suggest
that there is a
significant
learning
curve in the acquisition
of technically
adequate
echocardiographic
studies.
In that study,
for
participants
over 60 years old, the percentage
of acceptable
Mmode echocardiograms
rose from a minimum
of 28% during
the first
5 months
to a maximum
of 74-81%
two years later.
The percentage
of acceptable
echocardiograms
declined
with age and was slightly
lower in men than in women.
Thus, the development
of procedures
for technician
training
and utilization,
image data management,
and quality
monitoring
are essential
for providing
data of
excellent
quality.
A major goal of the ARIC echo study is to
insure
the acquisition
of echocardiograms
of sufficient
quality
and reproducibility
to produce
unbiased
estimates
of structural
and functional
variables.
SPECIFIC
OBJECTIVES
Define the population
distribution
of various
echocardiographic
measurements
of left ventricular
ARIC PROTOCOL 15. Echocardiography
- Version 1.0. VISIT 3. 07/94
size,
PAGE
4
mass, and function
(both systolic
and diastolic)
using
techniques
which will allow, to the extent possible,
comparisons
between
these data and those of population-based
studies
such as Framingham
and others.
3.2
Examine
the association
of LV hypertrophy
with clinical
outcomes
including
myocardial
infarction,
congestive
heart
failure,
stroke,
and sudden
death.
The latter
is of special
interest
both because
of the suspected
contribution
of LV
hypertrophy
to arrhythmias
and because
of the high
proportion
of out-of-hospital
deaths seen in ARIC blacks.
3.3
Describe
the association
of LV hypertrophy
with current
and
previous
sitting,
standing,
and supine blood pressure;
and
the temporal
relationship
between
the development
of
hypertension
and LV hypertrophy
(or of other structural
and
functional
parameters
such as diastolic
filling
properties).
3.4
Evaluate
the association
antihypertensive
therapy.
3.5
Examine
the association
between
LV hypertrophy
and other
target
organ manifestations
of hypertension
such as retinal
artery changes,
or of atherosclerosis
measured
as the
presence
and progression
of carotid
atherosclerosis.
3.6
Describe
the relationship
with factors
such as age,
alcohol intake.
3.7
Examine
whether
functional
parameters
(e.g., left
ventricular
diastolic
filling)
may have a stronger
relationship
than LV mass to target
organ manifestations
prevalent
cardiovascular
disease.
of
LV hypertrophy
of LV hypertrophy
physical
activity,
and
or dysfunction
obesity,
and
or
3.8
Describe
any measurable
difference
between
a technique
direct
digital
image storage
and computer
analysis
and
of digitization
of videotaped
images or of analog
measurement
from hardcopy
data.
3.9
Collect
and archive
both procedural
and echocardiographic
data in a manner which will allow for comparison
with
follow-up
echocardiograms
on these study participants
should
the opportunity
arise in future years.
4.
ECHOCARDIOGRAPHY
EQUIPMENT
AND
GENERAL
OPERATING
of
that
FEATD~RES
The Acuson
128XP/10c
machine
is a cardiac
ultrasound
system
incorporating
current
generation
technology
for image
optimization
and quantification.
A digital
imaging
system
by
Freeland
Systems
has been added to allow recording,
transport,
ARIC PROTOCOL 15. Echocardiography
- Version 1.0. VISIT 3. 07/94
PAGE
analysis,
and storage
of selected
introducing
the image degradation
device such as videotape.
4.1
Echocardioqraphy
5
images
to be analyzed
without
that accompanies
an analog
instrumentation
- General
In general
terms, the Acuson
128XP/10c
system is comprised
of a video monitor
for viewing
the ultrasound
data; a
keyboard
for entry of study identification
and for selection
of system
options;
a panel containing
image,
Doppler,
and
recording
device
controls;
ports for connection
of the
ultrasound
transducers;
ECG display
controls;
and two
recording
devices,
a B/W video page printer
and a Super VHS
videotape
recorder.
Details
of the operation
of the system
are found in the Acuson User Manual
for Cardiovascular
Applications.
The Framingham
study has successfully
used an offline
analysis
system to perform
the quantitative
measurements
from the echo data, freeing
the technician
from the need to
spend valuable
examination
time performing
measurements.
The Freeland
CineView
system is comprised
of a computer,
a
function-key
"keyboard",
and a footpedal
for activation
of
its functions.
The Acuson
video display
unit is shared
with
the Freeland
computer
for its own display
needs by a video
multiplexer
board jointly
designed
by Acuson and Freeland
specifically
for this application
and installed
by Acuson
engineers.
Details
of the operation
of the system
are found
in the Freeland
Systems
Operations
Manual.
4.2
Echocardioqraphy
instrumentation
- Transducers
The echo machine
is equipped
with three 128 element,
dual
frequency,
phased
array
transducers.
In general,
the
studies
will be performed
with the primary
operating
frequencies
of the V219 transducer
(imaging
at 2.5 MHz,
Doppler
at 2.0 MHz) or the V319 transducer
(imaging
at 3.5
MHz, Doppler
at 2.5 MHz). In unusual
circumstances,
the
V714C transducer
may be used (imaging
at 5.0 MHz).
Steerable
2-D directed
M-mode
is performed
at the same
imaging
frequency.
The transducers
also are capable
of
steerable
continuous
wave (CW) and pulsed
Doppler
(including
color flow mapping).
Two probes
(typically
the V219 and
V319) are connected
to the machine
with the V219 on the
right port. Selection
between
the two is by way of a front
panel button.
The right port is the default
transducer
at
power-up.
4.3
Echocardioqraphy
The Freeland
80486-33
MHz
instrumentation
- Diqital
Systems
CineView
for Acuson
based computer
system
which
ARIC PROTOCOL 15. Echocardiography
imaqe
storaqe
is an Intel
receives
video
- Version 1.0. VISIT 3. 07/94
PAGE
6
input from the Acuson echo system and which digitizes
images
for display,
analysis,
and storage
onto optical
disk media.
The Freeland
computer
uses (shares)
the Acuson display
screen
as its display
monitor.
The technician
can choose
to
view either the Acuson
or the Freeland
display
on the single
monitor
by a simple
keypress
on the Freeland
keypad.
The
Freeland
software
is customized
to provide
efficient
protocols
for capturing
images.
The Acuson image screen
is a digital
image in a 512 by 512
pixel matrix.
This matrix
size defines
the limits
of
resolution
in the ultrasound
image.
The digital
image is
converted
to a standard
525-iine
video signal which is made
available
to the Freeland
image capture
system.
The
Freeland
is capable
of digitizing
at a maximum
pixel density
of 512 (horizontal)
by 480 (vertical),
similar
to that
the original
Acuson
image.
Thus, in theory,
the image
captured
in the Freeland
system should
retain a high degree
of resolution
and faithfulness
to the original
image.
One
of the quality
assessment
issues
in this study will be to
measure
the resolution
characteristics
of the Acuson system,
and to define
any detectable
loss of resolution
attributable
to the digitization
process.
Once in digital
format,
the
image is not subject
to degradation
by repeated
viewing,
copying,
or deterioration
of media with the passage
of time.
The protocols
have been designed
to acquire
at axial
resolution
similar
to that of the data generated
by the
Acuson,
so that the digitization
process
results
in no
significant
loss of resolution
information.
In general,
the
images which will undergo
quantitative
analysis
will be
stored on the Freeland
CineView
system’s
128 MB optical
disks,
analyzed
on the Freeland
Prism 5000 workstation
at
the reading
center
(see below),
and copied
for permanent
digital
storage
on 650 MB optical
disks.
Because
of the
digital
format,
there is no loss of resolution
data
resulting
from the transfer.
The entire
study,
including
the data selected
for digital
storage,
will be recorded
on
Super VHS format
videotape
for permanent
storage.
In the
event some digital
data is lost, it can be reproduced
by
digitizing
from videotape
with some image degradation
which
should
be acceptably
small in most cases.
Similarly,
if
videotape
data is inadvertently
lost, the critical
images
are still available
from the digital
disks.
4.4
Workstation
Instrumentation
- Analysis
at the
readinq
center
The echo videotapes
and digital
disks will be delivered
regularly
to the physicians
at the reading
center
in the
University
Hospital’s
Heart Station
near the ARIC Clinic
building.
The videotape
will be reviewed
to provide
a basic
clinical
interpretation
of the study,
in particular
to look
ARIC PROTOCOL 15. Echocardiography
- Version 1.0. VISIT 3. 07/94
PAGE
7
for important
or unexpected
echocardiographic
findings
(for
example,
moderate
or severe
aortic stenosis
or
regurgitation)
which may impact
on the participant’s
health
care or which may affect the usefulness
of the data for the
purposes
of the ARIC echo study.
This videotape
will be
viewed on a Super VHS videotape
player
and monitor
similar
to that used to record
the study.
The 128 MB digital
optical
disk data will be loaded onto the Freeland
Prism
5000 workstation
for analysis.
Details
of the analysis
procedures
are found in the Reading
Protocols
Manual.
The
studies
and analysis
results
are copied
onto 650 MB optical
disks for permanent
archival.
The 128 MB disks
are erased
for reuse after confirming
that the data has been
successfully
stored
into the archival
media.
Details
of the
operation
of the Prism 5000 system are found in the Freeland
Systems
Operator’s
Manual,
with core information
reviewed
in
the ARIC Echocardiography
Reading
Center
Manual
4.5
Readinq
Center
Database
for
analysis
results
For the purpose
of efficient
data management
and
transmission
to the Coordinating
Center,
the data items and
pertinent
participant
information
will be entered
into a
database
on an 80486-based
computer
with appropriate
disk
storage
and backup.
Individual
data items are defined
in
the Reading
Center
Manual~
Study identification
and
tracking
data as well as qualitative
analysis
results
will
be entered
by keyboard
into the database
from the Technician
and Reader
Worksheets.
Errors
in manually
entered
data will
be avoided
by range checking
of numeric
data by the database
software
and by regular
comparison
of the database
information
with the Worksheets.
Data generated
by the
Freeland
workstation
is available
in that system in a DBase
III format.
The Reading Center Database,
developed
using
Microsoft
Access by Microsoft
Corporation,
will directly
import the Freeland
Systems
data files,
avoiding
keyboard
entry errors.
Additional
data fields
in the Reading
Center
Database
will accommodate
the manually
entered
items.
Participant
and study identification
data, critical
to
proper data tracking,
will be imported
from the technician’s
entries
into the Freeland
data files and will be cross
checked
from the Technician
Worksheet
for accuracy
during
the manual keyboard
entry of the additional
qualitative
study results.
This Reading
Center
Database
will provide
a
versatile
means of organizing
the data, analyzing
it for
quality
control,
and formatting
the data for transmission
to
the Coordinating.
Center.
Details
of the database
structure
and operations
are provided
in the reading
protocol
manual.
ARIC PROTOCOL 15. Echocardiography
- Version 1.0. VISIT 3. 07/94
PAGE
5.
5.1
8
TECHNICIAN
Technician
TRAINING,
CERTIFICATION,
QUALITY
MONITORING
training
Under direction
of the cardiologist
co-investigator,
two
Registered
Nurses
of the ARIC center
staff will undergo
training
to perform
echocardiography
examinations.
Training
will begin with basic didactic
and videotape
sessions
on
ultrasound
physics
and principles
of the ultrasound
examinations.
The Acuson
128XP operation
and control
settings
will be taught
during actual
examinations
by the
technicians-in-training
under cardiologist
supervision
on
ARIC volunteers.
The cardiologist
offers
guidance,
suggestions
for improvement,
and answers
questions
as they
arise.
Approximately
5 scans per weeks are performed
by
trainees
(initiated
in March, 1993) following
the ARIC
scanning
protocol.
In addition,
two more technicians
(clinical
sonographers
from the University
Hospital’s
laboratory
already
familiar
with the Acuson
128XP and
Freeland
systems)
will be trained
in the ARIC scanning
protocol.
Under the cardiologist
co-investigator’s
direction,
the clinical
technicians
will perform
10 scans at
the ARIC field center
during the 2 week period prior to the
pilot study.
In addition
to the on-site
training,
each technician
will
spend one week (40 hours)
in training
with technicians
and
investigators
at the Framingham
Heart Study echocardiography
laboratory.
Since the Framingham
study uses similar
scanning
procedures,
the training
session
will review
the
operation,
standard
control
settings,
and the important
aspects
of assuring
high quality
data in population
studies
(i.e., following
a standardized
protocol).
5.2
Technician
Certification
After the initial
training
(and in conjunction
with the
pilot testing
procedures),
each technician
will undergo
certification
by performing
i0 complete
echocardiogram
examinations
(performed
during
week 1 of the 2 week pilot
phase)..
The cardiologist
will perform
the examination
independently
as well to establish
the standard
by which the
technician’s
studies
will be graded,
referred
to below as
the "standard
exam".
The technician’s
examination
will be
scored
for each 2-dimensional
imaging
view, M-mode,
and
Doppler
examination.
For imaging
modes,
grading
will be
based on proper
spatial
orientation
and definition
of good
endocardial
and epicardial
boundaries.
For Doppler
modes,
grading
will emphasize
proper
orientation
of the
interrogating
beam and measurement
gate, and of the ability
to obtain clear Doppler
data demonstrating
smooth velocity
contours
with highest
velocity
for spectral
Doppler,
and
ARIC PROTOCOL 15. Echocardiography
- Version 1.0. VISIT 3. 07/94
PAGE
9
consistent
beat-to-beat
data for the Doppler
color flow
mode.
For each imaging
view, 2-D, M-mode,
and Doppler
exams,
a
quantitative
score of 3 is given for "excellent"
reproduction
of the cardiologist’s
study quality,
2 for
"good" (slightly
below the technical
quality
of the standard
exam),
1 for "fair" (usable
but significantly
below the
standard
exam),
and 0 for an exam component
which is not
usable for the study and is unacceptably
worse than the
quality
of the cardiologist’s
examination.
A simple
average
of at least 2.0 will be required
for the technician
to be
certified
as having
adequate
skills to perform
the study
protocol.
Any technician
failing
to meet certification
requirements
will undergo
additional
training
and re-testing
before
performing
independent
examinations
on study
participants.
While the technicians
will be expected
echocardiogram
study within 30 minutes,
will not be imposed
during certification
to complete
the
a strict
time limit
procedures.
In the event that a new technician
joins the study staff,
the same initial
training
and certification
procedures
will
be followed
as described
above.
In addition
to these certification
procedures,
technician
training
and refinement
of techniques
will be an ongoing
process,
facilitated
by the fact that the technician
trainer
is also the primary
study reader,
and there will be a close
working
relationship
with each of the technicians
involved
in this single-center
study.
5.2
Monitoring
Echocardiographer
performance
is monitored
throughout
the
ARIC study at the Jackson
field center.
The cardiology
coinvestigator
will randomly
review
one examination
per month
by each technician
to ensure data quality
and adherence
to
the scanning
protocol.
The appropriateness
of spatial
orientation,
the visualization
of the endocardial
and
epicardial
boundaries,
and the transducer
placement
will be
evaluated
and recorded
on the echocardiographer
evaluation
form. The forms are kept by the co-investigator
and sent to
the quality
control
investigator
monthly.
A series
of quality
control
procedures
are monitored
throughout
the study.
The quality
control
procedures
consist
of (a) comparing
the results
given by the same
sonographer
for repeat studies
performed
on randomly
selected
participants;
(b) monthly
reports
containing
statistics
of the frequency
of successful
examinations
ARIC PROTOCOL 15. Echocardiography
- Version 1.0. VISIT 3. 07/94
by
PAGE
i0
sonographer
sonographer
5.3
(grade 2 or 3 on reader
correlation
coefficients
evaluation)
and intraof all variables.
Recertification
Re-certification
will be performed
at 12 month intervals
for
the all technicians.
At the certification
anniversary,
five
randomly
selected
echocardiograph’s
scans performed
during
the prior month are reviewed
and evaluated
by the cardiology
co-investigator.
The results
of these evaluations,
in
combination
with the monthly
quality
control
reports,
are
considered
for re-certification.
A sonographer
must complete
a minimum
of 20 echocardiograms
each month to maintain
certification.
If less than 20 scans
are performed
for 2 consecutive
months (but not more than
months),
the technician
must undergo
recertification
as
follows:
A.
The cardiology
co-investigator
updates
the
technician
regarding
changes
in procedures;
B.
The technician
scans 20 participants
per month;
Routine
quality
control
checks continue;
C.
D.
The echocardiographer
remains
on the current
annual recertification
procedure.
If the echocardiographer
performs
no scans for more than two
months,
the recertification
process
is as follows:
A.
The cardiology
co-investigator
updates
the
technician
regarding
changes
in procedures;
B.
The technician
observes
a minimum
of four scans;
C.
The first four scans performed
by the technician
are performed
under supervision
by the cardiology
co-investigator;
D.
When four consecutive
scans are considered
acceptable
by the reader (cardiology
coinvestigator),
the technician
is recertified.
If a major change in the echocardiography
protocol
occurs,
echocardiographers
will undergo
recertification
as follows:
A.
The cardiology
co-investigator
will update
echocardiographer
on the new protocol;
B.
The technicians
will observe
four scans performed
by the cardiology
co-investigator;
The technicians
perform
four scans on non-ARIC
C.
participants
under the supervision
of the
cardiologist;
D.
When four consecutive
scans are considered
acceptable
by the reader
(co-investigator),
the
echocardiographer
is recertified.
If quality
assessment
at the reading
significant
reduction
in a technician’s
ARIC PROTOCOL 15. Echocardiography
center
study
indicates
quality,
- Version 1.0. VISIT 3. 07/94
PAGE
individualized
be required.
5.4
Oualit¥
training
and/or
recertification
examinations
Ii
may
assessment
5.4.1
GENERAL:
The utility
of echocardiographic
measures
of cardiac
anatomy
and function
has been demonstrated
in
clinical
and population
studies.
Cardiac
abnormalities
assessed
by this techniques
(e.g., left ventricular
hypertrophy)
have been associated
with an increased
incidence
of cardiovascular
morbidity
and mortality.
Given
the greater
sensitivity
and specificity
of echocardiographic
measure
in comparison
to other indirect
measures
of cardiac
abnormalities,
the echocardiogram
may serve as a surrogate
measure
of preclinical
manifestations
of cardiovascular
disease
and as a prognostic
indicator
for future clinical
events (i.e.,
hypertension,
myocardial
infarction,
and/or
stroke).
Since this is the first large scale population
study of
middle-age
African-Americans,
quality
control
is of
particular
importance.
Previous
population
studies
(Framingham
Heart Study,
CARDIA,
and CHS) have indicated
that considerable
training
and experience
are required
to
assure optimal
echocardiographic
data acquisition
of
sufficient
quality.
The goals of this strict
echocardiography
quality
control
program
are to (i) provide
quantitative
documentation
of the reproducibility
of the
scanning
and reading
procedures,
and (2) assess
the
comparability
of the ARIC scanning
and reading
estimates
of
variability
with other population
studies
of
echocardiography.
ARIC PROTOCOL 15. Echocardiography
- version 1.0. VISIT 3. 07/94
PAGE
12
5.4.2
Essential
include:
features
of
the
quality
control
program
To assure
adherence
to study protocol,
supervision
of
the performance
of echocardiographic
procedures
utilized
by technicians
will be done by Dr. Skelton.
(2)
Regular
(weekly)
meetings
among technicians
and reading
center
physicians
will be conducted.
At these
meetings,
the staff will critically
review
studies
to
identify
opportunities
for improvement
in data quality
and security,
and in efficiency
and details
of
protocol.
The technicians
will better
recognize
the
image quality
and techniques
necessary
to allow the
study readers
to obtain accurate,
reproducible
quantitative
information.
At the same time, the study
cardiologists
can provide
ongoing
feedback
to improve
the technicians"
skills,
their understanding
of
ultrasound
principles,
and their recognition
of
echocardiographic
abnormalities.
(3)
To identify
potential
protocol
deviations,
difficulties,
or inefficiencies,
Drs. Arnett,
Liebson,
and Benjamin
may periodically
visit the Jackson
center
to assess scanning
and reading
procedures.
(4)
Assessment
of
variability.
5.4.3
Technician
inter-
and
intra-technician/reader
OualityAssessment
Procedures:
5.4.3.1
Assessment
of Intraand Inter-technician
Variability
during
the Pilot Phase.
Measurement
variability
between
studies
on the same participant
performed
by different
(inter-)
field center
technicians
(i field center
technician
and 2 clinical
technicians)
and within
the same technician
(intra-)
will be assessed
in the pilot phase study.
To enhance
time efficiency,
the pilot phase assessment
of
measurement
variability
will overlap
with the
technician
certification
procedures.
After completion
of training,
each technician
will perform
echocardiograms
on i0 volunteer
participants.
The
volunteers
will return
the following
week for
rescanning
by each sonographer
(a total of 20 scans per
sonographer).
Volunteers
will be assigned
a phantom
ARIC ID (obtained
from the Coordinating
Center).
VHS
videotapes
and optical
disks will be transported
to the
reading
center
at the end of each week. Readings
will
be performed
for initial
and repeated
studies,
with the
combined
data used to assess
inter- and intratechnician
variability.
Additional
repeat
quality
ARIC PROTOCOL 15. Echocardiography
- Version 1.0. VISIT 3. 07/94
PAGE
13
control
echocardiograms
will be scheduled
during
the
study to monitor
intra-technician
variability
(as
specified
in further
detail in the following
section).
5.4.3.2
Assessment
of Intraand Inter-reader
Variability
Durinq
the Pilot Phase.
To provide
estimates
of intra-reader
repeatability,
after initial
reading
of the pilot phase testing/certification,
50%
of the scans will be reread
by the same reader.
The
remaining
50% will be read by a second
certified
reader.
Additional
repeat
readings
will be performed
throughout
the study.
In addition
to the above quality
control
procedures
a
random sample
of 20 echocardiograms
performed
during
the first three months
of the study will be sent to
consultants
(Liebson
and Benjamin)
for reading.
5.4.3.3
Assessment
of Intra-technician
Variability
during
the Examination
Period.
Intra-technician
variability
will be assessed
throughout
the examination
period by the performance
of quality
control
repeat
echocardiograms
in a 10% random sample of participants.
The Coordinating
Center will generate
a list of
randomly
selected
ARIC IDs for Jackson
for the purpose
of QC repeat
examinations.
After the initial
scan on
each participant
is complete,
the technicians
will
check the QC master
list to determine
eligibility
of
the participant
for repeat
measurements.
If the
participant’s
ID matches
the QC list, he/she will be
asked to volunteer
for a repeat echocardi~gram.
5.5
Overview
of
data
handlinq
The study procedures
have been designed
with consideration
for optimizing
completeness,
integrity,
and safety
of the
data collected.
There is redundancy
in data collection
and
storage,
automation
and/or range-checking
during data entry,
use of analog
and digital
media in industry-standard
formats,
and appropriate
quality
monitoring
activity.
Technicians
record image and Doppler
data onto standard
Super-VHS
videotape
with plans to permanently
save these
tapes for potential
future
analysis.
A subset
of the study
(data to be used for qualitative
analysis)
are also captured
as digital
images which are stored
(temporarily)
onto 128
megabyte
rewritable
optical
disks.
Both media
(videotape
and optical
disks)
are transported
to the reading
center on
a daily basis
for analysis.
Written
logs will track the
delivery
and location
of the media, and will provide
a
backup method
of locating
a specific
participant’s
studies
on videotape
or disk.
ARIC PROTOCOL 15. Echocardiography
- Version 1.0. VISIT 3. 07/94
PAGE
14
On the reading
center’s
workstation,
the images
read from
the 128 MB optical
disks are copied along with the
quantitative
data generated
by the analysis
protocol
onto
650 MB optical
disks which are kept as permanent
archives.
The 128 MB optical
disk is erased (and recycled
to store
new series of studies)
only after confirmation
of the
successful
archival
of its data.
The reading
center
will maintain
a computer
database
for
storage
of all the data relevant
to the echo studies.
Participant
identification
and qualitative
observations
made
at the examination
will be input from written
data on the
technician
worksheets.
Qualitative
data generated
by the
reading
center’s
review of the study will also be entered
from written
worksheets.
Quantitative
results
of
measurements
on the analysis
workstation
will be directly
imported
into the database
without
keyboard
data entry.
This process
will not only duplicate
other written
and
electronic
records
of this information
but also consolidate
data for local analysis
and for ease of archiving
the study
results
onto digital
tape, a routine
part of daily backup
on
the Heart Station’s
computer
network.
All data required
for analysis
will be transmitted
to
Coordinating
Center where the official
analysis
files
be maintained.
5.6
Monitorinq
technician
the
will
performance
Regular
assessment
of each technician’s
performance
will be
conducted
throughout
the study.
The use of a single
imaging
lab and its close relationship
with the study cardiologist
who is responsible
for technician
training
and for
interpretation
and analysis
of the studies
will facilitate
critical
feedback
to the technicians
and efficient
recognition
of technical
problems
or areas for potential
improvement.
The local database
will generate
monthly
reports
of study quality
and useability
scores recorded
for
each technician.
Study readers
will look for completeness
of the data, adherence
to protocol,
and ability
to
consistently
maintain
a high level of image and data
quality.
6.
THE
ECHOCARDIOGRAPHIC
EXAMINATION
This section
will detail
the instrument
preparation,
patient
preparation,
and performance
standards
for the echo examination.
A flow sheet summary
of the procedure
found in Appendix
A is used
by the technicians.
The Technician
Worksheet
is enclosed
as
Appendix
B.
ARIC PROTOCOL 15. Echocardiography
- Version 1.0. VISIT 3. 07/94
PAGE
6.1
Presets
on the
15
instruments
6.1.1 ECHO MACHINE’S
APPLICATION
PRESETS:
The Acuson
XPI28/10c
echo machine
features
programmable
"application"
presets
to allow customization
of preferred
image and
Doppler
settings,
and to allow efficient
selection
of
alternate
settings
if needed,
for example,
in the case of
technically
difficult
imaging
studies.
The definable
parameters
are listed
in the Acuson
User Manual for
Cardiovascular
Applications.
A preset
has been defined
for
the ARIC echo study based on typical
imaging
and Doppler
parameters
for cardiac
ultrasound
and on the crucial
need
for high quality
M-mode
and 2-D data. This preset
is active
automatically
when the machine
is powered
up, and it can be
re-selected
from the keyboard
prior to each study.
The
technician
may modify some parameters
during the course of a
study to optimize
data quality
but these changes
are
returned
to nominal
settings
when the ARIC "application
preset"
is selected.
6.1.2
DIGITAL
STORAGE
SYSTEM
PROTOCOLS:
The Freeland
Systems
CineView
digital
imaging
computer
also has definable
application
"protocols"
which control
the resolution
and
timing
of image acquisition
and storage.
There are two
basic requirements
for the purposes
of this study: (i) fullscreen acquisition
of M-mode
and spectral
Doppler
data in
highest
resolution
(512 x 480) for the purpose
quantitative
measurements,
and (2) acquisition
of serial
frames showing
cardiac
motion
throughout
an entire cardiac
cycle ("R-to-R
acquisition").
Two "protocols"
have been
defined
to accomplish
each of these tasks.
The first protocol,
"ARIC Echo", defines
the
acquisition
of 12 images spaced
at even intervals
from
one R wave on the EKG to the next. When the technician
presses
and releases
the "STORE"
footpedal,
the
computer
measures
the R-to-R interval
for the first
beat and captures
12 evenly-spaced
images (an "image
loop")
from the next beat. Multiple
"loops"
may be
captured
for a given view; the technician
selects
(or
"locks")
the single
loop which is considered
technically
best. For economy
of storage,
only the
portion
of the screen
with the 2-dimensional
image data
is captured
(amounting
to half the full screen width).
The images are stored
in highest
axial resolution
of
480 pixels (to accurately
preserve
dimensional
data)
and horizontal
resolution
of 256 pixels
(adequate
to
match lateral
resolution
needs of the 2-D image and to
allow endocardial
boundary
definition).
The second
protocol,
single
frame storage
ARIC PROTOCOL 15. Echocardiography
"ARIC M-Mode/Doppler",
allows
of the full screen containing
- Version 1.0. VISIT 3. 07/94
PAGE
16
either
M-mode
or spectral
Doppler
data. If the
technician
obtains
better
quality
data after the first
screen
is already
stored,
additional
screens
can be
saved as desired
to provide
the reader
with options
for
selecting
the best data for quantitative
measurements.
The acquisition
is triggered
by a press and release
of
the "STORE" footpedal.
6.2
Equipment
preparation
prior
to
each
study
6.2.1
ECHO MACHINE
PREPARATION.
The Acuson
physically
clean and sanitary
at all times.
instructions
are found in the documentation
the machine.
should
be
General
care
supplied
with
Prior to each study the transducer
heads should be
wiped clean in accordance
with the manufacturer’s
instructions.
Disposable
EKG electrodes
are snapped
onto the three
leads of the EKG cable prior to attaching
to the
participant.
If any machine
parameters
previous
study,
reactivate
preset"
(press CODE+RECALL
have been altered
by the
the ARIC "application
APPLIC and select "ARIC").
Insert a numbered
videotape
into the Sony tape
recorder.
(The tape number will be recorded
on the
Technician
Worksheet).
The technician
should
be
confident
that the tape is positioned
on the blank
portion
immediately
after the preceding
study to assure
that data is not overwritten.
(Pressing
the "BLANK"
search
button on the Sony recorder
will cause the tape
to scan forward
to the first unrecorded
portion
of the
tape).
Press BEGIN on the Acuson
keyboard,
and fill in the
study
identification
information
on the screen.
Record
this ID screen onto videotape
for about 5 seconds.
During the recording,
press MARK on the Sony videotape
remote
control.
This will allow more efficient
location
of studies
on tape during the review process.
Finally,
press BEGIN again to return to the image
screen.
6.2.2
DIGITAL
STORAGE
SYSTEM
PREPARATION.
The Acuson
echo
machine’s
video monitor
also serves
as the Freeland
computer’s
monitor.
By default,
at powerup
the display
is
the Acuson
image screen.
To switch
at any time between
the
Acuson
and Freeland
computer
displays,
press the "bypass"
function
key (FI0) on the Freeland
keypad.
ARIC PROTOCOL 15. Echocardiography
- Version 1.0. VISIT 3. 07/94
PAGE
Make sure a labelled
the disk drive
Show the Freeland
the keypad
128MB
display
optical
disk
by pressing
is
inserted
BYPASS
17
in
(FI0)
From the top line menu, select
PATIENT,
then NEW. Fill
in the study identification
screen,
then select QUIT.
(Alternatively
the identification
data on all the
participants
for the day may be entered
into a "roster"
at the beginning
of the day, and a given one may be
activated
prior to his study as follows:
select
PATIENT,
select ROSTER,
highlight
the desired
participant
name, select ACCEPT.)
From the top
"ARIC Echo".
line
menu,
select
PROTOCOL,
then
Press LIVE on the keypad.
(The Acuson image screen
be "fed through"
the Freeland
to the display)
6.3
Participant
will
Preparation.
The participant
should remove
all clothing
from
and don a clinic gown which will provide
access
as needed for imaging.
Position
the subject
in the
head propped
up at a slight
behind him to help maintain
the waist up
to the chest
left lateral
position
with the
angle on pillows
and a wedge
this position
comfortably.
Attach
three EKG electrodes
as labelled.
The "arm" leads
(RA and LA) may be placed
on the upper chest near the
shoulders,
and the "left leg" lead (LL) may be placed
on the
abdomen.
The leads should
be draped
without
tension
in a
way that they will not interfere
with the subsequent
examination.
Check that a clear EKG signal
is displayed
on
the echo machine.
The EKG size control
on the Acuson
is
generally
best left in the"AUTO"
position.
Turn up the
AUDIO VOLUME
enough
to confirm
that the R BEEPER is active
(a beep is heard coincident
with each R wave of the EKG).
The technician
will measure
the participant’s
blood pressure
in a comfortable
supine position
and record it on the
imaging systems’
information
screens.
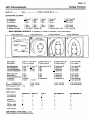
6.4
Imaqinq
Views
and
Information
Sought
This section
reviews
the standard
set of acoustic
windows
to
be used and the data sought
from each view. In addition,
a
list of items to be recorded
is given.
Where "tape"
is
specified,
several
seconds
of clearest-possible
images
are
ARIC PROTOCOL 15.
Echocardiography
- Version
1.0.
VISIT
;3.
07/94
PAGE
18
recorded.
Where "digital"
is specified,
the appropriate
capture
protocol
is used, "ARIC Echo" to capture
2-D images
as single
cardiac
cycles or "M-mode/Doppler"
to capture
single
full-screen
records
of those data. Where "hardcopy"
is specified,
the technician
will record a freeze
frame
image (generally
M-mode data) on the thermal
video page
printer.
6.4.1
Parasternal
Views.
These
views
are usually
in the left 3rd or 4th intercostal
space adjacent
sternum.
performed
to the
6.4.1.1
Parasternal
Long Axis View
The ultrasonographer
attempts
to line the beam
perpendicular
to the interventricular
septum
and
posterior
left ventricular
wall. Initially,
the focus
is on obtaining
a clear 2-D image of the aortic valve,
aortic root, left atrium,
right ventricle,
left
ventricle,
and mitral
valve.
Color Doppler
interrogation
is performed
to assess
aortic and mitral
regurgitation.
Data recorded
in the parasternal
long-axis
view:
2-D imaging (tape)
Color Doppler
(tape)
2-D images (digital)
6.4.1.2
Right ventricular
inflow
view
In a modification
of the parasternal
long
the transducer
is angled to the subject’s
demonstrating
the tricuspid
valve anatomy
Data recorded
in the RVinflow
view:
2-D imaging (tape)
Color Doppler (tape)
axis view,
right,
6.4.1.3
Parasternal
Short
Axis View
From the long axis position,
the transducer
is rotated
clockwise
90-degrees
to obtain the short axis view.
The exam begins
at the left ventricular
(papillary
muscle)
level to demonstrate
ventricular
anatomy
and
wall motion.
Images
are recorded
at the mitral valve level to show
valve anatomy
and motion.
Images
are recorded
at the aortic
valve level to show
valve anatomy
and motion.
Color Doppler
is performed
at the pulmonary,
aortic,
and (if adequately
visualized)
tricuspid
valves.
The technician
perform
M-mode
atrium.
returns
to the aortic
valve level to
recording
of the aortic
valve and left
ARIC PROTOCOL 15. Echocardiography
- Version 1.0. VISIT 3. 07/94
PAGE
19
M-mode examination
is performed
at the papillary
level
taking
care to orient
the transducer
for a view
perpendicular
to the long axis of the ventricle
(creating
a circular,
rather
than oblong,
shape to the
tomographic
image).
The M-mode
cursor
is positioned
through
the center
of the chamber
and gain settings
are
adjusted
to optimize
the boundary
detection
of the
walls of the interventricular
septum
and posterior
wall.
While optimizing
M-mode
angle and image quality
the Acuson display
is a split screen
showing
both Mmode and a miniaturized
2-D image.
When the data are
optimal,
the SIZE toggle is pressed
once on the Acuson,
increasing
the M-mode
display
to full screen.
The
FREEZE
button is pressed
after a full sweep is
displayed
in the larger
format.
This frozen
display
is
printed
on the hardcopy
device,
recorded
onto
videotape,
and captured
into the Freeland
digital
system.
The same procedure
is carried
out for the
images at the aortic valve level, described
above.
NOTE: If the technician
feels that the image data are
technically
better
from the parasternal
long-axis
view,
then that view will be used for M-mode data,
positioning
the cursor just beyond
the mitral leaflet
tips and carefully
selecting
the image plane to
coincide
with the long axis of the left ventricle.
The
M-mode
data at the aortic valve level may also be
obtained
from the parasternal
long-axis
view if image
quality
is felt to be significantly
better than short
axis.
Data
recorded
in the parasternal
short axis views:
2-D at aortic,
mitral,
and papillary
(tape)
Color Doppler
of valves at aortic level (tape)
2-D images of LV at papillary
level (digital)
M-Mode
of LV at papillary
level
(digital/tape/hardcopy)
M-Mode
of Aortic valve and LA
(digital/tape/hardcopy)
6.4.2
Apical
Views.
These views
are performed
in the
interspace
where the ventricular
apex is felt, usually
the left 5th or 6th interspace
in the between
the
midclavicular
and anterior
axillary
lines.
in
6.4.2.1
Apical
4 chamber
view
The technician
strives
to achieve
an imaging
plane
directly
over the left ventricular
apex, parallel
to
the interventricular
septum,
and rotated
in a manner
show all 4 chambers
and both the mitral and tricuspid
valves simultaneously.
ARIC PROTOCOL 15. Echocardiography
- Version 1.0. VISIT 3. 07/94
to
PAGE
20
For efficiency
perform
pulsed
first.
in the protocol,
the technician
will
wave spectral
Doppler
examinations
For mitral inflow
data, the range gate is placed near
the tips of the mitral
leaflets
with small adjustments
in angle to obtain maximum
flow velocity
data with a
narrow
spectral
dispersion.
After
2-D directed
placement
of the range gate cursor using the split
screen (Doppler
and miniature
2-D) mode, a full screen
sweep (activated
using the SIZE toggle on the Acuson)
of spectral
Doppler
is frozen
on the screen,
printed
on
the hardcopy
device,
recorded
on videotape,
and
captured
on the digital
system.
For aortic outflow
data, the transducer
is tipped
slightly
anterior
show the aortic valve and outflow
tract (the "5 chamber"
view).
The range gate cursor
placed in the left ventricular
outflow
tract about 0.5
to 1 cm proximal
to the aortic valve,
again trying to
demonstrate
a pattern
of narrow spectral
dispersion
and
a well-defined
velocity
profile.
Data are recorded
as
for mitral
above.
The Doppler
mode is then switched
to
CW (continuous
wave) and the interrogating
beam
directed
through
the aortic
valve to measure
peak
velocity.
Next the focus in on clear 2-D images of the 4 chambers
and AV valves.
This view and its color flow Doppler
data are recorded
on videotape.
The 4-chamber
view is
digitized
into the Freeland
system with particular
attention
to definition
of LV wall boundaries
and wall
motion.
Data
recorded
in the apical 4 chamber
view:
Pulsed
Doppler
of mitral inflow
(digital/tape/hardcopy)
Pulsed Doppler
of aortic
outflow
("5 chamber
view")
(digital/tape/hardcopy)
2-D images of 4 chamber
view (tape)
Color Doppler
(mitral,
aortic,
tricuspid)
(tape)
2-D images of LV in 4 ch view (digital)
6.4.2.2
Api=al
2 chamber
and long axis views
From the
4 chamber
view, the transducer
is rotated
along its
imaging
axis 90 degrees
counterclockwise
to show the
left ventricle
and atrium
from the apex (the 2 chamber
view).
This view is recorded
on videotape
and the 2-D
images
are captured
on the digital
system
with
particular
attention
to definition
of LV wall
boundaries
and wall motion.
The transducer
is rotated
ARIC PROTOCOL 15. Echocardiography
- Version 1.0. VISIT 3. 07/94
PAGE
21
slightly
to simultaneously
image the mitral
and aortic
valves
~the apical
long axis view) and color flow
Doppler
data is recorded
on videotape.
Data
recorded
in the apical
2-chamber
and long axis:
2-D image of 2-chamber
view (tape)
Color Doppler
of mitral/aortic
in long axis (tape)
2-D images of LV in 2 ch view (digital)
6.4.3
Supplementary
views.
With the important
priority
of
measuring
LV wall and chamber
dimensions,
inability
to
obtain useable
images
from other acoustic
windows
(especially
parasternal)
should
prompt the technician
image from the subcostal
view. Both a 4 chamber
view and a
short axis of the LV at the papillary
level should be
attempted.
Recognition
by the technician
of significant
abnormalities
should
prompt further
examination
which may
require
additional
views.
For example,
a suggestion
of
aortic root dissection
should
prompt examination
from the
suprasternal
notch.
Sometimes
supplementary
Doppler
interrogation
from standard
views is required,
such as with
the recognition
of valvular
aortic
stenosis
where continuous
wave Doppler
(CW) should
be carefully
employed
to measure
peak flow velocity
through
the valve.
6.5
Completinq
6.5.1
the
Completing
study
data
storage.
On the Freeland
digital
image system,
ensure that the
desired
images have been "locked"
by noting that a
magenta
lock icon is displayed
on each cardiac
loop
captured.
Clear the other (unlocked
and discardable)
images
from the system
using the Clear Unlocks
(SHIFTFS) function.
Then, select
File then Save from the top line menus.
This process
will take a few minutes
as the selected
data is stored onto the 128MB optical
disk.
Then, when the above "save" operation
is complete,
clear the Freeland
system completely
using the Unlock
all (SHIFT-Fg)
function
followed
by Clear Unlocks
(SHIFT-FS).
Record any
technician
6.5.2
Completing
During the
disconnect
additional
worksheet.
the
comments
participant
or data
on
encounter
file save operation
is a convenient
the Acuson
EKG cable and remove the
ARIC PROTOCOL 15. Echocardiography
the
time to
electrode
- Version 1.0. VISIT 3. 07/94
PAGE
22
pads. Provide
the participant
residual
ultrasound
gel while
7.
TRANSMITTAL
OF
DATA
TO THE
with a towel
to
he gets dressed.
READING
remove
any
CENTER
At the completion
of the day’s studies,
the videotape(s)
and the
optical
disk are removed
from their respective
systems.
The
tape(s),
disk, and technician
worksheets
for each study should
packaged
together
for hand delivery
to the Heart Station
where
the data will be analyzed.
It is anticipated
that studies
will
be delivered
at least once a week. The studies
will be logged
in
at the reading
center using the information
on the technician
worksheets.
Each study’s
progress
through
the reading
and data
entry processes
will be noted in the logbooks
of the reading
center.
More complete
details
of these procedures
are found in
the ARIC Echocardiography
Reading
Center Manual.
ARIC PROTOCOL 15. Echocardiography
- Version 1.0. VISIT 3. 07/94
PAGE
23
REFERENCES
Kannel WB, Gordon T, Castelli WP, Margolis JR. Electrocardiographic
left ventricular hypertrophy and risk of coronary heart disease: the
Framingham Study. Ann Intern Med 1970;72:813-822.
Kannell WB, Dannenbery AL, Levy D. Population implications of
electrocardiographic
left ventricular
hypertrophy.
Am J Cardiol
1987;60:851-93I.
3o
Devereux RB, Reichek N. Echocardiographic
determination
of left
ventricular
mass in man: anatomic validation of the method. Circulation
1977;55:613-618.
Devereux RB, Alonso DR, Lutas EM, et al. Echocardiographic
assessment
of left ventricular
hypertrophy:
comparison to necropsy findings. Am J
Cardiol 1986;57:450-458.
Reichek N, Helak J, Plappert T, Sutton MS, Weber KTo Anatomic
validation of left ventricular mass estimates from clinical twodimensional
echocardiography:
initial results. Circulation
1983;67:348352.
Woythaler JN, Singer SL, Kwan OL, et al. Accuracy of echocardiography
versus electrocardiography
in detecting left ventricular hypertrophy:
comparison
with post mortemmass
measurements.
J Am Coll Cardiol
1983;2:305-311.
Levy D, Savage DD, Garrison RJ, Anderson KM, Kannel WB, Castelli WP.
Echocardiographic
criteria for left ventricular
hypertrophy:
the
Framingham Heart Study. Am J Cardiol 1987;59:956-960.
Dannenberg AL, Levy D, Garrison RJ. Impact of age on echocardiographic
left ventricular mass in a healthy population (the Framingham Study).
Am J Cardiol 1989;64:1066-1068.
Lauer MS, Anderson KM, Kannel WB, Levy D. The impact
ventricular
mass and geometry. JAMA 1991;266:231-236.
10.
ARIC
of obesity
on left
Manolio TA, Levy D, Garrison RJ, Castelli WP, Kannel WB. Relation of
alcohol intake to left ventricular
mass: the Framingham Study. J Am
Coll Cardiol 1991;17:717-721.
PROTOCOL
15. Echocardiography
- Version
1.0.
VISIT
3. 07/94
PAGE
24
11.
Savage DD, Levy D, Dannenbery AL, Garrison RB, Castelli WP. Association
of echocardiographic
left ventricular
mass with body size, blood
pressure, and physical activity (the Framingham Study). Am J Cardiol
1990;65:371-376.
12.
Levy D, Garrison RJ, Savage DD, Kannel WB, Castelli WP. Prognostic
implications of echocardiographically
determined left ventricular mass
in the Framingham Heart Study. N Engl J Med 1990;322:1561-1566.
13.
Casale PN, Devereux RB, Milner M, et al. Value of echocardiographic
ventricular mass in predicting cardiovascular
morbid events in
hypertensive
men. Ann Intern Med 1986;105:173-178.
14.
Levy D, Anderson KM, Savage D, Balkus SA, Kannel WB, Castelli WP. Risk
of ventricular arrhythmias
in left ventricular hypertrophy: the
Framingham Heart Study. Am J Cardiol 1987;60:560-565.
15.
Cooper RS, Simmons BE, Castaner A, Santhanam V, Ghali J, Mar Mo Left
ventricular hypertrophy is associated with worse survival independent of
ventricular function and number of coronary arteries severely narrowed.
Am J Cardiol 1990;65:441-445.
16.
Levy D, Plehn JF, Wolf PA, et al. Left ventricular mass and risk of
stroke in men. Circulation 1987;76(Suppl
IV}:IV-143,
abstract.
17.
Levy D, Garrison RJ, Savage D, Kannel WB, Castelli WP. Left ventricular
mass and incidence of coronary heart disease in an elderly cohort: the
Framingham Heart Study. Ann Intern Med 1989;110:101-107.
18.
Ghali JK, Kadakia S, Cooper RS, Liao YL. Impact of left ventricular
hypertrophy on ventricular arrhythmias
in the absence of coronary artery
disease.
J Am Coll Cardiol 1991;17:1277-1282.
19.
Georgiou
systemic
20.
Koren MJ, Devereux RB, Casale PN, Savage DD, Laragh JH. Relation of
left ventricular mass and geometry to morbidity and mortality in
uncomplicated
essential hypertension.
Ann Intern Med 1991;114:345-352
ARIC
PROTOCOL
D, Brundage BH. Regression
hypertension°
Clin Cardiol
15. Echocardiography
of left ventricular
1992;15:5-16.
- Version
1.0.
VISIT
left
mass in
3. 07/94
PAGE
.o.oco
VIEW I
DATA SOUGHT
Measure BP; Connect EKGand verify
25
07126194
RECORD
I DISPLAY
I
PRIORITY I COMMENTS
I
R-beeper
Enter Study ID on Freeland and A cuson
Press "MARK"on VCRremote while recording Acuson ID screen
Pare. Long
2-D
Tape
Acuson
angle to RVinflow view to imagetricuspid valve
angle to RVinflow view for color flow of tricuspid valve
Med
i!iiiiiiiiiiii~i~iiiiiiiiiil
onclearviewof septalandposterior
walls
I emphasis
Colorflow (aortic, mitral)
Pare. Short
High
High
Tape
2-D (sweepLV, mitral, aortic levels)
Colorflow (pulm,aortic, tricuspid)
Low
emphasison "true short axis" (round) and boundarydef.
::::::::::::::::::::::::::::::::::::::::::::::::::::::
::
:::
::::::
:::::::::::::;;::;;-:.:::::::
:::::::::::::::::::
::::::
:::
:::::::::::::::::::::::::::::::::::::::::::::::
::;::::::::
::;;:::::;:
Select "ARICM-ModeDoppler"Protocol onFree/and
emphasis
on clear boundaries;use long axis if better data
Para. Short
Para.Short
Apical 4-ch.
Apical 5-ch.
I Se,.ct
",,,,,C
Ec,,o"
Pro,oco,
onFr.e,.nd
Apical 4-ch.
2-D
Colorflow (mitral, tricuspid, aortic)
I
Acuson
"
Apical 2-ch.
Check that desired images are "locked" on Free/and
Clear unlocks.fSHFT- F5)
File, save
Unlock all (SHFT- F9) and Clear unlocks (SHFT-
Tape
"
I
Med
Med
I
use "5 chamber"for aortic
PAGE
26
ARIC
Echocardiography
Technician
Name
:
ID
:
Age
:
BP
:
Height :
(cm) (in)
__
/
Weight :
Date
:
~
:
Worksheet
~5)
::::::::::::::::::::::::::::::::::::::::::::::::::::::::::::::::::::::::::
Opt.Disk
#
Position
for study:
LV M-mode
Ao/LA
Videotape
[] 45° left
from
M-mode
#
from
Tech ID:
[] OTHER:
[] para. short
D para. long
[] unobtainable
[] para. short
[] para. long
[] unobtainable
Comments
2-D
or
color
flow
M-mode
Pulsed
Doppler
Other
Alert
findings:
[] Aortic dissection"
°
D Thrombus
[] Vegetation"
[] Large pericardial effusion"
Called Dr.
Date/7~me:
Study
Time
:
START:
[] Aortic stenosis
[] Mitral stenosis
[] Mod/Severe
[] Marked LV dysfunction
STOP:
regurg
PAGE 27
Reading Worksheet
ARICEchocardiography
Stored to optical disk # __
Date:
ReaderID
QUALITATIVE2-D DATA
LA enlargement
LV enlargement
Aoroot dilation
I-I None[0]
[] None
[] None
[] Mad[2]
[] Mad
[] Mad
[] Severe[3]
[] Severe
[] Severe
[] Can’t assess [9]
I-] Can’t assess
[] Can’t assess
LV hypertrophy
LV ejection fraction
LV regional wall motion
[] None
[] Mild
[] Mad
[] Normal
[] Mild $
[] Mad $
[] Normal [N] [] Borderline [B]
[] Severe
[] Severe i
[] Definitely
[] Can’t assess
[] Can’t assess
abnormal [A} [] Can’t assess [9]
[] Mild [1]
[] Mild
[] Mild
MARKABNORMAL
SEGMENTS:
H=hypokinetic
[] Can’t assess View
[]
Can’t
A =akinetic
assess
D=dyskinetic
View
X=can’t
assess
segment
[] Can’t assess view
[] Can’t assess View
Aortic leaflets
Mitral leaflets
[] Min or no sclerosis [0]
[] Min or no sclerosis
[] Definite sclerosis [1]
[] Definite sclerosis
[] Definite stsnosis [2]
[] Definite stenosis
[] Can’t assess [9]
[] Can’t assess
Mitral Regurgitation
Aortic Regurgitation
Tricuspid Regurgitation
Pulmonary Regurgitation
[]
[]
[]
[]
[]
[]
[]
[]
Mild (cleady abnl) [2]
Mild
Mild
Mild
[]
[]
[]
I-1
Mad/Severe[3]
Mad/Severe
Mad/Severe
Mad/Severe
[]
[]
[]
[]
Can’t
Can’t
Can’t
Can’t
assess [9)
assess
assess
assess
[]
[]
[]
[]
Mild
Mild
Mild
Ant/apical [A]
[]
[]
[]
[]
Mad/Severe
Mad/Severe
Mad/Severe
Inf/postedor [!]
[]
[]
[]
[]
I-I
Can’t
Can’t
Can’t
Can’t
Can’t
assess
assess
assess
assess [9]
assess [9]
Mitral anular calcif.
Mitral prolapse
Ao Root flbrocalcific
LV aneurysm
LV thrombus
None [0]
None
None
None
[] None
[] None
chg [] None
[] None[N]
[] No [N]
2-D
: LV Measured from
M-mode: LV Measured from
Septal orientation >30 ?"
[] No
[] Trace [1]
[--I Trace
[] Trace
[] Trace
[] Yes [Y]
[] para. long [L]
[] para. long [L]
[] Yes
[] para. short IS]
[] para. short [S]
[] Not measured[9]
[] Not measured[9]
NOT RECORDED(9l
[]
[]
OTHER ECHO RNDINGS:
STUDY QUALITY
2-D parastemal
2-D apical view
EXCELLENT(3)
[]
[]
GOOD(2)
[]
[]
FAIR (1I
[]
l-]
NOT USEABLE(0)
[]
[]
M-mode LV
M-mode Ao/LA
[]
[]
[]
[]
[]
[]
[]
[]
PWDop - mitral
PW Dop - LVOT
~1
[]
[]
[]
[]
[]
O
[]
Color flow data
[]
[]
[]
[]
ALERTFINDINGS / ACTION TAKEN: [] none
OTHER COMMENTSON PROCEDUREOR DATA:
[]
[]