1
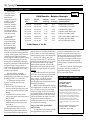
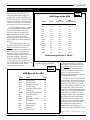
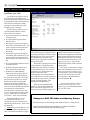
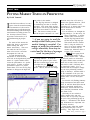
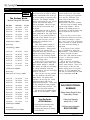
AIQ Opening Bell Monthly IN THIS ISSUE Feature V OL . 8 I SSUE 2 F EBRUARY 1999 TRADING STRATEGIES REVIEW S ec t i o n s HOW ARE THEY PERFORMING? AN UPDATE ON PREVIOUSLY PUBLISHED TRADING STRATEGIES S&P 500 Changes .............. 4 By David Vomund Putting Market Timing in Perspective ......................... 5 W Perforrmance Figures on Published Strategies ........ 1 Readers Forum .................. 7 Data Maintenance ............. 7 Market Review .................... 8 The Opening Bell Monthly is a publication of AIQ Systems David Vomund, Chief Analyst P.O. Box 7530 Incline Village, Nevada 89452 In last DAVID VOMUND months Opening e recently heard from a rather Bell, we reported frustrated user who said that the 1998 return for the AIQ mechanical he did not have confidence in strategy that combines the Weighted TradingExpert Pro because in the Action List report with the market Opening Bell newsletter we constantly timing Expert Ratings. With this introduce new strategies and approaches to using the software. The user strategy, the average holding period is 1 1/2 months. Needless to say, the AIQ reasons that if we introduce a new mechanical strategy each month, strategys 75% that must mean that return for 1998 the old ones are no Needless to say, the topped all other longer working. AIQ mechanical trading strategies. Nothing could strategys 75% return for Performance be further from the updates on other truth. Different 1998 topped all other previously pubpeople have different strategies. lished strategies styles so when we follow. find something that works we publish it. Mechanical strategy using Relative Some strategies are for short-term Strength Report (published April 97) traders, some strategies are for less active traders, some are for people who Another AIQ mechanical strategy like to short securities, etc. (introduced in the April 1997 Opening Bell) uses the Relative Strength Report. So that we are held accountable for This strategy is exactly the same as the our analysis, we will review some of the AIQ mechanical model (above) except strategies that we have presented in the the Relative Strength Report is used last two years and update their perforinstead of the Weighted Action List. mance. Trading Strategies Review continued on page 2 ® AIQ Opening Bell TRADING STRATEGIES REVIEW continued . . . This second strategy is more volatile because high relative strength stocks can fall like a rock in a bearish market. However, with the exception of 1998, these two mechanical strategies have performed about the same historically. Table 1 1998 Results - Relative Strength ER Buy Date ER Sell Date S&P 500 Stocks Portfolio Holdings % Change % Change (Stock Symbols) 12/31/97 01/08/98 -1.48 -0.31 CINF,U,NAV,TCOMA,T 01/12/98 04/17/98 19.54 19.81 U,CINF,DELL,T,TCOMA 06/02/98 06/10/98 1.76 -1.82 UIS,DELL,NC,F,EMC 06/16/98 07/21/98 7.12 14.24 UIS,DEL,AAPL,EMC,LOW 07/29/98 09/03/98 -12.70 -10.23 In review, we 09/08/98 10/05/98 -3.41 -9.57 ran the daily 10/08/98 12/03/98 19.88 4.05 Relative Strength 12/29/98 12/31/98 -1.01 -3.17 Long-Term Strong Report every time 1998 Return = 11.5% there was an AIQ market timing buy signal (an Expert Rating of 95 or greater on ticker DJIA). mation that was available at that time. Only the first market timing signal in This is more accurate than running a a string of buy signals is used and no backtest using todays S&P 500 stocks. confirmation is applied to market For the year ending 1997, the timing signals. When a market timing strategy returned 51.6%. In 1998, the buy is registered, the top five stocks performance dropped to 11.5%, which that appear on the Relative Strength is close to what the average equity Report are purchased and held until a mutual fund returned. A list of the market sell signal is registered, at individual trade dates and the securiwhich time all positions are moved to ties that were purchased are found in cash. Only Standard & Poors 500 Table 1. stocks are purchased. This table lists the average return Like the strategy using the of the five stocks that were purchased Weighted Action List, the Relative for each trade along with the S&P Strength Report model has an average 500s return. Again, the percent holding period of 1 1/2 months. change figures are based on the To obtain percentage return opening price the day after the market figures, we made the following timing Expert Rating. assumptions: When we introduced this strategy The buy and sell points for the we emphasized, as noted above, that it stocks were the opening prices the was a volatile strategy because high day after the market timing Expert relative strength stocks can nose-dive Rating. in a bearish market. Indeed, when the Commissions were factored in AIQ timing model was on the wrong using a discount commission rate of side of the market in August of 1998 $20 per trade. the portfolio fell more than 10%, which represents its worst drawdown Slippage, dividends, and money in our historical testing. market interest received were not factored in. Since this strategy was first published in April 1997, we have continuously updated the trades so the stock purchases reflect the infor- 2 Dogs of the OEX (published March 1998) Last March we presented a model that applied the Dogs of the Dow DELL,COF,UMG,C,MCIC DELL,AAPL,EMC,UMG,CSCO PE,DELL,BLS,PEG,PDG SCH,LU,GPS,CSCO,SPLS strategy to Standard & Poors 100 stocks. Our point in the article was that too many people were following the Dogs of the Dow strategy so the strategy was losing its effectiveness. Yet, the philosophy of buying high yielding large-capitalization stocks is sound. Therefore, instead of applying the strategy to only Dow stocks, we applied the strategy to Standard & Poors 100 (OEX) stocks. PLEASE SEND CORRESPONDENCE TO: Opening Bell Monthly G.R. Barbor, Editor P.O. Box 7530 Incline Village, NV 89452 AIQ Opening Bell Monthly does not intend to make trading recommendations, nor do we publish, keep or claim any track records. It is designed as a serious tool to aid investors in their trading decisions through the use of AIQ software and an increased familiarity with technical indicators and trading strategies. AIQ reserves the right to use or edit submissions. For subscription information, phone 1-800-332-2999 or 1-775-831-2999. © 1992-1999 , AIQ Systems FEBRUARY 1999 AIQ Opening Bell TRADING STRATEGIES REVIEW continued . . . To review the Dogs of the Dow strategy, on the first trading day of each year you buy the ten highest yielding Dow stocks and hold them for the rest of the year. The portfolio is rebalanced using the same strategy at the start of every year. Obviously, this is a strategy for long-term investors. In our modified strategy, we made a list of the 20 highest yielding OEX stocks and then eliminated the five highest yielders (we found the five highest yielding were either utility stocks or were truly dogs). The remaining 15 stocks were then purchased and held for the remainder of the year. In the March Opening Bell, we listed the 15 Dogs of the OEX stocks. Table 2 contains the same list of stocks and updates their total return figures for 1998. This strategy produced an average return of 19.4% which once again beat the actual Dogs of the Dow strategy. This is an attractive return considering the average S&P 500 stock gained about 13% in 1998 and you only had to work one day out of the year in order to achieve this 19.4% return! Table 2 1998 Dogs of the OEX Ticker Yield 1998 Yrly. % Ch. BEL AN GM WY AIT EK IFF MOB PNU XON MMM NSC ALT AMP 3.4 3.3 3.3 3.3 3.0 2.9 2.9 2.9 2.9 2.7 2.6 2.6 2.5 2.5 18.7 40.7 17.8 3.6 57.5 18.9 -14.2 20.7 54.6 19.5 -13.3 3.9 -21.0 24.0 1998 Total Return (%) 22.1 44.0 21.1 6.9 60.5 21.8 -11.3 23.6 57.5 22.2 -10.7 6.5 -18.5 26.5 1998 Average Return = 19.4% In order to keep tracking the Table 3 1999 Dogs of the OEX Ticker Stock ETR DOW IFF PRD ALT F MMM WY ONE BAC BEL GM BHI DD HRS Entergy Corp Dow Chemical Intl Flavors & Frag. Polaroid Corp. Allegheny Teledyne Inc. Ford Motor Minn. Mining & Manuf. Weyerhaeuser Co. Banc One BankAmerica Corp. Bell Atlantic General Motors Baker Hughes Du Pont Harris Corp. Yield 3.9 3.8 3.4 3.2 3.1 3.1 3.1 3.1 3.0 3.0 2.9 2.8 2.6 2.6 2.6 results from this strategy, we have published the 1999 Dogs of the OEX list in Table 3. Few AIQ users have the temperament to buy and hold stocks for an entire year but this list can also be used in an effective trading strategy that switches between growth and value stocks. The Dogs of the OEX is a good list of value stocks. The Relative Strength Report used in our previous strategy produces a list of attractive growth stocks. By creating an industry group that represents value stocks and an industry group that represents growth stocks, you can use the RSMD indicator to trade between the two investment philosophies. When the market environment favors value investing, you purchase the Dogs of the OEX stocks. Conversely, when the market environment favors growth stocks, then you purchase high relative strength stocks (this strategy was covered in the May 1998 Opening Bell). Trading Strategies Review continued on page 4 FEBRUARY 1999 3 AIQ Opening Bell TRADING STRATEGIES REVIEW continued . . . Divergence EDS Model (published April 1998) Table 4 One of the most popular Opening Bell articles last year related to an Expert Design Studio (EDS) model that was published in the April 1998 issue. This model is an effective trading strategy for active traders (average holding period of 14 days). For this strategy, there are seven rules that must be met for a stock. These rules are as follows: 1. Its price must be below its 200 day moving average. 2. Its volume must be greater than 200,000 shares. 3. It must have a positive divergence in its OBV Percent indicator (i.e., the stock went down at the same time that its OBV Percent indicator increased). 4. It must have a positive divergence in its Money Flow indicator (i.e., the stock went down at the same time that its Money Flow indicator went up). 5. Its 7 day RSI Wilder indicator must be greater than 50. 6. Its MACD indicator must be on a buy (fast line above slow line). 7. Its Money Flow RSI (MF RSI) indicator must be greater than 70. Our historical test published in the April 98 Opening Bell covered the time period 01/02/96 to 03/02/98. Results showed the average trade gained 4.21% before commissions with a 14-day holding period. If you were to buy the S&P 500 index instead of each stock for each trade, the average trade would have been only 1.91%. The annualized return assuming you could trade every selection was 72.68%. There were 128 trades. In the April article, we were convinced that we didnt overoptimize the system. That means it should work in the future. So how has it performed? Table 4 shows the results of a test from March 1998 through December 1998. The model continued to outper- 4 form. The average stock gained 2.72% excluding commissions with a 10-day holding period. If you were to trade the S&P 500 index instead of the stocks, the average trade would have only gained 1.42%. This model is designed to work on a large database. The performance dramatically falls when it is run just on the S&P 500 stocks. For our most recent test, we used the Historical Data CD that comes with TradingExpert Pro and installed all the stocks that are over $10 and have a minimum average volume of 100,000 shares (a setting of 1000). That installed about 1800 stocks. When we first published this model, we received comments that there were not enough trades. For those who want more buy signals, try taking out the moving average rule and lower the requirement for the MF RSI to 60 (the default in the model is MF RSI greater than 70). This model can be downloaded from AIQs web page at www.aiq.com. Click on the educational products folder and then Opening Bell. This article contains just a sample of the material that has been covered in the Opening Bell newsletter. If you are interested, you can purchase back issues for the last two years for $75. Call AIQ sales at 800-332-2999 for more information. n David Vomund publishes VIS Alert, a weekly investment newsletter. For a sample copy go to www.visalert.com or call (775) 831 -1544. Changes to S&P 500 Index and Industry Groups The following is a recent change to the Standard & Poors 500 structure: McKesson-HBOC (MCK) replaces HBO & CO (HBOC) and MCK is added to the Distributors (Food & Health) group. FEBRUARY 1999 AIQ Opening Bell MARKET TIMING PUTTING MARKET TIMING IN PERSPECTIVE By David Vomund low points in the market. The Zig Zag indicator is designed for backtesting and has no forecasting value. New users often say that they plan to use the Zig Zag indicator because it has worked so well in the past. The reason it always works well in the past is because it is a self- direction every time a 5% move is made in the opposite direction. Well n the last few months weve run a repeat that this indicator is self series of articles on market timing. correcting so it is always right in the The attention weve devoted to past but should not be used for this subject may give the impression current analysis. that market timing is the most imporFor our backtest, we changed the tant element of a trading system. Its Zig Zag setting to 3 so that every 3% not. Security selection is more move is significant. A perfect important. In this article, well market timer would buy the put market timing in perspecday the Zig Zag bottoms and ...if you are going to need the tive. sell the day the Zig Zag tops. money within three years, then For much of this decade the That means that the market market timing is essential. For market has been so strong that timer is long the market on market timing has been every 3% or more advance, and money set aside for retirement or almost unnecessary. That was moves to cash the day the college education, then stay intrue until the last few years market tops whenever there is vested and let the law of averages at least a 3% correction. when a few severe corrections interrupted the bull run. Table 5 (next page) shows work in your favor. To help demonstrate the the individual trades of the importance of stock selection, perfect market timer. Assumwell look at the hypothetical perforcorrecting indicator. It finds the ing that all profits are reinvested, mance of a perfect market timer high and low points in price action the perfect market timer would have versus the performance of a perfect and then connects these points with made 76% in 1996, 129% in 1997, stock selector. In order to obtain a straight line (see Figure 11). and 140% in 1998. Obviously these performance figures of a perfect are impressive results. Yet, if By default, Zig Zag looks for 5% market timer, well use the Zig Zag someone had the foresight to simply moves. That is, the line will change indicator to help spot the high and buy the best performing industry group on January 1 and then hold it Figure 1 for the remainder of the year, this person would have beaten the perfect market timer over the three-year period. In 1996 his Oil (Drilling) industry group investment would have made 182%, in 1997 his Retail (Discount & Variety) investment would have made 123%, and in 1998 his Computer (Internet) investment would have made 513%. Obviously no one could be a perfect market timer and only someone who is very lucky can pick the years best performing group on January 1. Nonetheless, this should help demonstrate the important role of security selection. Some people claim that market timing should not play a role in investing. They argue that, histori- I Market Timing continued on page 6 FEBRUARY 1999 5 AIQ Opening Bell MARKET TIMING continued . . . Table 5 The Perfect World Market Timing S&P 500 Index Buy Date 01/10/96 03/08/96 04/11/96 07/24/96 09/05/96 12/16/96 Sell Date 02/12/96 04/03/96 05/24/96 08/22/96 11/25/96 12/31/96 % Gain 10.52 5.11 7.50 7.03 16.57 13.22 1996 Return = 76.4% Best Group: Oil (Drilling) = 182% 12/31/96 04/11/97 08/15/97 08/29/97 10/27/97 11/12/97 12/24/97 02/18/97 08/06/97 08/20/97 10/07/97 11/05/97 12/05/97 12/31/97 26.81 30.19 4.28 9.30 7.50 8.59 4.04 1997 Return = 128.5% Best Group: Retail (Disc. & Variety) = 123% 12/31/97 01/09/98 04/28/98 06/03/98 06/15/98 08/14/98 08/31/98 09/10/98 10/08/98 12/03/98 12/14/98 01/05/98 04/22/98 05/04/98 06/09/98 07/17/98 08/18/98 09/08/98 09/23/98 11/27/98 12/07/98 12/31/98 1998 Return = 140.3% Best Group: Computer (Internet) = 513% 6 0.68 21.81 3.41 3.30 10.19 3.62 6.89 8.76 24.27 3.27 7.71 cally, the return on equities is well above that seen on bonds or moneymarket instruments and stocks go up when looking at long-term time horizons. For example, holding stocks continuously for any 10-year period since 1945 has always proven profitable. Moreover, 96% of all the five-year periods were profitable. What about the risk of buying at the market top? According to a study published in The Wall Street Journal, if you invested $5,000 at the peak of the market every year over the past 20 years, you still would have quadrupled your investment. How much market timing is used in a portfolio is a matter of personal preference. Many people who attend our seminars are surprised when they find out that I believe that market timing is an effective tool for lowering risk but in the long run it is not an effective tool for raising return. In my view, if you are going to need the money within three years, then market timing is essential. For money set aside for retirement or college education, then stay invested and let the law of averages work in your favor. Here is how I treat my portfolio. For my childrens' education and 401k money, Im always fully invested. In the long run, a fully invested portfolio will beat a market-timed portfolio. Thats why in my managed account program, we are always fully invested. Our focus is on good stock selection. My first form of market timing comes in 10% increments. When the market corrects 10% I buy. If it corrects another 10% I buy more. These are typically good opportunities to buy the Wheaties type stocks such as Microsoft, Intel, Applied Materials, Sun Microsystems, and Cisco Systems. The next form of market timing uses the AIQ software. This is applied to the trading portion of your portfolio as well as money that may be needed in the next few years. If you are near or are in retirement and cant afford to lose money, then short-term timing is important. Also, if you are a conservative investor focused on capital preservation, then short-term timing is important. As for myself, I have a house that is scheduled for large-scale improvements. I cant afford to lose the money set aside for these projects but I still want the money to grow, so short-term market timing is important. This is my view on market timing but this view is not widely held by other analysts. There is no correct answer on the role that market timing plays in everyones analysis. It is an individual decision and you should simply do what you are comfortable with. n Year-End Index of 1998 Articles Friday and Saturday March 5 & 6, 1999 Opening Bell subscribers may obtain a free Index of 1998 Opening Bell articles by calling 1-800-332-299. AIQ EDUCATIONAL SEMINAR Safety Harbor Resort & Spa Tampa Bay, Florida Call for more information 800-332-2999 FEBRUARY 1999 AIQ Opening Bell READERS FORUM T his Question & Answer feature will appear regularly in the Opening Bell. Send your questions to Editor, Opening Bell, P.O. Box 7530, Incline Village, NV 89452. you wish to search the Historical Data CD. This will add that symbol to your master ticker list. Check page 42 in the User Manual for additional features for the Historical Data CD. Q: Why are some of the technical indicators blank when you pull up an index in AIQ charts? Q: What are the Hot Keys in charts? A: Indices do not usually have volume provided by the data service and therefore any indicator based on volume will not be computed. A changes the vertical cursor to a diamond. Q: How do I add additional stocks to my database that came with the program? A: Two ways. First, you can click on Ticker and New, in Data Manager. Second, while in Data Manager, type in the symbol you want to add (just start typing on the keyboard and a box will pop up that says search for ticker). If the symbol is not in your Master Ticker List, a box will pop up asking if A: The "Hot Keys" are: G - adds gridlines. M puts the program into a trendline mode. Z - zooms the chart larger (good for Point & Figure charting). T tags the current chart to the selected tag list. ? - brings up the Expert Rules. S - to adjust for splits. O for overlays. C to reconnect for real-time charts. F fundamentals Q: Where do we find updates or fixes for the program? A: From the TradingExpert Main Menu, click on Help (at the top of the screen), choose Tech Support/ Product Updates. Check this periodically for updates. Q: How do I deselect reports that I do not want generated? A: In Reports, click on Generate/ Setup Parameters. Deselect the reports that you do not want generated. Q: Do I need to have the MyTrack program running in order to use Real Time in TradingExpert Pro? A: No. MyTrack is a separate program and does not have to be running. R to refresh real-time data. STOCK DATA MAINTENANCE The following table shows past and future stock splits and large dividends: Stock Yahoo Inc. Merck & Co. Atlas Air Broadcast.com Advanced Mktg. Svs. Medicis Pharm. Broadcom Corp. Jabil Circuit Insight Enterprises Ticker Split/Div. Approx. Date YHOO MRK CGO BCST ADMS MRX BRCM JBL NSIT 2:1 2:1 3:2 2:1 3:2 3:2 2:1 2:1 3:2 02/08/99 02/09/99 02/09/99 02/12/99 02/16/99 02/17/99 02/18/99 02/18/99 02/19/99 Stock Linear Technology Ha-Lo Industries Heritage Commerce Go2Net inc. Ameritrade Holding Xerox Corp. Solectron Corp. Coast Bancorp Pediatrix Medical Grp. Ticker Split/Div. Approx. Date LLTC HMK HTBK GNET AMTD XRX SLR CTBP PDX 2:1 3:2 3:2 2:1 2:1 2:1 2:1 2:1 2:1 02/22/99 02/22/99 02/22/99 02/23/99 02/22/99 02/24/99 02/25/99 02/26/99 03/01/99 Trading Suspended: Equity Corp Intl (EQU), HBO & Co. (HBOC), Quaker State Corp (KSF), Spaghetti Warehouse Inc (SWH), Tetra Tech (WATR), Valley Forge (SCI) Name/Ticker Changes: Allied Waste Inds. (AWIN) to Allied Waste Inds. (AW), Alluminum Co of America (AA) to Alcoa Inc. (AA), BB & T Corp (BBK) to BB & T Corp. (BBT), Cracker Barrel (CBRL) to CBRL Group Inc. (CBRL), Lithia Motors Inc. (LMTR) to Lithia Motors Inc. (LAD), McKesson Inc. (MCK) to McKesson HBOC Inc. (MCK), Monaco Coach (MCCO) to Monaco Coach Corp. (MNC), Pennzoil Co (PZL) to Pennz Energy Co (PZE), Platinum Technology (PLAT) to Platinum Technology Intl Inc. (PLAT), Specialty Equip Cos. (SPEQ) to Specialty Equip Cos. (SEC) FEBRUARY 1999 7 AIQ Opening Bell I MARKET REVIEW f the month of January is a barometer of the rest of the year, 1999 will be a great year. The S&P 500 rose 4% but the real winner was the Nasdaq Composite which increased 14%. Looking at individual industry groups, the TelecommunicationsCellular group rose 26%, Biotechnology rose 20%, and Computers-Peripherals rose 20%. Looking at the laggards, the losing groups of last year continued to underperform in January. The oil related industry groups all fell more than 10%. Building onto their gains from last year, the internet stocks started out very strong but near the end of January they finally experienced some weakness. How volatile are the internet stocks? From January 11 to January 20, Amazon.com (AMZN) experienced a 39% correction. Amazingly, AMZN was still higher on the year even after the correction. Similarly, Yahoo (YHOO) fell 36% from January 11 to January 20 but it also was above its December 31 price. Many investors have heard the phrase the January effect. This implies that small company stocks typically outperform large company stocks in the month of January. As happens very often, the January effect Figure 3 came early and then failed to work in January. In Figure 2 we are showing the Russell 2000 along with its RSMD SPX indicator. Notice this indicator had been falling from late 1997 until last November implying that the S&P 500 was outperforming the Russell 2000. After November the indicator began to point toward strength in the Russell 2000. In January, the weekly Figure 2 RSMD SPX indicator lost its upward momentum and was flat. The daily chart (not shown) gives a shorter-term picture and it turned negative, implying that in January leadership began to shift back to large company stocks. Two market timing signals were registered in January. A 100 down signal was registered on January 13 which was followed by a 95 buy signal on January 25. There has not been much market movement after either of these signals. This sideways movement is best seen on a Point & Figure chart of the S&P 500 (Figure 3). On this chart, Xs represent rallies and Os represent declines. During January, the chart shows level tops and level bottoms . That means that when the S&P 500 breaks above or below the consolidation, a Point & Figure buy or sell signal will be registered. For market timing it is helpful to combine Expert Rating signals with trend analysis. At the end of January the model was on a buy signal but the S&P 500 was at the upper end of its trading range. In order for both elements to be bullish, the S&P 500 needs to rally to 1285, at which point the Point & Figure chart will once again show an uptrend. n 8 FEBRUARY 1999