1
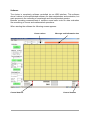
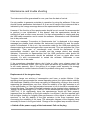
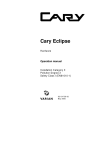
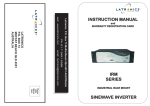
Latronics GmbH
Hüttenstraße 7
D-52068 Aachen
GERMANY
USER MANUAL
LA-NIR1700
Table of Contents
Introduction………………………………………………………………………………….. 3
Unpacking and Inspection…………………………………………………………………..3
Technical Data………....………………………………………………………………….....4
Safety rules…………………………………………………………………………………...5
Installation and Starting operations…………………………………………………...…...5
Operation………………………………………………………………………….................5
Maintenance…………………………………………………………………………..........12
Waste disposal…………………………………………………………………………......14
System components………………………………………………………………………..14
INTRODUCTION
----------------------------------------------------------------------------------------------------------------This manual contains all information you need to install, operate, maintain and
service your near infrared absorption spectrometer.
The manufacturer reserves the right to change the operation instruction or the
devices herein, in the course of technical progress.
Caution:
Don’t try to repair any part of the spectrometer by yourself while the unit is still under
warranty but report all problems to Latronics GmbH for warranty repair.
UNPACKING AND INSPECTION
----------------------------------------------------------------------------------------------------------------When you receive your spectrometer please immediately inspect the shipping
container. If there is any damage (holes or crushing etc.) insist that a representative
of your local carrier is present while you unpack the contents.
Carefully inspect your spectrometer as you unpack it. If any damage is evident, such
as dents or scratches on the cover, etc. immediately notify your carrier and your local
sales distributor.
For a better handling of the spectrometer in service matter, keep the shipping
containers for sending back the instrument to Latronics GmbH. Anyway, if you find a
damage claim, you may need them to demonstrate that the damage occurred as a
result of shipping.
Please check the following components:
1. Spectrometer
2. Cables for power supply and USB connection
3. CD with software
4. Set of 5 mm, 10 mm, 20 mm and 30 mm cells
5. Tungsten lamp
TECHNICAL DATA
---------------------------------------------------------------------------------------------------------------NIR absorption spectroscopy is widely used for qualitative and quantitative analyses
in areas such as metallurgy, geology, machine manufacturing, petrochemical
industry, commodity inspection, medicine, environmental monitoring, food inspection,
agricultural chemistry and teaching in colleges and universities etc..
Characteristic features:
● Single beam wavelength scanning in a wavelength range of 900…1730 nm
● Spectral resolution: 3 nm (2 nm on request)
● Full Software controlled operation under Windows® (98SE, 2000, XP, Vista)
● Customization of operating software on request
● Synchronization with external devices by I/O signals
● Wide sample compartment for long path length cells of up to 10cm
● Various kinds of sample holder can be integrated
● Dynamic range of absorbance A = 0…~ 2
Specifications (900…1730 nm wavelength range):
Light Source
Detector
Wavelength range
Wavelength accuracy
Wavelength reproducibility
Spectral bandwidth
Minimal wavelength increment
Minimal sampling interval (kinetics)
Range of absorbance A
Photometric accuracy
Photometric reproducibility
Baseline flatness
Drift
Tungsten lamp
InGaAs – photodiode
900 nm…1730 nm
± 0,5 nm
≤ 0,3 nm
3 nm; others on request
~ 0,3 nm
0,5 s (other minimal time on request)
0…2
± 0,5 % T (T = transmission)
≤ 0,3 % T
A= ± 0,01
≤ 0,004 A / h
Noise
≤ 0,4 % T ; peak to peak
(@ 1350 nm after warm up)
(@1350 nm; duration of measurement: 3 min)
Ambient temperature
Humidity
Power supply
Dimensions, weight
Control
Special features
10…~ 35 °C
< 85 %
220 ± 10 % VAC, 50 Hz; < 50 W
487×388×185mm; < 20 kg
Windows software (98SE, 2000, XP or
Vista); Pentium3 processor or higher
recommended
Communication with further devices by
I/O signals or RS232 on request;
Adaptation of control software according
to customers needs
SAFETY RULES
------------------------------------------------------------------------------------The spectrometer has to be operated in accordance with the operating instructions.
Improper operation and handling can endanger the safety of persons and lead to
damage to the device.
The electrical safety of the power supply units, in particular against contact with
voltage and current-carrying, has to be guaranteed. Basically ensure that all plug
connections are securely fixed.
Installation
-----------------------------------------------------------------------------------The instrument should be installed in an environment that fulfils the following
requirements:
● Avoid a place that is exposed to direct sunlight or high temperature changes
● The instrument should be placed on a stable horizontal workbench. The back of
the instrument should be at least 15cm away from the wall to ensure effective
ventilation Avoid a place where mechanical vibrations occur.
● It is recommended to keep the device away from an environment generating strong
magnetic or electric fields or emitting high frequency electromagnetic waves.
● The spectrometer shouldn’t be installed in an environment with corrosive gases.
● Ensure that the ambient temperature is in a range of 10...35°C and humidity is kept
below 85 %.
Operation
----------------------------------------------------------------------------------------------------------------After turning on the power it is recommended to wait 15 minutes before starting a
measurement in order to ensure thermal equilibration of the tungsten lamp. However
the initialization can be performed immediately after switching on the spectrometer.
Software
The device is completely software controlled via an USB interface. This software
doesn’t claims to be sophisticated software for data manipulation and evaluation, but
main purpose is the recording of wavelength and time dependent spectra.
Besides recording measurements it contains some basic tools for data evaluation
like smoothing of curves and mathematical operations.
When starting the software the following screen appears:
Cursor values
Control buttons
Message and Information box
Control buttons
Khaki coloured display and message / information boxes on top:
The big khaki coloured field displays the spectrum of a wavelength scan or time scan
in real time.
The orange field above is a message and information box that indicates the status of
the device and displays also error messages or gives advices if ‘wrong’ values are
chosen by the operator, for instance a wavelength out of the wavelength range.
The white boxes ‘y_max: ….@.....’ and ‘y_min:….@....’ at left hand side of the
orange message box indicate the maximal and minimal value of a wavelength scan
at the corresponding wavelengths. If a time scan was performed they indicate the
minimal and maximal values at the corresponding times. The white boxes beside ‘x:’
and ‘y:’ indicated the values of the cursor. The cursor is the mouse. The cursor
function can be activated or deactivated by the menu Data / Cursor / OFF/ON.
Control buttons below of the screen:
The little red (or green) squares on left hand side below the khaki display (beside
‘Initialization’, ‘Goto Wavelength’ and ‘Scan/Collect Data’) are control buttons and
indicate the status of the respective processes (see below).
The red (or green) squares on right hand side of the display indicate the status of 3
I/O ports (0….5 VDC) that enable the synchronization of the spectrometer with
external devices (‘Digital In’ and ‘Sync out’). These options can be implemented into
the software according to the requirements of the customer. ‘Analogue out’ indicates
that an analogue output voltage (0…5 VDC, 10 bit resolution) is given to an external
device. This option can be implemented into the software as well. Digital I/O levels
and analogue output can be given to BNC connectors at the backside of the device.
These options are not activated in the standard software. If you need a
synchronization or communication with external devices please discuss your
requirements. Like this we can adapt software according to your needs.
The grey fields display the actual wavelength and the signal of a time scan or
wavelength scan in real time.
Input-fields and green buttons on left hand side:
Parameter and the start of a measurement are set by the input-fields and the green
buttons at the left hand side. The green buttons perform the initialization and start a
measurement: time-scan, wavelength-scan and measurement at fixed wavelength
can be performed.
Initialization:
After switching on the spectrometer the initialization has to be performed first,
otherwise it’s not possible start with measurements. It’s not necessary to wait until
the warm-up period (ca. 15 min recommended) is finished. The initialization can be
performed immediately after switching on the device.
If the initialization is successfully performed this is indicated by a little green square
below the display and also confirmed by ‘Initialization successful’, written into the
orange Message box on top.
Signal as T / OD / E:
By these radio buttons the kind of measurement is chosen:
‘Transmission’ measures the wavelength dependent light transmission of a sample in
%:
Transmission = I (sample) / I (reference)
I (sample) and I (reference) are the intensities of the light behind the sample and
reference, respectively.
‘Optical density’ is the logarithmic value of the absorbance of a sample:
Optical density = LOG( I(reference) / I (sample) ) = LOG(1 / Transmission)
‘Energy’ is simply the DC signal of the voltage with lowest level of amplification. This
DC voltage is given to the AD converter and it is in a range from 0…< 5000 mV. This
function is useful for testing and service purposes.
Goto Wavelength:
The wavelength has to be written into the Textbox. After clicking onto the ‘Go’ button
the monchromator drives to the chosen wavelength. The ‘Measure’ button enables
measurements of transmission, optical density or energy at the chosen wavelength.
When the chosen wavelength is reached this is also indicated by the little control
button that switches from red to green colour.
Time-Scan:
Measures the time dependences of transmission, optical density or energy versus
time. The number of data points and the dwell time can be chosen from the Comboboxes. If the number of data points is > 800 not all data points are displayed on the
screen, which can display 800 data points as a maximum. Of course all data points
are stored. The dwell time is the time between the data points.
The total duration of a time scan is displayed in the orange Text-box on top of the
screen. If transmission or optical density are measured the respective values of a
reference sample at begin of a time scan have to be measured. This reference
sample can also be the sample itself.
Wavelength-Scan:
Measures a spectrum in the wavelength range from ‘Start wavelength’ to ‘Stop
wavelength’. Minimal start wavelength is 900 nm and maximal stop wavelength is
1730 nm. Step size of a wavelength-scan and the dwell time have to be chosen from
the Combo-boxes. The dwell time is the time of data collection (i.e. integration time)
at a fixed wavelength point during the scan. There is additional time for instance of
renewal of the graphic screen. The dwell time during the reference scan is longer as
additionally the gain is optimized during the reference scan. Step size of the
wavelength scan is slightly lower than indicated by the values (0.3; 1; 3; 10 nm). This
depends on the lines per mm of the grating. When choosing ‘0.3 nm’ the exact step
size is 0.2896 nm and concerning ‘1 nm’, ‘3 nm’ and ‘10 nm’ it is 0.8688 nm, 2.896
nm and 8.688 nm respectively. The grey control field beside ‘Wavelength’ displays
the actual wavelength rounded to 0.1 nm. Of course the data are stored with the
exact wavelength values.
During a scan the signal corresponding to the wavelength is indicated in the grey
control field at the bottom.
On measurements of transmission or optical density a reference sample has to be
measured before measurement of the sample.
A measurement is started by the green button ‘Start Scan’.
If for further measurements the scan parameters (wavelength range, dwell time, step
size) stay the same it can be chosen whether a new measurement of a reference
sample shall be performed. This holds also if just the dwell time is changed for a new
measurement. When performing further operations (time scans for instance,
measurements at fixed wavelength) between wavelength scans it is recommended to
record a new reference scan even if the scan parameters of the wavelength scan
stayed the same. This holds also if there are longer time periods between
wavelength scans.
During a scan the little control button indicates by green colour when the signal is
collected by the detector.
The menus File and Data:
File / Open: Opens a file and displays it on the screen. The file has to be in ASCII
format and has to consist of three columns with data of ‘wavelength (or time)’ / ‘Raw
data’ / ‘corrected data’.
File / Save:
Saves data of a scan. These files are in ASCII format and consist of three columns
with data of ‘wavelength (or time)’ / ‘Raw data’ / ‘corrected data’. If there are no
corrected data this column is set to zero.
File / Save Screenshot:
Saves a picture of the screen in .png format.
File / Exit:
Finishes the program. If there are still data not being saved this is indicated by a
message box and the operator has to confirm to leave the program without saving
the data.
Data / Arithmetic / plus minus/multiply/divide:
Performs the respective operation with the actual data set. The new data set is
displayed and stored to an array. If there are further operations these operations
always hold for this new data set, which is changed by the new operation. The array
of the original raw data remains always stored to a separate array. This ensures that
the raw data of the original measurement are always maintained.
Smooth / Adjacent Average 3 (5) / Raw Data/Corrected/manipulated data:
Smoothes data by calculating the average value of a data point and the adjacent two
(‘adjacent average 3’) or four (‘adjacent average 5’) data points. The data point is
replaced by the average value of the 3 or 5 data points. This can be applied to raw
data and to corrected / manipulated data as well. If corrected/manipulated data are
smoothed they are overwritten by this new data set. If raw data are smoothed and
there is already a corrected/manipulated data set this data set is overwritten by the
new data set. The raw data are always maintained.
Differentiation / 1st derivative / raw data/Corrected/manipulated data:
Calculates the first derivative of the raw data or a data set that has been already
corrected or manipulated. If corrected/manipulated data are differentiated they are
overwritten by this new data set. If raw data are differentiated and there is already a
corrected/manipulated data set this data set is overwritten by the new data set. The
raw data are always maintained.
Differentiation / 4th derivative / raw data/Corrected/manipulated data:
Calculates the fourth derivative of the raw data or a data set that has been already
corrected or manipulated. If corrected/manipulated data are differentiated they are
overwritten by this new data set. If raw data are differentiated and there is already a
corrected/manipulated data set this data set is overwritten by the new data set. The
raw data are always maintained.
Scales / Linear/Logarithmic:
Calculates the linear or logarithmic (y=log(x)) values of a data set. If a linear data set
is displayed in logarithmic form it can be get back by choosing the linear display of
this data set or vice versa.
Raw data only:
Displays the original raw data on the screen without any additional data set of
corrected / manipulated values.
Grid / ON/OFF:
Switches the grid on and off.
Cursor / ON/OFF:
Switches the cursor on and off. The cursor is the mouse and the values of x
(wavelength or time) and y (optical density, transmission or energy) are displayed in
the white boxes on top of the screen.
Maintenance and trouble shooting
----------------------------------------------------------------------------------------------------------------The instrument will be guaranteed for one year from the date of arrival.
It’s not possible to generate a mistake in operation by using the software. If the user
should choose parameters that doesn’t fit or are out of range of the instrument this is
indicated by the orange message box and the spectrometer wouldn’t start.
However if the function of the spectrometer should be not normal it’s recommended
to perform a new initialization. If this doesn’t help the spectrometer should be
switched off and on after some seconds. It’s also recommended to unplug and plug
the USB cable connection and to restart the software. Afterwards a new initialization
has to be performed.
If the error message ‘Connection to Spectrometer lost’ is displayed in the orange
message box please check whether the instrument is switched on and the power
switch is illuminated. If this is o.k. the connection cable for the USB ports should be
disconnected and connected again after some seconds. Then an operation like ‘Goto
wavelength’, ‘Time scan’ or ‘wavelength scan’ should be performed. If the
spectrometer shouldn’t start the process and the orange control box steadily
indicates ‘Connection to Spectrometer lost’ the USB connection cable should be
checked or the spectrometer should be switched off and on again after some
seconds. It’s also recommended to restart the software. Afterwards a new
initialization has to be made.
If the procedures described above don’t help or often occur please report the
problems to Latronics GmbH. Don’t try to repair the device by yourself while the unit
is still under warranty. Also if the device is no longer under warranty it’s strongly
recommended to contact Latronics GmbH for problem solving and / or repair.
Replacement of the tungsten lamp
Tungsten lamps are articles of consumption and have a certain lifetime. If the
operating time has exceeded the normal operating period, the light emission stability
will deteriorate. Stability of the lamp can easily be checked by running a time scan by
measuring the transmission over time. When the stability of the light emission is out
of the specification or if the light emission becomes to low it should be considered to
change the lamp. The power of the light emission can be checked when checking the
‘energy’ at the wavelength of ca. 1340 nm. At this wavelength the energy should be >
3.000 mV. If it’s significantly lower the spectrometer would still work properly
(assumed that the stability of the light emission is sufficient !) but the required gain
will be higher leading to a slightly lower performance of the signal to noise ratio of a
spectrum. In fact the stability of the light emission is the more important issue
concerning the suitability of the lamp. The schematic diagram of the tungsten lamp
assembly is shown in the figure below. Change of the tungsten lamp works a follows:
● Switch off the power supply of the instrument. Pull out its plug.
● Remove the four screws located at both sides of the outer cover of the instrument,
afterwards remove the cover.
● Unscrew the screws 1 fixing the two legs of the lamp, then pull out the tungsten
lamp upwards.
● Wipe out a new lamp with alcohol and dry it for a minute.
● Plug in the new lamp and tighten the screws 1. Avoid to touch the new lamp
directly by hand. It’s recommended to touch it by clean handkerchief. If the lamps
legs are too long, they should be shortened.
● Switch on the instrument to light the tungsten lamp.
● Move the filter wheel in front of the entrance slit of the monochromator by hand
until the white light passes onto the entrance slit. Adjust the tungsten lamp up and
down or left and right in order to achieve a light spot on the slit as shown below in the
sketch. Don’t touch the lamp directly by hand as it’s extremely hot.
● After the position of the light spot has been well adjusted well, switch off the power
supply of the instrument, then recover the outer cover of the instrument. After the
replacement, switch on the instrument and start an initialization. If no error occurs,
the replacement is completed.
Schematic diagram of lamp and light spot on the entrance slit of the monochromator.
Waste disposal
This product doesn’t is to be disposed in normal garbage waste. If this spectrometer
is no longer employed and should be disposed, please refer to the service address
indicated in the scope of delivery.
System components
Spare parts and services (identification of the manufacturer):
Latronics GmbH
Hüttenstrasse 7
D-52068 Aachen
GERMANY
Email: [email protected]
Phone: +49 (0)241 - 8882 - 120
Fax: +49 (0)241 - 8882 – 121