1
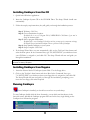
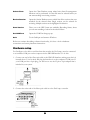
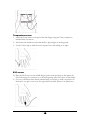
C A R D I O P RO T M , Ve r s i o n 2 . 0 Installation and User's Manual Thought Technology Ltd. 2001 2180 Belgrave Ave. Montreal, Que. Canada H4A 2L8 Phone 514-489-8251 • Fax 514-489-8255 www.thoughttechnology.com 1 0413 The Manufacturer: System Name: System #: Device Name: Device #: Classification: Rule(s) used for classification: Notified Body: Authorized Representative in EU Thought Technology Ltd. 2180 Belgrave Avenue Montreal, Quebec, Canada H4A 2L8 Cardiopro Biofeedback System T7600 ProComp+ SA7008P Class 1 with a Measuring Function Annex IX, rule 12 SEMKO (0413) Medical Equipment Services Ltd. Units 16-17 Canalside Business Park Cropwell Bishop Nottingham, England, NG12 3BE 2 CLASSIFICATION • Type BF Equipment • • Internally powered equipment Continuous operation • Read Instruction Manual CAUTION • WARNING • • • • • • • • US Federal Law restricts this device to sale by or on order of licensed health care practitioners. Do not operate an EKG sensor within 10 feet of an operating cellular phone, similar radio transmitting device, other powerful radio interference producing sources such as arc welders, radio thermal treatment equipment, x-ray machines or any other equipment that produces electrical sparks etc. Do not connect inputs or outputs of the encoder or sensors to line powered devices, except through the fiber optic cable. All ProComp+ encoders are totally isolated from line (110 or 220VAC) power due to battery operation and fiber optic connections to computers. However, many hospitals and the FDA require that computers, printers and any other equipment used with medical devices be electrically isolated from line voltage to UL or CSA medical safety standards. The PC used with the ProComp+ must be placed outside the client/client environment (more than 3 meters or 10 feet) or the PC must comply with EN60601-1.1 (system safety). After use, the Disposable Electrodes may be a potential biohazard. Handle, and when applicable, dispose of these materials in accordance with accepted medical practice and any applicable local, state and federal laws and regulations. Radiated radio frequency electromagnetic fields can cause performance degradation in the EKG sensor. In the worst case, an RF field strength of 22mV/M can cause a degradation of 1µV in the signal from the EKG sensor. Do not use in the presence of a flammable anesthetic mixture with air or with Oxygen or Nitrous Oxide. Not to be immersed in water. ATTENTION • To prevent static discharge from damaging the sensor and/or encoders, use anti-static mats or sprays in your working area. A humidifier may also be used to help prevent static environments by conditioning hot, dry air. • Not for Diagnostic Purposes, Not Defibrillator Proof. • To prevent voiding warranty by breaking connector pins, carefully align white guiding dot on sensor plug with slot on sensor input. • Sharp bends or winding the fiber optic cable in a loop smaller than 4 inches (10cm) may destroy the cable. • • • • • • A fiber optic cable not fully pushed into its receptacle may cause the unit not to operate; make sure that both ends of the cable are fully inserted into their receptive jacks and the nuts are tightened firmly. Make sure to remove electrodes from sensor snaps immediately after use. Apply conductive gel only to electrodes, never put gel directly on sensor snaps. Always use electrodes between the subject and the sensor. Do not plug third party sensors directly into instrument inputs. Plug only Thought Technology Active Sensor cable connectors into instrument inputs. All EKG electrodes and third party sensors must be connected to EKG sensors, either directly or through an adapter. Remove batteries when the device is not being used for extended period of time. Please dispose of battery following national regulations. 3 CONTRAINDICATIONS • Not for diagnostic purposes. INTENDED PURPOSE • Biofeedback, Relaxation & Muscle Re-Education purposes. (As per specific products) NOTE • • No preventative inspections required, qualified personnel must perform maintenance The supplier will make available, upon request, circuit diagrams, component parts lists and description or other information required for the repair of product by qualified personnel. Manual # SA7570-02 4 Table of Contents System Overview 6 Computer Hardware Requirements 6 Minimum Hardware configuration 6 Installing Cardiopro from the CD 7 Installing Cardiopro from floppies 7 Running Cardiopro 7 Quick Start tutorial pop-up 8 Main menu 8 Hardware setup 9 Connecting sensors 10 Sensor placement 10 EKG sensor: Respiration sensor: Temperature sensor: BVP sensor: Skin conductance sensor: COM port setup Selecting a client Adding a new client Deleting client files Recording sessions Overview 10 12 13 13 14 14 14 15 15 16 16 First time run: Checking the Key Code Main recording screen Recording screen buttons Status bar VCR-type buttons Sensor type indicators Heart rate variability (HRV) recording screen Function menu: Session Function menu: Display Function menu: Sound Function menu: Calculations Function menu: Help Time range selector Graph settings Scale settings Battery level indicator Respiration signal graph Heart rate/IBI graph EKG/BVP/Temp/SC signal graph Numeric displays SDRR bar graph RSA recording screen 16 17 17 18 18 18 19 19 20 21 22 23 23 24 24 24 25 25 26 26 27 27 Function menus 28 Display menu: Combined line graph 2D IBI power spectrum and bar graphs EKG/BVP/Temp/SC signal graph Respiration pacer 28 28 29 29 29 Pacer settings HR Max - HR Min display Miscellaneous computations Respiration sensitivity 3D spectrum recording screen 30 31 31 32 32 3D power spectrum of IBI 33 Heart rate bar graph 33 Biofeedback 34 Stop recording 35 Reviewing and replaying sessions 36 Review session 36 Exporting data Playing a session Scanning a session 37 38 38 Heart rate signal Scanning mode buttons 3DS reviewing screen IBI editor screen 39 39 39 40 Editor function buttons IBI tachogram EKG/BVP signal review graph Table of statistics Export IBI function IBI editor table Editing IBI data 41 41 41 42 42 43 43 ADDING SPLITTING AVERAGE Printing statistics Description of statistics Closing Cardiopro Reference 44 46 47 48 49 50 51 Technical support and order placing Returning equipment Product numbers & accessories Placing Orders Specifications Index 51 51 52 52 53 54 5 1 Chapter System Overview Cardiopro is a specialized biofeedback software program that focuses on the physiology of the cardiovascular and respiratory systems. It can take input from an electrocardiography (EKG) or a blood volume pulse (BVP) sensor to calculate inter-beat intervals. It can also monitor one or two respiration sensors as well as temperature and skin conductance (SC). A simple graphic interface easily leads the user through the various steps of recording, reviewing and analyzing data. While recording, the user can switch between three different monitoring screens, each designed for a specific application. When a session has been recorded, the user can play it back, as it was recorded or scroll through the whole session, using a cursor. A 3D waterfall spectral display can also be used for reviewing recorded data. Cardiopro provides both auditory and visual biofeedback for any one of three physiological changes. The auditory feedback is provided by proportional or inverse-proportional MIDI tones. Data reviewing, editing, analyzing, printing and exporting functions are provided in the review screens. Computer Hardware Requirements The Cardiopro software is a 32-bit application for the Windows ’98, 2000 & XP operating systems running on IBM-compatible personal computers. As the software makes intensive use of a CPU's computational power, we recommend running it on a high-end computer system with screen settings of 800 by 600 pixels screen area and High Color (16 bit) resolution. A sound card is also required for audio feedback. Minimum Hardware configuration Pentium II 350 MHz or higher 1 free COM Port Minimum 64 megabytes of RAM (memory) Super VGA graphic card 1 2.5 Gig hard drive (minimum) 16 bit Sound card (Creative Labs, Sound Blaster) CD ROM 1- Note: Some Cirrus Logic graphic cards may display colors differently from other cards. 6 Installing Cardiopro from the CD 1. Quit all other Windows applications. 2. Insert the Cardiopro System CD in the CD ROM Drive. The Setup Wizard should start automatically. 3. Follow the step-by-step instructions, they will guide you through the installation process: Step 1: Welcome. Click Next. Step 2: Choose Destination Location. By default, this is set to C:\Program Files\CARDIOPRO2. Click Browse if you need to change the destination folder. Step 3: Select a program folder name. By default, this is set to Cardiopro2. Should you wish to, you may type in a new name to change this default. Please do not install Cardiopro 2.0 over a previous version of Cardiopro. Step 4: Setup Installs Cardiopro on your system. Step 5: Setup Complete. Click Finish. 4. If the Setup Wizard does not start automatically, click on the Task bar’s Start button and select the Run option. In the Command Line, type "D:\SETUP.EXE" (use whichever letter your CD-Drive is assigned to) and click OK. The Setup Wizard will start and guide you through the installation. Note: If you are using Windows XP, make sure to set your monitor or LCD screen’s resolution to a minimum of 1024 by 768 pixels. Installing Cardiopro from floppies 1. Insert the diskette labeled "Cardiopro System Disk 1" in the floppy drive. 2. Click on the Task bar’s Start button and select Run. In the Command Line, type "A:\SETUP.EXE" (use whichever letter your floppy drive is assigned to) and click OK. The Setup Wizard will start and guide you through the installation, prompting you to insert the next floppy disk when required. Running Cardiopro Once Cardiopro is installed, you should see a new Icon on your desktop. To start Cardiopro, double-click the Icon. Alternately, you can click your Start button, in the lower left corner, and find the Cardiopro program file icons. In this case, single clicking on the Cardiopro icon will start the program: 7 Quick Start tutorial pop-up When Cardiopro starts, it asks you if you’d like to run the Quick Start tutorial. The tutorial rapidly describes the sequence to follow in order to start a session. For the moment, since you are reading the Manual and all these steps are covered in this document, we suggest you click “No”. If you prefer never to be asked again, you can click in the “Do not show this window again” check box. If you do and eventually change your mind about not wanting to run the Tutorial, you can always start it from the Quick Start icon available in the Cardiopro Program File icons. Main menu The Main menu is the central hub of the Cardiopro software. From this menu, you can access the primary functions by clicking on one of the gray buttons: A detailed description of these will follow, but here’s a brief overview: 8 Select Client: Opens the Client Database screen where basic client file management functions can be performed. A Client file must be selected before you can start recording or reviewing a session. Review Session: Opens the Session Database screen, which lists all the sessions that were recorded for the selected client. Single sessions can be selected for reviewing. Multiple sessions can be highlighted for deletion. Start Session: Takes you to the HRV (heart rate variability) Recording Screen, where you can start recording a session for the selected client. Set COM Port: Opens the COM Port Setup pop-up. Quit: To exit Cardiopro and return to Windows. Before we continue describing software functionality, let’s have a look at hardware connections and sensor placement instructions. Hardware setup For Cardiopro to be able to read data from the encoder, the ProComp+ must be connected to an available COM port on the computer via the PRO-SB Interface. To do this: 1. Connect one end of the fiber-optic cable to the PRO-SB Interface, making sure that it is inserted about 3/4 of an inch, and plug the Interface in to the computer's COM port. If your COM port has a 9-pin plug, you will have to use the 25-pin to 9-pin adapter that is included in your system. 2. Connect the other end of the fiber-optic cable in to the ProComp+ encoder: 9 3. Ensure that you have fresh batteries in the encoder and that they are inserted correctly. 4. If this is the first time you run Cardiopro, check the DIP switch settings inside the encoder's battery compartment. Although these are set to run with your software at the manufacture, verify that they are set as follows: 5. Connect the desired sensors in their assigned inputs. The sensor/input correspondence is described in the next section. Connecting sensors The next thing to do is to connect the various sensors to the proper encoder inputs. Cardiopro 2.0 will expect to find the following sensors/input configuration: A - EKG B - BVP C - Abdominal Respiration (Resp 1) D - Thoracic Respiration (Resp 2) E - Temperature F – Skin Conductance Note: The BVP sensor input assignment is different, in version 2.0, from what it was in version 1.0. For this reason, the BVP data is not available for review when opening old session data files from within version 2.0. When the software is running, you can find out about the correct encoder input by placing the mouse cursor over the sensor type indicators in the upper right corner of the screen. A short help message pops up; describing which Encoder Input the particular sensor should be connected to: Sensor placement EKG sensor: The EKG sensor requires the use of an extender cable and three Thought Technology UniGel electrodes. 10 1. Connect the extender cable to the EKG sensor as shown below: 2. Snap a Uni-Gel electrode to each lead of the extender cable. 3. There are two methods for placing EKG electrodes on your client: A chest placement, which provides the best signal quality, and a forearm placement, which is easiest and least invasive. For the chest placement, place the yellow lead on the right shoulder, the blue lead at the xyphoid process and the black one on the left shoulder. When using a forearm placement, the yellow lead goes on the right arm and the other two, on the left arm. These electrode placements are shown on the following illustration. Placing the electrodes as above ensures that the QRS complex is "right side up". This means that the R spike is positive (up, rather than down) and the following S spike, negative: 4. If the positive and negative electrodes are inverted, the polarity of the R and S spikes is reversed. When this occurs, Cardiopro will sometimes warn you about this and ask you to check the electrode placement: 11 5. If the signal is weak or very noisy, Cardiopro may also warn you that the R spike is not high enough to be detected: 6. The R spike is maximized when the positive and negative electrodes are on the heart's longitudinal axis. Depending on the client's anatomical idiosyncrasies, you may have to adjust the position of the positive and negative electrodes slightly to the left and observe the changes in the EKG signal's R spike. 7. If the message keeps popping up in spite of these adjustments then the problem may be due to a bad contact between the client's skin and the electrodes. This can be due to dry skin or too much body hair. Placing a little drop of liquid electrode gel on the center of each electrode before affixing it to the client may help improve the contact. Alternately, you may try to move the electrodes to hairless areas of the skin and wipe the client's skin with an alcohol pad. After a few trials, moving the pre-gelled electrodes around may render them less sensitive. Once you have identified more suitable placement sites, you may want to use a new set of pre-gelled electrodes. Respiration sensor: 1. For an abdominal placement, strap the respiration sensor's Velcro fastener around the client, at the belly-button level, as shown below. 2. Make sure that the rubber tube is placed on the front. 3. Adjust the strap so there is a slight tension when the client has fully breathed out. 4. If you are using a second respiration sensor for thoracic breathing, place it as described above, but wrap it around the subject just below the armpit level. 12 Temperature sensor: 1. Attach the Temp sensor to the pad of the little finger, using the Velcro strap that is included with your sensor. 2. Ensure that the thermistor end (white knob) is placed right on the finger pad. 3. Use the Velcro strap to hold the sensor in place but avoid making it too tight. BVP sensor: 1) Place the BVP sensor on the middle finger’s pad so both openings are flat against the skin. If the finger is too narrow to cover both openings, place the sensor on the thumb. 2) Use one of the black elastic bands, included with your sensor, to hold it in position. If the band is too tight or too loose, the signal will look small. Adjust to an optimal size. 13 Skin conductance sensor: 1) Strap each electrode of the SC sensor around the finger pads of the index and annular fingers. Ensure that the electrodes are on the palm side of the finger, not on the nail. COM port setup Now that the encoder is connected and the sensors are placed on the client, we can return to the software. The next thing to do is to tell Cardiopro where the PRO-SB Interface device is connected. Do this by clicking on the proper COM Port number (to place a check mark in the box labeled 1, 2, 3 or 4) in the Communication Port Selection box and clicking OK: Selecting a client Before you can start recording or reviewing data in Cardiopro, the software expects you to select and open a client file. To do this, click on the Main Menu's Select Client button, highlight the desired client's name and click OK. Alternately, you can simply double-click on the client's name: 14 The first time you run Cardiopro, the client list will only have "John Goodheart", this Client file contains sample data. If you want to create a new client file in the database, click on Add New Client to open the Client Data pop-up. Adding a new client The Client Data pop-up lets you type in client identification information. The most important fields are Last and First Name since these are used for sorting client files. Cardiopro automatically generates an ID Number for new clients. Clicking Edit Client Data opens the pop-up again so you can make modifications to the information. Click OK to accept changes or Cancel to exit without saving. Deleting client files When a client name is selected and you click the Delete Client button, Cardiopro asks you to confirm your choice: Be aware that deleting a client file will also delete all the sessions that it may contain. 15 2 Chapter Recording sessions Overview When a client file is selected and the Start Session button is clicked, Cardiopro goes into Record mode. In this mode, you can Start, Pause or Stop sessions and switch between three display screens to view the data being recorded from. Display and feedback options can be adjusted then. At the end of a session, Cardiopro asks if the session data should be saved to the selected client file and whether another session should be started. If not, you are returned to the Main Menu screen where you can perform other activities. First time run: Checking the Key Code When Cardiopro starts recording a session, it automatically reads the ID number of the connected ProComp+ and verifies if a Key Code has been entered for that encoder. The Key Code is provided to you when you purchase the system. It should appear either on your encoder or on the CD case. If this is the first time that you are recording a session, you will be asked to type your Key Code in. Simply type the number in and press Enter or click OK: The next time you start recording a session, Cardiopro remembers your Key Code and goes straight to the recording mode unless you have connected a different ProComp+ Encoder or this is a different installation of Cardiopro. 16 If you see a warning about "No valid data", then there might be something wrong with your hardware connection. Verify that you have connected everything properly and that the ProComp+ encoder is on. If you want to use another encoder with your Cardiopro software, simply type in the Key Code for the new encoder when prompted. Cardiopro only remembers the latest encoder's Key Code. Main recording screen The main recording screen is called HRV (heart rate variability). Recording always starts in this screen. From this screen, it is possible to switch to the other recording screens by clicking on a button in the button bar. In the main recording screen, it is also possible to configure the various display and feedback options. Since each recording screen offer a different selection of controls and menu options, we will describe each screen’s interface separately in the following sections. The sensor-type indicators, though, are common to all recording screens. Recording screen buttons In the upper left corner of all recording screens, you will see the Recording Screen Buttons. To switch between screens when recording a session, simply click on one of the other two buttons. The Recording screens are: HRV screen: This is the main recording screen. It displays line graphs of the raw EKG signal, along with the abdominal respiration and heart rate traces. Its main feature is a bar graph of the standard deviation of the R to R interval, which is used to set the feedback options for SDRR. RSA screen: The RSA recording screen has a respiration pacer and one combined graph displaying the heart rate signal, along with both respiration traces. On this screen you will also find a 2D Spectrum graph of the HRV frequency components and a bar graph displaying the real-time peak-to-trough heart rate changes from breath to breath (HRMax-HRMin). Feedback options for that factor are set on that graph. 3DS screen: The third recording screen shows a 3D Spectrum graph of the HRV frequency components. 17 Status bar The Status bar is just below the Recording Screen buttons. It displays the loaded client’s name, the client ID number, the session date, time and duration, when appropriate: VCR-type buttons The VCR-type control buttons are found right next to the Record Screen buttons. They are Go, Stop, Pause and Freeze: Go: Starts recording data and counting session time. Stop: Ends a session. When a session is stopped, Cardiopro asks if you want to save the data to the selected client’s file. Pause: Interrupts recording without ending the session. Note that Pausing a session disturbs the time continuation of the inter beat interval (IBI) sequence, which causes artifacts in the HRV analysis. The Pause function should only be used during feedback sessions. Freeze: Pauses the display but not the recording. When the Freeze function is activated, Cardiopro stops updating the screen display but keeps acquiring data in the background. Freeze does not disturb the time continuation of the IBI sequence. Sensor type indicators In the upper right corner of all the recording screens, you will see a row of green or gray buttonlike indicators. When a sensor is connected to an assigned input on the ProComp+ encoder (AF), the corresponding indicator lights up in green. If there is no sensor connected to one of those inputs, the indicator turns gray. 18 Please observe that disconnecting a sensor also disables all the graph controls that show raw or processed data from that sensor. When the RESP1 sensor is disconnected, for instance, the top line graph in the HRV screen turns gray. Note: It is important to keep in mind that, although the software is able to detect whether a sensor is connected to an assigned input or not, it is not able to determine if it is the right sensor that is connected. Heart rate variability (HRV) recording screen The HRV recording screen appears as shown below. The following is a brief description of each of its components. Function menu: Session Main Panel: Returns to the Main Screen. Exit: Closes Cardiopro and returns to Windows. 19 Function menu: Display Background color: Switch between Light and Dark color for the background on all graphs. Show EKG…: Allows you to switch between the raw signals for EKG, BVP, temperature or skin conductance signal to be shown in the lowest line graph displays of both the HRV and RSA recording screens. Show HR/IBI: Allows toggling between showing the Heart Rate or IBI signal in the HR graph. HR/IBI Filtering: Allows toggling between a smoothed or raw Heart Rate or IBI signals for the line graphs in both the HRV and RSA screens. 20 Review Mode: This menu option is disabled in the recording mode because it is a reviewing function. Function menu: Sound Feedback: Turns MIDI tone feedback sound ON or OFF. Signal Type: Allows you to select what signal you want sound feedback for. Cardiopro offers auditory feedback for four physiological factors: SDRR: Standard deviation on the R to R intervals. Note: The literature uses the terms "Inter-Beat Interval" (IBI) and "R to R interval" (RR) interchangeably. When referring to the standard deviation calculated on normalized (edited for artifact) IBI data, SDRR becomes SDNN. HR Max - HR Min: Difference between maximum and minimum heart rate at each respiration cycle. Thoracic/Abdominal ratio: Ratio between thoracic and abdominal breathing amplitude at each respiration cycle. Heart Rate: Beat-to-beat heart rate from the EKG or BVP signal. 21 Direction: Select to have the tone Proportional (pitch increases when signal value increases) or Inverse Proportional (pitch decreases when signal value increases). Threshold: Select to trigger audio feedback when the signal is above or below the threshold. Function menu: Calculations HRMax-HRMin: Selects the calculation algorithm for the real-time peak-to-trough heart rate changes computation. In the Absolute Units mode, the calculation takes the maximum and minimum value of heart rate during a breath cycle and computes the difference at each new in-breath. In the Percentage of Mean HR mode, the computation is expressed as a percentage of the mean heart rate. Temperature Scale: Selects the unit for the temperature readings, in Celsius or Fahrenheit. 22 Heart Rate from: Selects the sensor type from which the real-time IBI and HR computation is done. By default, this is set to EKG because the published research data on HRV indicates that IBI computations performed from the BVP signal are much less precise than those done from the EKG signal. This means that, although using BVP as a source is adequate for feedback purposes, any session recorded for generating reports or acquiring research data should be performed using the EKG sensor. This option must be set prior to starting a session. Spectrum Window: Selects the size of the time window that will be used for all the real-time HRV spectrum computations. The published research on HRV indicates that a 5-minute window is a standard for research and case documentation. The 1-minute time window option is provided for feedback purposes only. The time window option must be set prior to starting a session. The 5-minute window is the default option. Function menu: Help Contents: Opens the on-line Help document. About: Get version information about this software. Time range selector This control is used to adjust the signal sweep time across the line graphs. When clicking the time range selector, a drop-down list of time scale values appears. You can change the time axis scale by selecting the desired value. 23 Graph settings The graph settings pop-up can be opened from the graph icon on the upper left side of some of the graphs. The respiration graph settings are shown below: From the respiration graph settings pop-up, you can define the minimum and maximum vertical scale value (Y-axis), as well as the high and low threshold values. On the SDRR and HRMaxHRMin bar graphs, the threshold settings also control when audio feedback is heard (depending on the setting of the above/below option in the Sound menu). Click OK to accept your settings or Cancel to exit without making changes. Note: Some graphs may not have a graph Settings pop-up because they offer no audio feedback. Others may have only one threshold setting instead of two. Settings depend on the feedback functionality of the graph. Scale settings The maximum and minimum scale values can also be adjusted "on the fly" by using the high (HI) and low (LO) scroll bars on the side: Battery level indicator Shows how much “life” is left in the encoder's battery. Between 100 and 75, the indicator is green. Between 75 and 50, it is yellow (buy new batteries). Below 50, the indicator turns red (change batteries). 24 Note: When the batteries are extremely weak, the data sent by the ProComp+ Encoder through the fiber-optic cable may be unreliable and erratic. This can confuse Cardiopro into indicating a green level even though it is well below 50%. Respiration signal graph This graph displays the raw abdominal respiration waveform from Input C. Adjust the high and low scale values and the upper and lower thresholds from the graph or the Scale settings. Adjust the time scale with the Time Range selector. Heart rate/IBI graph This graph can display either the heart rate or the IBI trace as calculated from the EKG or BVP signal, depending on your choice of settings in the menu options. To toggle between HR and IBI, use the Display menu's “Show HR/IBI option”. To toggle between EKG and BVP sensor, use the Calculation menu’s “Heart rate from” option. The graph can plot a smoothed or square edged graph line. To toggle the filter option on and off, use the HR/IBI filtering option in the Display menu. 25 EKG/BVP/Temp/SC signal graph This graph displays the raw signal from the EKG, BVP, temperature or skin conductance sensors. What is shown in this graph depends on the setting in the Display menu. Only one signal type can be displayed at a time but this option can be changed on the fly while recording. You can use this graph to evaluate the quality of a raw signal’s waveform and optimize your sensor placement. Numeric displays Temperature: If a temperature sensor is connected, this numeric display shows the temperature read from the sensor. The display can show degrees Celsius or Fahrenheit. Change the unit scale from the Temperature Scale option in the Calculations menu. When a threshold is set in the graph Settings, the frame around the numeric display turns red when the signal is above the threshold value and blue when below. IBI: This numeric display shows the Inter Beat Interval at each beat. Heart Rate: This numeric display shows the heart rate at each beat. This value is also shown in the middle line graph. HR Max - HR Min: This numeric display shows the difference between the highest and the lowest heart rate value at each breath in absolute or relative units. This value is also shown on a bar graph display on the RSA screen, where audio feedback can be set up. Respiration Rate: This numeric display shows the respiration rate at each breath. Sensitivity: Normally set to Fast, this setting allows you to decrease the sensitivity of the respiration cycle detection algorithm of the software. When the client is breathing slowly, the respiration signal can be a bit “bumpy” on the expiration. When this occurs, Cardiopro may make mistakes in the respiration rate calculation. In this case, switch the sensitivity to Slow. 26 SDRR bar graph Shows the Standard Deviation on the R to R interval (that is the non-normalized IBI) in real time. Since this variable requires 5 minutes of data to be calculated, the bar graph is inactive for the first 300 seconds of a session. An audio feedback tone is available for SDRR; enable it from the Signal Type option in the Sound menu: RSA recording screen The RSA Recording screen appears as below. 27 Function menus Most of the Function Menu options in this screen are similar to the ones in the HRV screen. The difference is: Display menu: Respiration Pacer: This option allows users to switch between three options for the respiration pacer. Hide Pacer completely removes the pacer from the screen. Show IN/OUT Pacer displays the pacer as an IN and OUT prompt only, without any indication of hold phases or phase duration. The Show Pacer option displays the full pacer with the IN, OUT, Hold and progress indication. Combined line graph This graph shows 2 respiration traces in light and dark blue, along with the Heart Rate signal in red. Use the red and blue Scale Setting controls, on the left, to adjust the amplitude of each signal on the graph. Because both respiration traces share the same scale, they are adjusted with the same scale settings. You can shift the thoracic respiration signal up or down by using the Resp2 Offset control on the right side of the graph: Note: You can also adjust the relative distance between both respiration signals by increasing or decreasing the tightness of the sensor strap around the client's chest. 28 2D IBI power spectrum and bar graphs These displays show some real-time frequency-domain computations on the IBI. The 2D FFT graph is a frequency spectrum display of the various components of HRV. It shows the very low frequency (VLF: 0.0033 - 0.04Hz) in blue, the low frequency (LF: 0.04 - 0.15Hz) in green and the high frequency (HF: 0.15 - 0.40Hz) in magenta. The three bar graphs on the right show the current power for each of those bands. The VLF graph is expressed in absolute units, while the LF and HF graphs are in normalized units. Cardiopro can calculate real-time frequency-domain computations using a 1- or 5-minute sliding window. The size of the time window is set in the Calculations menu’s “Spectrum Window 1/5 min” option. At the beginning of a session, the graph will be disabled (inactive) for the duration of the time window. Note: The lowest frequency that is displayed on the spectrum graph depends on the selected time window. The lowest frequency in VLF is 0.0033 Hz. It requires at least 5 minutes of IBI data to be computed. With the 1-minute time window, Cardiopro will display VLF only partially. EKG/BVP/Temp/SC signal graph The bottom graph is a multi-signal line graph similar to the one shown on the HRV screen. Cardiopro will show the same signal on both graphs. Respiration pacer In the upper right corner of the screen, you will see the respiration pacer. This device is designed to lead a person through controlled breathing exercises. The Respiration pacer has four modes: Breathe in, hold in, breathe out and hold out. The in breath is shown by an ascending pink dot. Descending blue dots indicate the out breath. A Yellow dot and a textual prompt are shown during each hold phases. 29 The duration for each component of the respiration cycle is defined with the Pacer settings. The settings can be revealed by clicking on the PCR button, in the button bar: Pacer settings In order to program the respiration Pacer, the first step is to define the number of respirations per minute. This is done by clicking on the little black arrows (spinner controls) just under the Breaths/minute label. The duration for each breathing cycle is automatically adjusted below: Breaths/minute: Use the up and down arrows to increase or decrease the number of respiration cycles per minute. Cycle Duration: Displays the resulting time (in seconds) for each breath. The next thing to set is the respective durations for breathing in, holding in, breathing out and holding out. This is done with spinner controls too. The breathing out time is automatically calculated from the three other values: Hold In: Use the arrows to adjust the desired amount of time to hold the breath after breathing in. Hold Out: Use the arrows to adjust the desired amount of time to hold the breath after breathing out. In: Use the arrows to adjust the desired amount of time for breathing in. Out: Displays the amount of time left for breathing out. This number adjusts itself according to the other settings. 30 As changes are made, the resulting breathing cycle is shown on a line graph: HR Max - HR Min display This bar graph display shows the difference between the highest and the lowest heart rate value at each breath in absolute or relative units. Change the unit type from the HR Max – HR Min option in the Calculations menu. It is possible to set an audio feedback cue to help train for maximizing the HR Max - HR Min value. This is setup from the Sound Menu. This value is also shown on a numeric display on the HRV screen. Miscellaneous computations Phase: Phase is a measure of how “together” the respiration and heart rate signals change. During normal RSA, the heart rate will tend to increase with the in breath and decrease with the out breath. Occasionally, the heart rate will either anticipate or lag behind the respiration trace. Phase is positive when HR anticipates Resp1 and negative when it lags behind. Peak Frequency: This control displays the frequency at which the maximum power occurs. BVP Amplitude: The BVP signal is a relative measure (it has no standard unit). This control will display the relative amplitude of the BVP signal at each pulsation. This number is a relative measure of peripheral vasodilation and constriction. 31 Respiration sensitivity This control is similar to the one on the HRV screen. Normally set to Fast, this setting allows you to decrease the sensitivity of the respiration cycle detection algorithm of the software. When the client is breathing slowly, the respiration signal can be a bit “bumpy” on the expiration. When this occurs, Cardiopro may make mistakes in the respiration rate calculation. In this case, switch the sensitivity to Slow. 3D spectrum recording screen The 3DS Recording screen appears as shown below. The Screen's main component is the 3D spectral waterfall graph. A bar graph of the heart rate is also shown on the right, as well as the respiration pacer. No new menu options are found on this screen. 32 3D power spectrum of IBI This graph displays the FFT power spectrum of the Inter Beat Intervals (IBI) on a 3D "waterfall" type graph that shows changes over time. Depending on the Spectrum Window setting in the Calculations menu, the display will take 1 or 5 minutes to activate. In the 1-minute time window, the graph does not cover the lower frequencies. You can adjust the high and low scale values from the Scale Settings cursor on the left. You can also adjust the graph's perspective angle by clicking, holding and dragging the mouse cursor over the graph area. To adjust its horizontal and vertical position on the screen (pan), press and hold the [Shift] key while dragging. To zoom in or out, use the [Ctrl] key. When you have defined a view angle that suits your needs, click the Save New Settings button. If you get confused and lose sight of the graph, click Restore Default Settings to bring it back in the original position. NOTE: The 3D Waterfall display is very demanding on your computer's processing capabilities. This is particularly true when the spectrum curve shows many peaks and the vertical scale is low or the graph is out of scale. A high number of peaks increases the number of surfaces to be calculated and the computer is slowed down. The effects of this can be seen on the Session Duration indicator and the Respiration Pacer. Since both of these displays are updated in real-time, they will skip steps and loose their regularity in order to keep the synchronization. When this occurs during a feedback session and is found disturbing, you can either switch to the HRV Recording screen and work with the 2D graph, which is less demanding, or modify the Respiration Pacer's display mode to show IN/OUT only or Hide Pacer. Heart rate bar graph This Bar graph displays the Heart Rate as calculated from the EKG signal. You can adjust the high and low scale values from the Scale Settings. 33 Biofeedback The Cardiopro software offers auditory feedback on four distinct physiological factors: SDRR, HR Max - HR Min, thoracic/abdominal ratio and heart rate: SDRR: This is the standard deviation on the R to R intervals. Since high SDRR values indicate higher variability in heart rate, biofeedback training on SDRR usually involves trying to increase SDRR. To set this up, select the following sound options: Feedback: Signal Type: Direction: Threshold: Sound On SDRR Proportional Above With the above settings, the goal of SDRR biofeedback is to try to increase the tone. Use the threshold value as a specific target to reach. HR Max - HR Min: This is the difference between the maximum and minimum heart rate at each respiration. This value indicates the amplitude of respiratory sinus arrhythmia. Training for RSA involves trying to maximize this value. Set the Sound options as follows: Feedback: Signal Type: Direction: Threshold: Sound On HR Max - HR Min Proportional Above With the above settings, the goal of HR Max - HR Min biofeedback is to try to increase the tone. Use the threshold value as a specific target to reach. Thoracic/ Abdominal ratio: This feedback setting calculates the ratio between thoracic and abdominal breathing amplitude at each respiration. Since many breathing exercises involve trying to breathe from the abdomen rather than from the rib cage, the goal of the thoracic/abdominal ratio feedback is to get the ratio value to decrease. The Sound options for this training are: Feedback: Signal Type: Direction: Sound On Thoracic/Abdominal Ratio Inverse Proportional With the above settings, the training goal is to try to increase the tone. Since there is no threshold setting for this mode, the feedback sound 34 cannot be threshold dependant. The high and low thresholds on the HRV recording screen's respiration graph are designed to provide visual guidelines only. All of these feedback settings involve trying to increase the pitch of the feedback sound. Some clients will find an increasing tone a little stressful. If this occurs, you can reverse the feedback direction (ex. proportional to Inverse-proportional) and have them train to lower the tone. If you are going to train a client using more than one of the feedback modes, keep in mind that it is better to keep the same goal throughout (i.e. always increase or always decrease the tone). Varying the goal can be confusing to the client and result in training for the wrong physiological change. Stop recording When you click the Stop button, Cardiopro asks you if you want to save the recorded data: If you click Yes, the session data is saved in the selected client's file. If you click No, the data is lost. There is no way to retrieve it later. After saving the session data, Cardiopro asks if you want to record another session for this client: Clicking Yes clears the memory and resets the screen so you can start recording another session. No takes you back to the Main Menu screen where you can either select another client file for recording sessions or select to review previously recorded data. 35 3 Chapter Reviewing and replaying sessions Review session From the Main Menu, select a client file and click Review Session. This opens the Session Database box for you to select a session to review. Sessions are sorted by date and time. The session date, time, duration are shown on the list, along with the signal types that were recorded during the session: Click once on the desired session to highlight it. Note that a check mark appears in front of the selected session. Although you can place check marks in front of more than one session, Cardiopro will ask you to select only one for reviewing. From this pop-up, you can delete more than one session at a time by placing a check mark in front of all the sessions to delete and clicking the Delete button. Cardiopro asks you to confirm your choice before actually deleting the data: 36 Exporting data Cardiopro allows you to export the raw sensor data to text files for importation into other software. To do this, click on the Export button at the bottom of the session database popup. When you do this, the Export Raw Data dialog box appears: Select one or more signal types by clicking on them and then click Export to start. Cardiopro will confirm that you want to export the data from the selected signal types: When you click Yes, you are given an opportunity to enter a file name and a path in order to export the data to a selected folder. Click OK to continue. Exporting data can take a few minutes, if the session is very long. When the export is completed, Cardiopro lets you know with a popup message: 37 Playing a session To review a session, select it and click Review. Reviewing can be done in two modes: Playing and scanning. This is defined in the Review Mode option in the Display menu. In the playing mode, the session data is played back as it was recorded. In scanning mode, you can scroll through the session by dragging a cursor along a scroll bar. In the playing mode, you can switch between the HRV and RSA screens while replaying. The 3DS screen is only accessible in the scanning mode. To control the playback of a session, use the VCR-type control buttons. Scanning a session To switch to the Scanning mode, use the Review Mode option in the Display Menu. It can take Cardiopro a few moments to switch to the scanning mode because it has to process the whole session at once. To scan through the session, click and hold the cursor in the scroll bar at the bottom of the screen, while dragging to the right or to the left. This allows you to quickly find significant portions of the saved session for documentation purposes or post-session client feedback. 38 Heart rate signal In real-time recording or in replaying, the software has to wait for a beat to occur in order to calculate the heart rate for that beat and then display it. The actual value being shown at any one time is the rate from the previous beat. This creates an unavoidable one-beat offset in the signal. In the scanning mode, though, the heart rate values are shown synchronized with the respiration signal. The graph below illustrates this. The dotted line shows the shift to the left that occurs when reviewing data in the scanning mode. Scanning mode buttons In the scanning mode, you can access the three display screens: HRV, RSA and 3DS. One more screen button is shown in the button bar, the IBI Editor screen: We will discuss the purpose of this screen shortly. First, let’s discuss the 3DS Reviewing screen. 3DS reviewing screen On this screen, the main difference between record and replay mode is that the 3D Waterfall display is shown with a 60 second time axis: Use the History buttons to flip through the session data. 39 Just like in real-time recording, you can rotate the graph around by clicking and holding the left mouse button over the 3D plotting area and dragging the mouse around; You can zoom in and out or pan across the image if you press and hold the [Ctrl] or [Shift] Key, respectively, while dragging around. Use the "Save new settings" and "Restore default settings" buttons to define your preferred graph configuration. You can also adjust the high and low scale values from the Scale Settings. This movement should be done slowly so not to lose control of the graphic. IBI editor screen The IBI Editor screen appears as shown below. The published data on HRV analysis defines that the standard calculations for HRV statistical analysis must be performed on data that has been “normalized” to have any clinical validity. This screen is used to review and edit the IBI data, in order to remove artifact and normalize it. From this screen, you can also generate and print statistical reports and export the resulting tables of IBI data for analysis in third-party software. The screen shows the IBI data in 5-minute epochs on a tachogram plot, along with a line graph of the raw EKG or BVP signal. What raw signal is shown here depends on which signal was used to compute the heart rate when the session was recorded. Note: The published research data on HRV analysis indicates that HR/IBI computations performed from the BVP signal are much less precise than those done from the EKG signal. This means that, although using BVP as a source is adequate for feedback purposes, any session recorded for generating reports or acquiring research data should be performed using the EKG sensor. The table at the bottom displays the various statistical calculations when they have been generated: 40 Editor function buttons Edit: Opens the IBI Editor table. Statistics: Calculates the statistics for all 5-minute epochs of the session. These are shown in the Table of statistics. Export: Generates a series of sequentially numbered text files containing the IBI values for all 5-minute epochs of the session. Exported data files are saved in the "\Export" folder under the main Cardiopro folder. Build IBI Table: Regenerates the table of IBI values from the raw EKG data. Note 1: Use the Build button with caution! Keep in mind that any previous editing is lost when the table is regenerated. Note 2: The one-minute sliding time window option in the Calculations menu influences only real-time computations. Statistics are always calculated on 5-minute epochs. IBI tachogram This graph shows the Inter Beat Interval values (in seconds), over time, for each 5-minute epoch of the session: A vertical cursor can be dragged with the mouse across the graph and placed over a suspected artifact spike (we will describe this process in more detail in the next section). The corresponding heartbeat is automatically identified and shown in the raw signal graph below. This allows you to easily review the recorded data and identify artifacts in the signal for normalizing. The IBI Editor table can then be used to correct the IBI values, by performing various operations. Use the Next/Previous Epoch buttons to scan through the whole session. EKG/BVP signal review graph This graph displays the raw EKG or BVP signal. When the Tachogram graph cursor is placed over a specific IBI value, this graph automatically moves its cursor to the corresponding beat: 41 This allows you to easily review the IBI and raw data to identify artifact in the recorded signal. The IBI Editor table can then be used to correct the IBI values and normalize the data throughout the session. At any time, you can use the scroll bar under the raw signal graph to review the whole 5-minute epoch. Doing this, though, will desynchronize the two graphs. Observe that the lower cursor turns from blue to pink, indicating the loss of synchronization. Clicking on the Tachogram's Vertical Cursor will re-synchronize the cursors on both graphs for editing. Table of statistics This table displays the calculated statistics for all 5-minute epochs of the complete session. To generate the statistics, click on the STAT Function Button: It is important to remember that the statistical calculations assume normalized data (edited to remove artifact). If there is a lot of artifact and no editing is done prior to the calculation, some of these values, although they will accurately reflect the recorded data, may be clinically meaningless. It is important to normalize the data for case documentation and research. When reviewing session data and calculating statistics, keep in mind that Cardiopro always works with 5-minute epochs. If a session is less than 5 minutes, you will not be able to generate statistics for it. If it is longer than 5 minutes, no statistics will be calculated for the extra duration. Export IBI function To export IBI data, click the Export (EXP) button. The function will always export the actual IBI data, whether it is normalized or not. If editing was done but the raw data is desired, click on the Build (BLD) button to re-generate the IBI data from the raw EKG signal. Keep in mind that all previous editing will be lost when the IBI table is re-built. Whenever IBI data is exported, Cardiopro deletes any previously exported data files from the Export folder; this is to prevent hard-drive clutter. If export files are already present, when exporting, a confirmation message pops-up: 42 IBI editor table This pop-up table allows you to perform calculations on the IBI values for the purpose of normalization: All the IBI values, for the selected epoch, are listed in this table. The first column keeps track of the session time. The second column represents the consecutive IBI values. If you have placed the vertical cursor of the tachogram graph on a specific location, the selected IBI value will be highlighted in red in the table. Editing IBI data When Cardiopro records information from the EKG sensor, it may, on occasion, record extra information that is not related to the EKG signal. This could be very small electrical activity from a nearby muscle group or some electrostatic noise that is picked up from the environment. Whatever the source, this "noise" may confuse the software and cause it to erroneously calculate the IBI value in two significant ways: 1. A sudden surge in the recorded voltage may be interpreted as an extra heart beat: 43 2. A real heartbeat may be "lost" in the noise, causing Cardiopro to miss a beat: The IBI Editor Screen is used to modify these erroneously calculated IBI values and “normalize” the data for generating significant statistical reports. When you scan through the data of a recorded session, you should see a tachogram similar to the one in the illustration below. The abnormal IBI values show as large positive or negative spikes on the IBI Tachogram: The Raw Signal Review graph is used to visualize the position of the real beat and assess the need for editing. Three types of operations can be done to normalize IBI values. These are performed from the IBI Editor Table. ADDING When a sudden surge in the EKG signal is interpreted as an extra beat, two small IBI values are calculated instead of one. The tachogram shows this as a downward spike. To edit an extra beat out: 1. Move the tachogram's vertical cursor over the spike: 44 2. Verify that the vertical cursor on the raw signal has moved over the area where the extra beat is located: 3. Click the Edit button to open the IBI Table. Scroll down the list until you see the red highlighted IBI value: 4. Note that most IBI values in this example are between 765 and 832 milliseconds (ms). The extra beat shows as two much smaller IBI values, 347 and 464 ms. Click on each one of them to mark them for editing: 5. Click the ADD button. Cardiopro sums the two numbers into one (812 ms). The resulting value and the corresponding area over the EKG trace are highlighted in yellow to indicate that a sum was performed: Note: Cardiopro will allow you to select any number of consecutive IBI values in order to add them together. 45 SPLITTING When an actual beat was missed, one extra long IBI is calculated instead of two normal ones. Use the Split operation to divide the IBI into its two components. The tachogram show this as an upward spike. To edit a missing beat out: 1. Move the tachogram's vertical cursor over the spike: 2. Verify that the vertical cursor on the EKG signal has moved over the area where the missing beat is located (in this case, the signal was drifting upward and the R peak was not perceived): 3. Click the Edit button to open the IBI Table. Scroll down the list until you see the red highlighted IBI value: 4. Note that most IBI values in this example are between 742 and 832 ms. The missed beat shows as one particularly high IBI value, 1550 ms. Click on the IBI to mark it for editing and click the SPLIT button. When splitting an IBI value, by default, Cardiopro will assume that you want to split the IBI down the middle and create two equal components: 46 5. At this time, you can accept the split IBI values as proposed or type in a different value for the first IBI in the text box. When you do that, the second IBI is automatically calculated. 6. If the actual beat is not exactly halfway, the cursor on the raw signal graph will be slightly to the right or left of the beat. You can adjust the cursor’s position by dragging it over the proper spot, where you see the missed beat. When you do this, observe that the cursor's color changes to indicate that both vertical cursors are not synchronized any more: 7. Now, when you click SPLIT, Cardiopro calculates the IBI values by taking the cursor's position into account, which reflects reality more precisely: 8. Click OK to accept the new proposed value or type a preferred value in the text box. Cardiopro divides the two numbers into two new values (783 and 774 ms). The resulting values and the corresponding area over the EKG trace are highlighted in green to indicate that a division was performed: AVERAGE When it is crucially important to work with normalized data (mostly required in research projects), clinicians might elect to edit ectopic beats out of the IBI data. Ectopic beats appear as one abnormally long IBI that is either preceded or followed by an abnormally short one. Ectopic beats are natural events in the client's heartbeat and are not considered noise. But they are frequently considered as artifact because they do influence the frequency domain calculations of HF, LF and VLF. For that reason, some clinicians prefer to edit them out as part of the normalization process. To edit an ectopic beat: 47 1. Scroll back to the first epoch of the loaded session and identify the consecutive low and high spikes. Place the tachogram cursor over the low spike: 2. Place a check mark in front of the two IBI values to be averaged (601 and 968 ms): 3. Click the AVERAGE button. Cardiopro averages the data by adding them together and dividing the result into two equal values (785 ms). The resulting values and the corresponding area over the EKG trace are highlighted in blue to indicate that an average was done: Keep in mind that, when an operation is performed, the actual raw signal data is not altered or deleted, only the IBI data. Cardiopro places a colored segment over the portion of raw signal that corresponds with the edited IBI, to indicate the type of operation that was performed. When the editing is completed, you must save the changes to the actual IBI table. You can Save changes after each operation or as soon as you have completed the editing on all the 5-minute epochs of the session. Cancel will exit the IBI Editor Table without saving. Printing statistics After you have completed the editing of the IBI data, click on the STAT button. The Table of Statistics fills up with statistical computations. Clicking in the column just in front of the Epoch 48 Index number places a check mark in front of that epoch for printing a report. The Check All button places a check mark in front of all the epochs of that session. Clicking Print Report generates a one-page printout of the tachogram with the corresponding statistics for each checked epoch. Description of statistics The statistical calculations generated from the session data are as follows: SDNN: Standard deviation on the NN intervals (NN = normalized R to R = normalized IBI) for the 5-minute epoch NN50: Number of pairs of consecutive NN intervals which vary by more than 50 milliseconds in the 5-minute epoch PNN50: NN50 count divided by the total number of NN intervals for the 5-minute epoch. RMSSD: Square Root of the mean of the sum of the squares of differences between adjacent NN intervals in the 5-minute epoch SDANN: Standard deviation of the averages of NN intervals in all 5 minute epochs of the entire session. VLF: Power in the VLF band (0.0033 - 0.04Hz) for the 5-min. epoch. LFN: Power in the LF band (0.04 - 0.15Hz), in normalized units, for the 5-min. epoch. HFN: Power in the HF band (0.15 - 0.4Hz), in normalized units, for the 5-min. epoch. LF/HF: Ratio LFN/HFN Total Power: Total Power in the 0.0033 - 0.4Hz bandwidth for the 5-minute epoch AvgMM: Average HR Max - HR Min value for the 5-minute epoch AvgHR: Average Heart Rate for the 5-minute epoch AvgBR: Average Respiration (Breathing) Rate for the 5-minute epoch 49 AvgTM: Average Temperature for the 5-minute epoch These are calculated as recommended in the Special Report on Heart Rate Variability Standards of Measurement, Physiological Interpretation and Clinical Use by the Task Force of the European Society of Cardiology and the North American Society of Pacing and Electrophysiology. Closing Cardiopro There are three ways to exit Cardiopro and return to Windows: 1. Return to the Main Panel Menu by selecting the Main Panel option in the Session Menu and click the Quit Button: 2. Simply click Exit in the Session Menu: 3. Or click on the "X" button in the upper right corner of the Cardiopro Window. Upon exit, the software asks you to confirm your choice and saves all the system configuration options and reminds you to turn your ProComp+ encoder off. 50 Reference Technical support and order placing Returning equipment Be sure to call for an authorization number (RA) before returning any equipment! 1. Send the unit(s) postage prepaid and insured, with proof of purchase to one of the addresses below. 2. If you are shipping from outside Canada and the USA to Canada, mark the package ‘Goods to be repaired - Made in Canada’ to avoid unnecessary customs charges. 3. All customs and duties charges will be billed to you if incurred by sending the unit to the wrong address. 4. Provide a detailed description of the problem you are experiencing, and your telephone/fax number (see form on the last page of this manual). In the USA, ship insured to: Thought Technology Ltd. Cimetra Industrial Park 8396 Route 9 West Chazy, New York 12992, USA In Canada and all other countries, contact your dealer or ship insured to: Thought Technology Ltd. 2180 Belgrave Avenue Montreal, Quebec Canada H4A 2L8 Technical support Canada 1-514-489-8251 51 Product numbers & accessories SA7008P SA7590 SA8950 SA9450 SA9480 SA8920 SA9309M SA9308M SA9310M SA9311M T9306M T9385M T8952 T8720M T3425 ProComp+ Encoder Pin Protected ProComp+/Cardiopro Manual & Software Package PRO-SB Interface Cable Fiber Optic 1FT Cable Fiber Optic 15FT Converter 9pin female to 25pin male SC-Flex/Pro Sensor HR/BVP Sensor Temperature Sensor Respiration Sensor EKG Sensor Replacement Sensor Cable PRO-SB Dual Interface Sensor Extender Cable Uni-Gel Electrodes (100) Placing Orders Outside USA Tel: 1-514-489-8251 Fax: 1-514-489-8255 In USA Toll-Free Tel: 1-800-361-3651 e-mail: [email protected] webpage: http://www.thoughttechnology.com 52 Specifications Temperature Sensor (SA9310M) Length (Approx.) 152cm (60”) Weight 10g (0.33 oz) Temperature Range 10°C – 45°C (50°F – 115°F) Accuracy ±1.0°C (±1.8°F) 20°C – 40°C(68°F – 104°F) HR/BVP Flex/Pro Sensor (SA9308M) Size (Approx.) 20mm x 34mm x 10mm (0.72” x 1.33” x 0.41”) Weight 20g (0.66 oz) Input Range Unitless quantity displayed as 0% – 100% Accuracy ±5% Respiration Sensor (SA9311M) Size (Approx.) 132cm (52” Long) Weigh 30g (1.0 oz) Range Unitless quantity displayed as 0% – 100% EKG- Sensor (SA9306M) Size (Approx.) Weight Input Impedance Input Range Sensitivity Bandwidth Accuracy 37mm x 37mm x 12mm (1.45” x 1.45” x 0.45”) 25g (1 oz) 1,000,000MΩ ±10mV p-p <1µVRMS 0.05Hz – 40Hz ±5%, ±3µV Skin Conductance Flex/Pro Sensor (SA9309M) Size without electrode leads (approx.) Size with electrode leads (approx.) Cable Length (approx.) Weight (approx.) Signal Input Range Accuracy 3.5 cm (1.4”) 15 cm (6.0”) 127 cm (50”) 25 g (1 oz) 0 – 30.0 µS ±5%, ±0.2 µS ProComp+ Encoder (SA7008P) Size (approx.) 81mm x 127mm x 30mm (3.2” x 5.0” x 1.2”) Weight (approx.) 200g (6.6oz) Channel Bandwidth (A, B) Channel Bandwidth (C, D, E, F, G, H) 0Hz – 40Hz 0Hz – 5Hz Sample Rate/Channel (A, B) 256 samples/second Sample Rate/Channel (C, D, E, F, G, H) 32 samples/second Supply Voltage 3.0V – 6.5V Low Battery Warning 3.2V ±0.2V Current Consumption 40mA – 80mA @ 6.0V Accuracy ±5% Data Output Protocol 19.2 Kbaud, 8 Bits, 1 Stop, No Parity Battery Life (Alkaline) 18 to 20 Hours (minimum) 53 Index EKG Signal, 26, 29 EKG Signal Review Graph, 41 Exit, 19 2 2D IBI Power Spectrum, 29 F 3 Feedback Sound, 21 3DS, 32, 39 A G Abdominal Respiration, 10 About, 23 Add New Patient, 15 Graph Settings, 24 H Heart Rate, 25 Heart Rate Bar Graph, 33 Heart Rate Display, 26 Heart Rate Variability, 50 Help, 23 HR Max - HR Min, 21 HR Max - HR Min Display, 26, 31 HRV Recording, 19 B Background, 20 Battery Level, 24 Biofeedback, 34 Breaths/minute, 30 BVP, 10 C I Closing, 50 COM Port Setup, 14 Combo Line Graph, 28 Communication Port, 14 Connecting Sensors, 10 Contents, 23 Cycle Duration, 30 IBI Display, 26 IBI Editor Screen, 40 IBI Editor Table, 43 IBI Tachogram, 41 Inter Beat Intervals (IBI), 33 K D Key Code, 16 Delete, 36 Delete Patient button, 15 Description of Statistics, 49 Direction, 22 Display, 20 M Main Menu, 8, 9 Main Panel, 19 N E No valid data, 17 Numeric displays, 26 Edit Patient Data, 15 Editing IBI Data, 43 Editor Function Buttons, 41 EKG, 10 54 P Select Patient button, 14 Session, 19, 28 Session Database, 9 Show EKG/BVP, 20 Show HR/IBI, 20, 21 Signal Type, 21 Sound, 21 STAT, 42 Stop Recording, 35 Pacer settings, 30, 32 Patient Database, 9 Printing Statistics, 48 Pro-SB Interface, 9 Q Quit, 50 R T Recording, 17 Replaying a Session, 38 Respiration Signal, 25 Review Session, 36 RSA Recording screen, 27 Table of Statistics, 42 Temperature, 10, 22 Temperature Display, 26 the HRV Recording Screen, 9 Thoracic Respiration, 10 Thoracic/Abdominal, 21 Threshold, 22, 23 Time Scale Selector, 23 S Scale Settings, 24 SDRR, 21 SDRR Bar Graph, 27 55