1
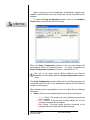
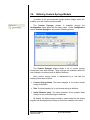
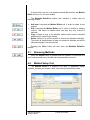
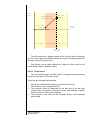
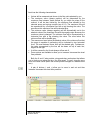
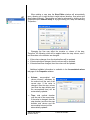
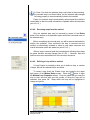
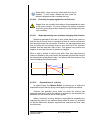
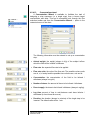
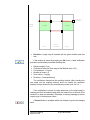
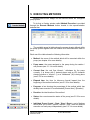
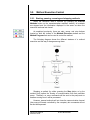
4.2.4. Flow evolution graph: steps and flow definition
The Flow Evolution Graph area shows a graphical representation of
the defined method’s steps. It works as a “canvas” in which you can “draw”
your own step sequence and the desired flow rate evolution lines.
The flow evolution chart area provides a toolbar to facilitate the
execution of the most common tasks related to the method edit process.
The following buttons are included in the toolbar:
•
Select: Sets the graph into selection mode, allowing you to select or
modify steps but not create new ones (see 4.2.4.3. )
•
Add: Sets the graph into steps addition mode, allowing you to add new
sequential steps into the method (see 4.2.4.5. ).
•
Properties: Allows you to change the properties of the selected step
(see 4.2.4.3. ).
•
Insert: Adds a new step in the middle of the sequence (see 4.2.4.6. ).
This button is enabled when the total quantity of steps has not reached
the predefined limit of the selected pump model, as defined in 4.2.4.5.
•
Concentration Wizard: Allows you to easily insert a step sequence
from a known target concentration and dose (see 4.2.4.13. for more
details)
•
Delete: Asks you to confirm the removal of the selected step (see
4.2.4.8. )
•
Autoscale: Automatically adjusts the chart area to show all the steps in
the sequence.
Adagio User Manual
5619-001 Rev B
© 2010 KD Scientific
23