1
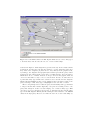
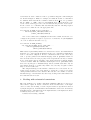
Fig. 1. Part of the BIND schema as an ER diagram. Thick arrows connect entity types
to their subclasses. Labelled arcs show stored or derived relationships.
as shown in Figure 1. This diagram is generated directly from textual schema
declarations, and the user can drag the entities to get the diagram looking how
they want. Some designers [15] have tried to stay entirely in the graphic world,
by adding to the diagram extra graphic symbols that represent the query. Other
designers [2] stay entirely in the text world, by adding menus to the text window
which list a choice of names. Instead we keep both text and graphic windows
on screen, and make it easy to move between them. At any one time there is
a particular entity type which is the current focus of attention in the diagram,
which is shown highlighted, and correspondingly in the text window a line of the
query referring to that entity type, is highlighted. One can click on either.
The second principle was to build the query incrementally, with opportunities
to inspect intermediate results. Typically, a step involves adding a line to the
query that brings in another variable ranging over a related entity type. This
can only be done by following a relationship arc starting from the current entity
type in the ER diagram. This is just like adding an extra variable to the FROM
clause in an SQL query. However, we make the user choose the relationship by