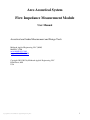
1
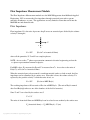
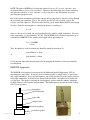
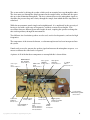
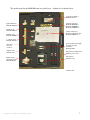
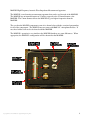
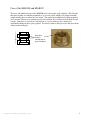
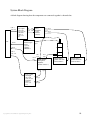
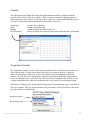
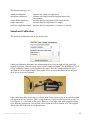
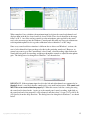
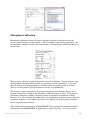
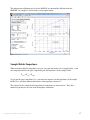
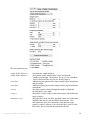
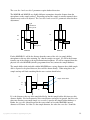
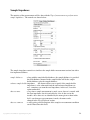
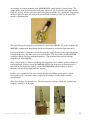
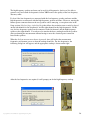
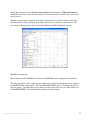
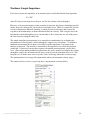
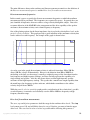
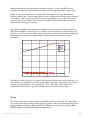
Ares Acoustical System Flow Impedance Measurement Module User Manual Acoustical and Audio Measurement and Design Tools McIntosh Applied Engineering, LLC (MAE) MAELLC.COM [email protected] [email protected] Copyright 2012-2015 by McIntosh Applied Engineering, LLC Eden Prairie, MN USA Copyright 2012, 2013 McIntosh Applied Engineering, LLC 1 Notice Ares is copyrighted and licensed by McIntosh Applied Engineering, LLC (MAE). Ares and all of its hardware and software components are provided "as is". MAE makes no representations or warranties concerning the compatibility of Ares to the user's computer system, or any potential damage caused to any computer, peripherals, digital storage systems, or personal physical safety. Further, the accuracies of the measurement, modeling and design components are not warrantied and should not be used as the sole source of evaluating an engineered system or component for commercial suitability or physical safety. The user agrees not to distribute the Ares software to any non-licensed third party, attempt to disable the licensing system, or reverse engineer the operation of the program or its hardware components. Table of Contents Notice .............................................................................................................................................. 2 Table of Contents ............................................................................................................................ 2 Document Revision History............................................................................................................ 3 Flow Impedance Measurement Module.......................................................................................... 4 Flow Impedance .......................................................................................................................... 4 MAE100 Apparatus .................................................................................................................... 5 Care of the MAE100 and MAE102 ............................................................................................ 9 System Block Diagram ............................................................................................................. 10 Controls ..................................................................................................................................... 11 Acquisition Controls ................................................................................................................. 11 Soundcard Calibration .......................................................................................................... 12 Microphone Calibration ........................................................................................................ 14 Sample Holder Impedance .................................................................................................... 17 Sample Impedance ................................................................................................................ 24 Nonlinear Sample Impedance ............................................................................................... 29 Setup ......................................................................................................................................... 31 Plotting ...................................................................................................................................... 39 Files/Clipboard .......................................................................................................................... 41 Using the 1” sample cutter ........................................................................................................ 43 Step-by-Step Flow Impedance Measurement Example ............................................................ 44 Copyright 2012, 2013 McIntosh Applied Engineering, LLC 2 Document Revision History Version 1.00 1.01 Date October, 2012 April, 2015 Copyright 2012, 2013 McIntosh Applied Engineering, LLC Comments Initial documentation release Separated manual into individual documents 3 Flow Impedance Measurement Module The Flow Impedance Measurement module uses the MAE100 apparatus from McIntosh Applied Engineering, LLC to measure the flow impedance through acoustical parts such as porous materials, membranes, or ports. The applications are only limited to items that can fit into the MAE100 one inch diameter tube. Flow Impedance Flow impedance Zf is the ratio of pressure drop P across an acoustical part divided by the volume velocity U through it. U _ + P Zf = P/U (Pa-s/m3 or Acoustical Ohms) where all the quantities, P, U and Zf are complex phasors. NOTE: Ares uses the ejωt phasor representation common in electrical engineering and not the e-iωt phasor representation common in physics. For MKS values, P is measured in Pa and U is measured in m3/s. Ares refers to the units of Pa/(m3/s) or Pa-s/m3 as Acoustical Ohms. When the acoustical part to be measured is a uniform material such as a cloth or mesh, the flow impedance can be normalized by its surface area. When this is done, the volume velocity U is replaced by the particle velocity V which has units of m/s, or Zf = P/V (Pa-s/m or MKS Rayls) The resulting impedance will have units of Pa-s/m or MKS Rayls. (The unit of Rayl is named after Lord Rayleigh who was one of the founders of the field of acoustics.) Since U and V are related by the surface area S U = S⋅V The units of Acoustical Ohms and MKS Rayls can be related to one another by the surface area Zf (Acoustical ohms) = Zf (MKS Rayls ) / S (m2) Copyright 2012, 2013 McIntosh Applied Engineering, LLC 4 NOTE: The units of MKS Rayls is frequently referred to as specific acoustic impedance and Acoustical Ohms as just acoustic impedance. However, the author finds these terms confusing and will refer to both as acoustic impedance or flow impedance and differentiate the two by providing the appropriate units. One of the critical assumptions behind the concept of flow impedance is that the velocity through the acoustical part is uniform. That is, the velocity into the left side is exactly equal to the velocity out of the right side. This necessitates that the part be much thinner than the wavelength of sound. Since the wavelength λ is a function frequency f according to λ = c/f where c is the speed of sound, the wavelength will be the smallest at high frequencies. For air at room temperature, c is approximately 343 m/s. The MAE100 device measures impedance up to a maximum of 6000 Hz, so the smallest wavelength will be approximately λmin = 343/6000 ≅ 6 cm Thus, the thickness of the acoustical part should be much less than 6cm. So part thickness << 6 cm or part thickness < 6 mm So, for the flow impedance measurement to be meaningful, the thickness of the part should be less than 6 mm. MAE100 Apparatus The MAE100 is the hardware system provided by McIntosh Applied Engineering, LLC for measuring flow impedance. It consists of an excitation speaker, a sample holder, a spacer tube, and a rigid termination. It uses two microphones, one on the speaker side of the sample, and one in the rigid termination. A sketch of it is shown to the left below, and a photo of an actual unit is to the right. (The photo is showing the low frequency speaker enclosure which is optimized for high intensity, low frequency measurements. The high frequency speaker enclosure is likely to be used more often.) microphone rigid termination spacer tube sample holder side microphone excitation speaker Copyright 2012, 2013 McIntosh Applied Engineering, LLC 5 The system works by driving the speaker, which sends an acoustical wave up through the tubes. The wave must pass through the sample mounted in the sample holder, and then into the spacer tube up to the termination microphone. The Ares software then uses the microphone signals to determine the pressure drop and velocity through the sample, from which the flow impedance is calculated. While the measurement sounds simple and straightforward, it’s complicated by the necessity of having to deal with a wide range of frequencies, and their associated wavelengths. This necessitates that two different spacer tube lengths be used, requiring the operator to change the tube stack-up midway through the measurement. Two different sized excitation speakers are also used, one for low frequencies, and one for high frequencies. The temperature of the air must be known, so a thermocouple meter has been incorporated into the system. Sound cards are used to generate the speaker signal and measure the microphone response, so a means to calibrate the sound cards is required. A picture of all of the hardware components to accomplish this is shown below. B&K NEXUS mic amplifier MAE201-NEXUS-A thermocouple meter USB sound cards stereo power amplifier microphone calibrator MAE202-AAMP-A MAE100-MICCAL-A 1” sample cutter MAE100-1INCUT-A MAE204-USBSC-A MAE203-THERMO-A low frequency excitation speaker MAE100-LFSP-A sound card calibrator 150 mm spacer MAE100-150MM-A 15 mm spacer MAE100-15MM-A MAE200-ACVC-A rigid termination MAE100-RTMIC-A MAE100-HFSP-A sample holder rings MAE100-15MMSHD-A MAE100-10MMSHD-A MAE100-3MMSHD-A Copyright 2012, 2013 McIntosh Applied Engineering, LLC high frequency excitation speaker sample holder MAE100-SH-A 6 The smaller parts for the MAE100 come in a padded case. A photo of it is shown below. sound card calibrator MAE200-ACVC-A rigid termination MAE100-RTMIC-A 15mm spacer MAE100-15MM-A 150mm spacer MAE100-150MM-A sample holder rings MAE100-3MMSHD-A MAE100-10MMSHD-A MAE100-15MMSHD-A sample with factory measured impedance data MAE100-SAMPLExx-A 1” sample cutter MAE100-1INCUT-A spare fuses 1A and 3A 1.25x0.25” sample holder spare speaker for the high frequency speaker enclosure MAE100-SPK-A MAE100-SH-A microphone preamp cables high frequency speaker enclosure microphones B&K Type 4938-A-011 B&K Type 4938 MAE100-HFSP-A sample holder Copyright 2012, 2013 McIntosh Applied Engineering, LLC 7 MAE102 High Frequency Acoustic Flow Impedance Measurement Apparatus The MAE102 is an alternative measurement apparatus that can be used instead of the MAE100. The MAE102 has an internal diameter of 12 mm as opposed to the 25.4mm diameter o the MAE100. The 12mm diameter allows the MAE102 to go to higher frequencies than the MAE100. The case that the MAE102 components come in is shown below with the associated part number for all of the components. The MAE102 may not come with B&K 1/4" microphone holders. If not, these holders will need to be shared with the MAE100. The MAE102's operation is very similar to the MAE100, but there are some differences. When appropriate, the MAE102's configuration will be shown after the MAE100. Copyright 2012, 2013 McIntosh Applied Engineering, LLC 8 Care of the MAE100 and MAE102 The brass and aluminum parts of the MAE100 need to be kept in good condition. The flat parts that mate together are smoothly machined so as to create a near airtight seal simply from their weight bearing down on where they are joined. This means that complicated sealing mechanics aren’t needed. However, to maintain a good seal condition, these surfaces must be kept flat and smooth. Since brass is a relatively soft material, it’s easy to damage these surfaces by accidentally hitting the brass parts together. Treat these surfaces with great care and repair them if they become damaged. keep these surfaces smooth and in good condition Copyright 2012, 2013 McIntosh Applied Engineering, LLC 9 System Block Diagram A block diagram showing how the components are connected together is shown below. USB or audio jack PC RS232 RS232 stereo sound card output (either USB sound card such as MAE204USBSC-A or PC sound card) Left CH 1 Right CH 2 EXTECH thermocouple meter stereo amplifier (such as MAE202AAMP-A) CH 1 output CH 2 output T1 or T2 input (Optional) (MAE203THERMO-A) USB or audio jack CH 1 input RS232 Host CH 2 input B&K NEXUS microphone amplifier high frequency speaker enclosure low frequency speaker enclosure (MAE100-HFSP-A) (MAE100-LFSP-A) (MAE201-NEXUS-A) CH 1 output CH 2 output stereo sound card input (either USB sound card such as MAE204USBSC-A or PC sound card) Copyright 2012, 2013 McIntosh Applied Engineering, LLC Left input Right input 10 Controls All of the interaction with the Flow Impedance Measurement module is performed with the controls on the left side of the Ares window. These controls are dynamic, changing based on what feature have been selected. At the top of these controls is a series of four tabs that are used to select one of the four main functionalities of the module. These are: Acquisition Setup Plotting Files/Clipboard - controls data acquisition - controls instrument setup - controls plotting the collected data sets - allows for data to be exported or imported to individual files or clipboard Acquisition Controls The Acquisition controls are used for all data measurements and so will likely be used the most of the four tab items. For this reason they are the first set of controls on the tab. However, before the Acquisition controls can be used, the hardware must be configured in the Setup controls. We will discuss the Acquisition controls first, but understand that the Setup controls need to be configured first. Once the Setup controls have been configured, they will be saved to a default configuration file when Ares terminates and so will not have to be configured again. There are five different types of data acquisition operations (or measurement types), each with its own set of controls. The type of measurement to be performed is selected with the list box at the top of the controls as shown below. drop down listbox measurement types Copyright 2012, 2013 McIntosh Applied Engineering, LLC 11 The measurement types are: soundcard calibration microphone calibration – calibrates the sound card input levels – calibrates the complex transfer function between the microphones sample holder impedance – measures the flow impedance of the sample holder sample impedance – measures the flow impedance of a sample nonlinear sample impedance – measures the flow impedance as a function of velocity Soundcard Calibration The sound card calibration controls are shown below. Sound card calibration determines the maximum input level into the right and left sound card channels by placing a known voltage signal onto the sound card inputs. The MAE200-ACVC-A voltage calibration source is used to generate the signal. Place the voltage calibration source onto both the left and right channels of the sound card as shown in the picture below and press the Perform measurement button. If the correct recording sound card was selected in the Setup section, a plot of the recorded signal will appear in the Ares window. This is a high frequency signal recorded over many periods, so it just appears as a solid color on the graph. However, if you right click on the graph and select Zoom from the popup menu, you can draw a box around the data to zoom in on it. The original data and the data zoomed in on are shown below. Copyright 2012, 2013 McIntosh Applied Engineering, LLC 12 When completed, Ares calculates the maximum input levels into the sound card channels and displays them in the Right channel and Left channel fields. These levels should be in the range from 1 to 10 V. Ares does not have control over the microphone gains applied by the sound card, so the user must go into the Windows Control panel and make any necessary adjustments to the input/microphone levels to get the calibration values within this 1 to 10V range. Since every sound card driver interface is different due to drivers and Windows’ versions, the user is left to himself to figure out how to do this for his particular sound card. However, in general you want to go to the Control Panel, select Sound, select Recording, right click on the sound card being used for recording, and then go through the controls to adjust the microphone gain. The dialog boxes for doing this in Windows 7 are shown below. IMPORTANT: If the maximum input levels for the left and right channels are computed to be identical, then it’s very likely that the sound card is set to mono and not stereo. The sound card MUST be set to stereo to function properly!!! When this occurs, look for a setting for using the sound card in shared mode. Again, go to the control panel, sound, recording, right click on the sound card and select properties, select advanced, and then select 2 channel, 16 bit 44100 Hz (CD Quality) from the drop down box. The dialog boxes for doing this in Windows 7 are shown below. Copyright 2012, 2013 McIntosh Applied Engineering, LLC 13 Microphone Calibration Microphone calibration measures the relative amplitude and phase difference between the recorded signals from the two microphones. This is a function of not only the microphones, but the microphone amplifier and the sound card hardware. The microphone calibration controls are shown below. These are quite a bit more complicated than the sound card calibration. All measurements with the Flow Impedance Measurement module are performed at discrete frequencies, so you must enter the starting and stopping frequencies, and the number of frequency points to be taken. There is also the option to space the frequencies linearly or logarithmically. The frequency range is important as all subsequent impedance measurements must be over a frequency range that’s covered by the microphone calibration frequency range. If you start the microphone calibration at 20 Hz, you cannot perform an impedance measurement at 10 Hz. However, Ares will interpolate the calibration for any measurement frequencies that are between calibration frequencies, so the number of points can be different for the microphone calibration and the impedance measurements. When calibrating the microphones, the MAE100-MICCAL-A microphone calibration cap must be mounted on the MAE100-HFSP-A high frequency speaker enclosure. It’s best to have the Copyright 2012, 2013 McIntosh Applied Engineering, LLC 14 MAE100-150MM-A 150mm spacer between the speaker and the calibration cap as shown in the picture below. To ensure that the microphones are calibrated at a reasonable sound pressure level (SPL), there is a Target SPL for microphone calibration that is to be entered. Ares will adjust the drive level to the speaker until the desired SPL is reached, if possible. (The maximum normalized drive level is 1.0. If the pressure is still too low at the maximum drive level, it will perform the measurement at as high an SPL as possible.) The calibration data for two microphones are shown in the Ares window below. (Normally the phase is close to 0 degrees for all frequencies, but the USB sound card tested had a constant delay between the left and right channels that created this “linear phase delay” between the two microphones.) Copyright 2012, 2013 McIntosh Applied Engineering, LLC 15 At the bottom of the controls, there are graphing options. These allow you to plot several different quantities which are listed below. These provide additional information about levels and signal quality during the microphone calibration measurement. magnitude phase pressure drive level SNR estimate - the magnitude of the complex phasor transfer function between the two microphones - the phase of the complex phasor transfer function of the two mics - the pressure at the microphone surface for the measurement - the normalized sound card drive level that was used to achieve the calibration pressure - a signal-to-noise estimate of the measured microphone signal for the measurement MAE102 Microphone Calibration The MAE102 uses a different calibration setup than the other apparatus's. The MAE100MICCAL-A is not used, but rather the system is setup as for a measurement, but no sample or sample holder is put in place. The stackup is shown below, with photographs of an actual measurement below that. Copyright 2012, 2013 McIntosh Applied Engineering, LLC 16 The microphone calibration curves for the MAE102 are substantially different from the MAE100. An example is shown in the screen capture below. Sample Holder Impedance When measuring the flow impedance of a part, you typically mount it in a sample holder, so the total impedance will be the part’s impedance plus the impedance of the sample holder Ztotal = Zpart + Zholder To get just the part’s impedance Zpart, you must first measure just the impedance of the sample holder Zholder and then subtract that from the total impedance measured. The controls for the sample holder impedance measurement are shown below. They add a number of parameters not seen in the microphone calibration. Copyright 2012, 2013 McIntosh Applied Engineering, LLC 17 The new parameters are: sample holder thickness sample holder diameter extra dist 1 extra dist 2 velocity +-target initial drive level Copyright 2012, 2013 McIntosh Applied Engineering, LLC - how thick the sample holder is - the diameter of the sample holder’s open area that the sound passes through. alternatively, the specify area checkbox can be selected and the area can be directly entered. - additional spacing between the lower sample holder microphone and the sample. - additional spacing between the sample and the rigid termination microphone. - the target particle velocity through the sample at which the measurement is to be taken - the particle velocity range for the measurement (taken about the target velocity) - the initial drive level out of the playback sound card to the audio amplifier that Ares uses for the initial measurement. Ares then adjusts the drive level about this value until the target particle velocity is achieved. the closer this drive level is to the final value, the less time the measurement will take. 18 The extra dist 1 and extra dist 2 parameters require further discussion. The MAE100 and MAE102 use slightly different assumptions about the distance from the microphones to the sample surfaces. Depending on how the sample is actually mounted, these distances may need to be adjusted. The extra dist 1 and extra dist 2 parameters allow for these adjustments. rigid termination microphone L2 L2 L1 L1 side microphone MAE102 MAE100 For the MAE100, L1 will be the distance from the center of the side (or sample holder) microphone to the top of the retaining "lip" that the sample rests upon. L2 will be the distance from the top of the sample to the rigid termination microphone. L2 will be computed from the physical size o the MAE100 (which is programmed into Ares) minus the sample thickness. The sample holder disks included with the MAE100 have varying diameters that a bulk sample disk is expected to be placed between (these will be shown shortly). When using these, the sample stackup will look something like the cross section sketch below. L2 sample holder disks th ts L1 ds L1 is the distance to the top of the sample holder lip, but the sample holder disk increases this distance slightly. For low frequencies, this extra distance can largely be ignored, but if its to be taken into account, you cannot simply set extra dist 1 equal to the sample holder thickness th. Rather, the extra dist 1should represent the extra volume of air at the MAE100's internal diameter of 25.4mm. So if the ds is the sample diameter, the value for extra dist 1 should be Copyright 2012, 2013 McIntosh Applied Engineering, LLC 19 ds extra dist 1 = t s 25.4mm 2 which will compute a value for extra dist 1 that will have the same air volume held in the sample holder. So if the sample holder disk is 1mm in diameter and has an open area of 10mm, extra dist 1 will be 1*(10/25.4)^2 = 0.155mm. For most situations this can be ignored as the MAE100 generally measures lower frequencies than the MAE102. By default, L2 will only be shortened by the thickness of the sample, but due to the sample holder disks, this means that Ares will expect L2 to extend under the sample (as drawn). To correct for this, extra dist 2 will actually need to be negative. In this case, the entire thickness of the lower sample holder disk needs to be used, and the effective volumetric effects of the top disk is to be used. so 2 d s extra dist 2 = − t s + t s 25.4mm So for a values of 1mm fo ts and 10mm of ds, extra dist 2 will be -(1+1*(10/25.4)^2) = -1.155 mm; Copyright 2012, 2013 McIntosh Applied Engineering, LLC 20 MAE102 is different from the MAE100 in that the sample is expected to actually lift the stackup when placed in the sample holder. The sketches below show an expanded stackup (left) and the stackup with all of the pieced put together (right). With this arr L2 L1 Note that the inner diameter of the MAE102 is 12mm, but the sample is expected to have a 25.4mm diameter, the same size as for the MAE100. In this case, the lager sample actually lifts the entire stackup and so L1 and L2 will ideally remain unchanged. However, this assumes that the 5mm spacer is being used, the MAE102-5MM-A. The MAE102 also comes with a 2.5mm spacer (the MAE102-2.5MM-A). This can be used when the sample is more than a few mm's thick, and causes the stackup to be lifted out of the 25.4mm diameter recess. When the 2.5mm space is used, L2 should be -2.5 mm. Additional corrections will need to be made depending on the structure of the sample. Suppose that the sample is actually composed of a 25.4mm diameter carrier with a 12mm diameter sample adhered to its top as in the cross section shown below, where ts is the sample thickness and tc is the carrier thickness. (Note that we've magically attached the sample to the carrier at its edge. For this sample/carrier configuration, extra dist 1 would be tc as the carrier would increase the distance from the side (o sample holder) microphone and the lower sample surface. ts tc 12mm 25.4mm With this configuration, the sample would actually extend up into the 12mm diamter of the upper volumes, and so the distance from the rigid termination microphone and the sample surface has decreased by the sample thickness, so extra dist 2 would be -ts. If the 2.5mm space is used, extra dist 2 would be -ts - 2.5mm. Copyright 2012, 2013 McIntosh Applied Engineering, LLC 21 Unfortunately, there are two different items being called the “sample holder”. One is the MAE100-SH-A item shown below in which the samples are mounted. And the other is any of the rings that are used to support a sample held in place in the MAE100SH-A, such as those shown below. (The image on the right shows a felt type sample held between two MAE100-10MMSHD-A 10mm sample holder disks.) The sample holder rings are mounted into the sample holder fixture as shown below. The sample holder impedance is understood to be the impedance through the sample holder disks and not the MAE100-SH-A. Copyright 2012, 2013 McIntosh Applied Engineering, LLC 22 As with the microphone calibration, the frequency range over which the sample holder impedance is measured is important, as all subsequent impedance measurements must be over a frequency range that’s covered by the sample holder impedance data. Also, as with the microphone calibration frequencies, Ares will interpolate the sample holder impedance at any measurement frequencies that are not at the exact frequencies at which the sample holder impedance were measured. This means that the number of points can be different for the sample impedance measurements and the sample holder impedance measurement. The velocity parameter controls the particle velocity that passes through the part during measurement. As discussed in the nonlinear sample impedance section, the impedance of acoustical parts can be a function of the velocity through the sample. In general, a part impedance usually changes at high intensities, and so nonlinear effects are seen under high SPL or velocity levels. Linear behavior is seen at low SPL’s and velocities. When performing a sample holder or sample impedance measurement, it is generally desired to measure the impedance under linear, or low intensity condition. This is controlled through the velocity parameter. The impedance of this sample holder is shown in the screen capture below. Note that the impedance is mostly imaginary, which is common for a hole or port such as the 10mm sample holder rings. Also note that the real part is positive. The real part of the impedance must always be positive. If it is negative, this is a sign of an inaccurate measurement. The sample holder plotting options include some new graphs particle velocity driving pressure drive level Pend/Pside xfer velocity/drive - the particle velocity through the sample that was achieved - the pressure on the speaker side of the sample holder - the normalized drive level out to the speaker - the transfer function of the acoustic pressure at the rigid termination end over the pressure at the speaker side of the sample holder - the ratio of the particle velocity over the normalized drive level indicating the sensitivity of the particle velocity to the drive level output Copyright 2012, 2013 McIntosh Applied Engineering, LLC 23 Sample Impedance The majority of the measurements will be done with the Type of measurement to perform set to sample impedance. The controls are shown below. The sample impedance controls are similar to the sample holder measurement section, but with a few important additions. - along with the sample holder thickness, the sample thickness is provided. the total thickness mounted in the sample holder will be the sample holder thickness plus the sample thickness. subtract sample holder impedance - this feature allows you to specify if the sample holder impedance is to be subtracted from the total measured impedance or not. sometimes you want the total impedance, in this case, leave this option unchecked. data set name - every time a sample measurement is made, a new data set is created with the flow impedance data in it and added to a list of data sets in the module. these data sets are identified by the name given to them in this field. note that once a measurement is made, the name can be changed in the Files/Clipboard section. data set comment - a string giving a full description of the sample or measurement condition can be entered into this field. sample thickness Copyright 2012, 2013 McIntosh Applied Engineering, LLC 24 An example of a sample mounted in the MAE100-SH-A sample holder is shown below. The sample holder disks are held in place with putty, which not only ensures that the sample holder rings stay in place, but also prevents sound from going around the ring’s perimeter. Suggestions on how to apply the putty are made in the measurement example presented at the end of this module’s documentation. The typical frequency range for a measurement is from 20 to 5000 Hz. To ensure accuracy, the MAE100’s configuration must change for the low frequencies and for the high frequencies. For low frequencies, a long tube is needed between the sample holder and the rigid termination. For high frequencies, this tube needs to be much shorter. This necessitates that the MAE100 stackup be changed for low and high frequencies. (The transition between low and high frequencies is around 800 Hz.) Also, a larger speaker is better at producing low frequencies, and a smaller speaker is better for high frequencies. For this reason, the MAE100-LFSP-A low frequency speaker enclosure is better for the low frequency stackup, and the MAE100-HFSP-A high frequency speaker enclosure is better for the high frequency stackup. Further, it is recommended, but not essential, that the long 150mm spacer tube be placed between the speaker enclosure and the sample holder when performing high frequency measurements. These two stackups are shown below. The low frequency stackup is on the left, and the high frequency stackup is on the right. Copyright 2012, 2013 McIntosh Applied Engineering, LLC 25 The high frequency speaker enclosure can be used for all frequencies, but it won’t be able to generate very loud sound for frequencies below 300 Hz and so the quality of the low frequency data may suffer. It’s best if the low frequencies are measured with the low frequency speaker enclosure and the high frequencies are measured with the high frequency speaker enclosure. However, moving the banana power connector between the two speakers can be annoying, so an option exists in the Setup section (left=low freqs, right=high freq) that allows the excitation tones to only be played out the left channel for low frequencies, and the right channel for the high frequencies. In this way, the low frequency speaker can be connected to the left channel, and the high frequency speaker to the right channel. You only need to transfer the brass stackup between the speakers when performing the measurement without having to move the electrical power connector between the speakers. When the Perform measurement button is pressed, Ares will look at the measurement frequencies and instruct you as to what the stackup should be. For low frequencies, the following dialog box will appear, and the appropriate stackup is shown on the right. After the low frequencies are acquired, it will prompt you for the high frequency stackup. Copyright 2012, 2013 McIntosh Applied Engineering, LLC 26 During the measurement, the Perform measurement button changes to Stop measurement, which allows the user to abort the measurement. If a measurement is aborted, a new data set will not be created. When the measurement is completed, the data is copied into a new dataset and the results from the measurement will be displayed on the right side of the Ares window as shown below. The new dataset will appear in the dataset lists in the Plotting and Files/Clipboard sections. MAE102 measurements Measuements with the MAE102 are similar to the MAE100, but the components are different. The left image below shows a white plastic sample with a 2mm hole through the center setting in the MAE102-SH-A sample holder. The 5mm MAE102-5MM-A spacer is waiting to be placed onto the sample. The right image below shows the 5mm spacer placed on top of the sample and the MAE102-RTMIC-A rigid termination waiting to be placed ontop. Copyright 2012, 2013 McIntosh Applied Engineering, LLC 27 Note that as the stackups are changed through the measurement process, the 5mm spacer will remain on top of the sample. Pressing Perform Measurement button instructs the user to place the 145and 5 mm spacer on the stackup as shown in the left image below. Next, the 22 and 5 mm spacers shown below in the center, and then finally just the 5 mm spacer as shown in the far right below. The impedance measured from the disk with a 2mm hole is shown below. Note the behavior up until 10kHz is essentially a damped mass reactance. Then above 10 kHz, the behavior becomes complex, probably due to plate modes. Copyright 2012, 2013 McIntosh Applied Engineering, LLC 28 Nonlinear Sample Impedance For a linear system, the impedance of an acoustical part is well defined by the flow impedance Zf = P/U where P is the pressure drop across the part, and U is the volume velocity through it. However, as the acoustic intensity of the excitation is increased, this linear relationship typically breaks down and a change in Zf can be observed at higher levels. While it’s natural for a person to want to characterize behavior according to sound pressure level because that is what ears respond to, the nonlinearities are better characterized by the velocity. This is largely due to the fact that the velocity through the part is constant (that is, the velocity into one side of the part is the same velocity exiting the other side). The sample impedance measurements try to control these nonlinearities by performing the measurement at a fixed particle velocity through the sample at every frequency. To perform a nonlinear measurement, the frequency is held fixed and the impedance is measured as the intensity is increased. The intensity is controlled by the output drive level from the playback sound card. So instead of varying the frequency, the nonlinear measurements vary the drive level. (Since when making nonlinear measurements, the goal is usually to maximize the velocity through the sample, the measurement will always want to go to the maximum drive level. This being the case, it makes more sense to specify a drive level range rather than a velocity range. The maximum drive level range will automatically achieve the maximum velocity range.) The controls for the nonlinear sample impedance measurement are shown below. Copyright 2012, 2013 McIntosh Applied Engineering, LLC 29 The main differences between the nonlinear and linear measurement controls are the additions of the Discrete measurement frequencies and the Drive level for nonlinear measurements. Discrete measurement frequencies In this control, you are to specify the discrete measurement frequencies at which the nonlinear measurement will be performed. The frequencies are separated by spaces. In general, these are just a handful of frequencies chosen to achieve a large velocity through the sample. Due to the resonance behavior of the MAE100’s tube arrangement and the drive capability of the speaker enclosures, the maximum velocity varies from frequency to frequency. One of the plotting options for the linear impedance data is to plot the velocity/drive level, or the particle velocity sensitivity. This graph provides a good indication of the maximum velocity that can be achieved at each frequency. An example of the graph is shown below. Particle velocity/drive level sensitivity ((m/s)/drive level) 4 felt 3 2 1 0 0 MARS 1000 2000 3000 Frequency (Hz) 4000 5000 6000 As can be seen in the graph, the maximum velocity is achieved from about 100 to 500 Hz. Above 500 Hz, it drops off dramatically. However, the behavior from 500 to 1000 Hz is misleading as the data over that range is actually a weighted average of the data taken from the low frequency and high frequency stackups, and does not fully represent the capability of a single stackup and speaker. Also, the data shown above used the high frequency speaker enclosure for the high frequency stackup. This speaker has a much lower output capability than the much larger low frequency speaker enclosure, which further contributes to the sudden velocity drop off above 500 Hz. While the particle velocity sensitivity graph provides an indication of the velocity that’s possible at each frequency, it cannot be used accurately over the 500 to 1000 low frequency to high frequency transition range. Drive level for nonlinear measurements The start, stop and # points parameters detail the range for the nonlinear drive levels. The stop level cannot exceed 1.0, and will likely always be set to 1.0 unless you want to limit the upper drive level. The start level is to be set as low as possible while still being able generate a Copyright 2012, 2013 McIntosh Applied Engineering, LLC 30 sufficient microphone signal that can be accurately analyzed. A value of 0.001 has been determined to work well, which will provide three orders of magnitude in the velocity range. Finally, the # points is usually set to a fairly small value, such as 20. Since the nonlinear behavior generally has a fairly simple behavior, greater detail provided by more points generally isn’t required. Also, if too many points are requested at high drive levels, this may cause the speaker to get too hot and burn out, so some care should be taken when deciding to drive the speaker hard for long periods of time. An example of nonlinear measurements of a highly resistive felt material at three frequencies, 100, 250, and 500 Hz is shown below. It’s readily seen that the curve for each frequency very nearly lie on top of each other. This is largely due to the real part of the impedance dominating the imaginary part, and the real part having very little frequency dependences at lower frequencies. 5e+006 real 100 (Hz) imag 100 (Hz) real 250 (Hz) imag 250 (Hz) real 500 (Hz) imag 500 (Hz) Impedance (Acoustic Ohms) 4e+006 3e+006 2e+006 1e+006 0 MARS 0 0.5 1 1.5 Particle velocity (m/s) 2 2.5 The behavior of the real part is very typical of the nonlinear behavior of resistive materials. At low velocities, the impedance is constant, and at higher frequencies, the resistance rises linearly with the velocity, forming a “linear nonlinearity”, if you don’t mind a term with a bit of contradiction. Then there is a parabolic transition between the two extreme regions. Setup The setup controls are where the sound cards and RS232 ports are specified. The sound cards are used for playing the excitation signal out to the speakers, and for recording the signals from the microphones for analysis. The serial RS232 COM ports are used for accessing the B&K NEXUS amplifier and the EXTECH thermocouple meter. Copyright 2012, 2013 McIntosh Applied Engineering, LLC 31 There are also a few other setup options that will be discussed. NOTE: these settings are saved to the Ares.cfg file when Ares exits, so they don’t have to be reset every time Ares is used. The setup controls are shown below. Recording device (connect to mics) The recording device is the PC sound card that measures the signal from the B&K NEXUS microphone amplifier. The microphone signal must be connected to the sound card inputs, sometimes labeled as “microphone” inputs. The left channel is to be connected to the NEXUS Ch 1 output, whose signal is to come from the microphone located in the MAE100-RTMIC-A rigid termination. The right channel is to be connected to the Ch2 output, whose signal is to come from the side microphone located in the MAE100-MICHLD-A sample holder. As mentioned under the microphone calibration section in the acquisition controls, it may be necessary to adjust the output type of the sound card to 2 channel, 16 bit 44100 Hz (CD Quality), and adjust the input level sensitivity. NOTE: If the sound cards change due to plugging or unplugging a USB sound card, the sound cards listed in the Setup controls will be inaccurate. They can be updated by selecting another option in the tab controls (such as Acquisition), and then selecting Setup again. This works for the other controls as well, such as the RS232 COM ports. Copyright 2012, 2013 McIntosh Applied Engineering, LLC 32 Playback device (connect to speaker) The playback device is the PC sound card that generates the audio signal for the MAE204USBSC-A stereo amplifier input that drives either the MAE100-LFSP-A low frequency speaker enclosure or the MAE100-HFSP-A high frequency speaker enclosure. NOTE: It has been observed that using the same USB sound card for both the recording device and the playback device doesn’t work well. If USB sound cards are being used, then it is likely that two different USB sound cards must be used. Ares does not have control over the sound card volume, and so it will likely be necessary to go into the Windows Control Panel and adjust the output level of the Playback device. It is recommended to set it to maximum. The discussion for the sound card calibration has some detail for setting the sound card input volume. Release sound card resource This option selects how the sound card resource is handled between calling the sound card device. It has been observed that some sound card drivers require that the device’s resource must be released between uses, and other drives cannot be released. If the sound cards don’t work with one condition, try the other. Select output channel behavior This option selects the behavior of the output to the playback device during an impedance measurement. (It does not select the behavior for the microphone calibration.) The left, right or both left and right options should be straightforward. The left=low freq, right=high freq option is a bit more complicated. It selects the output channel based on whether a low or high frequency measurement is being done. For a low frequency measurement (where the MAE100 apparatus stackup is for a low frequency measurement using the 150mm spacer between the sample holder and the rigid termination), the output on the playback device will only be on the left channel. For a high frequency measurement (where the MAE100 apparatus stackup is for a high frequency measurement using the 15mm spacer between the sample holder and the rigid termination), the output on the playback device will only be on the right channel. The left=low freq, right=high freq option is useful if both of the low and high frequency speaker enclosures are being used. However, if only one speaker enclosure is used for both the low and high frequencies, this option won’t be useful. Play fullscale chirp out L&R chans This button is helpful when setting the volume levels of the MAE200-AAMP-A stereo audio amplifier. It produces a fullscale (i.e. maximum sound card volume) chirp signal to be played out of the playback sound card. (The starting and ending chirp frequencies come from the Acquisition controls.) Copyright 2012, 2013 McIntosh Applied Engineering, LLC 33 The recommended use of this feature is: 1) connect the speaker enclosure(s) that is(are) to be used to the MAE200-AAMP-A sound card (leave the tops of the speaker enclosures open so the sound can easily radiate from the speaker) 2) turn the volume for ch1 and ch2 of the amplifier down to zero 3) press the Play fullscale chirp out L&R chans button to begin the chirp signal 4) slowly turn up the audio amplifier’s ch1 and ch2 volumes until the speaker on that channel is as loud as they can safely be without damaging them Step 4 is very subjective. It has been the author’s experience that if one listens carefully to the speaker, one can hear at what point the speaker starts generating nonlinear distortion. This is usually just beyond the maximum drive level that the speaker can handle without damaging itself. When that point is reached, back the volume down a little to the point where the distortion isn’t too severe and use that point as the maximum drive level for the speaker. Hopefully the speaker’s fuse will blow before the speaker is irreversibly damaged from being overdriven. If a speaker is damaged, spare replacements should have been provided with the MAE100, or can be ordered from MAE. Play/Record pulse from soundcards This button causes a very short tone burst to be played out the sound card (both the left and right channels), while simultaneously recording the microphone signals. (The signal is actually a 100ms 1kHz pulse at 1/40th of the maximum output level, followed by a 100ms 1kHz pulse at 1/4th of the maximum output level, followed by another 100ms 1kHz pulse at 1/40th of the maximum output level.) Place the microphones over the speaker so they can record the sound from the speaker. (The MAE100-MICCAL-A microphone calibrator holder can be used for this.) If the sound cards are working properly, the result should be something like that seen below. There will be two graphs, one for the left channel, and one for the right channel. 9000 output input 8000 7000 6000 5000 4000 3000 sound card level - LEFT 2000 1000 0 -1000 -2000 -3000 -4000 -5000 -6000 -7000 -8000 -9000 MARS 0 0.05 Copyright 2012, 2013 McIntosh Applied Engineering, LLC 0.1 0.15 Time (seconds) 0.2 0.25 34 The blue curve is the output signal, and the green curve is the input signal from the microphone. There are three very important aspects of the recorded signal that must be observed to verify that the sound cards are working properly. First, the input signal (green curve) must lag the output (blue curve) signal. Note that the large central recorded signal (green curve) starts after (i.e. to the right) the output signal (blue curve). If the central green pulse happens before the blue pulse, then there is a problem with the sound cards. 9000 output input 8000 7000 6000 5000 4000 3000 2000 sound card level - LEFT the central blue pulse must start before the central green pulse 1000 0 -1000 -2000 in this example, it does -3000 -4000 -5000 -6000 -7000 -8000 -9000 MARS 0 0.05 0.1 0.15 Time (seconds) 0.2 0.25 Second, the recorded (green) pulse must begin within 100 ms of the output (blue) signal. This can be easily seen by the requirement that the central green pulse must start within the central blue pulse. If it occurs after, there is too much delay in the recording sound card. 9000 output input 8000 7000 6000 5000 4000 3000 2000 sound card level - LEFT the central green pulse must start before the end of the central blue pulse 1000 0 -1000 -2000 in this example, it does -3000 -4000 -5000 -6000 -7000 -8000 -9000 MARS 0 0.05 0.1 0.15 Time (seconds) 0.2 0.25 Finally, the length of the recorded central (green) pulse must have the same 100ms length as the output central (blue) pulse. This can be verified by observing the length of the large green pulse to be the same as the large blue pulse. Copyright 2012, 2013 McIntosh Applied Engineering, LLC 35 9000 output input 8000 7000 6000 5000 4000 3000 sound card level - LEFT 2000 the length (in seconds) of the central green pulse must be the same as the length of the central blue pulse 1000 0 -1000 -2000 -3000 -4000 -5000 in this example, they are the same length -6000 -7000 -8000 -9000 MARS 0 0.05 0.1 0.15 Time (seconds) 0.2 0.25 Presently these requirements are not automatically verified, but can only be verified by observing the Play/Record pulse from soundcards graphs. Examples of the sound cards not behaving properly are shown below. In the first two graphs, the recorded (green) pulse is happening before the output (blue) pulse. And in all three examples, the length of the green pulse is shorter than 100ms. (Note that this problem was cleared up by rebooting the computer, but in some instances you may need a different sound card with better driver behavior.) 10000 10000 output input output input 8000 6000 5000 sound card level - LEFT sound card level - LEFT 4000 0 2000 0 -2000 -4000 -5000 -6000 -8000 -10000 MARS 0 0.05 0.1 0.15 Time (seconds) 0.2 0.25 MARS 0 0.05 0.1 0.15 Time (seconds) 0.2 0.25 output input 8000 6000 sound card level - LEFT 4000 2000 0 -2000 -4000 -6000 -8000 -10000 MARS 0 0.05 0.1 0.15 Time (seconds) 0.2 0.25 RS232 COM port for B&K NEXUS This listbox is where the COM port for the B&K NEXUS microphone amplifier is specified. The B&K NEXUS must be connected to an RS232 COM port so that its microphone gain levels can be controlled. Copyright 2012, 2013 McIntosh Applied Engineering, LLC 36 NOTE: As already mentioned with the sound card devices, if the PC’s RS232 configuration changes, the Setup controls can be updated by selecting another option in the tab controls (such as Acquisition), and then selecting Setup again. IMPORTANT NOTE: The NEXUS must be properly setup. This includes: - the correct microphone sensitivity levels must be entered - the serial interface for the NEXUS must be set to 2400 BAUD with echo turned on. - the power supply levels for the microphones must be correctly setup - the high and low pass filters should be set to as wide a range as the start and stop frequencies The microphone sensitivities are provided on their calibration sheets. An example of a calibration sheet for a microphone with a sensitivity of 1.486 mV/Pa is shown below. The NEXUS setup screen for entering the microphone sensitivities is shown below. (Note that the microphones entered had sensitivities of 1.576 and 1.376 mV/Pa. Neither one was the microphone from the example calibration sheet above.) The NEXUS setup screens for the serial port, transducer supplies, high pass and low pass filter settings, and finally the rear electrical connections are shown below for reference. Note that these settings can be saved using the Store/Recall Set-up feature. Copyright 2012, 2013 McIntosh Applied Engineering, LLC 37 RS232 COM port for EXTECH 421509 or temperature The air temperature is needed for computing the flow impedance. It is provided in one of two ways. Either an EXTECH 421509 meter is used to read the temperature from a thermocouple mounted in the MAE100-RTMIC-A rigid termination, or by manually specifying the temperature. The selection is made by using the RS232 COM port for EXTECH 421509 listbox. If a valid COM port is selected, then the temperature is read from the meter’s thermocouple (T1 or T2 must be selected). If Not present is selected, then the temperature is to be manually entered. If a valid COM port is selected, then the Test thermocouple meter button can be used to test the COM port connection to the meter. If the test is not successful, then you must verify that the meter is connected to the correct COM port, the meter is turned on, and that the thermocouple is connected into the specified T1 or T2 channel. A photo of the thermocouple mounted in the rigid termination is shown below. The metal thermocouple tip must not make physical contact with the brass material. Also, care must be taken to ensure that the thermocouple tip doesn’t become damaged when the rigid termination is placed on the MAE100 stackup pieces. Copyright 2012, 2013 McIntosh Applied Engineering, LLC 38 Photos of the thermocouple meter is shown below with a thermocouple plugged into the T2 channel. Apparatus to use This option selects which apparatus is being used for the flow impedance measurements. Presently only the MAE100 is being supplied by MAE. The other option is a DP, which is an older device which is not commercially available. Plotting The plotting section allows for the measured data sets to be plotted. The controls for this section are shown below. Copyright 2012, 2013 McIntosh Applied Engineering, LLC 39 An asterisk * to the left of a data set name indicates that data set will be plotted. Data sets are selected or de-selected for plotting by - click on the data set name in the list - check or uncheck the plot data for selected data set checkbox Linear data and nonlinear data are plotted on separate graphs. This is necessary because linear data is plotted with a frequency abscissa axis, and nonlinear data is plotted with a particle velocity abscissa axis. The quantities that are plotted are those acquired during the measurements. The one exception to this is the transmission loss (TL). This is a quantity that is computed from the flow impedance and sample area. When the right mouse button is used to click on a graph, several plotting options appear in a popup menu. This menu is shown below. These options can be used to copy the data (in text format) for individual curves, copy the entire graph as an image, zoom into the graphs, or autoscale the graph. Copyright 2012, 2013 McIntosh Applied Engineering, LLC 40 Files/Clipboard The Files/Clipboard section allows for individual data files to be saved from or loaded into the module instance. Note that all of the data in the module will be saved to a *.ARES file and none of them explicitly need to be exported. However, there are occasions when it’s useful to do so, especially for the sample holder impedance data. The controls for this section are shown below. Microphone calibration files The microphone calibration data from the Acquisition/microphone calibration measurement can be exported or imported from a file using the Save or Load buttons. It is not expected that multiple sets of microphones or sound cards will be used, so exporting/importing the microphone calibration data may not have great use. However, this can be useful if you’d like to see if the behavior of the microphone calibration (which is dependent on the recording sound card as well as the microphones) is stable over time. Note that the microphone calibration data is automatically saved to the ARES.cfg file when Ares exists, so any changes to the microphone calibration data should be present when Ares is re-run. Sample holder impedance files These Save or Load buttons export or import the sample holder impedance data. This feature is useful if the samples that are being tested are being mounted by different types of holders. In this case, a single sample holder impedance data set isn’t sufficient. Use these buttons to save/load the sample impedance to a file so you don’t have to remeasure it every time you change the sample holder. As with the microphone calibration data, the current sample holder impedance data is saved to the ARES.cfg file when Ares exits, and is reloaded when Ares is run again. Copyright 2012, 2013 McIntosh Applied Engineering, LLC 41 Data sets The Save or Load buttons under the Data sets section export or import the material impedance data to *.ARES_ZF files. This feature is useful to maintain individual impedance data files for each material. These files are also useful for importing into the Acoustic material and Acoustic resistor elements in the modeler module so exact measured impedance data can be used in a model. Copyright 2012, 2013 McIntosh Applied Engineering, LLC 42 Using the 1” sample cutter The MAE100 comes with a 1” cutter that’s been modified to create samples with a slightly reduced diameter so samples cut with it will easily fit into the MAE100 tubes. The photos below show an example of using some paper to help hold some felt material in position while a sample is cut from it. For some material, using a drill press to spin the cutter to cut through the material works well. For other material, using the cutter to push through the material may work better. When used this way, the drill press is used more as a press than a drill. Only experimentation will tell which method will work best for your material. Either way, mounting the cutter in a drill press is helpful for producing a sample. When using the cutter as a press cutter, don’t turn the drill press on, but simply press down firmly with the cutter until it pushes through the material. Experimenting with more or less sacrificial paper can produce better results. NOTE: Using the cutter as a punch where a hammer or mallet is used to punch the cutter through a material will likely result in bending the cutter shaft and it NOT recommended. Copyright 2012, 2013 McIntosh Applied Engineering, LLC 43 Step-by-Step Flow Impedance Measurement Example Setup 1) Select sound cards for recording and playback. 2) Use Play fullscale chirp out L&R chans to verify that the correct playback sound card was selected and set the volumes of the stereo amplifier. 3) Use the Play/Record pulse from soundcards button to verify that the correct recording sound card was selected, and that the sound cards are behaving properly. You’ll probably want to mount the microphones in the MAE100-MICCAL-A microphone calibrator as shown below on the left. You’ll also need to verify that the sound cards are working properly, as described in the Setup section where the Play/Record pulse from soundcards button operation is described. The recorded pulse should look like the image below on the right. 9000 output input 8000 7000 6000 5000 4000 3000 sound card level - LEFT 2000 1000 0 -1000 -2000 -3000 -4000 -5000 -6000 -7000 -8000 -9000 MARS 0 0.05 0.1 0.15 Time (seconds) 0.2 0.25 3) Select NEXUS and thermocouple meter RS232 ports Select the RS232 COM port for the NEXUS microphone amplifier. If the EXTECH thermocouple meter is being used, the COM port and thermocouple channel for that will also have to be selected. The Test thermocouple meter button can be used to verify the thermocouple is properly connected to the PC. 4) Select the MAE100 as the Apparatus to use in the Setup section Make sure the MAE100 device is selected in the Setup section Copyright 2012, 2013 McIntosh Applied Engineering, LLC 44 5) Microphone calibration If the microphones haven’t been calibrated with the selected sound cards, they will need to be calibrated. See the microphone calibration section for details. 0.5 Magnitude (dB) Phase (deg) 40 0.45 0.4 30 Phase (deg) Magnitude (dB) 0.35 20 0.3 10 0.25 0.2 0 0.15 0 MARS 1000 2000 3000 Frequency (Hz) 4000 5000 6000 MARS 0 1000 2000 3000 Frequency (Hz) 4000 5000 6000 6) Sample holder impedance measurement If the sample holder impedance is not to be included in the sample impedance, the sample holder impedance must be measured. Below are a series of pictures showing two sample holder disks being mounted in the sample holder for this measurement. Note that the blue putty is necessary to not only hold the disks in place so they don’t vibrate, but it also prevents sound from passing around the perimeter of the disks and not through the sample area. Copyright 2012, 2013 McIntosh Applied Engineering, LLC 45 The parameters for the sample holder are 2mm thickness (each disk is 1mm thick, and there are 2 disks being used), and the diameter is 10mm (the diameter of the open hole in the disk). Press the Perform measurement button. Once the measurement is complete, you should be able to graph the results by selecting Z real imag and see a plot something like that shown below. 3e+006 real imag 2.5e+006 note that the real part is positive, indicating valid data. if the real part is ever negative, that indicates an error Impedance (Acoustic Ohms) 2e+006 1.5e+006 1e+006 500000 0 -500000 MARS 0 1000 2000 Copyright 2012, 2013 McIntosh Applied Engineering, LLC 3000 Frequency (Hz) 4000 5000 6000 at very low frequencies, the impedance has gone negative, indicating that Ares is having a hard time accurately measuring such small impedances. 46 7) Sample impedance measurement After the sample holder impedance has been measured, you now remove the sample holder disks and mount the sample between them as shown in the image sequence below. the sample cutter is shown to remind you how to make a sample from a bulk sheet of material this final picture shows the high frequency stackup of the MAE100 components Copyright 2012, 2013 McIntosh Applied Engineering, LLC 47 For a highly resistive material such as the felt tested, the impedance should look something like that shown below. Again, note that the real part is positive. Any negative values in the real part indicate that something is wrong with the measurement. 4e+006 real imag Impedance (Acoustic Ohms) 3e+006 2e+006 1e+006 0 MARS 0 1000 Copyright 2012, 2013 McIntosh Applied Engineering, LLC 2000 3000 Frequency (Hz) 4000 5000 6000 48 For more information about Ares and acoustical measurement and modeling tools and services, contact MAE at: [email protected] [email protected] (678) 234-5079 Or see us at MAELLC.COM. Copyright 2012, 2013 McIntosh Applied Engineering, LLC 49