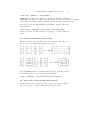
1
E. E. Holmes and E. J. Ward Analysis of multivariate timeseries using the MARSS package version 1.1 October 18, 2010 Mathematical Biology Program Northwest Fisheries Science Center, Seattle, WA Holmes, E. E. and E. J. Ward. 2010. Analysis of multivariate time-series using the MARSS package. NOAA Fisheries, Northwest Fisheries Science Center, 2725 Montlake Blvd E., Seattle, WA 98112. Contacts [email protected] and [email protected] V Preface The initial motivation for our work with MARSS models was a collaboration with Rich Hinrichsen. Rich developed a framework for analysis of multi-site population count data using MARSS models and bootstrap AICb (Hinrichsen and Holmes, 2009). Our work (EEH and EJW) extended Rich’s framework, made it more general, and led to the development of a parametric bootstrap AICb for MARSS models, which allows one to do model-selection using datasets with missing values (Ward et al., 2009; Holmes and Ward, 2010). Later, we developed additional algorithms for simulation and confidence intervals. Discussions with Mark Scheuerell led to an extensive revision of the EM algorithm and to the development of a general EM algorithm for constrained MARSS models (Holmes, 2010). Discussions with Mark also led to a complete rewrite of the model specification so that the package could be used for MARSS models in general—rather than simply the form of MARSS model used in our (EEH and EJW) applications. Many collaborators have helped test the package; we thank especially Yasmin Lucero, Mark Scheuerell, Kevin See, and Brice Semmens. Development of the code into a R package would not have been possible without Kellie Wills, who wrote the much of the code outside of the algorithm functions. The case studies used in this manual were developed for workshops on analysis of multivariate time-series data given at the Ecological Society meetings since 2005 and taught by us (EEH and EJW) along with Yasmin Lucero, Stephanie Hampton, Brice Semmens, and Mark Scheuerell. The case study on extinction estimation and trend estimation was initially developed by Brice Semmens and later extended by us for this manual. The algorithm behind the TMU figure in Chapter 8 was developed during a collaboration with Steve Ellner (Ellner and Holmes, 2008). EEH and EJW are research scientists at the Northwest Fisheries Science Center in the Mathematical Biology program. This work was conducted as part of our jobs at the Northwest Fisheries Science Center, a research center for NOAA Fisheries which is a US federal government agency. A CAMEO grant from NOAA Fisheries supported Kellie Wills. During the initial stages of this work, EJW was supported on a post-doctoral fellowship from the National Research Council. You are welcome to use the code and adapt it with attribution. It may not be used in any commercial applications. Links to more code and publications on MARSS applications can be found by following the links at EEH’s website http://faculty.washington.edu/eeholmes. Links to our papers that use these methods can also be found at the same website. Contents 1 The MARSS package . . . . . . . . . . . . . . . . . . . . . . . . . . . . . . . . . . . . . . 1.1 What does the MARSS package do? . . . . . . . . . . . . . . . . . . . . . . . 1.2 How to get started (quickly) . . . . . . . . . . . . . . . . . . . . . . . . . . . . . . 1.3 Important notes about the algorithms . . . . . . . . . . . . . . . . . . . . . . 1.4 Troubleshooting . . . . . . . . . . . . . . . . . . . . . . . . . . . . . . . . . . . . . . . . . 1 2 2 3 4 2 Overview of the package functions . . . . . . . . . . . . . . . . . . . . . . . . . 2.1 The MARSS() function . . . . . . . . . . . . . . . . . . . . . . . . . . . . . . . . . . . . 2.2 Core functions for fitting a MARSS model . . . . . . . . . . . . . . . . . . 2.3 Functions for a fitted marssMLE object . . . . . . . . . . . . . . . . . . . . 2.4 Functions for marssm objects . . . . . . . . . . . . . . . . . . . . . . . . . . . . . 7 7 8 8 9 3 The MARSS() function . . . . . . . . . . . . . . . . . . . . . . . . . . . . . . . . . . . . 11 3.1 Process equation constraint options . . . . . . . . . . . . . . . . . . . . . . . . 12 3.2 Observation equation constraints . . . . . . . . . . . . . . . . . . . . . . . . . . 16 4 Model specification in the core functions . . . . . . . . . . . . . . . . . . 19 4.1 The fixed and free components of the model parameters . . . . . . 19 4.2 Limits on the model forms that can be fit . . . . . . . . . . . . . . . . . . 21 5 Algorithms used in the MARSS package . . . . . . . . . . . . . . . . . . . 5.1 Kalman filter and smoother . . . . . . . . . . . . . . . . . . . . . . . . . . . . . . . 5.2 The exact likelihood . . . . . . . . . . . . . . . . . . . . . . . . . . . . . . . . . . . . . 5.3 Maximum-likelihood parameter estimation . . . . . . . . . . . . . . . . . . 5.4 Parametric and innovations bootstrapping . . . . . . . . . . . . . . . . . . 5.5 Simulation and forecasting . . . . . . . . . . . . . . . . . . . . . . . . . . . . . . . . 5.6 Model selection . . . . . . . . . . . . . . . . . . . . . . . . . . . . . . . . . . . . . . . . . 6 Examples . . . . . . . . . . . . . . . . . . . . . . . . . . . . . . . . . . . . . . . . . . . . . . . . . . 29 6.1 Fitting different MARSS models to a dataset . . . . . . . . . . . . . . . 29 6.2 Printing and summarizing models and model fits . . . . . . . . . . . . 36 23 23 24 25 26 26 27 VIII Contents 6.3 6.4 6.5 6.6 6.7 6.8 Confidence intervals on a fitted model . . . . . . . . . . . . . . . . . . . . . . Vectors of just the estimated parameters . . . . . . . . . . . . . . . . . . . Determine which variance elements have not converged . . . . . . . Bootstrap parameter estimates . . . . . . . . . . . . . . . . . . . . . . . . . . . . Data simulation . . . . . . . . . . . . . . . . . . . . . . . . . . . . . . . . . . . . . . . . . Bootstrap AIC . . . . . . . . . . . . . . . . . . . . . . . . . . . . . . . . . . . . . . . . . . 36 38 38 41 42 43 7 Case study instructions . . . . . . . . . . . . . . . . . . . . . . . . . . . . . . . . . . . . 45 8 Case Study 1: Count-based Population Viability Analysis using corrupted data . . . . . . . . . . . . . . . . . . . . . . . . . . . . . . . . . . . . . . 8.1 The Problem . . . . . . . . . . . . . . . . . . . . . . . . . . . . . . . . . . . . . . . . . . . . 8.2 Simulated data with process and observation error . . . . . . . . . . . 8.3 Maximum-likelihood parameter estimation . . . . . . . . . . . . . . . . . . 8.4 Probability of hitting a threshold Π(xd , te ) . . . . . . . . . . . . . . . . . 8.5 Certain and uncertain regions . . . . . . . . . . . . . . . . . . . . . . . . . . . . . 8.6 More risk metrics and some real data . . . . . . . . . . . . . . . . . . . . . . 8.7 Confidence intervals . . . . . . . . . . . . . . . . . . . . . . . . . . . . . . . . . . . . . 8.8 Comments . . . . . . . . . . . . . . . . . . . . . . . . . . . . . . . . . . . . . . . . . . . . . . 47 47 48 51 56 60 62 64 65 9 Case study 2: Combining multi-site and subpopulation data to estimate regional population dynamics . . . . . . . . . . . . . 9.1 The problem . . . . . . . . . . . . . . . . . . . . . . . . . . . . . . . . . . . . . . . . . . . . 9.2 Analysis assuming a single total Puget Sound population . . . . . 9.3 Changing the assumption about the observation variances . . . . 9.4 Analysis assuming north and south subpopulations . . . . . . . . . . 9.5 Using MARSS() to fit other population structures . . . . . . . . . . . . 9.6 Discussion . . . . . . . . . . . . . . . . . . . . . . . . . . . . . . . . . . . . . . . . . . . . . . 67 67 69 74 77 81 83 10 Case Study 3: Using MARSS models to identify spatial population structure and covariance . . . . . . . . . . . . . . . . . . . . . . . 10.1 The problem . . . . . . . . . . . . . . . . . . . . . . . . . . . . . . . . . . . . . . . . . . . . 10.2 How many distinct subpopulations? . . . . . . . . . . . . . . . . . . . . . . . . 10.3 Is Hood Canal separate? . . . . . . . . . . . . . . . . . . . . . . . . . . . . . . . . . 87 87 88 91 11 Case Study 5: Using state-space models to analyze noisy animal tracking data . . . . . . . . . . . . . . . . . . . . . . . . . . . . . . . . . . . . . . . 95 11.1 A simple random walk model of animal movement . . . . . . . . . . . 95 11.2 The problem . . . . . . . . . . . . . . . . . . . . . . . . . . . . . . . . . . . . . . . . . . . . 96 11.3 Estimate locations from bad tag data . . . . . . . . . . . . . . . . . . . . . . 96 11.4 Comparing turtle tracks to proposed fishing areas . . . . . . . . . . . 100 11.5 Using specialized packages to analyze tag data . . . . . . . . . . . . . . 101 A Textbooks and articles that use MARSS modeling for population modeling . . . . . . . . . . . . . . . . . . . . . . . . . . . . . . . . . . . . . . . 103 Contents IX B Package MARSS: Object structures . . . . . . . . . . . . . . . . . . . . . . . 107 B.1 Model objects: class marssm . . . . . . . . . . . . . . . . . . . . . . . . . . . . . . 107 B.2 Wrapper objects: class popWrap . . . . . . . . . . . . . . . . . . . . . . . . . . . 108 B.3 ML estimation objects: class marssMLE . . . . . . . . . . . . . . . . . . . . 109 C Package MARSS: The top-level MARSS functions and the base functions . . . . . . . . . . . . . . . . . . . . . . . . . . . . . . . . . . . . . . . . . 111 References . . . . . . . . . . . . . . . . . . . . . . . . . . . . . . . . . . . . . . . . . . . . . . . . . . . . . 113 Index . . . . . . . . . . . . . . . . . . . . . . . . . . . . . . . . . . . . . . . . . . . . . . . . . . . . . . . . . . 117 1 The MARSS package MARSS stands for Multivariate Auto-Regressive(1) State-Space. The MARSS package is designed for linear MARSS models with Gaussian errors. This class of model is extremely important in the study of linear stochastic dynamical systems, and these models are important in many different fields, including economics, engineering, genetics, physics and ecology. Appendix A gives a selection of textbooks on MARSS models. A MARSS model, with Gaussian errors, takes the form: xt = Bxt−1 + u + vt , where vt ∼ MVN(0, Q) yt = Zxt + a + wt , where wt ∼ MVN(0, R) x1 ∼ MVN(π, V1 ) (1.1a) (1.1b) (1.1c) The model includes random variables, parameters and data: xt is a m × 1 column vector of the hidden states at time t. It is a realization of the random variable Xt . vt is a m × 1 column vector of the process errors at time t. It is a realization from a multivariate normal random variable with mean 0 and Σ = Q. yt is a n × 1 column vector of the observed data at time t. wt is a n×1 column vector of the non-process errors at time t. It is a realization from a multivariate normal random variable with mean 0 and Σ = R. B is a parameter and is a m × m matrix. u is a parameter and is a m × 1 column vector. Q is a parameter and is a m × m variance-covariance matrix. Z is a parameter and is a n × m matrix. a is a parameter and is a n × 1 column vector. R is a parameter and is a n × n variance-covariance matrix. π is either a parameter or a fixed prior. It is a m × 1 matrix. V1 is a fixed value. It is a m × m variance-covariance matrix. The meaning of the parameters in the MARSS models depends on the application for which the MARSS model is being used. In the case studies, we 2 1 The MARSS package show examples of MARSS models used to analyze population count data and animal tracking data, and Appendix A gives a selection of papers from the ecological literature. However, the MARSS package is not specific to population modeling applications. The functions in the MARSS package are generic functions for fitting MARSS models have forms like: 1.1 What does the MARSS package do? The MARSS package is designed to fit unconstrained and constrained MARSS models. A constrained MARSS model is one in which some of the parameters are constrained in the sense that they have fixed, free and/or shared values. For example, let M and m be arbitrary matrix and column vector parameters. The MARSS package allows one to specify and fit models where M and m have shared values and fixed values. For example, d a 0.9 c d M = −1.2 a 0 and m = e 0 c b 2.2 Version 1.x of the MARSS package fits models via maximum-likelihood using a Kalman-EM algorithm1 . The Kalman-EM algorithm is used because it gives robust estimation for datasets replete with missing values and for models with various constraints. The MARSS package also supplies functions for bootstrap and approximate confidence intervals, parametric and non-parametric bootstrapping, model selection (AIC and bootstrap AIC), simulation, and bootstrap bias correction. Version 1.0 does not allow B or Z to be estimated. Version 2.0 is currently being tested and it will allow B and Z estimation along with less constrained forms of Q and R. 1.2 How to get started (quickly) Install the MARSS package and then type library(MARSS) at the command line to load the package. Read the first 2-4 pages of Chapter 3 then read through a couple of the examples in Chapter 6. Get your data into a matrix (not dataframe) with time going across the columns and any non-yy columns (like year) removed. Replace any missing time steps with a missing value holder (like NA or -99). Write your model down on paper and identify which 1 The package can also fit models via quasi-Newton methods based on R ’s optim function. This can be especially useful for finishing off a Kalman-EM estimate when the data to parameter ratio is high. However, when the ratio of data to parameters is low (as in many ecological applications), the quasi-Newton algorithm tends to be fragile and sensitive to initial conditions. 1.3 Important notes about the algorithms 3 parameters correspond to B, u, Q, Z, a, and R in the MARSS model (Equation 1.1). Call the MARSS() function (Chapter 3) using your data and using the constraint argument to specify the form of the parameters (Chapter 3 shows the options for the forms). 1.3 Important notes about the algorithms MARSS 1.0 provides maximum-likelihood via an EM algorithm using the Kalman filter/smoother. All code is in native R . Thus the model fitting is slow (relatively). Writing the algorithms in C would speed them up considerably, but we have no plans to do that. EM algorithms will quickly get in the vicinity of the maximum likelihood, but the final approach to the maximum is generally slow relative to quasi-Newton methods. On the flip side, EM algorithms are quite robust to initial conditions choices unlike quasi-Newton methods which can be sensitive to initial condition choices. The MARSS package allows one to use the BFGS method in optim() to fit MARSS models. The DLM package (search for it on CRAN) also provides fitting via quasi-Newton methods (and Bayesian methods). Restricted maximum-likelihood algorithms are also available for AR-1 state-space models, both univariate (Staples et al., 2004) and multivariate (Hinrichsen, 2009). REML can give parameter estimates with lower variance than plain maximum-likelihood algorithms. However, the algorithms for REML when there are missing values are not currently available. Another maximum-likelihood method is data-cloning which adapts MCMC algorithms used in Bayesian analysis for maximum-likelihood estimation (Lele et al., 2007). Data with cycles, from say internal dynamical interactions, are difficult to analyze, and both REML and Kalman-EM approaches will give poor estimates for this type of data. The slope method (Holmes, 2001), is more ad-hoc but is relatively robust to those problems. Holmes et al. (2007) used the slope method in a large study of data from endangered and threatened species; Ellner and Holmes (2008) showed that the slope estimates are close to the theoretical minimum uncertainty. However estimates using the slope method are not easily extended to multi-variate data and it is not a true maximumlikelihood method. Missing values are seamlessly accommodated with the MARSS package. Simply specify the way missing values are denoted in the data set (default is miss.value=-99). The likelihood computations are exact and will deal appropriately with missing values. The presence of missing values, however, limits the R matrix to being a diagonal matrix (if estimated) and the Z matrix to being fixed. In addition, no innovations2 bootstrapping can be done if there are missing values. Instead parametric bootstrapping must be used. 2 referring to the non-parametric bootstrap used in the package 4 1 The MARSS package You should be aware that maximum-likelihood estimates of variance in MARSS models are fundamentally biased, regardless of the algorithm used. This bias is more severe when one or the other of R or Q is very small, and the bias does not go to zero as sample size goes to infinity. The bias arises because variance is constrained to be positive. Thus if R or Q is essentially zero, the mean estimate will not be zero and thus the estimate will be biased high while the corresponding bias of the other variance will be biased low. You can generate unbiased variance estimates using a bootstrap estimate of the bias. The function MARSSparamCIs() will do this. However be aware that adding an estimated bias to a parameter estimate will lead to an increase in the variance of your parameter estimate. The amount of variance added will depend on sample size. 1.4 Troubleshooting There are two numerical errors and warnings that you may see when fitting MARSS models: ill-conditioning and degeneracy. The Kalman and EM algorithms need inverses of matrices. If those matrices become ill-conditioned, for example all elements are close to the same value, then the algorithm becomes unstable. MARSS will print warning messages if the algorithm is becoming unstable and you can set control$trace=1, to see details of where the algorithm is becoming unstable. Whenever possible, you should avoid using shared π values in your model3 . The way our algorithm deals with V1 tends to make this case unstable, especially if R is not diagonal. In general, estimation of a non-diagonal R is more difficult, more prone to ill-conditioning, and more data-hungry. The second numerical error you may see is a degeneracy warning. This means that one of the elements on the diagonal of your Q or R matrix are going to zero (are degenerate). It will take the EM algorithm forever to get to zero. Since the likelihood can spike up very fast near a degenerate solution, the log-likelihood value reported will be too small because it will include estimates of the degenerate Q or R diagonal elements that are very small but nonetheless non-zero. BFGS will have the same problem, although it will often get a bit closer to the degenerate solution. If you are using method="kem", MARSS will warn you if it looks like the solution is degenerate and you can use the function find.degenerate() to find the degenerate elements or look at the $errors element of the output. The algorithms in the MARSS 1.0 package are designed for cases where the Q and R diagonals are all non-minuscule. For example, the EM update equation for U will grind to a halt (not update U) if Q is tiny (like 1E-7). Conversely, the BFGS equations are likely to miss the maximum-likelihood when R is tiny because then the likelihood surface becomes hyper-sensitive 3 An example of a π with shared values is π = a a a . 1.4 Troubleshooting 5 to π. The solution is to use the degenerate likelihood function for the likelihood calculation and the EM update equations. However this solution will not be implemented until MARSS 2.0. These concerns affect the likelihood value reported at the maximum-likelihood parameters. The actual parameter estimates will change very little on the absolute scale, so your point estimates, confidence intervals, bias estimates, etc. are still valid. Model selection though will be dubious because the likelihoods reported by MARSS will not be the real maximums. 2 Overview of the package functions The MARSS package is object-based. It has two main types of objects: a model object (class marssm) and a maximum-likelihood fitted model object (class marssMLE). A marssm object specifies the structure of the model to be fitted. It is an R code version of the MARSS equation (Equation 1.1). A marssMLE object specifies both the model and the information necessary for fitting (initial conditions, controls, method). If the model has been fitted, the marssMLE object will also have the parameter estimates and (optionally) confidence intervals and bias. 2.1 The MARSS() function The function MARSS() is an interface to the core fitting functions in the MARSS package. It allows a user to fit a MARSS model using a list to describe the model structure. It returns marssm and marssMLE objects which the user can later use in other functions, e.g. simulating or computing bootstrap confidence intervals. MLEobj=MARSS(data, constraint=list(), ..., fit=TRUE) This function will fit a MARSS model to the data using a constraint list which is a list describing the structure of the model parameter matrices. The default model has a one-to-one correspondence between the state processes and observation time series (Z is the identity matrix). The default has a diagonal observation error matrix (R) and an unconstrained process-error matrix (Q). The output is a marssMLE object where the estimated parameter matrices are in MLEobj$par. If fit=FALSE, it returns a minimal marssMLE object that is ready for passing to a fitting function (below) but with no par element. 8 2 Overview of the package functions 2.2 Core functions for fitting a MARSS model The following core functions are designed to work with ‘unfitted’ marssMLE objects, that is a marssMLE object without the par element. Users do not normally need to call the MARSSkem or MARSSoptim functions since MARSS() will call those. Below MLEobj means the argument is a marssMLE object. Note, these functions can be called with a marssMLE object with a par element, but these functions will overwrite that element. MLEobj=MARSSkem(MLEobj) This will fit a MARSS model via the KalmanEM algorithm to the data using a properly specified marssMLE object, which has data, the marssm object and the necessary initial condition and control elements. See the appendix on the object structures in the MARSS package. MARSSkem does no error-checking. See is.marssMLE(). MARSSkem uses MARSSkf described below. MLEobj=MARSSoptim(MLEobj) This will fit a MARSS model via the BFGS algorithm provided in optim(). This requires a properly specified marssMLE object, such as would be passed to MARSSkem. MLEobj=MARSSmcinit(MLEobj) This will perform a Monte Carlo initial conditions search and update the marssMLE object with the best initial conditions from the search. is.marssMLE(MLEobj) This will check that a marssMLE object is properly specified and ready for fitting. This should be called before MARSSkem or MARSSoptim is called. This function is not typically needed if using MARSS() since MARSS() builds the model object for the user and does error-checking on model structure. 2.3 Functions for a fitted marssMLE object The following functions use a marssMLE object that has a populated par element, i.e. a marssMLE object returned from one of the fitting functions (MARSS, MARSSkem, MARSSoptim). Below modelObj means the argument is a marssm object and MLEobj means the argument is a marssMLE object. Type ?function.name to see information on function usage and examples. kf=MARSSkf(data, parList, ...) This will compute the expected values of the hidden states given data via the Kalman filter (to produce estimates conditioned on 1 : t − 1) and the Kalman smoother (to produce estimates conditioned on 1 : T ). The function also returns the exact likelihood of the data conditioned on parList. A variety of other Kalman filter/smoother information is also output (kf is a list of output); see ?MARSSkf for more details. MLEobj=MARSSaic(MLEobj) This adds model selection criteria, AIC, AICc, and AICb, to a marssMLE object. 2.4 Functions for marssm objects 9 boot=MARSSboot(MLEobj) This returns a list containing bootstrapped parameters and data via parametric or innovations bootstrapping. MLEobj=MARSShessian(MLEobj) This adds a numerically estimated Hessian matrix to a marssMLE object. MLEobj=MARSSparamCIs(MLEobj) This adds standard errors, confidence intervals, and bootstrap estimated bias for the maximum-likelihood parameters using bootstrapping or the Hessian to the passed in marssMLE object. sim.data=MARSSsimulate(parList) This returns simulated data from a MARSS model specified via a list of parameter matrices in parList (this is a list with elements Q, R, U, etc). Typically one would pass in parList using the par element in an marssMLE object (i.e., MLEobj$par), but you could also construct the list manually. paramVec=MARSSvectorizeparam(MLEobj) This returns the estimated (and only the estimated) parameters as a vector. This is useful for storing the results of simulations and for writing functions that fit MARSS models using R’s optim function. new.MLEobj=MARSSvectorizeparam(MLEobj, paramVec) This will return a marssMLE object in which the estimated parameters (which are in MLEobj$par along with the fixed values) are replaced with the values in paramVec. 2.4 Functions for marssm objects is.marssm(modelObj) This will check that the free and fixed matrices in a marssm object are properly specified. This function is not typically needed if using MARSS() since MARSS() builds the marssm object for the user and does error-checking on model structure. summary(modelObj) This will print the model parameter matrices showing the fixed values (in parentheses) and the location of the estimated elements. The estimated elements are shown as g1, g2, g3, ... which indicates which elements are shared (i.e., forced to have the same value). For example, an i.i.d. R matrix would appear as a diagonal matrix with just g1 on the diagonal. 3 The MARSS() function The MARSS() function is an interface to the core functions and allows users to fit MARSS models using a list to specify the model structure. The MARSS model takes the form xt = Bxt−1 + u + vt , where vt ∼ MVN(0, Q) yt = Zxt + a + wt , where wt ∼ MVN(0, R) x1 ∼ MVN(π, V1 ) (3.1a) (3.1b) (3.1c) The y is a n × T matrix of observations and the x is a m × T matrix of hidden states. For example, a y data matrix of 3 inputs (n = 3) measured for 10 time steps would look like 1 2 −99 −99 3.2 ... 8 3 −99 5.1 ... 5 y = 2 5 1 −99 2 2.2 −99 ... 7 where -99 denotes a missing value. x might look like (here m = 2): 0.8 2.2 3 2.8 3.2 ... 7.1 x= 1.5 2.5 2.5 2.2 3.1 ... 6 In the process equation, B is a m × m matrix, u and vt are m × 1 matrices, and Q is a m × m variance-covariance matrix for the vt process errors. In the observation equation, Z is a n × m design matrix of zeros and ones where the row sums equal one1 . Z specifies which observation time series, yi,1:T , is associated with which hidden state process, xj,1:T . a and wt are n×1 matrices, and R is a n × n variance-covariance matrix for the wt observation errors. In the MARSS() function, the user specifies the model by passing in a parameter constraint list: 1 In our examples, Z is a design matrix but it can actually be any fixed matrix. 12 3 The MARSS() function MARSS(data, constraint=list(Z=Z.constraint, B=B.constraint, U=U.constraint, Q=Q.constraint, A=A.constraint, R=R.constraint, x0=pi.constraint, V0=V1.constraint) ) data must be a n × T matrix, that is time goes across columns. The argument constraint is a list, where the list elements for each model parameter can be a text string, vector of factors or matrix that specifies the form of the parameter. The defaults are Z.constraint="identity" each y in y corresponds to one x in x B.constraint="identity" no interactions between the x’s in x U.constraint="unequal" the u’s in u are all different Q.constraint="diagonal and unequal" process errors are independent but have different variances R.constraint="diagonal and equal" the observations are i.i.d. A.constraint="scaling" a is a set of scaling factors pi.constraint="unequal" all initial states are different V0.constraint="zero" the initial condition x1 is fixed but unknown Examples of the other possible constraint options for each parameter are listed below. We show the forms using m = 3 (the number of hidden state processes) and n = 3 (number of observation time series). 3.1 Process equation constraint options 3.1.1 B constraints In MARSS 1.0, B must be fixed. There are two ways that B can be fixed: B.constraint="identity" The B matrix is the identity matrix: 100 0 1 0 001 B.constraint=matrix(..., nrow=m, ncol=m) Passing in a m × m numeric matrix, means that B is fixed to the values in the matrix. The matrix must be numeric and all eigenvalues must fall within the unit circle2 . Using the string “zero”, sets B = 0. 3.1.2 u constraints 2 U.constraint="equal" There is only one value in u: u u u meaning all(abs(eigen(B)$values)>=1). 3.1 Process equation constraint options 13 U.constraint="unequal" or U.constraint="unconstrained" There are m values in u: u1 u2 u3 U.constraint=factor(c(...)) Here the constraint is specified as a length m character or numeric vector of class factor. The vector of factors specifies which values in u are shared. U.constraint=factor(c(1,1,2)) means that u has the following structure: u1 u1 u2 There are two values in u in this case. The factor levels can be either numeric or character. c(1,1,2) is the same as c("north","north","south"). U.constraint=matrix(..., nrow=m, ncol=1) Passing in a m × 1 numeric matrix, means that u is fixed to the values in the matrix. In MARSS 1.0, u cannot vary in time, even if fixed. u can be set to all zeros (a m × 1 matrix) by setting U.constraint="zero"; you might want to use this if you de-trended your data. U.constraint=matrix(..., nrow=m, ncol=1) Passing in a m × 1 character matrix, means that all elements in u are estimated. Those elements that share a name will be forced to be the same value. You can also pass in a matrix with fixed values and NAs. For example, matrix(c(0.1, NA, NA)): 0.1 NA NA The fixed values will be set to the fixed values and the elements specified by NAs will be estimated. The estimated elements are independent and not forced to be equal. 3.1.3 Q constraints Q.constraint="diagonal and equal" There is only one process variance value in this case: 2 σ 0 0 0 σ2 0 2 0 0 σ Q.constraint="diagonal and unequal" There are m process variance values in this case: 2 σ1 0 0 0 σ22 0 0 0 σ32 14 3 The MARSS() function Q.constraint="unconstrained" There are values on the diagonal and the off-diagonals of Q and the variances and covariances are all different: 2 σ1 σ1,2 σ1,3 σ1,2 σ22 σ2,3 2 σ1,3 σ2,3 σ3 There are m process variances and (m2 − m)/2 covariances in this case, so (m2 + m)/2 values to be estimated. Q.constraint="equalvarcov" There variance: 2 σ β β σ2 β β is one process variance and one co β β 2 σ Q.constraint=as.factor(c(...)) The constraint is specified as a length m character or numeric vector of class factor. This specifies that Q is diagonal and the vector of factors specifies which values on the diagonal are shared. For example, Q.constraint=factor(c(2,1,2)) means that Q takes the form: 2 σ2 0 0 0 σ12 0 0 0 σ22 Q.constraint=factor(c(1,1,2)) 2 σ1 0 0 means that Q takes the form: 0 0 σ12 0 0 σ22 The factor levels can be either numeric or character. c(1,1,2) is the same as c("north","north","south"). Q.constraint=matrix(..., nrow=m, ncol=m) Passing in a m × m matrix, means that Q is fixed to the values in the matrix. The matrix must be numeric. Note if m = 1, you still need to wrap its value in matrix() so that its class is matrix. You can also pass in a diagonal matrix with fixed values and NAs: NA 0 0 0 0.1 0 0 0 NA The fixed values will be set to the fixed values and the NAs will be estimated; the estimates are independent and not forced to be equal. The matrix must be diagonal (0s on the off-diagonals). 3.1 Process equation constraint options 15 3.1.4 π constraints This sets the constraints on the initial conditions, x1 . pi.constraint has the following options: pi.constraint="equal" There is only initial state value. π π π Warning: specifying shared values in π will tend to produce ill-conditioned matrices in the algorithm and lead to numerical instability. Avoid using pi.constraint="equal" if possible. pi.constraint="unequal" or pi.constraint="unconstrained" These are equivalent. There are m initial state parameters. π1 π2 π3 pi.constraint=factor(c(...)) The constraint is specified is a length m character or numeric vector of class factor. The vector of factors specifies which initial states have the same value. For example, factor(c(1,1,2)) means that π takes the form: π1 π1 π2 There are two initial state parameters in this case. The factor levels can be either numeric or character. c(1,1,2) is the same as c("n","n","s"). Warning: specifying shared values in π will tend to produce ill-conditioned matrices in the algorithm and lead to numerical instability. Avoid if possible. pi.constraint=matrix(..., nrow=m, ncol=1) Passing in a m × 1 numeric matrix, means that the initial states are fixed to the values in the matrix. You can set the initial states to zero by using pi.constraint="zero". You can also pass in a matrix with fixed values and NAs: 10 NA NA The fixed values will be set to the fixed values and the values specified by NAs will be estimated. 16 3 The MARSS() function 3.1.5 V1 constraints The initial state variance must be fixed. The default behavior is to treat x1 as fixed but unknown3 . In this case, V1 =0. You can also set V1 to a non-zero value but in that case π must be fixed. This would translate to using a fixed prior for the initial states. V0.constraint=matrix(..., nrow=m, ncol=m) Passing in a m × m matrix, means that the initial state variance is fixed to the values in the matrix. The matrix must be numeric and be a proper variance-covariance matrix. In general, unless a fixed prior is desired, users should just leave off x0.constraint and V0.constraint from the constraint list and use the default behavior which is x1 treated as fixed but unknown. 3.2 Observation equation constraints 3.2.1 Z constraint In the MARSS() function, Z is normally a n × m design matrix that specifies which xi hidden state time series corresponds to which yj time series4 . In this case, each yj time series (each row in y) corresponds to one and only one xi time series (row in x). The Z constraint is normally specified as a length n vector of class factor. The i-th element of this vector specifies which row in x that the i-th row in y corresponds to. Below are some examples of Z matrices; see Chapter 6 and the case studies chapters for more examples. Z.constraint=factor(c(1,1,1)) All y time series are observing the same (and only) hidden state trajectory x (n = 3 and m = 1): 1 Z = 1 1 Z.constraint=factor(c(1,2,3)) Each time series in y corresponds to a different hidden state trajectory. This is the default Z constraint and in this case n = m: 100 Z = 0 1 0 001 3 4 Shumway and Stoffer use x at t = 0 as the initial state, but we follow Ghahramani’s approach and use x at t = 1 as the initial state. Both approaches give the same answer but the EM update equations are slightly different. However, you can pass in other fixed but non-design Z matrices. 3.2 Observation equation constraints 17 Z.constraint=factor(c(1,1,2)) The first two time series in y corresponds to one hidden state trajectory and the third y time series corresponds to a different hidden state trajectory. Here n = 3 and m = 2: 10 Z = 1 0 01 The Z constraint can be specified using either numeric or character factor levels. c(1,1,2) is the same as c("north","north","south") Z.constraint="identity" This is the default behavior. This means Z is a n × n identity matrix and m = n. If n = 3, it is the same as Z.constraint=factor(c(1,2,3)). Z.constraint=matrix(..., nrow=n, ncol=m) Passing in a n × m numeric matrix, means that Z is fixed to the values in the matrix. The matrix must be numeric but it does not need to be a design matrix. 3.2.2 a constraint Using the MARSS() function, only A.constraint="scaling" or a fixed a are allowed. If “scaling”, a is a scaling factor without any direct meaning (it just says how the time series in y scale relative to each other). Unless you know the correct scaling, because say you simulated the data or you de-meaned the data, you should use the default. To set a to a fixed value (not estimated), use A.constraint=matrix(..., nrow=n, ncol=m). The matrix must be numeric. To fix a to zero, use A.constraint="zero". Note, you can circumvent the restriction on a by passing in a matrix with NAs (for estimated elements) or passing in a fixed/free pair. But be aware that it is very easy to make your model unsolvable (an infinite number of solutions)—if for example you try to estimate more than ni − 1 a’s, where ni is the number of y’s for one x. If Z is identity, then ni = 1 and you can estimate no a’s; all must be fixed. 3.2.3 R constraint The R constraint is completely analogous to the Q constraint, except that it is n×n instead of m×m. Its allowable constraints are affected by the presence of missing data points in y. If data are missing, then R must be diagonal. 4 Model specification in the core functions Most users will not directly work with the core functions nor build marssm objects from scratch. Instead, they will usually interact with the core functions via the function MARSS() described in Chapter 3. With the MARSS() function, the user specifies the model structure with text strings (“diagonal”, “unconstrained”, etc.) and MARSS() builds the marssm object. However, a basic understanding of the structure of marssm objects is necessary if one wants to fit more flexible models or to interact directly with the core functions. The first step of model specification is to write down (e.g. on paper) the model in matrix form (Equation 1.1) with notes on the dimensions (rows and columns) of each parameter and of x and y. In the core functions, the parameters in the MARSS model must be passed as matrices of the correct dimension, and the parameters in the R functions correspond one-to-one to the mathematical equation. For example, u must be passed in as a matrix of dimension c(m,1). The function will return an error if anything else is passed in (including a matrix with dim=c(1,m) or a vector of length m). 4.1 The fixed and free components of the model parameters In a marssm object, each parameter must be specified by a pair of matrices: free which gives the location and sharing of the estimated elements in the parameter matrix and fixed which specifies the location and value of the fixed elements in the parameter matrix. For example, Q is specified by free$Q and fixed$Q. 4.1.1 The fixed matrices The fixed matrix specifies the values (numeric) of the fixed (meaning not estimated) elements. In the fixed matrix, the free (meaning estimated or fitted) 20 4 Model specification in the core functions elements are denoted with NA. The following shows some common examples of the fixed matrix using fixed$Q as the example. Each of the other fixed matrices for the other parameters uses the same pattern. Q is unconstrained, so there are no fixed values NA NA NA fixed$Q = N A N A N A NA NA NA Q is a diagonal matrix, so the off-diagonals are fixed at 0. The diagonal elements will be estimated. NA 0 0 fixed$Q = 0 N A 0 0 0 NA Q is fixed, i.e. will not be estimated rather all values in the Q matrix are fixed. 0.1 0 0 fixed$Q = 0 0.1 0 0 0 0.1 4.1.2 The free matrices The free matrix specifies which elements are estimated and specifies how (and whether) the free elements are shared. In the free matrix, the fixed elements are denoted NA. The following shows some common examples of free using free$Q as the example. free can be passed in as a character matrix or a numeric matrix, but if numeric, the numeric will be changed to character (thus 0 becomes “0” and is the name “0” not the number 0). Q is a diagonal matrix in which there is only one, shared, value on the diagonal. Thus there is only one Q parameter. 1 NA NA “a” N A N A free$Q = N A 1 N A or N A “a” N A NA NA 1 N A N A “a” Here “1” does not mean “number 1” but rather that the name of the shared parameter is “1”. On the example at the right, the name of the shared parameter is “a”. Q is a diagonal matrix in which each of the diagonal elements are different. 1 NA NA “north” N A NA free$Q = N A 2 N A or N A “middle” N A NA NA 3 NA N A “south” 4.2 Limits on the model forms that can be fit Q has one value on the diagonal and another There are no fixed values in Q. 122 “a” free$Q = 2 1 2 or “b” 221 “b” 21 one on the off-diagonals. “b” “b” “a” “b” “b” “a” Q is unconstrained. There are no fixed values in Q in this case. Note that since, Q is a variance-covariance matrix, it must be symmetric across the diagonal. 123 free$Q = 2 4 5 356 4.2 Limits on the model forms that can be fit MARSS version 1.0 will allow any combination of fixed and shared values for a and u, but for R, Q, B, and Z there are limits to what forms these matrices can take. These limitations have to do with the way the EM algorithm is coded for version 1.0. Version 2.0 will remove many of these restrictions. R and Q can be fixed, unconstrained, diagonal with any pattern of fixed and shared values on the diagonal, or a matrix with one estimated value on the diagonal and another estimated value for the off-diagonals. If there are missing values in the data, R must be diagonal (or fixed). B cannot be estimated. It must be fixed but it need not be diagonal. However, all its eigen values must fall on the unit circle1 . Z cannot be estimated. It must be fixed. Although in all our examples, Z is a design matrix (meaning only 0s and 1s and all row sums equal to 1), Z is not required to be a design matrix. The other limitation is that one must specify a model that has only one solution. The core MARSS functions will allow you to attempt to fit an improper model (one with multiple solutions). If you do this accidentally, it may or may not be obvious that you have a problem. The MARSS estimation functions may chug along happily and return a solution. Careful thought about your model structure and the structure of the estimated parameter matrices will help you determine if your model is under-constrained and unsolvable. Basically, take care when using MARSS core functions directly and remember that they will not prevent you from fitting an under-constrained model. This is not a problem when using the function MARSS(). The MARSS() function includes error-checks that are designed to prevent users from specifying an under-constrained models (for example it only allows a to be fixed or act like a scaling factor. 1 This means that the absolute value of all the eigenvalues must be less than or equal to 1 (all(abs(eigen(B)$values)<=1)). 5 Algorithms used in the MARSS package 5.1 Kalman filter and smoother The MARSS model (Equation 1.1) is a linear dynamical system in discrete time. In 1960, Rudolf Kalman published the Kalman filter (Kalman, 1960), a recursive algorithm that solves for the expected value of the hidden state(s) at time t conditioned on the data up to time t: E(Xt |yt1 ). The Kalman filter gives the optimal (lowest mean square error) estimate of the unobserved xt based on the observed data up to time t for this class of linear dynamical system. The Kalman smoother (Rauch et al., 1965) solves for the expected value of the hidden state(s) conditioned on all the data: E(Xt |yT1 ). If the errors in the stochastic process are Gaussian, then the estimators from the Kalman filter and smoother are also the maximum-likelihood estimates. However, even if the the errors are not Gaussian, the estimators are optimal in the sense that they are estimators with the least variability possible. This robustness is one reason the Kalman filter is so powerful—it provides well-behaving estimates of the hidden states for all kinds of multivariate autoregressive processes, not just Gaussian processes. The Kalman filter and smoother are widely used in time-series analysis, and there are many textbooks covering it and its applications. In the interest of giving the reader a single point of reference, we use Shumway and Stoffer (2006) as our reference and adopt their notation (for the most part). The MARSSkf function provides the Kalman filter and smoother and has the following outputs: xtt1 The expected value of Xt conditioned on the data up to time t − 1. xtt The expected value of Xt conditioned on the data up to time t. xtT The expected value of Xt conditioned on all the data from time 1 to T . This the smoothed state estimate. Vtt1 The variance of Xt conditioned on the data up to time t − 1. Denoted Ptt−1 in section 6.2 in Shumway and Stoffer (2006). 24 5 Algorithms used in the MARSS package The variance of Xt conditioned on the data up to time t. Denoted Ptt in section 6.2 in Shumway and Stoffer (2006). VtT The variance of Xt conditioned on all the data from time 1 to T . Vtt1T The covariance of Xt and Xt−1 conditioned on all the data, 1 to T . Kt The Kalman gain. This is part of the update equations and relates to the amount xtt1 is updated by the data at time t to produce xtt. J This is similar to the Kalman gain but is part of the Kalman smoother. See Equation 6.49 in Shumway and Stoffer (2006). Innov This has the innovations at time t, defined as t ≡ yt - E(Yt ). These are the residuals, the difference between the data and their predicted values. See Equation 6.24 in Shumway and Stoffer (2006). Sigma This has the Σt , the variance-covariance matrices for the innovations at time t. This is used for the calculation of confidence intervals, the s.e. on the state estimates and the likelihood. See Equation 6.25 in Shumway and Stoffer (2006) for the Σt calculation. logLik The log-likelihood of the data conditioned on the model parameters. See the section below on the likelihood calculation. Vtt 5.2 The exact likelihood The likelihood of the data given a set of MARSS parameters is part of the output of the MARSSkf function. The likelihood computation is based on the innovations form of the likelihood (Schweppe, 1965) and uses the output from the Kalman filter: ! T T X 1 X N (t )> Σt−1 t (5.1) − log |Σt | + log L(Θ|data) = − 2 log(2π) 2 t=1 t=1 where N is the total number of data points, t is the innovations at time t and |Σt | is the determinant of the innovations variance-covariance matrix at time t. Reference Equation 6.62 in Shumway and Stoffer (2006). However there are a few differences between the log-likelihood output by MARSSkf and that described in Shumway and Stoffer (2006). The standard likelihood calculation (Equation 6.62 in Shumway and Stoffer (2006)) is biased when there are missing values in the data, and the missing data modifications discussed in Section 6.4 in Shumway and Stoffer (2006) do not correct for this bias. Harvey (1989), Section 3.4.7, discusses at length that the standard missing values correction leads to an inexact likelihood when there are missing values. The bias is minor if there are few missing values, but it becomes severe as the number of missing values increases. Many ecological datasets may have over 25% missing values and this level of missing values leads to a very biased likelihood if one uses the inexact formula. Harvey (1989) provides some non-trivial ways to compute the exact likelihood. 5.3 Maximum-likelihood parameter estimation 25 We use instead the exact likelihood correction for missing values that is presented in Section 12.3 in Brockwell and Davis (1991). This solution is straight-forward to implement. The correction involves the following changes to t and Σt in the Equation 5.1. Suppose the value yi,t is missing. First, the corresponding i-th value of t is set to 0. Second, the i-th diagonal value of Σt is set to 1 and the off-diagonal elements on the i-th column and i-th row are set to 0. 5.3 Maximum-likelihood parameter estimation 5.3.1 Kalman-EM algorithm The MARSS package provides a maximum-likelihood algorithm which uses an Expectation-Maximization (EM) algorithm (function MARSSkem) with the Kalman smoother. EM algorithms are widely used algorithms that extend maximum-likelihood estimation to cases where there are hidden random variables in a model (Dempster et al., 1977; Harvey, 1989; Harvey and Shephard, 1993; McLachlan and Krishnan, 2008). The EM algorithm finds the maximum-likelihood estimates of the parameters in a MARSS model using an iterative process. Starting with an initial set of parameters1 , which we will denote Θ̂1 , an updated parameter set Θ̂2 is obtaining by finding the Θ̂2 that maximizes the expected value of the likelihood over the distribution of the states (X) conditioned on Θ̂1 : Θ̂2 = arg max Θ EX|Θ̂1 [log L(Θ|YT1 = yT1 , X)] (5.2) Then using Θ̂2 in place of Θ̂1 in Equation (5.2), an updated parameter set Θ̂3 is calculated. This is repeated until the expected log-likelihood stops increasing (or increases less than some set tolerance level). Implementing this algorithm is straight-forward, hence its popularity. 1. Set an initial set of parameters, Θ̂1 2. E step: using the model for the hidden states (X) and Θ̂1 , calculate the expected values of X conditioned on all the data yT1 ; this is xtT output by MARSSkf. Also calculate expected values of any functions of X, g(X), that appear in your expected log-likelihood function. 3. M step: put those E(X|YT1 = yT1 , Θ̂1 ) and E(g(X)|YT1 = yT1 , Θ̂1 ) into your expected log-likelihood function in place of X (and g(X)) and maximize with respect to Θ. This gives you Θ̂2 . 4. Repeat the E and M steps until the log likelihood stops increasing. 1 You can choose these however you wish, however choosing something not too far off from the correct values will make the algorithm go faster. 26 5 Algorithms used in the MARSS package The EM equations in our algorithm, which we term the Kalman-EM algorithm, are extensions of those in Shumway and Stoffer (1982) and Ghahramani and Hinton (1996). Our Kalman-EM algorithm is an extended version because our algorithm is for cases where there are constraints within the parameter matrices (shared values, diagonal structure, block-diagonal structure, ...) and where there are fixed values within the parameter matrices. Holmes (2010) gives the full derivation of our EM algorithm. The EM algorithm is a hill-climbing algorithm and like all hill-climbing algorithms can get stuck on local maxima. The MARSS package includes a Monte-Carlo initial conditions searcher (function MARSSmcinit) based on Biernacki et al. (2003) to minimize this problem. EM algorithms are also known to get close to the maximum very quickly but then creep toward the absolute maximum. Quasi-Newton methods find the absolute maximum much faster, but they can be sensitive to initial conditions. We have found that with MARSS models, quasi-Newton methods (at least using optim) will sometimes converge far from the maximum even when started close to the known maximum. For this reason, the Monte Carlo initial condition search that works for EM algorithms may not work for Newton algorithms. 5.4 Parametric and innovations bootstrapping Bootstrapping can be used to construct frequentist confidence intervals on the parameter estimates (Stoffer and Wall, 1991) and to compute the smallsample AIC corrector for MARSS models (Cavanaugh and Shumway, 1997); the functions MARSSparamCIs and MARSSaic do these computations. The MARSSboot function provides both parametric and innovations bootstrapping of MARSS models. The innovations bootstrap algorithm by Stoffer and Wall (1991) bootstraps the model residuals (the innovations). This is a semi-parametric bootstrap since is uses, partially, the maximum-likelihood parameter estimates. This algorithm cannot be used if there are missing values in the data. Also for short time series, it gives biased bootstraps because one cannot resample the first few innovations. MARSSboot also provides a fully parametric bootstrap. This uses the maximum-likelihood MARSS parameters to simulate data from which bootstrap parameter estimates are obtained. Our research (Holmes and Ward, 2010) indicates that this provides unbiased bootstrap parameter estimates, and it works with datasets with missing values. Lastly, MARSSboot also output parameters sampled from a numerically estimated Hessian matrix. 5.5 Simulation and forecasting The MARSSsimulate function simulates from a MARSS model using a list of parameter matrices. It use the mvrnorm function to produce draws of the 5.6 Model selection 27 process and observation errors from multivariate normal distributions for each time step. 5.6 Model selection The package provides a MARSSaic function for computing AIC, AICc and AICb. The latter is a small-sample corrector for autoregressive state-space models. The bias problem with AIC and AICc for short time-series data has been shown in Cavanaugh and Shumway (1997) and Holmes and Ward (2010). AIC and AICc tend to select overly complex MARSS models when the time-series data are short. AICb corrects this bias. The algorithm for a non-parametric AICb is given in Cavanaugh and Shumway (1997). Their algorithm uses the innovations bootstrap (Stoffer and Wall, 1991), which means it cannot be used when there are missing data. We added a parametric AICb (Holmes and Ward, 2010), which uses a parametric bootstrap. This algorithm allows one to compute AICb when there are missing data and it provides unbiased AIC even for short time series. See Holmes and Ward (2010) for discussion and testing of parametric AICb for MARSS models. AICb is comprised of the familiar AIC fit term, −2 log L, plus a penalty term that is the mean difference between the log likelihood the data under the bootstrapped maximum-likelihood parameter estimates and the log likelihood of the data under the original maximum-likelihood parameter estimate: AICb = −2 log L(Θ̂|y) + 2 Nb L(Θ̂∗ (i)|y) 1 X − log Nb i=1 L(Θ̂|y) (5.3) where Θ̂ is the maximum-likelihood parameter set under the original data y, Θ̂∗ (i) is a maximum-likelihood parameter set estimated from the i-th bootstrapped data set y∗ (i), and Nb is the number of bootstrap data sets. It is important to notice that the likelihood in the AICb equation is L(Θ̂∗ |y) not L(Θ̂∗ |y∗ ). In other words, we are taking the average of the likelihood of the original data given the bootstrapped parameter sets. 6 Examples Here we show a series of short examples using the MARSS package functions. Chapters 8–11 give case studies which walk through detailed multi-level analyses. The examples in this chapter use the Washington harbor seal dataset (?harborSealWA), which has five observation time series. First set up the data to make time go across the columns and to remove the year column: dat = t(harborSealWA) dat = dat[2:nrow(dat),] #remove the year row 6.1 Fitting different MARSS models to a dataset 6.1.1 One hidden state process for each observation time series This is the default model for the MARSS() function. In this case, n = m, the observation errors are i.i.d. and the process errors are independent and have different variances. The elements in u are all different (meaning, they are not forced to be the same). Mathematically, the MARSS model being fit is: x1,t x1,t−1 u1 v1,t q1 0 0 0 0 x2,t x2,t−1 u2 v2,t 0 q2 0 0 0 x3,t = x3,t−1 + u3 + v3,t , vt ∼ MVN 0, 0 0 q3 0 0 x4,t x4,t−1 u4 v4,t 0 0 0 q4 0 x5,t x5,t−1 u5 0 0 0 0 q5 v5,t y1,t 1 y2,t 0 y3,t = 0 y4,t 0 y5,t 0 0 1 0 0 0 0 0 1 0 0 0 0 0 1 0 0 x1,t 0 w1,t r0000 0 r 0 0 0 0 x2,t 0 w2,t x3,t + 0 + w3,t , wt ∼ MVN 0, 0 0 r 0 0 0 0 0 0 r 0 0 x4,t 0 w4,t 1 x5,t 0 w5,t 0000r 30 6 Examples To fit this model, use MARSS(). The function will output the basic model structure and the time to convergence. Notice that the output warns you that the convergence tolerance is high. You can set it lower by passing in control=list(conv.test.slope.tol=0.1). kemfit = MARSS(dat) Success! Parameters converged at 29 iterations. Alert: conv.test.slope.tol is 0.5. Test with smaller values (<0.1) to ensure convergence. MARSS fit is Estimation method: kem Convergence test: log-log plot with slope tol of 0.5 Estimation converged in 29 iterations. Log-likelihood: 21.86958 AIC: -11.73916 AICc: -1.665082 Estimate Q.1 0.03392 Q.2 0.01180 Q.3 0.00768 Q.4 0.00550 Q.5 0.06345 R.1 0.00939 U.1 0.06839 U.2 0.07161 U.3 0.04183 U.4 0.05241 U.5 -0.00270 x0.1 6.05494 x0.2 6.79574 x0.3 6.70184 x0.4 5.88250 x0.5 6.60150 Standard errors have not been calculated. Use MARSSparamCIs to compute CIs and bias estimates. MARSS() is automatically creating parameter names (since you did not tell it the names). To see exactly where each parameter element (e.g. Q.2) appears in its parameter matrix, type summary(kemfit$model). The default method is the Kalman-EM algorithm (method="kem"). You can use a quasi-Newton method (BFGS) by setting method="BFGS". The quasi-Newton method can be a bit fragile. In fact, the BFGS method will generate numerical errors for this example. 6.1 Fitting different MARSS models to a dataset 31 kemfit.bfgs = MARSS(dat, method="BFGS") MARSSoptim() stopped with errors. No parameter estimates returned. MARSSkf() call used to compute log likelihood encountered numerical problems and could not return logLik. Sometimes better initial conditions helps. If you wanted to use the Kalman-EM fit as the initial conditions, pass in the inits argument. kemfit.bfgs2 = MARSS(dat, method="BFGS", inits=kemfit$par) Output not shown, but this examples also happens to generate numerical errors. 6.1.2 Five correlated hidden state processes This is the same model except that the hidden states have lated process errors. Mathematically, this is the model: q1 v1,t x1,t x1,t−1 u1 c1,2 x2,t x2,t−1 u2 v2,t x3,t = x3,t−1 + u3 + v3,t , vt ∼ MVN 0, c1,3 c1,4 x4,t x4,t−1 u4 v4,t c1,5 u5 v5,t x5,t x5,t−1 y1,t 1 y2,t 0 y3,t = 0 y4,t 0 y5,t 0 0 1 0 0 0 0 0 1 0 0 0 0 0 1 0 temporally correc1,2 q2 c2,3 c2,4 c2,5 c1,3 c2,3 q3 c3,4 c3,5 c1,4 c2,4 c3,4 q4 c4,5 c1,5 c2,5 c3,5 c4,5 q5 r0000 x1,t w1,t 0 0 0 r 0 0 0 0 x2,t 0 w2,t x3,t + 0 + w3,t , wt ∼ MVN 0, 0 0 r 0 0 0 0 0 0 r 0 0 x4,t 0 w4,t 1 0000r x5,t 0 w5,t To fit, use MARSS() with the constraint argument set. The output is not shown but it will appear if you type this on the R command line. kemfit = MARSS(dat, constraint=list(Q="unconstrained")) 6.1.3 Five equally correlated hidden state processes This is the same model except that now there is only one process error variance and one process error covariance. Mathematically, the model is: 32 6 Examples q v1,t u1 x1,t−1 x1,t c x2,t x2,t−1 u2 v2,t x3,t = x3,t−1 + u3 + v3,t , et ∼ MVN 0, c c x4,t x4,t−1 u4 v4,t c v5,t u5 x5,t−1 x5,t 1 y1,t y2,t 0 y3,t = 0 y4,t 0 0 y5,t 0 1 0 0 0 0 0 1 0 0 0 0 0 1 0 c q c c c c c q c c c c c q c c c c c q r0000 w1,t 0 x1,t 0 0 r 0 0 0 0 x2,t 0 w2,t x3,t + 0 + w3,t , wt ∼ MVN 0, 0 0 r 0 0 0 0 0 0 r 0 0 x4,t 0 w4,t 0000r w5,t 0 x5,t 1 To fit, use the following code (output not shown): kemfit = MARSS(dat, constraint=list(Q="equalvarcov")) 6.1.4 Five hidden state processes with a “north” and a “south” u parameter Here we fit a model with five independent hidden states where each observation time series is an independent observation of a different hidden trajectory but the hidden trajectories 1-3 share their u and q parameters, while hidden trajectories 4-5 share theirs. This is the model: x1,t x1,t−1 un v1,t qn 0 0 0 0 x2,t x2,t−1 un v2,t 0 qn 0 0 0 x3,t = x3,t−1 + un + v3,t , vt ∼ MVN 0, 0 0 qn 0 0 x4,t x4,t−1 us v4,t 0 0 0 qs 0 x5,t x5,t−1 us 0 0 0 0 qs v5,t y1,t 1 y2,t 0 y3,t = 0 y4,t 0 0 y5,t 0 1 0 0 0 0 0 1 0 0 0 0 0 1 0 r0000 w1,t x1,t 0 0 0 r 0 0 0 0 x2,t 0 w2,t x3,t + 0 + w3,t , wt ∼ MVN 0, 0 0 r 0 0 0 0 0 0 r 0 0 x4,t 0 w4,t 0000r 0 w5,t 1 x5,t To fit use the following code (output not shown): regions=factor(c("N","N","N","S","S")) kemfit = MARSS(dat, constraint=list(U=regions, Q=regions)) 6.1 Fitting different MARSS models to a dataset 33 6.1.5 Fixed observation error variance Here we fit the same model but with a known observation error variance. This is the model: qn 0 0 0 0 v1,t un x1,t−1 x1,t 0 qn 0 0 0 x2,t x2,t−1 un v2,t x3,t = x3,t−1 + un + v3,t , vt ∼ MVN 0, 0 0 qn 0 0 0 0 0 qs 0 x4,t x4,t−1 us v4,t v5,t us x5,t−1 x5,t 0 0 0 0 qs 1 y1,t y2,t 0 y3,t = 0 y4,t 0 0 y5,t 0 1 0 0 0 0 0 1 0 0 0 0 0 1 0 w1,t 0 x1,t 0 0 x2,t 0 w2,t x3,t + 0 + w3,t , 0 0 x4,t 0 w4,t w5,t 0 x5,t 1 0.01 0 0, 0 wt ∼ MVN 0 0 0 0.01 0 0 0 0 0 0 0 0 0 0.01 0 0 0 0.01 0 0 0 0.01 To fit this model, use the following code (output not shown): regions=factor(c("N","N","N","S","S")) kemfit = MARSS(dat, constraint=list(U=regions, Q=regions, R=diag(0.01,5))) 6.1.6 One hidden state and five i.i.d. observation time series Instead of five hidden state trajectories, we specify that there is only one and all the observations are of that one trajectory. Mathematically, the model is: xt = xt−1 + u + vt , vt ∼ N(0, q) y1,t 1 0 w1,t r0000 a2 w2,t 0 r 0 0 0 y2,t 1 y3,t = 1 xt + a3 + w3,t , wt ∼ MVN 0, 0 0 r 0 0 y4,t 1 a4 w4,t 0 0 0 r 0 y5,t 1 a5 w5,t 0000r 34 6 Examples Note the default constraint for R is “diagonal and equal” so we can leave this off when specifying the constraint argument. To fit, use this code (output not shown): kemfit = MARSS(dat, constraint=list(Z=factor(c(1,1,1,1,1)))) Success! Parameters converged at 19 iterations. Alert: conv.test.slope.tol is 0.5. Test with smaller values (<0.1) to ensure convergence. MARSS fit is Estimation method: kem Convergence test: log-log plot with slope tol of 0.5 Estimation converged in 19 iterations. Log-likelihood: 3.814764 AIC: 8.370472 AICc: 10.69305 Estimate A.2 0.80602 A.3 0.28702 A.4 -0.54095 A.5 -0.61757 Q.1 0.00518 R.1 0.04534 U.1 0.04737 x0.1 6.42799 Standard errors have not been calculated. Use MARSSparamCIs to compute CIs and bias estimates. 6.1.7 One hidden state and five independent observation time series with different variances Mathematically, this model is: xt = xt−1 + u + vt , vt ∼ N(0, q) y1,t 1 0 w1,t r1 y2,t 1 a2 w2,t 0 y3,t = 1 xt + a3 + w3,t , wt ∼ MVN 0, 0 y4,t 1 a4 w4,t 0 y5,t 1 a5 w5,t 0 To fit this model: 0 r2 0 0 0 0 0 r3 0 0 0 0 0 r4 0 0 0 0 0 r5 6.1 Fitting different MARSS models to a dataset 35 kemfit = MARSS(dat, constraint=list(Z=factor(c(1,1,1,1,1)), R="diagonal and unequal")) Success! Parameters converged at 19 iterations. Alert: conv.test.slope.tol is 0.5. Test with smaller values (<0.1) to ensure convergence. MARSS fit is Estimation method: kem Convergence test: log-log plot with slope tol of 0.5 Estimation converged in 19 iterations. Log-likelihood: 17.12828 AIC: -10.25656 AICc: -4.877246 Estimate A.2 0.79090 A.3 0.27061 A.4 -0.54109 A.5 -0.61260 Q.1 0.00676 R.1 0.03232 R.2 0.03539 R.3 0.01332 R.4 0.01117 R.5 0.19557 U.1 0.05258 x0.1 6.32063 Standard errors have not been calculated. Use MARSSparamCIs to compute CIs and bias estimates. 6.1.8 Two hidden state processes Here we fit a model with two hidden states (north and south) where observation time series 1-3 are for the north and 4-5 are for the south. We make the hidden state processes independent (meaning a diagonal Q matrix) but with the same process variance. We make the observation errors i.i.d. (the default) and the u elements equal. Mathematically, this is the model: 36 6 Examples xn,t x u v q0 = n,t−1 + + n,t , vt ∼ MVN 0, xs,t xs,t−1 u vs,t 0q 1 y1,t y2,t 1 y3,t = 1 y4,t 0 0 y5,t r0000 w1,t 0 0 0 r 0 0 0 a2 w2,t 0 xn,t 0 + a3 + w3,t , wt ∼ MVN 0, 0 0 r 0 0 x 0 0 0 r 0 0 w4,t 1 s,t 0000r w5,t a5 1 To fit the model, use the following code (output not shown): kemfit = MARSS(dat, constraint=list(Z=factor(c("N","N","N","S","S")), Q="diagonal and equal",U="equal")) 6.2 Printing and summarizing models and model fits The package includes print functions for marssm objects (model objects) and marssMLE objects (fitted models). print(kemfit) print(kemfit$model) This will print the basic information on model structure and model fit that you have seen in the previous examples. The package also includes a summary function for models. summary(kemfit$model) Output is not shown because it is verbose, but it prints each matrix with the fixed elements denoted with their values and the free elements denoted by their names. This is very helpful for confirming exactly what model structure you are fitting to the data. 6.3 Confidence intervals on a fitted model The function MARSSparamCIs() is used to compute confidence intervals. The function can compute approximate confidence intervals using a numerically estimated Hessian matrix (method="hessian") or via parametric (method="parametric") or non-parametric (method="innovations") bootstrapping. 6.3 Confidence intervals on a fitted model 37 6.3.1 Approximate confidence intervals from a Hessian matrix #default uses an est Hessian matrix kem.with.hess.CIs = MARSSparamCIs(kemfit) Use print or just type the marssMLE object name to see the confidence intervals: print(kem.with.hess.CIs) MARSS fit is Estimation method: kem Convergence test: log-log plot with slope tol of 0.5 Estimation converged in 19 iterations. Log-likelihood: 8.462773 AIC: -0.925545 AICc: 1.397036 ML.Est Std.Err low.CI up.CI A.2 0.79688 0.06179 0.67578 0.9180 A.3 0.27627 0.06282 0.15315 0.3994 A.5 -0.06941 0.08932 -0.24448 0.1056 Q.1 0.00894 0.00507 -0.00099 0.0189 R.1 0.03436 0.00670 0.02123 0.0475 U.1 0.04310 0.01541 0.01289 0.0733 x0.1 6.20528 0.11397 5.98191 6.4287 x0.2 6.24932 0.12826 5.99793 6.5007 CIs calculated at alpha = 0.05 via method=hessian 6.3.2 Confidence intervals from a parametric bootstrap Use method="parametric" to use a parametric bootstrap to compute confidence intervals and bias using a parametric bootstrap. kem.w.boot.CIs=MARSSparamCIs(kemfit,method="parametric",nboot=10) #nboot should be more like 1000, but set low for example's sake print(kem.w.boot.CIs) MARSS fit is Estimation method: kem Convergence test: log-log plot with slope tol of 0.5 Estimation converged in 19 iterations. Log-likelihood: 8.462773 AIC: -0.925545 AICc: 1.397036 A.2 ML.Est Std.Err 0.79688 0.05501 low.CI up.CI Est.Bias Unbias.Est 0.70206 0.8484 0.01443 0.81131 38 6 Examples A.3 0.27627 0.05346 0.19416 0.3461 0.00418 A.5 -0.06941 0.10946 -0.22153 0.0964 -0.00621 Q.1 0.00894 0.00590 0.00303 0.0212 -0.00133 R.1 0.03436 0.00746 0.01866 0.0393 0.00446 U.1 0.04310 0.01531 0.01868 0.0635 -0.00191 x0.1 6.20528 0.15642 5.97729 6.4303 0.01158 x0.2 6.24932 0.16152 5.94344 6.4595 0.04683 0.28045 -0.07562 0.00761 0.03882 0.04119 6.21686 6.29614 CIs calculated at alpha = 0.05 via method=parametric Bias calculated via parametric bootstrapping with 10 bootstraps. 6.4 Vectors of just the estimated parameters Often it is useful to have a vector of the estimated parameters. For example, if you are writing a call to optim, you will need a vector of just the estimated parameters. parvec=MARSSvectorizeparam(kemfit) parvec A.2 0.796883471 R.1 0.034359972 A.3 A.5 0.276271608 -0.069413915 U.1 x0.1 0.043104929 6.205281599 Q.1 0.008941362 x0.2 6.249315599 If you want to replace the estimated parameter values with different values, you can use the same function: parvec.new=parvec parvec.new["Q.1"]=0.02; parvec.new["U.1"]=0.05 kem.new=MARSSvectorizeparam(kemfit, parvec.new) Then you might want to find out the likelihood of the data using those new parameter values. You compute that with the Kalman filter function MARSSkf(), sending it the data and the parameters as a list. kf=MARSSkf(dat, kem.new$par, miss.value=-99) kf$logLik [,1] [1,] 6.840454 6.5 Determine which variance elements have not converged If your data are short relative to the number of parameters you are estimating, then you are liable to find that one the parameter elements is degenerate (is zero). Try the following: 6.5 Determine which variance elements have not converged 39 dat.short = dat[,1:10] kem.degen = MARSS(dat.short, silent=2) Warning! Reached maxit before parameters converged. Maxit was 500. This will print a short warning that the maximum number of iterations was reached before convergence (silent=2 means brief messages). Type cat(kem.200$errors) to see which parameter(s) is not converging or you can use find.degenerate() to plot the log parameter value against the log iteration number to figure out which parameter is not converged (Figure 6.1). Use kem.200 because this plot needs at least 100 iterations to look good. It might be that your tolerance is too high and if you just ran a few more iterations the variances will converge. So first try setting control$maxit higher. kem.200 = MARSS(dat.short, control=list(maxit=1000), silent=2) Warning! Reached maxit before parameters converged. Maxit was 1000. The problem still will not go away. We can try a few other solutions. First perhaps we are just trying to estimate too many variances. We can try using only one variance value in Q and one u value in u: kem.small=MARSS(dat.short,constraint=list(Q="diagonal and equal", U="equal"),silent=2) Warning! Reached maxit before parameters converged. Maxit was 500. No, we still get the convergence warning. There are simply not enough data to estimate both process and observation variances. If we just want the likelihood, could we set Q to a fixed diagonal matrix with very, very small values on the diagonal? No. For the EM algorithm, you cannot set Q to a fixed small value because then u would converge very, very slowly simply because of the nature of the u update equations. However, you can try a quasi-Newton method with Q fixed small1 . Here we use one Q variance and fix it small. kem.bfgs.degen=MARSS(dat.short,constraint=list( Q=diag(1E-12,5),U="equal"),method="BFGS") Success! Converged in 33 interations. MARSS fit is Estimation method: BFGS Convergence test: log-log plot with slope tol of 1 It won’t work so well with R however because the likelihood surface becomes spiky for the π parameter (the initial x values) and π will be poorly estimated leading to a poor likelihood value. 40 6 Examples find.degenerate(kem.200) Q.2 −1.3 degenerate abs(log(param)) 6.904 6.906 6.908 6.900 6.904 6.904 6.906 6.908 6.900 6.902 6.904 Q.5 1.1e−10 R.1 0.012 6.906 6.908 6.906 6.908 −4.24 −2.98 6.904 6.906 −4.18 log(iter) abs(log(param)) log(iter) 6.902 6.908 −10.16 abs(log(param)) 6.902 6.906 −10.08 log(iter) Q.4 −1.0 degenerate −3.04 6.900 6.902 log(iter) Q.3 −1.0 degenerate −10.28 6.900 abs(log(param)) 6.902 −10.36 abs(log(param)) 6.900 −8.48 −8.42 −3.74 −3.80 abs(log(param)) Q.1 −0.011 6.908 log(iter) 6.900 6.902 6.904 log(iter) Fig. 6.1. A diagnostic plot showing which diagonal variance elements are not converging. This is a log-log plot of iteration versus the log of the variance estimate. It should be flat. Estimation converged in 33 iterations. Log-likelihood: 11.90747 AIC: -9.814944 AICc: -1.199559 R.1 U.1 x0.1 x0.2 x0.3 x0.4 x0.5 Estimate 0.0239 0.1025 6.1650 6.8738 6.6347 5.8492 6.5958 Standard errors have not been calculated. Use MARSSparamCIs to compute CIs and bias estimates. 6.6 Bootstrap parameter estimates 41 We could also just set the degenerate variances, the 2nd, 3rd and 4th elements on the diagonal of Q, to a small value and estimate the 1st and 5th elements on the diagonal: kem.bfgs.degen=MARSS(dat.short,constraint=list( Q=diag(c(NA,1E-12,1E-12,1E-12,NA),5),U="equal"),method="BFGS") Success! Converged in 31 interations. MARSS fit is Estimation method: BFGS Convergence test: log-log plot with slope tol of Estimation converged in 31 iterations. Log-likelihood: 12.73636 AIC: -7.472718 AICc: 8.890919 Q.1 Q.2 R.1 U.1 x0.1 x0.2 x0.3 x0.4 x0.5 Estimate 0.0220 0.0500 0.0162 0.1024 6.0625 6.8746 6.6354 5.8496 6.5958 Standard errors have not been calculated. Use MARSSparamCIs to compute CIs and bias estimates. Note that this gets us close to the correct likelihood, but is not quite right since really the degenerate diagonal elements should equal 0, but you cannot set them to zero because the likelihood calculation in the function MARSSkf() would throw an error. 6.6 Bootstrap parameter estimates You can easily produce bootstrap parameter estimates from a fitted model using MARSSboot(): boot.params = MARSSboot(kemfit, nboot=20, output="parameters", sim="parametric")$boot.params |2% |20% |40% |60% |80% |100% Progress: |||||||||||||||||||||||||||||||||||||||||||||||||| 42 6 Examples Use silent=TRUE to stop the progress bar from printing. The function will also produce parameter sets generated using a Hessian matrix (sim="hessian") or a non-parametric bootstrap (sim="innovations"). 6.7 Data simulation 6.7.1 Simulated data from a fitted MARSS model You can easily simulate data from a fitted model using MARSSsimulate(). sim.data=MARSSsimulate(kemfit$par, nsim=2, tSteps=100)$sim.data Then you might want to estimate parameters from that simulated data. Above we created two simulated datasets (nsim=2). We will fit to the first one. Here the default settings for MARSS() are used. kem.sim.1 = MARSS(sim.data[,,1]) Then we might like to see the likelihood of the second set of simulated data under the model fit to the first set of data. We do that with the Kalman filter function. MARSSkf(sim.data[,,2], kem.sim.1$par, miss.value = -99)$logLik [,1] [1,] -11.35717 There are no missing values in our simulated data, but we still need to pass miss.value into MARSSkf(). 6.7.2 Simulated data from a user-built MARSS model This shows you how to build up a model from scratch and simulate from that using MARSSsimulate(). nsim = 20 # number of simulations burn = 10 # length of burn in period tSteps = 25 m=3 #number of hidden state trajectories B = diag(1,m); A = array(0, dim=c(m,1)) Z = diag(1,m) U = array(0.01, dim=c(m,1)) Q = diag(0.3, m) #independent process errors R = diag(0.01, m) #independent obs errors x0 = array(10, dim=c(m,1)) #initial conditions, really x_1 V0 = array(0,dim=c(m,m)) #leave this 0 the.par.list = 6.8 Bootstrap AIC 43 list(Z=Z, A=A, R=R, B=B, U=U, Q=Q, x0=x0, V0=V0 ) # simulate data sim = MARSSsimulate(the.par.list,nsim=nsim,tSteps=burn+tSteps) # take off the burn obs = sim$sim.data[,(burn+1):(burn+tSteps),] #m x T x nsim 6.7.3 Correlation between estimated parameters We can use a for loop along with MARSSvectorizeparam() to estimate parameters for each of the nsim simulated datasets in obs, and then assemble the estimates into a matrix. for(i in 1:nsim){ dat=obs[,,i] kem.sim=MARSS(dat, silent=TRUE) if(i==1) par.sim=MARSSvectorizeparam(kem.sim) else par.sim=rbind(par.sim, MARSSvectorizeparam(kem.sim)) } Then we use pairs() to get a quick visual look at how the parameters are correlated (or not) and how variable they are (Figure 6.2). We could also use MARSSboot() to do this. However, MARSSboot() is designed to take a marssMLE object (such as would be returned from MARSS()). 6.8 Bootstrap AIC The function MARSSaic() computes a bootstrap AIC for model selection purposes. Use output="AICbp" to produce a parameter bootstrap. Use output="AICbb" to produce a non-parameter bootstrap AIC. kemfit.with.AICb = MARSSaic(kemfit, output = "AICbp", Options = list(nboot = 10, silent=TRUE)) #nboot should be more like 1000, but set low here for example sake print(kemfit.with.AICb) MARSS fit is Estimation method: kem Convergence test: log-log plot with slope tol of 0.5 Estimation converged in 19 iterations. Log-likelihood: 8.462773 AIC: -0.925545 AICc: 1.397036 AICbp(param): 27.94988 A.2 A.3 Estimate 0.79688 0.27627 6 Examples ● ● ● ●● ● ●●●● ● ●● ●● ● ● ●● ● ●● ●●● ● ●● ● ● ● ● ● ● ● ● ● ● ● ● ● ● ● ● ● ●● ● ● ●● ●● ● ● ● ● ●● ● ● ● ● ● ●● ● ● ● ● ● ●● ●● ● ●● ●● ●● ●●● ●● ● ● ● ●●●● ● ●● ●● Q.2 ●●● ●●● ● ● ● ● ● ● ●●● ●● ●● ● ● ● ●●● ● ● ●● ● ● ● ●●● ● ● ● ● ● ● ● ●● ● ● ●● ● ● ● ● ● ● ● ●● ● Q.3 ● ● ● ● ●●● ● ● ● ●● ● ●● ● ● ●● ● ● ● ● ● ● ●● ●●● ●● ● ●● ● ●●● ● ● ● ● ● ●● ●● ●●● ● ● ●● ●●● ● ● ● ●● ●● ● ●● ●● ● ● ● ● ●● ● ● ● ● ● ● ●●● ● ● ● ●● ● ● ● ● ● ● ● ● ● ● ● ●● ● R.1 ●● ● ● ● ● ●● ●● ●●● ● ● ●● ● ● ●● ● ● ● ●● ● ●● ● ● ● ● ● ● ● ● ●● ● ● ●● ●● ● ● ● ●●●● ● ● ●●● ● ● ●●● ● ●● ● ● ● ●● ● ● ● ● ●● ● ● ● ●● ●● ● ● ●● ● ● ●● ●● ● ● ● ●● ● ●● ●● ●● ● ● ●● ● ● ● ● ● ● ● ●●● ● ● ● ● ●● ● ●● ● ● ●● ● ● U.1 ● ● ● ●● ● ●● ●● ● ● ● ● ●● ● ●● ● ● ● ●● ●● ●● ● ●●● ● ● ● ● ●● ● ● ●●● ●● ● ● ●● ● ● ● ●● ● ● ● ●● ● ●● ● ●●● ● ● ● ● ● ● ● ●● ●● ●● ●● ● ●● ●● ●● ● ●● ● ● ● ●● ● ● ● ● ●●● ●●● ● ● ● ● ● ● ●● ● ● ● ●● ●● ● ● ●● ● ● ● ● ● ● ● ●● ● ●● ● ● ● ● ● ●● ●● ● ● ● ● ● ● ● ● ● ● ●● ● ● ● ● ● ●● ● ● ● ● ● ● ● ●● ● ● ● ● ● ●● ● ●● ● ● ● ● ● ● ●● ● ●●● ● ● ●● ● ● ●●● ● ● ● ● ●● ●● ● ●● ● ●●● ● ● ● ● ●● ● ● ●● ● ●● ● ● ● ●● ●● ● ●● ● ● ● ● ● ● ●● ● ● ● ● ●●● ● ● ●● ● ● ● ● ●●●● ●● ● ●● ● ● ●● ● ● ● ● ● ● ● ● ● ● ●● ● ● ●● ● ●●● ●● ● ●● ● ● ● ●● ● ●● ● ● ● ● ● ● ● ● ● ●●● ●● ● ● ● ● ● ● ● ● ● ● ● ● ● ● ● ● ●● ● ●● ● ●● ● ●● ● ● ● ● ● ● ● ● ● ● ● ● ● ●● ● ●●● ● ● ● ● ● ● ● ● ●● ● ●● ●● ● ● ● ●● ● ● ●● ● ● ● ● ● ● ●● ● ● ●● ● ● ●● ● ● ● ● 0.05 0.40 ● 0.10 ● ●●● ●● ● ●● ● ● ●● ● ● ● ●● ●● ● ●● 11 ● ● ● ● ● ●●● ● ●●● ● ● ●● ●● ● ●● ● ● ● ●● ● ●● ● ● ● ●●● ●●● ● ● ● ● ●● ●● ● ●● ● ● ● ●● ● ● ●● ● ● ● ● ●●●● ● ● ●● ● ● ● ● ● ● ● ●●●●● ● ● ● ●●● ● ●● ● ● ● ● ● ● ●● ●● ● ● ● ● ● ●● ● ● ●● ● ● ●● ● ● ●● ●● ● ● ● ●● ●● ● ● ●● ● ● ● ● ●● ●●● ● ●●● ●● ● ● ● ● ● ● ● U.2 ●● ●● ● ● ●● ● ●●●● ● ●● ● ● ● ● ●●● ● ●●● ● ● ● ● ● ● ● ●● ● ● ● ● ●●● ● ●●● ● ●●● ●● ● ●● ● U.3 ● ●● ● ●● ●● ●●● ● ● ●● ● ● ● ● ● ●● ●● ●●●● ● ●● ● ● ●●● ● ● ● ● ●● ●● ● ● ●● ●● ● ● ●● ●● ●● ● ● ●● ● ●●●● ●● ● ● ●●●● ● ● ● ● ● ●●● ● ● ● ●●●● ● ● ● ● ● ●● ● ● ● ● ● ● ● ● ●●●● ●● ● ● ● ● ● ● ● ● ● ●● ● ●● ●● ●● ●● ●● ● ●● ● ●● ● ● ● ●● ● ●●●●● ● ● ● ● ● ●● ● ● ● ● ● ●● ●● ● ●● ●● ● ●● ● ● ●● −0.15 ● ●● ● ● ●● ●● ● ● ●● ● ●●● ● ● −0.1 8 ● ● ● ● ●● ● ● ● ● ●● ●● ●● ● ● ● 14 ● ●● ● ●● ●● ●● ● ● ● ●● ● ● ● ●● ● ●● ● ●● ● ●● ● ● ●● ● ●● ●● ● ● ● ● ● ● ● ● ● ●● ● ●● ● ●● ● ● ● ● ● ● ●● ● ● ●● ● ● ● ●● ●● ●● ● ● ●● ●●●● ● ●● ● ● ●● ● ●●● ● ● ● ● ● ● ● ●● ●● ● ●● ● ● ● ●● ● ● ● ● ● ● ●● ●● ● ● ●● ● ● ● ● ● ● ● ●● ● ● ● ●●● ● ● ●●● ● ● ● ●● ● ●● ● ●● ● ● ●● ● ● ● ● ● ● ●● ● ●● ●● ● ●● ●●● ●● ● ● ●● ● ●● ● ● ● ● ● ● ●● ●● ● ● ●● ● ● ●● ●● ● ● ● ● ● ●● ● ●● ● ●● ● ●● ● ● ● ● ● ● ●● ● ● ●● ●● ● ● ● ● ●● ●● ● ● ● ● ● ● ● ●● ●● ●● ● ●● ●● ● ●● ● ● ● ● ● ●● ● ● ●●●● ● ●● ● x0.1 ● ● ● ● ●● ● ● ● ● ● ● ● ● ●● ● ● ● ●● ●● ● ●●●● ●●● ● ● ● ●● ● ● ●● ● ● ● ●●● ● ● ● ● ●● ●● ● ● x0.2 ● 0.40 7 ● ●●● ● ● ●●● ● ● ●● ●● ● ●● ● 0.05 0.3 ● ● ●● ● ● ●● ● ● ●● ● ● ● ●● ● 0.10 −0.2 ● ● ● ● ● ● ● ● ●● ●● ●● ● ●● ●● −0.15 0.4 0.1 0.00 0.10 0.3 −0.2 11 7 14 8 0.00 0.10 ● ● ● ● ●● ● ●●● ● ●● ● ● ● ●● ●● ●● −0.1 0.4 ● ● ●● ● ● ● ●● ● ●● ● ●● ● ● ● ● 7 ● ●● ● ●● ●●● ● ● ● ● ● ● ● ● 11 0.1 Q.1 7 44 ● ● ●● ● ●● ● ●●● ● ● ● ● ● ● x0.3 11 Fig. 6.2. The parameter pairs plotted against each other using the command pairs(par.sim). A.5 -0.06941 Q.1 0.00894 R.1 0.03436 U.1 0.04310 x0.1 6.20528 x0.2 6.24932 Standard errors have not been calculated. Use MARSSparamCIs to compute CIs and bias estimates. 7 Case study instructions The case studies walk you through some analyses of multivariate population count data using MARSS models and the MARSS() function. This will take you through both the conceptual steps (with pencil and paper) and a R step which translates the conceptual model into code. Set-up If you haven’t already, install the MARSS package. See directions on the CRAN webpage (http://cran.r-project.org/) for instructions on installing packages. You will need write permissions for your R program directories to install packages. See the help pages on CRAN for workarounds if you don’t have write permission. Type in library(MARSS) at the R command line. Now you should be ready. Each case study comes with an associated script file. To open up a copy of the case study script with the code you need to do the exercises, type show.doc(MARSS, Case_study_#.R) (with # replaced by the case study number). Tips summary(foo$model), where foo is a fitted model object, will print detailed information on the structure of the MARSS model that was fit in the call foo = MARSS(logdata). This allows you to double check the model you fit. print(foo) will print a ‘English’ version of the model structure along with the parameter estimates. When you run MARSS(), it will output the number of iterations used. If you reached the maximum, re-run with control=list(maxit=...) set higher than the default. 46 7 Case study instructions If you mis-specify the model, MARSS() will post an error that should give you an idea of the problem (make sure silent=FALSE to see full error reports). Remember, the number of rows in your data is n, time is across the columns, and the length of the vector or factors passed in for constraint$Z must be m, the number of x hidden state trajectories in your model. If you are fitting to population counts, your data must be logged (base e) before being passed in. The default missing value indicator is -99. You can change that by passing in miss.value=.... Running MARSS(data), with no arguments except your data, will fit a MARSS model with m = n, a diagonal Q matrix with m variances, and i.i.d. observation errors. 8 Case Study 1: Count-based Population Viability Analysis using corrupted data 8.1 The Problem Estimates of extinction and quasi-extinction risk are an important risk metric used in the management and conservation of endangered and threatened species. By necessity, these estimates are based on data that contain both variability due to real year-to-year changes in the population growth rate (process errors) and variability in the relationship between the true population size and the actual count (observation errors). Classic approaches to extinction risk assume the data have only process error, i.e. no observation error. In reality, observation error is ubiquitous both because of the sampling variability and also because of year-to-year (and day-to-day) variability in sightability. In this case study, we use the Kalman filter to fit a univariate (meaning one time series) state-space model to count data for a population. We will compute the extinction risk metrics given in Dennis et al. (1991), however instead of using a process-error only model (as is done in the original paper), we use a model with both process and observation error. The risk metrics and their interpretations are the same as in Dennis et al. (1991). The only real difference is how we compute σ 2 , the process error variance. However this difference has a large effect on our risk estimates, as you will see. In this case study, we use a density-independent model, which is the same as the Gompertz model (Equation 3.1) with B = 1. Density-independence is often a reasonable assumption when doing a population viability analysis because we do such calculations for at-risk populations that are either declining or that are well below historical levels (and presumably carrying capacity). In an actual population viability analysis, it is necessary to justify this assumption and if there is reason to doubt the assumption, one tests for density-dependence (Taper and Dennis, 1994) and does sensitivity analyses using state-space models with density-dependence (Dennis et al., 2006). The univariate model is written: 48 8 Count-based PVA xt = xt−1 + u + vt yt = xt + wt where vt ∼ N(0, σ 2 ) where wt ∼ N(0, η 2 ) (8.1) (8.2) where yt is the logarithm of the observed population size at time t, xt is the unobserved state at time t, u is the growth rate, and σ 2 and η 2 are the process and observation error variances, respectively. In the R code to follow, σ 2 is denoted Q and η 2 is denoted R because the functions we are using are also for multivariate state-space models and those models use Q and R for the respective variance-covariance matrices. 8.2 Simulated data with process and observation error We will start by using simulated data to see the difference between data and estimates from a model with process error only versus a model that also includes observation error. For our simulated data, we’ll used a decline of 5% per year, process variability of 0.01 (typical for big mammals), and a observation variability of 0.05 (which is a bit on the high end). We’ll randomly set 10% of the values as missing. Here’s the code: First, set things up: sim.u = -0.05 sim.Q = 0.01 sim.R = 0.05 nYr= 30 fracmissing = 0.1 init = 7 years = seq(1:nYr) x = rep(NA,nYr) y = rep(NA,nYr) # # # # # # # # growth rate process error variance non-process error variance number of years of data to generate fraction of years that are missing log of initial pop abundance sequence 1 to nYr replicate NA nYr times Then generate the population sizes using Equation 8.1: x[1]=init for(t in 2:nYr){ x[t] = x[t-1]+ sim.u + rnorm(1,mean=0,sd=sqrt(sim.Q)) } Lastly, add observation error using Equation 8.2 and then add missing values: for(t in 1:nYr){ y[t]= x[t] + rnorm(1,mean=0,sd=sqrt(sim.R)) } missYears = sample(years[2:(nYr-1)],floor(fracmissing*nYr), replace = FALSE) y[missYears]=-99 8.2 Simulated data with process and observation error 30 0 5 10 5 10 20 30 20 30 30 6.5 ● ● 0 ●● ● ● ● ● ● ●● ● ● ● ● ● 5 10 20 ● 30 ● ● ● ● ●●● ● ● ● ● ● ● ●● ●● ● ● ● ●● ● ● ● ● 7.0 0 5 10 20 30 simulation 9 ●● ● ● 5.5 ●● ● index of log abundance 7.0 6.0 index of log abundance ●● ● ● ●●● ●● ●● ● ● ● ●● ● ● 5 10 20 20 ● 6.5 6.0 5 10 ●● ● ●● ● ● ● ● ● ●● 5 10 simulation 6 ●● ●●● ● ● ● ● ●● ● ● ●● ●●● ●● ● 0 ● ● ● ●●● 0 simulation 8 ● ● ● 0 ● ● ● ● ● ● 5.5 7.0 ● ●● simulation 7 ●● ● 30 5.0 index of log abundance 6.5 5.5 ● ● ●● ● ● ●● ●●● ● ●● ●● ● ● ● ●● ● 0 20 ● ●●● ● simulation 5 ● 4.5 index of log abundance ● ●● ● ●●● ● ●● ● 6.0 ● simulation 4 ● ●● ●● ● ● ● index of log abundance 20 ● index of log abundance 5 10 ● ● ● ● ● ● ● ● ●● ● 30 7.0 0 ● ● ●●● ● ● ●●● ● ● ● ●● ● ●● ● ●● ●● 6.0 ● ●●●● ● ● ●●● ● ●● ● ●● ● ● ● ● 5.0 ● 49 simulation 3 index of log abundance ●● ●● ● ●● ● 6.5 ●● ● ● 5.5 ● 4.5 6.5 ●● index of log abundance simulation 2 ● 5.5 index of log abundance simulation 1 0 5 10 20 30 Fig. 8.1. Plot of nine simulated population time series with process and observation error. Circles are observation and the dashed line is the true population size. Now let’s look at the simulated data. Stochastic population trajectories show much variation, so it is best to look at a few at once. In Figure 8.1, nine simulations from the identical parameters are shown. Example 8.1 (The effect of parameter values on parameter estimates) A good way to get a feel for reasonable σ 2 values is to generate simulated data and look at the time series. As a biologist, you probably have a pretty good idea of what kind of year-to-year population changes are reasonable for your species. For example for many large mammalian species, the maximum population yearly increase would be around 50% (the population could go from 1000 to 1500 in one year), but some of fish species could easily double or even triple in a really good year. Your observed data may bounce around a lot for many different reasons having to do with sightability, sampling error, agestructure, etc., but the underlying population trajectory is constrained by the 50 8 Count-based PVA kinds of year-to-year changes in population size that are biologically possible for your species. σ 2 describes those true population changes. Run the exercise code several times using different parameter values to get a feel for how different the time series can look based on identical parameter values. You can cut and paste from the pdf into the R command line. Typical vertebrate σ 2 values are 0.002 to 0.02, and typical η 2 values are 0.005 to 0.1. A u of -0.01 translates to an average 1% per year decline and a u of -0.1 translates to an average 10% per year decline (approximately). Example 8.1 code Type show.doc(MARSS, Case_study_1.R) to open a file with all the example code. par(mfrow=c(3,3)) sim.u = -0.05 sim.Q = 0.01 sim.R = 0.05 nYr= 30 fracmiss = 0.1 init = 7 years = seq(1:nYr) for(i in 1:9){ x = rep(NA,nYr) # vector for ts w/o measurement error y = rep(NA,nYr) # vector for ts w/ measurement error x[1]=init for(t in 2:nYr){ x[t] = x[t-1]+ sim.u + rnorm(1, mean=0, sd=sqrt(sim.Q)) } for(t in 1:nYr){ y[t]= x[t] + rnorm(1,mean=0,sd=sqrt(sim.R)) } missYears = sample(years[2:(nYr-1)],floor(fracmiss*nYr),replace = FALSE) y[missYears]=-99 plot(years[y!=-99], y[y!=-99], xlab="",ylab="log abundance",lwd=2,bty="l") lines(years,x,type="l",lwd=2,lty=2) title(paste("simulation ",i) ) } legend("topright", c("Observed","True"), lty = c(-1, 2), pch = c(1, -1)) 8.3 Maximum-likelihood parameter estimation 51 8.3 Maximum-likelihood parameter estimation 8.3.1 Model with process and observation error We put the simulated data through the Kalman-EM algorithm in order to estimate the parameters, u, σ 2 , and η 2 , and population sizes. These are the estimates using a model with process and observation variability. The function call is kem = MARSS(data), where data is a vector of logged (base e) counts with missing values denoted by -99. After this call, the maximum-likelihood parameter estimates are kem$par$U, kem$par$Q and kem$par$R. There are numerous other outputs from the MARSS() function. To get a list of the outputs type in names(kem). Note that kem is just a name; the output could have been called foo. Here’s code to fit to the simulated time series: kem = MARSS(y) Let’s look at the parameter estimates for the nine simulated time series in Figure 8.1 to get a feel for the variation. The MARSS() function was used on each time series to produce parameter estimate for each simulation. The estimates are followed by the mean (over the nine simulations) and the true values: sim 1 sim 2 sim 3 sim 4 sim 5 sim 6 sim 7 sim 8 sim 9 mean sim true kem.U -0.04760279 -0.08042276 -0.04841076 -0.08152645 -0.05694961 -0.05299391 -0.02940781 -0.06400285 -0.06934887 -0.05896287 -0.05000000 kem.Q 4.978515e-03 1.116588e-04 4.766496e-03 3.026766e-02 7.454619e-03 2.113035e-04 8.679988e-05 8.870152e-05 2.367693e-02 7.960297e-03 1.000000e-02 kem.R 0.03650359 0.09236805 0.03885144 0.05312292 0.04230162 0.07164835 0.05902753 0.07039402 0.03969777 0.05599059 0.05000000 As expected, the estimated parameters do not exactly match the true parameters, but the average should be fairly close (although nine simulations is a small sample size). Also note that although we do not get u quite right, our estimates are usually negative. Thus our estimates usually indicate declining dynamics. The Kalman-EM algorithm also gives an estimate of the true population size with observation error removed. This is in kem$states. Figure 8.2 shows the estimated true states of the population over time as a solid line. Note that the solid line is considerably closer to the actual true states (dashed line) than the observations. On the other hand with certain datasets, the estimates can be quite wrong as well! 8 Count-based PVA 30 0 5 10 5 10 20 30 20 30 30 6.5 ● ● 0 ●● ● ● ● ● ● ●● ● ● ● ● ● 5 10 ● ● ● ● ●● ● 20 7.0 6.0 20 30 ● ● ● ● ● ●●● ● ● ● ● ● ● ●● ●● ● ● ● ●● ● ● ● ● 0 5 10 20 30 simulation 9 ●● ● ● 5.5 ●● ● index of log abundance 7.0 6.0 index of log abundance ●● ● ● ●●● ●● ●● ● ● ● ●● ● ● 5 10 20 ● ● ●● 6.5 6.0 5 10 ●● ● ●● ● ● ● ● 5 10 simulation 6 ●● ●●● ● ● ● ● ●● ● ● ●● ●●● ●● ● 0 ● ● ● ●●● 0 simulation 8 ● ● ● 0 ● ● ● ● ● ● 5.5 7.0 ● ●● simulation 7 ●● ● 30 5.0 ● ● ●● ● ● ●● ●●● ● ●● ●● ● ● ● ●● ● 0 20 ● ●●● ● simulation 5 ● index of log abundance 5.5 6.5 ● ●● 4.5 index of log abundance simulation 4 ● ● ●●● ● ●● ● index of log abundance 20 ● index of log abundance 5 10 ●● ●● ● ● ● 30 7.0 0 ● ● ●●● ● ● ● ●● ● ●● ● ●● ●● 6.0 ● ●●●● ● ● ●●● simulation 3 ● ● ● ● ● ●● ● ●● ● ● ● ● 5.0 ● ● ● ●●● ● 5.5 ●● ●● ● ●● ● 4.5 ●● ● ● 6.5 simulation 2 ● index of log abundance 6.5 ●● 5.5 index of log abundance simulation 1 ● index of log abundance 52 0 5 10 20 30 Fig. 8.2. The circles are the observed population sizes with error. The dashed lines are the true population sizes. The solid thin lines are the estimates of the true population size from the Kalman-EM algorithm. 8.3.2 Model with no observation error We used the Kalman-EM algorithm to estimate the mean population rate u and process variability σ 2 under the assumption that the count data have observation error. However, the classic approach to this problem, referred to as the “Dennis model” (Dennis et al., 1991), uses a model that assumes the data have no observation error; all the variability in the data is assumed to result from process error. This approach works well if the observation error in the data is low, but not so well if the observation error is high. We will next fit the data using the classic approach so that we can compare and contrast parameter estimates from the different methods. Using the estimation method in Dennis et al. (1991), our data need to be re-specified as the observed population changes (delta.pop) between censuses along with the time between censuses (tau). We re-specify the data as follows: den.years = years[y!=-99] # the non missing years den.y = y[y!=-99] # the non missing counts den.n.y = length(den.years) 8.3 Maximum-likelihood parameter estimation 53 delta.pop = rep(NA, den.n.y-1 ) # population transitions tau = rep(NA, den.n.y-1 ) # step sizes for (i in 2:den.n.y ){ delta.pop[i-1] = den.y[i] - den.y[i-1] tau[i-1] = den.years[i] - den.years[i-1] } # end i loop Next, we regress the changes in population size between censuses (delta.pop) on the time between censuses (tau) while setting the regression intercept to 0. The slope of the resulting regression line is an estimate of u, while the variance of the residuals around the line is an estimate of σ 2 . The regression is shown in Figure 8.3. Here is the code to do that regression: 0.6 ● 0.2 ● ● ● −0.2 ● ● ● ● ● ● ● ● ● ● ● ● ● ● ● ● ● ● −0.6 population transition size den91 <- lm(delta.pop ~ -1 + tau) # note: the "-1" specifies no intercept den91.u = den91$coefficients den91.Q = var(resid(den91)) 0.0 0.5 1.0 1.5 2.0 2.5 3.0 time step size (tau) Fig. 8.3. The regression of log(Nt+τ ) − log(Nt ) against τ . The slope is the estimate of u and the variance of the residuals is the estimate of σ 2 . 54 8 Count-based PVA Here are the parameter values for the data in Figure 8.2 using the processerror only model: sim 1 sim 2 sim 3 sim 4 sim 5 sim 6 sim 7 sim 8 sim 9 mean sim true den91.U -0.04572777 -0.11065183 -0.03964722 -0.05815166 -0.05926512 -0.05861333 -0.03774754 -0.06790256 -0.06435983 -0.06022965 -0.05000000 den91.Q 0.08999226 0.21431424 0.09042180 0.14132050 0.08562552 0.13962290 0.10339092 0.13184089 0.10974679 0.12291953 0.01000000 Notice that the u estimates are similar to those from the Kalman-EM algorithm, but the σ 2 estimate (Q) is much larger. That is because this approach treats all the variance as process variance, so any observation variance in the data is lumped into process variance (in fact it appears as an additional variance of twice the observation variance). Example 8.2 (The variability in parameter estimates) In this example, you will look at how variable the parameter estimates are by generating multiple simulated data sets and then estimating parameter values for each. You’ll compare the Kalman-EM estimates to the estimates using a process error only model (i.e. ignoring the observation error). 8.3 Maximum-likelihood parameter estimation 55 Example 8.2 code Type show.doc(MARSS, Case_study_1.R) to open a file with all the example code. You will not be able to edit this file. To edit, copy and paste into a new script file. sim.u = -0.05 # growth rate sim.Q = 0.01 # process error variance sim.R = 0.05 # non-process error variance nYr= 30 # number of years of data to generate fracmiss = 0.0 # fraction of years that are missing init = 7 # log of initial pop abundance (~1100 individuals) nsim = 9 years = seq(1:nYr) # col of years params = matrix(NA, nrow=11, ncol=5, dimnames=list(c(paste("sim",1:9),"mean sim","true"), c("kem.U","den91.U","kem.Q","kem.R", "den91.Q"))) x.ts = matrix(NA,nrow=nsim,ncol=nYr) # ts w/o measurement error y.ts = matrix(NA,nrow=nsim,ncol=nYr) # ts w/ measurement error for(i in 1:nsim){ x.ts[i,1]=init for(t in 2:nYr){ x.ts[i,t] = x.ts[i,t-1]+sim.u+rnorm(1,mean=0,sd=sqrt(sim.Q))} for(t in 1:nYr){ y.ts[i,t] = x.ts[i,t]+rnorm(1,mean=0,sd=sqrt(sim.R))} missYears = sample(years[2:(nYr-1)], floor(fracmiss*nYr), replace = FALSE) y.ts[i,missYears]=-99 #Kalman-EM estimates #So that this code runs fast, we're using a rough convergence test (abstol) #change that line to kem = MARSS(y.ts[i,], silent=TRUE) #for a better (albeit much slower) convergence test kem = MARSS(y.ts[i,], silent=TRUE, control=list(abstol=0.01)) params[i,c(1,3,4)] = c(kem$par$U,kem$par$Q,kem$par$R) #Dennis et al 1991 estimates den.years = years[y.ts[i,]!=-99] # the non missing years den.yts = y.ts[i,y.ts[i,]!=-99] # the non missing counts den.n.yts = length(den.years) delta.pop = rep(NA, den.n.yts-1 ) # transitions tau = rep(NA, den.n.yts-1 ) # time step lengths for (t in 2:den.n.yts ){ delta.pop[t-1] = den.yts[t] - den.yts[t-1] # transitions tau[t-1] = den.years[t]-den.years[t-1] # time step length } # end i loop den91 <- lm(delta.pop ~ -1 + tau) # -1 specifies no intercept params[i,c(2,5)] = c(den91$coefficients, var(resid(den91))) } params[nsim+1,]=apply(params[1:nsim,],2,mean) params[nsim+2,]=c(sim.u,sim.u,sim.Q,sim.R,sim.Q) 56 8 Count-based PVA Here is an example of the output from the code: print(params,digits=3) sim 1 sim 2 sim 3 sim 4 sim 5 sim 6 sim 7 sim 8 sim 9 mean sim true kem.U -0.0384 -0.0483 -0.0458 -0.0638 -0.0524 -0.0385 -0.0570 -0.0676 -0.0636 -0.0528 -0.0500 den91.U -0.0339 -0.0642 -0.0481 -0.0690 -0.0387 -0.0284 -0.0620 -0.0691 -0.0712 -0.0539 -0.0500 kem.Q 0.01549 0.01381 0.00147 0.01033 0.00327 0.00516 0.03290 0.02630 0.01554 0.01381 0.01000 kem.R den91.Q 0.0294 0.0735 0.0591 0.1262 0.0716 0.1207 0.0278 0.0743 0.0406 0.0850 0.0433 0.1054 0.0245 0.0834 0.0388 0.1011 0.0260 0.0697 0.0401 0.0933 0.0500 0.0100 1. Re-run the code a few times to see the performance of the estimates using a state-space model (kem) versus the model with no observation error (den91). You can copy and paste the code from the pdf file into R . 2. Alter the observation variance, sim.R, in the data generation step in order to get a feel for performance as observations are further corrupted. What happens as observation error is increased? 3. Decrease the number of years of data, nYr, and re-run the parameter estimation. What changes? If you find that the exercise code takes too long to run, reduce the number of simulations (by reducing nsim in the code). 8.4 Probability of hitting a threshold Π(xd , te ) A common extinction risk metric is ‘the probability that a population will hit a certain threshold xd within a certain time frame te – if the observed trends continue’. In practice, the threshold used is not Ne = 1, which would be true extinction. Often a ‘functional’ extinction threshold will be used (Ne >> 1). Other times a threshold representing some fraction of current levels is used. The latter is used because we often have imprecise information about the relationship between the true population size and what we measure in the field; that is, many population counts are index counts. In these cases, one 8.4 Probability of hitting a threshold Π(xd , te ) 57 must use ‘fractional declines’ as the threshold. Also, extinction estimates that use an absolute threshold (like 100 individuals) are quite sensitive to error in the estimate of true population size. Here, we are going to use fractional declines as the threshold, specifically pd = 0.1 which means a 90% decline. The probability of hitting a threshold, denoted Π(xd , te ), is typically presented as a curve showing the probabilities of hitting the threshold (y-axis) over different time horizons (te ) on the x-axis. Extinction probabilities can be computed through Monte Carlo simulations or analytically using Equation 16 in Dennis et al. (1991) (note there is a typo in Equation 16; the last + is supposed to be a − ). We will use the latter method: −xd − |u|te −xd + |u|te √ √ +exp(2xd |u|/σ 2 )Φ (8.3) Π(xd , te ) = π(u)×Φ σ 2 te σ 2 te where xe is the threshold and is defined as xe = log(N0 /Ne ). N0 is the current population estimate and Ne is the threshold. If we are using fractional declines then xe = log(N0 /(pd × N0 )) = − log(pd ). π(u) is the probability that the threshold is eventually hit (by te = ∞). π(u) = 1 if u <= 0 and π(u) = exp(−2uxd /σ 2 ) if u > 0. Φ() is the cumulative probability distribution of the standard normal (mean = 0, sd = 1). Here is the R code for that computation: pd = 0.1 #means a 90 percent decline tyrs = 1:100 xd = -log(pd) p.ever = ifelse(u<=0,1,exp(-2*u*xd/Q)) #Q=sigma2 for (i in 1:100){ Pi[i] = p.ever * pnorm((-xd+abs(u)*tyrs[i])/sqrt(Q*tyrs[i]))+ exp(2*xd*abs(u)/Q)*pnorm((-xd-abs(u)*tyrs[i])/sqrt(Q*tyrs[i])) } Figure 8.4 shows the estimated probabilities of hitting the 90% decline for the nine 30-year times series simulated with u = −0.05, σ 2 = 0.01 and η 2 = 0.05. The dashed line shows the estimates using the Kalman-EM parameter estimates and the solid line shows the estimates using a process-error only model (the den91 estimates). The circles are the true probabilities. The difference between the estimates and the true probalities is due to errors in û. Those errors are due largely to process error—not observation error. As we saw earlier, by chance population trajectories with a u < 0 will increase, even over a 30-year period. In this case, û will be positive when in fact u < 0. Looking at the figure, it is obvious that the probability estimates are highly variable. However, look at the first panel. This is the average estimate (over nine simulations). Note that on average (over nine simulations), the estimates are good. If we had averaged over 1000 simulations instead of nine, you would see that the Kalman-EM line falls on the true line. It is an unbiased predictor. While that may seem a small consolation if estimates for individual simulations are all over the map, it is important for correctly specifying our uncertainty 58 8 Count-based PVA about our estimates. Second, rather than focusing on how the estimates and true lines match up, see if there are any types of forecasts that seem better than others. For example, are 20-year predictions better than 50-year and are 100-year forecasts better or worse. In Exercise 3, you will remake this figure with different u. You’ll discover from that forecasts are more certain for populations that are declining faster. 20 40 60 80 0.8 0.4 0.0 probability of extinction 0.8 0.4 0.0 probability of extinction 0 simulation 2 ● ● ● ● ● ● ● ● ● ● ● ● ● ● ● ● ● ● ● ● ● ● ● ● ● ● ● ● ● ● ● ● ● ● ● ● ● ● ● ● ● ● ● ● ● ● ● ● ● ● ● ● ● ● ● ● ● ● ● ● ● ● ● ● ● ● ● ● ● ● ● ● ● ● ● ● ● ● ● ● ● ● ● ● ● ● ● ● ● ● ● ● ● ● ● ● ● ● ● ● 0 20 40 60 80 20 40 60 80 20 40 60 80 0.4 0.0 0.4 0.0 0 0.8 simulation 5 ● ● ● ● ● ● ● ● ● ● ● ● ● ● ● ● ● ● ● ● ● ● ● ● ● ● ● ● ● ● ● ● ● ● ● ● ● ● ● ● ● ● ● ● ● ● ● ● ● ● ● ● ● ● ● ● ● ● ● ● ● ● ● ● ● ● ● ● ● ● ● ● ● ● ● ● ● ● ● ● ● ● ● ● ● ● ● ● ● ● ● ● ● ● ● ● ● ● ● ● probability of extinction simulation 4 0.8 simulation 3 probability of extinction time steps into future ● ● ● ● ● ● ● ● ● ● ● ● ● ● ● ● ● ● ● ● ● ● ● ● ● ● ● ● ● ● ● ● ● ● ● ● ● ● ● ● ● ● ● ● ● ● ● ● ● ● ● ● ● ● ● ● ● ● ● ● ● ● ● ● ● ● ● ● ● ● ● ● ● ● ● ● ● ● ● ● ● ● ● ● ● ● ● ● ● ● ● ● ● ● ● ● ● ● ● ● 0 20 40 60 80 simulation 6 simulation 7 simulation 8 20 40 60 80 time steps into future 0 20 40 60 80 time steps into future 0.4 0.0 0.4 0.0 ● ● ● ● ● ● ● ● ● ● ● ● ● ● ● ● ● ● ● ● ● ● ● ● ● ● ● ● ● ● ● ● ● ● ● ● ● ● ● ● ● ● ● ● ● ● ● ● ● ● ● ● ● ● ● ● ● ● ● ● ● ● ● ● ● ● ● ● ● ● ● ● ● ● ● ● ● ● ● ● ● ● ● ● ● ● ● ● ● ● ● ● ● ● ● ● ● ● ● ● 0.8 time steps into future probability of extinction time steps into future 0.8 time steps into future ● ● ● ● ● ● ● ● ● ● ● ● ● ● ● ● ● ● ● ● ● ● ● ● ● ● ● ● ● ● ● ● ● ● ● ● ● ● ● ● ● ● ● ● ● ● ● ● ● ● ● ● ● ● ● ● ● ● ● ● ● ● ● ● ● ● ● ● ● ● ● ● ● ● ● ● ● ● ● ● ● ● ● ● ● ● ● ● ● ● ● ● ● ● ● ● ● ● ● ● 0 ● ● ● ● ● ● ● ● ● ● ● ● ● ● ● ● ● ● ● ● ● ● ● ● ● ● ● ● ● ● ● ● ● ● ● ● ● ● ● ● ● ● ● ● ● ● ● ● ● ● ● ● ● ● ● ● ● ● ● ● ● ● ● ● ● ● ● ● ● ● ● ● ● ● ● ● ● ● ● ● ● ● ● ● ● ● ● ● ● ● ● ● ● ● ● ● ● ● ● ● time steps into future probability of extinction 0.8 0.4 0.0 0.8 0.4 probability of extinction 0.0 0.8 20 40 60 80 simulation 1 time steps into future ● ● ● ● ● ● ● ● ● ● ● ● ● ● ● ● ● ● ● ● ● ● ● ● ● ● ● ● ● ● ● ● ● ● ● ● ● ● ● ● ● ● ● ● ● ● ● ● ● ● ● ● ● ● ● ● ● ● ● ● ● ● ● ● ● ● ● ● ● ● ● ● ● ● ● ● ● ● ● ● ● ● ● ● ● ● ● ● ● ● ● ● ● ● ● ● ● ● ● ● 0 0.4 probability of extinction ● ● ● ● ● ● ● ● ● ● ● ● ● ● ● ● ● ● ● ● ● ● ● ● ● ● ● ● ● ● ● ● ● ● ● ● ● ● ● ● ● ● ● ● ● ● ● ● ● ● ● ● ● ● ● ● ● ● ● ● ● ● ● ● ● ● ● ● ● ● ● ● ● ● ● ● ● ● ● ● ● ● ● ● ● ● ● ● ● ● ● ● ● ● ● ● ● ● ● ● 0 0.0 probability of extinction average over sims ● ● ● ● ● ● ● ● ● ● ● ● ● ● ● ● ● ● ● ● ● ● ● ● ● ● ● ● ● ● ● ● ● ● ● ● ● ● ● ● ● ● ● ● ● ● ● ● ● ● ● ● ● ● ● ● ● ● ● ● ● ● ● ● ● ● ● ● ● ● ● ● ● ● ● ● ● ● ● ● ● ● ● ● ● ● ● ● ● ● ● ● ● ● ● ● ● ● ● ● ● True Dennis KalmanEM 0 20 40 60 80 time steps into future Fig. 8.4. Plot of the true and estimated probability of declining 90% in different time horizons for nine simulated population time series with observation error. The plot may look like a step-function if the σ 2 estimate is very small (<1e-4 or so). Example 8.3 (The effect of parameter values on risk estimates) In this example, you will recreate Figure 8.4 using different parameter values. This will give you a feel for how variability in the data and population process affect the risk estimates. You’ll need to run the Example 8.2 code before running the Example 8.3 code. 8.4 Probability of hitting a threshold Π(xd , te ) 59 Example 8.3 code Type show.doc(MARSS, Case_study_1.R) to open a file with all the example code. #Needs Exercise 2 to be run first par(mfrow=c(3,3)) pd = 0.1; xd = -log(pd) # decline threshold te = 100; tyrs = 1:te # extinction time horizon for(j in c(10,1:8)){ real.ex = denn.ex = kal.ex = matrix(nrow=te) #Kalman-EM parameter estimates u=params[j,1]; Q=params[j,3] p.ever = ifelse(u<=0,1,exp(-2*u*xd/Q)) for (i in 1:100){ if(is.finite(exp(2*xd*abs(u)/Q))){ sec.part = exp(2*xd*abs(u)/Q)*pnorm((-xd-abs(u)* tyrs[i])/sqrt(Q*tyrs[i])) }else sec.part=0 kal.ex[i]=p.ever*pnorm((-xd+abs(u)*tyrs[i])/sqrt(Q*tyrs[i]))+sec.part } # end i loop #Dennis et al 1991 parameter estimates u=params[j,2]; Q=params[j,5] p.ever = ifelse(u<=0,1,exp(-2*u*xd/Q)) for (i in 1:100){ denn.ex[i]=p.ever*pnorm((-xd+abs(u)*tyrs[i])/sqrt(Q*tyrs[i]))+ exp(2*xd*abs(u)/Q)*pnorm((-xd-abs(u)*tyrs[i])/sqrt(Q*tyrs[i])) } # end i loop #True parameter values u=sim.u; Q=sim.Q p.ever = ifelse(u<=0,1,exp(-2*u*xd/Q)) for (i in 1:100){ real.ex[i]=p.ever*pnorm((-xd+abs(u)*tyrs[i])/sqrt(Q*tyrs[i]))+ exp(2*xd*abs(u)/Q)*pnorm((-xd-abs(u)*tyrs[i])/sqrt(Q*tyrs[i])) } # end i loop #plot it plot(tyrs, real.ex, xlab="time steps into future", ylab="probability of extinction", ylim=c(0,1), bty="l") if(j<=8) title(paste("simulation ",j) ) if(j==10) title("average over sims") lines(tyrs,denn.ex,type="l",col="red",lwd=2,lty=1) lines(tyrs,kal.ex,type="l",col="green",lwd=2,lty=2) } legend("bottomright",c("True","Dennis","KalmanEM"),pch=c(1,-1,-1), col=c(1,2,3),lty=c(-1,1,2),lwd=c(-1,2,2),bty="n") 60 8 Count-based PVA 1. Change sim.R and rerun the Example 8.2 code. Then run the Example 8.3 code. When are the estimates using the process-error only model (den91) worse and in what way are they worse? 2. You might imagine that you should always use a model that includes observation error, since in practice observations are never perfect. However, there is a cost to estimating that extra variance parameter and the cost is a more variable σ 2 (Q) estimate. Play with shortening the time series and decreasing the sim.R values. Are there situations when the ‘cost’ of the extra parameter is greater than the ‘cost’ of ignoring observation error? 3. How does changing the extinction threshold (pd) change the extinction probability curves? (Do not remake the data, i.e. don’t rerun the Example 8.2 code.) 4. How does changing the rate of decline (sim.u) change the estimates of risk? Rerun the Example 8.2 code using a lower u; this will create a new matrix of parameter estimates. Then run the Example 8.3 code. Do the estimates seem better of worse for rapidly declining populations? 5. Rerun the Example 8.2 code using fewer number of years (nYr smaller) and increase fracmiss. Then run the Example 8.3 code. The graphs will start to look peculiar. Why do you think it is doing that? Hint: look at the estimated parameters. 8.5 Certain and uncertain regions From Example 8.3, you have observed one of the problems with estimates of the probability of hitting thresholds. Looking over the nine simulations, your risk estimates will be on the true line sometimes and other times they are way off. So your estimates are variable and one should not present only the point estimates of the probability of 90% decline. At the minimum, confidence intervals need to be added (next section), but even with confidence intervals, the probability of hitting declines often does not capture our certainty and uncertainty about extinction risk estimates. From Example 8.3, you might have also noticed that there are some time horizons (10, 20 years) for which the estimate are highly certain (the threshold is never hit), while for other time horizons (30, 50 years) the estimates are all over the map. Put another way, you may be able to say with high confidence that a 90% decline will not occur between years 1 to 20 and that by year 100 it most surely will have occurred. However, between the years 20 and 100, you are very uncertain about the risk. The point is that you can be certain about some forecasts while at the same time being uncertain about other forecasts. 8.5 Certain and uncertain regions 61 One way to show this is to plot the uncertainty as a function of the forecast, where the forecast is defined in terms of the forecast length (number of years) and forecasted decline (percentage). Uncertainty is defined as how much of the 0-1 range your 95% confidence interval covers. Ellner and Holmes (2008) show such a figure (their Figure 1). Figure 8.5 shows a version of this figure that you can produce with the function CSEGtmufigure(u= val, N= val, s2p= val). For the figure, the values u = −0.05 which is a 5% per year decline, N = 25 so 25 years between the first and last census, and s2p = 0.01 are used. The process variability for big mammals is typically in the range of 0.002 to 0.02. −1.0 high certainty P<0.05 high certainty P>0.95 uncertain highly uncertain 50% 90% −1.5 −2.0 xe = log10(N0/Ne) −0.5 0.0 nyrs = 30 mu = −0.05 s2.p = 0.01 99% 20 40 60 80 100 Projection interval T yrs Fig. 8.5. This figure shows your region of high uncertainty (dark grey). In this region, the minimum 95% confidence intervals (meaning if you had no observation error) span 80% of the 0 to 1 probability. That is, you are uncertain if the probability of a specified decline is close to 0 or close to 1. The green (dots) shows where your upper 95% CIs does not exceed P=0.05. So you are quite sure the probability of a specified decline is less than 0.05. The red (dots) shows where your lower 95% confidence interval is above P=.95. So you are quite sure the probability is greater than P=0.95. The light grey is between these two certain/uncertain extremes. 62 8 Count-based PVA Example 8.4 (Uncertain and certain regions) Use the Example 8.4 code to re-create Figure 8.5 and get a feel for when risk estimates are more certain and when they are less certain. N are the number of years of data, u is the mean population growth rate, and s2p is the process variance. Exercise 8.4 code Type show.doc(MARSS, Case_study_1.R) to open a file with all the example code. par(mfrow = c(1, 1)) CSEGtmufigure(N = 30, u = -0.05, s2p = 0.01) 8.6 More risk metrics and some real data The previous sections have focused on the probability of hitting thresholds because this is an important and common risk metric used in population viability analysis and it appears in IUCN Red List criteria. However, as you have seen, there is high uncertainty associated with such estimates. Part of the problem is that probability is constrained to be 0 to 1, and it is easy to get estimates with confidence intervals that span 0 to 1. Other metrics of risk, û and the distribution of the time to hit a threshold (Dennis et al., 1991), do not have this problem and may be more informative. Figure 8.6 shows different risk metrics from Dennis et al. (1991) on a single plot. This figure is generated by a call to the function CSEGriskfigure(): dat=read.table(datafile, skip=1) dat=as.matrix(dat) CSEGriskfigure(dat) The datafile is the name of the data file, with years in column 1 and population count (logged) in column 2. CSEGriskfigure() has a number of arguments that can be passed in to change the default behavior. The variable te is the forecast length (default is 100 years), threshold is the extinction threshold either as an absolute number, if absolutethresh=TRUE, or as a fraction of current population count, if absolutethresh=FALSE. The default is absolutethresh=FALSE and threshold=0.1. datalogged=TRUE means the data are already logged; this is the default. Example 8.5 (Risk figures for different species) 8.6 More risk metrics and some real data ● ● ● 20 ● ● ● ● ● ● ● ● ● ● ● 1.0 0.8 0.6 0.4 0 40 60 80 100 Prob. of hitting threshold in 100 yrs 150 0.8 0.6 0.4 0.2 probability to hit threshold 100 90% threshold 0.0 0.010 50 1.0 PDF of time to threshold given it IS reached 0.020 years into future 200 1.5 2.0 2.5 3.0 3.5 4.0 4.5 Number of ind. at Ne Sample projections nyrs = 22 mu = −0.054 s2.p = 0.058 xe = log10(N0/Ne) 100 60 0 20 40 60 years into the future 80 100 −2.0 −1.5 −1.0 −0.5 140 0.0 years into future 0 20 N 20 Year 0.000 probability to hit threshold 1970 1974 1978 1982 1986 1990 0 95% CI 75% CI mean 0.2 ● probability to hit threshold ● 0.0 60 ● ● 63 Prob. to hit 2 ● 40 Pop. Estimate 80 u est = −0.054 (95% CIs −0.16 , 0.053 ) Q est = 0.058 50% 90% 99% 20 40 60 80 100 Projection interval T yrs Fig. 8.6. Risk figure using data for the critically endangered African Wild Dog (data from Ginsberg et al. 1995). This population went extinct after 1992. Use the Example 8.5 code to re-create Figure 8.6. The package includes other data for you to run: prairiechicken from the endangered Attwater Prairie Chicken, graywhales from Gerber et al. (1999), and grouse from the Sharptailed Grouse (a species of U.S. federal concern) in Washington State. Note for some of these other datasets, the Hessian matrix cannot be inverted and you will need to use CI.method="parametric". If you have other text files of data, you can run those too. The commented lines show how to read in data from a tab-delimited text file with a header line. 64 8 Count-based PVA Exercise 5 code Type show.doc(MARSS, Case_study_1.R) to open a file with the example code. #If you have your data in a tab delimited file with a header #This is how you would read it in using file.choose() #to call up a directory browser. #However, the package has the datasets for the exercises #dat=read.table(file.choose(), skip=1) #dat=as.matrix(dat) dat = wilddogs CSEGriskfigure(dat, CI.method="hessian", silent=TRUE) 8.7 Confidence intervals The figures produced by CSEGriskfigure() have confidence intervals (95% and 75%) on the probabilities in the top right panel. A standard way to produce these intervals is via parametric bootstrapping. Here are the steps in a parametric bootstrap: You estimate u, σ 2 and η 2 Then you simulate time series using those estimates and Equations 8.1 and 8.2 Then you re-estimate your parameters from the simulated data (using say MARSS(simdata) Repeat for 1000s of time series simulated using your estimated parameters. This gives you a large set of bootstrapped parameter estimates For each bootstrapped parameter set, compute a set of extinction estimates (you use Equation 8.3 and code from Example 8.3) The α% ranges on those bootstrapped extinction estimates gives you your α confidence intervals on your probabilities of hitting thresholds The MARSS package provides the function MARSSparamCIs() to add bootstrapped confidence intervals to fitted models (type ?MARSSparamCIs to learn about the function). In the function CSEGriskfigure(), you can set CI.method = c("hessian", "parametric", "innovations", "none") to tell it how to compute the confidence intervals. The methods ‘parametric’ and ‘innovations’ specify parametric and non-parametric bootstrapping respectively. Producing parameter estimates by bootstrapping is quite slow. Approximate confidence intervals on the parameters can be generated rapidly using the inverse of a numerically estimated Hessian matrix (method ‘hessian’). This uses an estimate of the 8.8 Comments 65 variance-covariance matrix of the parameters (the inverse of the Hessian matrix). Using an estimated Hessian matrix to compute confidence intervals is a handy trick that can be used for all sorts of maximum-likelihood parameter estimates. 8.8 Comments Data with cycles, from age-structure or predator-prey interactions, are difficult to analyze and the Kalman-EM algorithm used in the MARSS package will give poor estimates for this type of data. The slope method (Holmes, 2001) is robust to those problems. Holmes et al. (2007) used the slope method in a large study of data from endangered and threatened species, and Ellner and Holmes (2008) showed that the slope estimates are close to the theoretical minimum uncertainty. Especially, when doing a population viability analysis using a time series with fewer than 25 years of data, the slope method is often less biased and (much) less variable because that method is less data-hungry (Holmes, 2004). However the slope method is not a true maximum-likelihood method and thus constrains the types of further analyses you can do (such as model selection). 9 Case study 2: Combining multi-site and subpopulation data to estimate regional population dynamics 9.1 The problem In this case study, we will use multivariate state-space models to combine surveys from multiple regions (or sites) into one estimate of the average longterm population growth rate and the year-to-year variability in that growth rate. Note this is not quite the same as estimating the ‘trend’; ‘trend’ often means what population change happened, whereas the long-term population growth rate refers to the underlying population dynamics. We will use as our example a dataset from harbor seals in Puget Sound, Washington, USA. We have five regions (or sites) where harbor seals were censused from 19781999 while hauled out of land1 . During the period of this dataset, harbor seals were recovering steadily after having been reduced to low levels by hunting prior to protection. The methodologies were consistent throughout the 20 years of the data but we do not know what fraction of the population that each region represents nor do we know the observation-error variance for each region. Given differences between behaviors of animals in different regions and the numbers of haul-outs in each region, the observation errors may be quite different. The regions have had different levels of sampling; the best sampled region has only 4 years missing while the worst has over half the years missing. Figure 9.1 shows the data. The numbers on each line denote the different regions: 1 2 3 4 5 1 SJF SJI EBays PSnd HC Jeffries et al. 2003. Trends and status of harbor seals in Washington State: 19781999. Journal of Wildlife Management 67(1):208–219 68 9 Combining multi-site and subpopulation data 8.5 Puget Sound Harbor Seal Surveys 8.0 2 2 2 2 2 2 2 2 2 2 2 2 3 1 2 2 3 3 1 3 1 3 1 3 3 3 3 2 3 1 1 3 2 3 3 3 1 1 1 1 3 3 1 1 1 5 4 4 1 1 5 4 5 4 4 4 1 4 1 4 4 5 5 5 5 7.5 7.0 6.0 6.5 log(counts) 2 2 3 5 1 4 1980 1985 1990 1995 Fig. 9.1. Plot of the of the count data from the five harbor seal regions (Jeffries et al. 2003). Each region is an index of the total harbor seal population, but the bias (the difference between the index and the true population size) for each region is unknown. For this case study, we will assume that the underlying population process is a stochastic exponential growth process with rates of increase that were not changing through 1978-1999. However, we are not sure if all five regions sample a single “total Puget Sound” population or if there are independent subpopulations. You are going to estimate the long-term population growth rate using different assumptions about the population structures (one big population versus multiple smaller ones) and observation error structures to see how your assumptions change your estimates. The data for this case study are in the MARSS package. The data have time running down the rows and years in the first column. We need time across the columns for the MARSS() function, so we will transpose the data: dat=t(harborSealWA) #Transpose years = dat[1,] #[1,] means row 1 n = nrow(dat)-1 dat = dat[2:nrow(dat),] #no years 9.2 Analysis assuming a single total Puget Sound population 69 If you needed to read data in from a comma-delimited or tab-delimited file, these are the commands to do that: dat = read.csv("datafile.csv",header=TRUE) dat = read.table("datafile.csv",header=TRUE) The years (years) are in row 1 of dat and the logged data are in the rest of the rows. The number of observation time series (n) is the number of rows in dat minus 1 (for years row). Let’s look at the first few years of data: print(harborSealWA[1:8,], digits=3) [1,] [2,] [3,] [4,] [5,] [6,] [7,] [8,] Years 1978 1979 1980 1981 1982 1983 1984 1985 SJF 6.03 -99.00 -99.00 -99.00 -99.00 6.78 6.93 7.16 SJI 6.75 -99.00 -99.00 -99.00 -99.00 7.43 7.74 7.53 EBays 6.63 -99.00 -99.00 -99.00 -99.00 7.21 7.45 7.26 PSnd 5.82 -99.00 -99.00 -99.00 -99.00 -99.00 -99.00 6.60 HC 6.6 -99.0 -99.0 -99.0 -99.0 -99.0 -99.0 -99.0 The -99’s in the data are missing values. The algorithm will ignore those values. 9.2 Analysis assuming a single total Puget Sound population The first step in a state-space modeling analysis is to specify the population structure and how the regions relate to that structure. The general state-space model is xt = Bxt−1 + u + vt , where vt ∼ MVN(0, Q) yt = Zxt + a + wt , where wt ∼ MVN(0, R) (9.1) (9.2) where all the bolded symbols are matrices. To specify the structure of the population and observations, we will specify what those matrices look like. 9.2.1 A single population process, x When we are looking at data over a large geographic region, we might make the assumption that the different census regions are measuring a single population if we think animals are moving sufficiently such that the whole area (multiple regions together) is ”well-mixed”. We write a model of the total population abundance as: nt = exp(u + vt )nt−1 , (9.3) 70 9 Combining multi-site and subpopulation data where nt is the total count in year t, u is the mean population growth rate, and vt is the deviation from that average in year t. We then take the log of both sides and write the model in log space: xt = xt−1 + u + vt , where vt ∼ N(0, q) (9.4) xt = log nt . When there is one effective population, there is one x, therefore xt is a 1 × 1 matrix. There is one population growth rate (u) and there is one process variance (q). Thus u and Q are 1 × 1 matrices. 9.2.2 The observation process, y For this first analysis, we assume that all five regional time series are observing this one population trajectory but they are scaled up or down relative to that trajectory. In effect, we think that animals are moving around a lot and our regional samples are some fraction of the population. There is year-to-year variation in the fraction in each region, just by chance. Notice that under this analysis, we do not think the regions represent independent subpopulations but rather independent observations of one population. Our model for the data, yt = Zxt + a + wt , is written as: y1,t 0 1 w1,t y2,t 1 a2 w2,t y3,t = 1 xt + a3 + w3,t (9.5) y4,t 1 a4 w4,t 1 y5,t a5 w5,t Each yi is the time series for a different region. The a’s are the bias between the regional sample and the total population. The a’s are scaling (or interceptlike) parameters2 . We allow that each region could have a unique observation variance and that the observation errors are independent between regions. Lastly, we assume that the observations errors on log(counts) are normal and thus the errors on (counts) are log-normal.3 We specify independent observation errors with unique variances by specifying that the w’s come from a multivariate normal distribution with variancecovariance matrix R (w ∼ MVN(0, R)), where 2 3 To get rid of the a’s, we scale multiple observation time series against each other; thus one a will be fixed at 0. Estimating the bias between regional indices and the total population is important for getting an estimate of the total population size. The type of time-series analysis that we are doing here (trend analysis) is not useful for estimating a’s. Instead to get a’s one would need some type of mark-recapture data. However, for trend estimation, the a’s are not important. The regional observation variance captures increased variance due to a regional estimate being a smaller sample of th total population. The assumption of normality is not unreasonable since these regional counts are the sum of counts across multiple haul-outs. 9.2 Analysis assuming a single total Puget Sound population r1 0 0 0 r2 0 0 0 r3 R= 0 0 0 0 0 0 0 0 0 r4 0 0 0 0 0 r5 71 (9.6) Z specifies which observation time series, yi,1:T , is associated with which population trajectory, xj,1:T . Z is like a look up table with 1 row for each of the n observation time series and 1 column for each of the m population trajectories. A 1 in row i column j means that observation time series i is measuring state process j. Otherwise the value in Zij = 0. Since we have only 1 population trajectory, all the regions must be measuring that one population trajectory. Thus Z is n × 1: 1 1 (9.7) Z= 1 1 1 9.2.3 Set the constraints for MARSS Now that we have specified our state-space model, we set the arguments that will tell the function MARSS() the structure of our model. We do this by passing in the argument constraint to MARSS(). constraint is a list which specifies any constraints on Z, u, Q, etc. The function call will now look like: kem = MARSS(dat, constraint=list(Z=Z.constraint, U=U.constraint, Q=Q.constraint, R=R.constraint) ) First we set the Z constraint. We need to tell the MARSS function that Z is a 5×1 matrix of 1s (as in Equation 9.5). We can do this two ways. We can pass in Z.constraint as a matrix of ones, matrix(1,5,1), just like in Equation (9.5) or we can pass in a vector of five factors, factor(c(1,1,1,1,1)). The ith factor specifies which population trajectory the i-th observation time series belongs to. Since there is only one population trajectory in this first analysis, we will have a vector of five 1’s: every observation time series is measuring the first, and only, population trajectory. Z.constraint = factor(c(1,1,1,1,1)) Note, the vector (the c() bit) must be wrapped in factor() so that MARSS recognizes what it is. You can use either numeric or character vectors: c(1,1,1,1,1) is the same as c("PS","PS","PS","PS","PS"). Next we specify that the R variance-covariance matrix only has terms on the diagonal (the variances) with the off-diagonal terms (the covariances) equal to zero4 : 4 For the EM function in the MARSS 1.0 package, the measurement errors must be uncorrelated if there are missing values in the data. 72 9 Combining multi-site and subpopulation data R.constraint = "diagonal and unequal" The ‘and unequal’ part specifies that the variances are allowed to be unique on the diagonal. If we wanted to force the observation variances to be equal at all regions, we would use "diagonal and equal". For the first analysis, we only need to set constraints on Z and R. Since there is only one population, there is only one u and Q (they are scalars), so there are no constraints to set on them. 9 Observations and total population estimate 2 2 2 2 2 2 2 7 3 2 1 2 2 3 1 3 1 3 1 3 3 3 3 3 2 3 3 1 1 2 3 3 3 1 1 1 3 1 3 1 1 1 5 4 4 4 4 1 1 5 4 5 4 1 4 1 4 5 4 5 5 5 2 3 5 1 4 5 6 index of log abundance 8 2 2 2 2 2 1980 1985 1990 1995 Fig. 9.2. Plot of the estimate of “log total harbor seals in Puget Sound” (minus the unknown bias for time series 1) against the data. The estimate of the total seal count has been scaled relative to the first time series. The 95% confidence intervals on the population estimates are the dashed lines. These are not the confidence intervals on the observations, and the observations (the numbers) will not fall between the confidence interval lines. 9.2.4 The MARSS() output The output from MARSS(), here assigned the name kem, is a list of objects. To see all the objects in it, type: 9.2 Analysis assuming a single total Puget Sound population 73 names(kem1) The maximum-likelihood estimates of “total harbor seal population” scaled to the first observation data series (Figure 9.2) are in kem1$states, and kem1$states.se are the standard errors on those estimates. To get 95% confidence intervals, use kem1$states +/- 1.96*kem1$states.se. Figure 9.2 shows a plot of kem1$states with its 95% confidence intervals over the data. Because kem1$states has been scaled relative to the first time series, it is on top of that time series. One of the biases, the as, cannot be estimated and arbitrarily our algorithm choses a1 = 0, so the population estimate is scaled to the first observation time series. The estimated parameters are a list: kem1$par. To get the element U of that list, which is the estimated long-term population growth rate, type in kem1$par$U. Multiply by 100 to get the percent increase per year. The estimated process variance is given by kem1$par$Q. The log-likelihood of the fitted model is in kem1$logLik. We estimated one initial x (t = 1), one process variance, one u, four a’s, and five observation variances’s. So K = 12 parameters. The AIC of this model is −2×loglike+2K, which we can show by typing kem1$AIC. Example 9.1 (Fit the single population model) Analyze the harbor seal data using the single population model (Equations 9.4 and 9.5). The code for Example 9.1 shows you how to input data and send it to the function MARSS(). As you run the examples, add the estimates to the table at the end of the chapter so you can compare estimates across the examples. 74 9 Combining multi-site and subpopulation data Example 9.1 code Type show.doc(MARSS, Case_study_2.R) to open a file with all the example code. #Read in data dat=t(harborSealWA) #Transpose since MARSS needs time ACROSS columns years = dat[1,] n = nrow(dat)-1 dat = dat[2:nrow(dat),] legendnames = (unlist(dimnames(dat)[1])) #estimate parameters Z.constraint = factor(c(1,1,1,1,1)) R.constraint = "diagonal and unequal" kem1 = MARSS(dat, constraint= list(Z=Z.constraint, R=R.constraint)) #make figure matplot(years, t(dat),xlab="",ylab="index of log abundance", pch=c("1","2","3","4","5"),ylim=c(5,9),bty="L") lines(years,kem1$states-1.96*kem1$states.se,type="l", lwd=1,lty=2,col="red") lines(years,kem1$states+1.96*kem1$states.se,type="l", lwd=1,lty=2,col="red") lines(years,kem1$states,type="l",lwd=2) title("Observations and total population estimate",cex.main=.9) #show params kem1$par kem1$logLik kem1$AIC 9.3 Changing the assumption about the observation variances The variable kem1$par$R contains the estimates of the observation error variances. It is a matrix. Here is R from Example 9.1: print(kem1$par$R, digits=3) SJF:1 SJI:2 EBays:3 PSnd:4 HC:5 SJF:1 0.0323 0.0000 0.0000 0.0000 0.0000 SJI:2 EBays:3 PSnd:4 HC:5 0.0000 0.0000 0.0000 0.000 0.0354 0.0000 0.0000 0.000 0.0000 0.0133 0.0000 0.000 0.0000 0.0000 0.0112 0.000 0.0000 0.0000 0.0000 0.196 9.3 Changing the assumption about the observation variances 75 Notice that the variances along the diagonal are all different—we estimated five unique observation variances. We might be able to improve the fit (relative to the number of estimated parameters) by assuming that the observation variance is equal across regions but the errors are independent. This means we estimate one observation variance instead of five. This is a fairly standard assumption for data that come from the uniform survey methodology5 . To impose this constraint, we set the R constraint to R.constraint="diagonal and equal" This tells MARSS that all the r’s along the diagonal in R are the same. To fit this model to the data, call MARSS() as: Z.constraint = factor(c(1,1,1,1,1)) R.constraint = "diagonal and equal" kem2 = MARSS(dat, constraint= list(Z=Z.constraint, R=R.constraint)) We estimated one initial x, one process variance, one u, four a’s, and one observation variance. So K = 8 parameters. The AIC for this new model compared to the old model with five observation variances is: c(kem1$AIC,kem2$AIC) [1] -10.256556 8.370472 A smaller AIC means a better model. The difference between the one observation variance versus the unique observation variances is >10, suggesting that the unique observation variances model is better. Go ahead and type in the R code. Then add the parameter estimates to the table at the back. One of the key diagnostics when you are comparing fits from multiple models, it to examine whether the model is flexible enough to fit the data. You do this by looking for temporal trends in the the residuals between the estimated population states (e.g. kem2$states) and the data. In Figure 9.3, the residuals for the second analysis are shown. Ideally, these residuals should not have a temporal trend. They should look cloud-like. The fact that the residuals have a strong temporal trend is an indication that our one population model is too restrictive for the data6 . Example 9.2 (Fit a model with shared observation variances) 5 6 By the way, this is not a good assumption for these data since the number haulouts in each region varies and the regional counts are the sums across all haul-outs in a region. We will see that this is a poor assumption when we look at the AIC values. When comparing models via AIC, it is important that you only compare models that are flexible enough to fit the data. Fortunately if you neglect to do this, the inadequate models will usually have very high AICs and fall out of the mix anyhow. 9 Combining multi-site and subpopulation data SJI ● ● ● 5 ●● ● ● ● ● 0.0 residuals ● ●● ● ● ● ● 5 ●● ● ● ● ● 5 10 15 Index 0.4 residuals ● ● ● ● ● ● ● ● 0.0 0.1 ● ● HC 0.8 PSnd 0.0 10 15 Index ● residuals ●● ● ● ● ● 10 15 ● ● ● Index ● ● ● −0.4 −0.2 0.0 residuals −0.2 −0.4 ●● ● ● ● ● ● ● ● ● ● EBays ● ● ● ● −0.2 ● 0.2 0.2 ● ● 0.0 0.1 0.2 SJF ● residuals 76 ● ● 2 4 6 Index 8 ● ● −0.4 −0.2 ● ● 1 3 ● 5 7 Index Fig. 9.3. Residuals for the model with a single population. The plots of the residuals should not have trends with time, but they do... This is an indication that the single population model is inconsistent with the data. The code to make this plot is given in the script file for this case study. Analyze the data using the same population model as in Example 9.1, but constrain the R matrix so that all five census regions have the same observation variance. The Example 9.2 code shows you how to do this. It also shows you how to make the diagnostics figure (Figure 9.3). 9.4 Analysis assuming north and south subpopulations 77 Example 9.2 code Type show.doc(MARSS, Case_study_2.R) to open a file with all the example code. #fit model Z.constraint = factor(c(1,1,1,1,1)) R.constraint = "diagonal and equal" kem2 = MARSS(dat, constraint= list(Z=Z.constraint, R=R.constraint)) #show parameters kem2$par$U #population growth rate kem2$par$Q #process variance kem2$par$R[1,1] #observation variance kem2$logLik #log likelihood c(kem1$AIC,kem2$AIC) #plot residuals plotdat = t(dat); plotdat[plotdat == -99] = NA; matrix.of.biases = matrix(kem2$par$A, nrow=nrow(plotdat),ncol=ncol(plotdat),byrow=T) xs = matrix(kem2$states, nrow=dim(plotdat)[1],ncol=dim(plotdat)[2],byrow=F) resids = plotdat-matrix.of.biases-xs par(mfrow=c(2,3)) for(i in 1:n){ plot(resids[!is.na(resids[,i]),i],ylab="residuals") title(legendnames[i]) } par(mfrow=c(1,1)) 9.4 Analysis assuming north and south subpopulations For the third analysis, we will change our assumption about the structure of the population. We will assume that there are two subpopulations, north and south, and that regions 1 and 2 (Strait of Juan de Fuca and San Juan Islands) fall in the north subpopulation and regions 3, 4 and 5 fall in the south subpopulation. For this analysis, we will assume that these two subpopulations share their growth parameter, u, and process variance, q, since they share a similar environment and prey base. However we postulate that because of fidelity to natal rookeries for breeding, animals do not move much year-to-year between the north and south and the two subpopulations are independent. We need to write down the state-space model to reflect this population structure. There are two subpopulations, xn and xs , and they have the same 78 9 Combining multi-site and subpopulation data growth rate u: xn,t xs,t = xn,t−1 u v + + n,t xs,t−1 u vs,t (9.8) We specify that they are independent by specifying that their year-to-year population fluctuations (their process errors) come from a multivariate normal with no covariance: vn,t 0 q0 ∼ MV N , (9.9) vs,t 0 0q For the observation process, we use the Z matrix to associate the regions with their respective xn and xs values: w1,t 0 10 y1,t a2 w2,t y2,t 1 0 xn,t 0 + w3,t y3,t = 0 1 (9.10) + a4 w4,t y4,t 0 1 xs,t w5,t a5 01 y5,t 9.4.1 Specifying the MARSS() arguments We need to change the Z constraint to specify that there are two subpopulations (north and south), and that regions 1 and 2 are in the north subpopulation and regions 3,4 and 5 are in the south subpopulation. There are a few ways, we can specify this Z matrix for MARSS(): Z.constraint = matrix(c(1,1,0,0,0,0,0,1,1,1),5,2) Z.constraint = factor(c(1,1,2,2,2)) Z.constraint = factor(c("N","N","S","S","S")) Which you choose is a matter of preference as the all specify the same form for Z. We also want to specify that the u’s are the same for each subpopulation and that Q is diagonal with equal q’s. To do this, we set U.constraint = "equal" Q.constraint = "diagonal and equal" This says that there is one u and one q parameter and both subpopulations share it (if we wanted the u’s to be different, we would use U.constraint="unequal" or leave off the u constraint since the default behavior is U.constraint="unequal"). Now we specify the new constraints and fit this model to the data: Z.constraint = factor(c(1,1,2,2,2)) U.constraint = "equal" Q.constraint = "diagonal and equal" R.constraint = "diagonal and equal" kem3 = MARSS(dat, constraint=list(Z=Z.constraint, R=R.constraint, U=U.constraint, Q=Q.constraint)) 9.4 Analysis assuming north and south subpopulations 79 Success! Parameters converged at 27 iterations. Alert: conv.test.slope.tol is 0.5. Test with smaller values (<0.1) to ensure convergence. MARSS fit is Estimation method: kem Convergence test: log-log plot with slope tol of 0.5 Estimation converged in 27 iterations. Log-likelihood: 12.23765 AIC: -8.475293 AICc: -6.152712 A.2 A.4 A.5 Q.1 R.1 U.1 x0.1 x0.2 Estimate 0.7987 -0.7746 -0.8403 0.0087 0.0295 0.0503 6.1090 6.9031 Standard errors have not been calculated. Use MARSSparamCIs to compute CIs and bias estimates. Figure 9.4 shows the residuals for the two subpopulations case. The residuals look better (more cloud-like) but the Hood Canal residuals are still temporally correlated. Example 9.3 (Fit a model with north and south subpopulations) Analyze the data using a model with two subpopulations, northern and southern. Assume that the subpopulation are independent (diagonal Q), however let each subpopulation share the same population parameters, u and q. The Example 9.3 code shows how to set the MARSS() arguments for this case. 9 Combining multi-site and subpopulation data SJI 0.15 SJF ●● ● 5 ● ● ● 10 15 ● 5 ● ● ● ●● ● ● 5 10 15 Index 0.2 residuals ● ● 8 ● ● ● ● Index ● ● −0.2 ● 6 ● ● ● ● ● ● ● ● 0.4 0.1 ● 4 ● ● ● HC ● ● −0.1 10 15 Index ● 2 0.1 ● ● residuals ● ● PSnd −0.3 ● ● Index ● ●● ● 0.0 0.05 ● ● ● residuals ● ● ● ● residuals 0.0 ● ● ● −0.15 −0.05 ● ● ● ● ● ● ● ● EBays ● ● ● −0.2 residuals 0.2 ● −0.2 80 1 3 ● 5 7 Index Fig. 9.4. The residuals for the analysis with a north and south subpopulation. The plots of the residuals should not have trends with time. Compare with the residuals for the analysis with one subpopulation. Example 9.3 code Type show.doc(MARSS, Case_study_2.R) to open a file with all the example code. #fit model Z.constraint = factor(c(1,1,2,2,2)) U.constraint = "equal" Q.constraint = "diagonal and equal" R.constraint = "diagonal and equal" kem3 = MARSS(dat, constraint=list(Z=Z.constraint, R=R.constraint, U=U.constraint, Q=Q.constraint)) #plot residuals plotdat = t(dat); plotdat[plotdat == -99] = NA; matrix.of.biases = matrix(kem3$par$A, nrow=nrow(plotdat),ncol=ncol(plotdat),byrow=T) par(mfrow=c(2,3)) for(i in 1:n){ j=c(1,1,2,2,2) xs = kem3$states[j[i],] resids = plotdat[,i]-matrix.of.biases[,i]-xs plot(resids[!is.na(resids)],ylab="residuals") title(legendnames[i]) } par(mfrow=c(1,1)) 9.5 Using MARSS() to fit other population structures 81 9.5 Using MARSS() to fit other population structures Now work through a number of different structures and fill out the table at the back of this case study. At the end you will see how your estimation of the mean population growth rate varies under different assumptions about the population and the data. Example 9.4 (Five subpopulations) Analyze the data using a model with five subpopulations, where each of the five census regions is sampling one of the subpopulations. Assume that the subpopulation are independent (diagonal Q), however let each subpopulation share the same population parameters, u and q. The Example 9.4 code shows how to set the MARSS() arguments for this case. You can use R.constraint="diagonal and equal" to make all the observation variances equal. Example 9.4 code Type show.doc(MARSS, Case_study_2.R) to open a file with all the example code. Z.constraint=factor(c(1,2,3,4,5)) U.constraint="equal" Q.constraint="diagonal and equal" R.constraint="diagonal and unequal" kem=MARSS(dat, constraint=list(Z=Z.constraint, U=U.constraint, Q=Q.constraint, R=R.constraint) ) Example 9.5 (Two subpopulations with different population parameters) Analyze the data using a model that assumes that the Strait of Juan de Fuca and San Juan Islands census regions represent a northern Puget Sound subpopulation, while the other three regions represent a southern Puget Sound subpopulation. This time assume that each population trajectory (north and south) has different u and q parameters: un ,us and qn ,qs . Also assume that each of the five census regions has a different observation variance. Try to write your own code. If you get stuck (or want to check your work, you can open a script file with all the Case Study 2 examples by typing show.doc(MARSS, Case_study_2.R) at the R command line. 82 9 Combining multi-site and subpopulation data In math form, this model is: xn,t xn,t−1 u v v q 0 = + n + n,t , n,t ∼ MVN 0, n (9.11) xs,t xs,t−1 us vs,t vs,t 0 qs 1 y1,t y2,t 1 y3,t = 0 y4,t 0 0 y5,t w1,t 0 0 a2 w2,t 0 xn,t 0 + w3,t 1 + x a4 w4,t 1 s,t w5,t a5 1 (9.12) Example 9.6 (Hood Canal treated separately but covaries with others) Analyze the data using a model with two subpopulations with the divisions being Hood Canal versus everywhere else. In math form, this model is: xp,t xp,t−1 up v v qc = + + p,t , p,t ∼ MVN 0, (9.13) xh,t xh,t−1 uh vh,t vh,t cq y1,t 1 y2,t 1 y3,t = 1 y4,t 1 0 y5,t 0 0 w1,t a2 w2,t 0 xp,t 0 + a3 + w3,t x a4 w4,t 0 h,t 1 0 w5,t (9.14) To specify that Q has one value on the diagonal (one variance) and one value on the off-diagonal (covariance) you can specify Q.constraint two ways: Q.constraint = "equalvarcov" Q.constraint = matrix(c("q","c","c","q"),2,2) Example 9.7 (Three subpopulations with shared parameter values) Analyze the data using a model with three subpopulations as follows: north (regions 1 and 2), south (regions 3 and 4), Hood Canal (region 5). You can specify that some subpopulations share parameters while others do not. You do this by using a vector of factors for the constraints: 9.6 Discussion 83 Q.constraint=factor(c("coastal","interior","interior")) U.constraint=factor(c("puget sound","puget sound","hood canal")) R.constraint=factor(c("boat","boat","plane","plane","plane")) When Q.constraint and U.constraint are vectors (passed in as a factor), as above, they specify which x’s share parameter values. The factors must be a vector of length m, where m is the number of x’s. The i-th factor corresponds to the i-th x. In the example above, we specified that x1 has its own process variance (which we named “coastal”) and x2 and x3 share a process variance value (which we named “interior”). For the long-term trends, we specified that x1 and x2 share a long-term trend (“puget sound”) while x3 is allowed to have a separate trend (“hood canal”). When R.constraint is vector of factors, it specifies which y’s have the same observation variance. We need a 1 × 5 vector here because we need to specify a value for each observation time series (there are 5). Here we imagine that observation time series 1 and 2 are boat surveys while the others are plane surveys and we want to allow the variances to differ based on methodology. 9.6 Discussion There are a number of corners that we cut in order to have case study code that runs quickly: We ran the code starting from one initial condition. For a real analysis, you should start from a large number of random initial conditions and use the one that gives the highest likelihood. Since the EM algorithm is a “hill-climbing” algorithm, this ensures that it does not get stuck on a local maxima. MARSS() will do this for you if you pass it the argument control=list(MCInit=TRUE). This will use a Monte Carlo routine to try many different initial conditions. See the help file on MARSS() for more information (by typing ?MARSS at the R prompt). We assume independent observation and process errors. Depending on your system, observation errors may be driven by large-scale environmental factors (temperature, tides, prey locations) that would cause your observation errors to covary across regions. If your observation errors strongly covary between regions and you treat them as independent, this could be bad for your analysis. The current EM code will not handle covariance in R when there are missing data, but even it did, separating covariance across observation versus process errors will require much data (to have any power). In practice, the first step is to think hard about what drives sightability for your species and what are the relative levels of process and observation variance. You may be able to subsample your data in a way that will make the observation errors more independent. 84 9 Combining multi-site and subpopulation data The MARSS() argument control specifies the options for the EM algorithm. We left the default tolerance, abstol=0.01. You would want to set this lower, e.g. abstol=0.0001, for a real analysis. You will need to up the maxit argument correspondingly. We used the large-sample approximation for AIC instead of a bootstrap AIC that is designed to correct for small sample size in state-space models. The bootstrap metric, AICb, takes a long time to run. Use the call MARSSaic(kem, output=c("AICbp")) to compute AICb. We could have shown AICc, which is the small-sample size corrector for non-state-space models. Type kem$AICc to get that. Finally, in a real (maximum-likelihood) analysis, one needs to be careful not to dredge the data. The temptation is to look at the data and pick a population structure that will fit that data. This can lead to including models in your analysis that have no biological basis. In practice, we spend a lot of time discussing the population structure with biologists working on the species and review all the biological data that might tell us what are reasonable structures. From that, a set of model structures to use are selected. Other times, a particular model structure needs to be used because the population structure is not in question rather it is a matter of using that pre-specified structure and using all the data to get parameter estimates for forecasting. 9.6 Discussion 85 Results table pop. growth process K log-like rate variance kem$num. kem$ AIC kem$par$U kem$par$Q params logLik kem$AIC Ex. 1 2 3 4 5 6 7 one population different obs. vars uncorrelated one population identical obs vars uncorrelated N+S subpops identical obs vars uncorrelated; 5 subpops unique obs vars u’s + q’s identical N+S subpops unique obs vars u’s + q’s identical PS + HC subpops unique obs vars u’s + q’s unique N + S + HC subpops unique obs vars u’s + q’s unique For AIC, only the relative differences matter. A difference of 10 between two AICs means substantially more support for the model with lower AIC. A difference of 30 or 40 between two AICs is very large. Questions 1. Do different assumptions about whether the observation error variances are all identical versus different affect your estimate of the long-term population growth rate (u)? You may want to rerun examples 3-7 with the R.constraint changed. R.constraint="diagonal and unequal" means measurement variances all different versus "diagonal and equal". 2. Do assumptions about the underlying structure of the population affect your estimates of u? Structure here means number of subpopulations and which areas are in which subpopulation. 86 9 Combining multi-site and subpopulation data 3. The confidence intervals for the first two analyses are very tight because the estimate process variance was very small, kem1$par$Q. Why do you think process variance (q) was forced to be so small? [Hint: We are forcing there to be one and only one true population trajectory and all the observation time series have to fit that one time series. Look at the AICs too.] 10 Case Study 3: Using MARSS models to identify spatial population structure and covariance 10.1 The problem In this case study, we use time series of observations from nine sites along the west coast to examine large-scale spatial structure in harbor seals (Jeffries et al., 2003). Harbor seals are distributed along the west coast of the U.S. from California to Washington. The populations in Oregon and Washington have been surveyed for over 25 years at a number of haul-out sites (Figure 10.1). In general, these populations have been increasing steadily since the 1972 Marine Mammal Protection Act. It remains unknown whether they are at carrying capacity. For management purposes, two stocks are recognized; the coastal stock consists of four sites (Northern/Southern Oregon, Coastal Estuaries, Olympic Peninsula), and the inland WA stock consists of the remaining five sites (Figure 10.1). Subtle differences exist in the demographics across sites (e.g. pupping dates), however mtDNA analyses and tagging studies have suggested that these sites may be structured on a much larger scale. Harbor seals are known for strong site fidelity, but at the same time travel large distances to forage. Our goal for this case study is to address the following questions about spatial structure: 1) Does population abundance data support the existing management boundaries, or are there alternative groupings that receive more support? and 2) Does the Hood Canal site represent a distinct subpopulation? To address these questions, we will mathematically formulate different hypotheses about population structure via different MARSS models; each model represents a different population structure. We will then compare the data support for different models using model selection criteria, specifically AIC. Type show.doc(MARSS, Case_study_3.R) to open a file with the R code to get you started on the analyses in this chapter. 88 Figure 01. Map of spatial distribution of 9 harbor seal sites in Washington and Oregon. 10 Using MARSS models to identify spatial population structure and covariance San Juans Eastern Bays Juan de Fuca Puget Sound Olympic Peninsula Hood Canal Coastal Estuaries Northern Coast Southern Coast Fig. 10.1. Map of spatial distribution of 9 harbor seal sites in Washington and Oregon. 10.2 How many distinct subpopulations? We will analyze the support for five hypotheses about the population structure. These do not represent all possible structures but instead represent those that are considered most biologically plausible given the geography and the behavior of harbor seals. Hypothesis Hypothesis Hypothesis Hypothesis Hypothesis 1 2 3 4 5 Sites are grouped by stock (m = 2), unique process variances Sites are grouped by stock (m = 2), same process variance Sites are grouped by state (m = 2), unique process variances Sites are grouped by state (m = 2), same process variance All sites are part of the same panmictic population (m = 1) Aerial survey methodology has been relatively constant across time and space, and we will assume that all sites have identical and independent observation error variance. 10.2 How many distinct subpopulations? 89 10.2.1 Specify the design, Z, matrices Write down the Z matrices for the hypotheses. Hint: Hypothesis 1 and 2 have the same Z matrix, Hypothesis 3 and 4 have the same Z matrix and Hypothesis 5 is a column of 1s. Coastal Estuaries Olympic Peninsula Str. Juan de Fuca San Juan Islands Eastern Bays Puget Sound Hood Canal OR North Coast OR South Coast H 1 and 2 H 3 and 4 H5 Z Z Z subpop subpop subpop subpop subpop 1 2 1 2 1 Next you need to specify the constraints argument so that MARSS knows the structure of your Z’s. The Z constraint will be a vector of factors, i.e. it will have the form factor(c(....)). Hypothesis 1 and 2: Z.constraint= Hypothesis 3 and 4: Z.constraint= Hypothesis 5: Z.constraint= 10.2.2 Specify the grouping arguments For this case study, we will assume that subpopulations share the same growth rate. What should U.constraint be for each hypothesis? To specify shared u parameters, U.constraint is set as a length m vector of factors and specifies which subpopulations share their u parameter. Written in R it takes the form factor(c(#,#,...)) Hypothesis 1-4: U.constraint= Hypothesis 5: U.constraint= What about Q.constraint? To specify a diagonal Q matrix with shared values along the diagonal, Q.constraint is set as a length m vector of factors. The vector specifies which xi ’s share their process variance parameter. Look at each hypothesis (above) and write down the corresponding Q.constraint. 90 10 Using MARSS models to identify spatial population structure and covariance Hypothesis Hypothesis Hypothesis Hypothesis Hypothesis 1: 2: 3: 4: 5: Q.constraint= Q.constraint= Q.constraint= Q.constraint= Q.constraint= Lastly, specify R.constraint. As we mentioned above, we will assume that the observation errors are independent and the observation variance is the same across sites. You can specify this constraint either as a text string or as a n length vector of factors. Hypothesis 1-5: R.constraint= 10.2.3 Fit models and summarize results Fit each model for each hypothesis to the seal data (look at the script Case_Study_3.R for the code to load the data). Each call to MARSS() will look like kem = MARSS(sealData, constraint=list(Z = Z.constraint, Q = Q.constraint, R = R.constraint, U = U.constraint)) Fill in the following table, by fitting the five state-space models—for the five hypotheses—to the harbor seal data (using MARSS()). Use the Case_Study_3.R script so you do not have to type in all the commands. 10.2.4 Interpret results for question 1 What do these results indicate about the process error grouping and spatial grouping? A lower AIC means a more parsimonious model (highest likelihood given the number of parameters). A difference of 10 between AICs is large, and means the model with the higher AIC is unsupported relative to the model with lower AIC. Extra analysis (if you have time): Do your results change if you assume that observation errors are independent but have unique variances? The nine sites have different numbers of haul-outs and so the observation variances might be different. Repeat the analysis with unique observation variances for each site (this means changing R.constraint). You can also try the analysis with temporally co-varying subpopulations (good and bad years correlated) by setting Q.constraint="unconstrained" or Q.constraint="equalvarcov". 10.3 Is Hood Canal separate? 91 Table 10.1. Table to fill out for the five hypotheses from the first analysis (Section 10.2). The code of the form $foo$bar shows you what to type at the command line to output each parameter or metric. Remember to add the name of the model fit, e.g. kem$foo$bar where kem is the name you gave to the model fit. H pop. growth K rate proc. variance obs. variance $num. log-like AIC AICc $par$U $par$Q $par$R params $logLik $AIC $AICc 1 2 3 4 5 10.3 Is Hood Canal separate? The Hood Canal site may represent a distinct population, and has recently been subjected to a number of catastrophic events (hypoxic events, possibly leading to reduced prey availability, and several killer whale predation events, removing up to 50% of animals per occurrence). Build four models, assuming that each site (other than Hood Canal) is assigned to its current management stock, but Hood Canal is a different subpopulation (m = 3). Again, assume that observation error variance is identical and independent across sites. Hypothesis Hypothesis rate Hypothesis rate Hypothesis 1 Subpopulations have the same process variance and growth rate 2 Each subpopulation has a unique process variance and growth 3 Hood Canal has the same process variance but different growth 4 Hood Canal has unique process variance and unique growth rate 10.3.1 Specify the Z matrix and Z.constraint The Z matrix for each hypothesis is the same. The coastal subpopulation consists of 4 sites (Northern/Southern Oregon, Coastal Estuaries, Olympic Peninsula), the Hood Canal subpopulation is the Hood Canal site, and the 92 10 Using MARSS models to identify spatial population structure and covariance inland WA subpopulation consists of the remaining 4 sites. Thus m = 3 and Z is a 9 × 3 matrix: Coastal Estuaries Olympic Peninsula Str. Juan de Fuca San Juan Islands Eastern Bays Puget Sound Hood Canal OR North Coast OR South Coast subpop subpop subpop 2 3 1 Then write down Z.constraint for this Z: factor(c(...)) 10.3.2 Specify which parameters are shared across which subpopulations U.groups specifies which u are shared across subpopulations. Look at the hypothesis descriptions above which will specify whether subpopulations share their population growth rate or have unique population growth rates. Hypothesis Hypothesis Hypothesis Hypothesis 1: 2: 3: 4: U.constraint= U.constraint= U.constraint= U.constraint= U.constraint will be a length m vector of factors. Once you have more than two subpopulations, it can get hard to keep straight which U.constraint goes to which subpopulation. It is best to sketch your Z matrix (which tells you which site in the rows corresponds to which subpopulation in the columns). Then remember that the elements of U.constraint correspond one-to-one with the columns of Z: U.constraint=factor(c(col 1 Z, col 2 Z, col 3 Z, ..)). Specify Q.groups showing which subpopulations share their process variance parameter. Hypothesis Hypothesis Hypothesis Hypothesis 1: 2: 3: 4: Q.constraint= Q.constraint= Q.constraint= Q.constraint= Q.constraint will be a length m vector of factors. R.constraint is set so that the observation variances are the same for each site. 10.3 Is Hood Canal separate? 93 10.3.3 Fit the models and summarize results Fit each model for each hypothesis to the seal data. Each call to MARSS() will look like kem = MARSS(sealData, constraint=list(Z = Z.constraint, Q = Q.constraint, R = R.constraint, U = U.constraint)) Table 10.2. Table to fill out for the four hypotheses from the second analysis (Section 10.3). The code of the form $foo$bar shows you what to type at the command line to output each parameter or metric. Remember to add the name of the model fit, e.g. kem$foo$bar where kem is the name you gave to the model fit. H pop. growth K rate proc. variance obs. variance $num. log-like AIC AICc $par$U $par$Q $par$R params $logLik $AIC $AICc 1 2 3 4 10.3.4 Interpret results for question 2 How do the residuals for the Hood Canal site compare from these models relative to the best model from question 1? Hint: If you have the vector of estimated population states (Xpred = t(kem$states)) and the data (Xobs = sealData), the residuals for site i can be plotted in R as: Xpred = t(kem$states) Xobs = sealData plot(Xpred[, Z.constraint[i]] - Xobs[,i], ylab="Predicted-Observed Data") 94 10 Using MARSS models to identify spatial population structure and covariance In R , if you have a matrix Y[1:numYrs, 1:n], you can extract column j by writing Yj = Y[,j]. Relative to the previous models from question 1, do these scenarios have better or worse AIC scores (smaller AIC is better)? If you were to provide advice to managers, would you recommend that the Hood Canal population is a source or sink? What implications does this have for population persistence? Code for Case Study 3 Type show.doc(MARSS, Case_study_3.R) to open a file in R with all the example code. 11 Case Study 5: Using state-space models to analyze noisy animal tracking data 11.1 A simple random walk model of animal movement A simple random walk model of movement with drift (directional movement) but no correlation is x1,t = x1,t−1 + u1 + v1,t , v1,t ∼ N(0, σ12 ) x2,t = x2,t−1 + u2 + v2,t , v2,t ∼ N(0, σ22 ) (11.1) (11.2) where x1,t is the location at time t along one axis (here, longitude) and x2,t is for another, generally orthogonal, axis (in here, latitude). The parameter u1 is the rate of longitudinal movement and u2 is the rate of latitudinal movement. We add errors to our observations of location: y1,t = x1,t + w1,t , w1,t ∼ N(0, η12 ) y2,t = x2,t + w2,t , w2,t ∼ N(0, η22 ), (11.3) (11.4) This model is actually comprised of two separate univariate state-space models. Note that y1 depends only on x1 and y2 depends only on x2 . There are no actual interactions between these two univariate models. However, we can write the model down in the form of a multivariate model using diagonal variance-covariance matrices and a diagonal design (Z) matrix. Because the variance-covariance matrices and Z are diagonal, the x1 :y1 and x2 :y2 processes will be independent as intended. Here are Equations 11.2 and 11.4 written as a MARSS model (in matrix form): 2 x1,t x u v σ 0 = 1,t−1 + 1 + 1,t , vt ∼ MVN 0, 1 2 (11.5) x2,t x2,t−1 u2 v2,t 0 σ2 2 y1,t 1 0 x1,t w η 0 = + 1,t , wt ∼ MVN 0, 1 2 y2,t 0 1 x2,t w2,t 0 η2 (11.6) 96 11 Analyzing animal tracking data The variance-covariance matrix for vt is a diagonal matrix with unequal variances, σ12 and σ22 . The variance-covariance matrix for wt is a diagonal matrix with unequal variances, η12 and η22 . We can write this succinctly as xt = xt−1 + u + vt , vt ∼ MVN(0, Q) yt = Zxt + wt , wt ∼ MVN(0, R). (11.7) (11.8) The Z matrix is a 2 × 2 identity matrix. 11.2 The problem Loggerhead sea turtles (Caretta caretta) are listed as threatened under the United States Endangered Species Act of 1973. Over the last ten years, a number of state and local agencies have been deploying ARGOS tags on loggerhead turtles on the east coast of the United States. We have data on eight individuals over that period. In this case study, we use some turtle data from the WhaleNet Archive of STOP Data, however we have corrupted this data severely by adding random errors in order to create a “Bad Tag” problem. We corrupted latitude and longitude data by errors (Figure 11.1) and it would appear that our sea turtles are becoming land turtles (at least part of the time). For this case study, we will use the MARSS() function to estimate true positions and speeds from the corrupted data. We will use a mapping package to plot the results: the maps package. If you have not already, install this package by selecting the ‘Packages’ menu and then ‘Install packages’ and then select maps. If you are on a Mac, remember to select “binaries” for the package type. Type show.doc(MARSS, Case_study_5.R) to open a file in R with all R code to get you started on the analyses in this chapter. 11.3 Estimate locations from bad tag data 11.3.1 Read in the data and load maps package Our noisy data are in loggerheadNoisy. They consist of daily readings of location (longitude/latitude). The data are recorded daily and MARSS() requires a data entry for each day. If data are missing for a day, then the entries for latitude and longitude for that day should be -99. However, to make this case study run quickly, we have interpolated all missing values in the original, uncorrupted, dataset (loggerhead). The corrupted data are a dataframe and the first six lines look like so loggerheadNoisy[1:6,] 11.3 Estimate locations from bad tag data 97 ● ● ●● ● ● ●●● ●●● ● ● ●● ● ● ●● ●● ● ●● ● ●●● ● ●● ● ● ● ● ● ● ● ● ● ● ●● ● ●● ● ● ● ●● ● ●●● ● ●● ●● ● ● ●● ● ●●● ●● ● ● ●● ● ● ● ● ● ● Fig. 11.1. Plot of the tag data from the turtle Big Mama. Errors in the location data make it seem that Big Mama has been moving overland. 1 2 3 4 5 6 turtle month day year lon lat BigMama 5 28 2001 -81.45989 31.70337 BigMama 5 29 2001 -80.88292 32.18865 BigMama 5 30 2001 -81.27393 31.67568 BigMama 5 31 2001 -81.59317 31.83092 BigMama 6 1 2001 -81.35969 32.12685 BigMama 6 2 2001 -81.15644 31.89568 The file has data for eight turtles: levels(loggerheadNoisy$turtle) [1] "BigMama" [6] "MaryLee" "Bruiser" "TBA" "Humpty" "Yoto" "Isabelle" "Johanna" We will first analyze the position data for “Big Mama”. We put the data for “Big Mama” into variable dat. dat is transposed because we need time across the columns. 98 11 Analyzing animal tracking data turtlename="BigMama" dat = loggerheadNoisy[which(loggerheadNoisy$turtle==turtlename),5:6] dat = t(dat) #transpose We will begin by specifying the structure of the MARSS model and then use MARSS() to fit that model to the data. There are two state processes (one for latitude and the other for longitude), and there is one observation time series for each state process. As we saw in Equation 11.6, Z is the an identity matrix (a diagonal matrix with 1s on the diagonal). We could specify this structure as Z.constraint="identity" or Z.constraint=factor(c(1,2)). Although technically, this is unnecessary as this is the default contraint for Z. We will assume that the errors are independent and that there are different drift rates (u), process variances (σ 2 ) and observation variances for latitude and longitude (η 2 ). Z.constraint=factor(c(1,2)) U.constraint="unequal" Q.constraint="diagonal and unequal" R.constraint="diagonal and unequal" Fit the model to the data: kem = MARSS(dat, constraint=list(Z = Z.constraint, Q = Q.constraint, R = R.constraint, U = U.constraint)) 11.3.2 Compare state estimates to the real positions The real locations (from which loggerheadNoisy was produced by adding noise) are in loggerhead. In Figure 11.2, we compare the tracks estimated from the noisy data with the original, good, data (see Case_Study_5.R for the code to make this plot. There are only a few data points for the real data because in the real tag data, there are many missing days. 11.3.3 Estimate speeds for each turtle Turtle biologists designated one of these loggerheads “Big Mama,” presumably for her size and speed. For each of the eight turtles, estimate the average miles traveled per day. To calculate the distance traveled by a turtle each day, you use the estimate (from MARSS()) of the lat/lon location of turtle at day t and at day t − 1. To calculate distance traveled in miles from lat/lon start and finish locations, we will use the function GCDF defined at the beginning of the R script, Case_Study_5.R): distance[i-1]=GCDF(pred.lon[i-1],pred.lon[i], pred.lat[i-1],pred.lat[i]) 11.3 Estimate locations from bad tag data 99 ● ● ●● ● ● ●●● ●●● ● ● ●● ● ● ●● ●● ● ●● ● ●●● ● ●● ● ● ● ● ● ● ● ● ● ● ●● ● ●● ● ● ● ●● ● ●●● ● ●● ●● ● ● ●● ● ●●● ●● ● ● ●● ● ● ● ● ● ● ● bad locations estimated true location good location data Fig. 11.2. Plot of the estimated track of the turtle Big Mama versus the good location data (before we corrupted it with noise). pred.lon and pred.lat are the predicted longitudes and latitudes from MARSS(): rows one and two in kem$states. To calculate the distances for all days, we put this through a for loop: distance = array(-99, dim=c(dim(dat)[2]-1,1)) for(i in 2:dim(dat)[2]) distance[i-1]=GCDF(pred.lon[i-1],pred.lon[i], pred.lat[i-1],pred.lat[i]) The command mean(distance) gives us the average distance per day. We can also make a histogram of the distances traveled per day (Figure 11.3). Repeat the analysis done for “Big Mama” for each of the other turtles and fill out the speed table (Table 11.1). 100 11 Analyzing animal tracking data 10 0 5 Frequency 15 Histogram of distance 0 10 20 30 40 50 distance Fig. 11.3. Histogram of the miles traveled per day for Big Mama. Compare this to the estimate of miles traveled per day if you had not accounted for measurement errors. See the script file, Case_Study_5.R, for the code to do this. 11.4 Comparing turtle tracks to proposed fishing areas One of the greatest threats to the long term viability of loggerhead turtles is incidental take by net/pot fisheries. Add two proposed fishing areas to your turtle plots: # the proposed fishery areas lines(c(-77,-78,-78,-77,-77), c(33.5,33.5,32.5,32.5,33.5),col="red",lwd=2) lines(c(-75,-76,-76,-75,-75), c(38,38,37,37,38),col="red",lwd=2) Given that only one area can be chosen as a future fishery, what do your predicted movement trajectories for our eight turtles tell you? 11.5 Using specialized packages to analyze tag data 101 Table 11.1. Estimated speeds with location errors included in model versus speeds when we assume that the data have no location error. Turtle Location Data error included assumed to be in model error free Big Mama Bruiser Humpty Isabelle Johanna Mary Lee TBA Yoto 11.5 Using specialized packages to analyze tag data If you have real tag data to analyze, you should use a state-space modeling package that is customized for fitting MARSS models to tracking data. The MARSS package does not have all the bells and whistles that you would want for analyzing tracking data, particularly tracking data in the marine environment. These are a couple R packages that we have come across for this purpose: UKFSST http://www.soest.hawaii.edu/tag-data/tracking/ukfsst/ KFTRACK http://www.soest.hawaii.edu/tag-data/tracking/kftrack/ kftrack is a full-featured toolbox for analyzing tag data with extended Kalman filtering. It incorporates a number of extensions that are important for analyzing track data: barriers to movement such as coastlines and nonGaussian movement distributions. With kftrack, you can use the real tag data which has big gaps, i.e. days with no location. MARSS() will struggle with these data because it will estimate states for all the unseen days; kftrack only fits to the seen days. To use kftrack to fit the turtle data, type library(kftrack) # must be installed from a local zip file loggerhead = loggerhead # Run kftrack with the first turtle (BigMama) 102 11 Analyzing animal tracking data turtlename = "BigMama" dat = loggerhead[which(loggerhead$turtle == turtlename),2:6] model = kftrack(dat, fix.first=F, fix.last=F, var.struct="uniform") A Textbooks and articles that use MARSS modeling for population modeling Textbooks Describing the Estimation of Process and Non-process Variance There are many textbooks on Kalman filtering and estimation of state-space models. The following are a sample of books on state-space modeling that we have found especially helpful. Shumway, R. H., and D. S. Stoffer. 2006. Time series analysis and its applications. Springer-Verlag, New York, New York, USA. Harvey, A. C. 1989. Forecasting, structural time series models and the Kalman filter. Cambridge University Press, Cambridge, UK. Durbin, J., and S. J. Koopman. 2001. Time series analysis by state space methods. Oxford University Press, Oxford. King, R., G. Olivier, B. Morgan, and S. Brooks. 2009. Bayesian analysis for population ecology. Giovanni, P., S. Petrone, and P. Campagnoli. 2009. Dynamic linear models in R. Pole, A., M. West, and J. Harrison. 1994. Applied Bayesian forecasting and time series analysis. Bolker, B. 2008. Ecological models and data in R. Princeton University Press. Maximum-likelihood papers This is just a sample of the papers from the population modeling literature. de Valpine, P. 2002. Review of methods for fitting time-series models with process and observation error and likelihood calculations for nonlinear, nonGaussian state-space models. Bulletin of Marine Science 70:455-471. 104 A Textbooks and articles that use MARSS modeling for population modeling de Valpine, P. and A. Hastings. 2002. Fitting population models incorporating process noise and observation error. Ecological Monographs 72:57-76. de Valpine, P. 2003. Better inferences from population-dynamics experiments using Monte Carlo state-space likelihood methods. Ecology 84:30643077. de Valpine, P. and R. Hilborn. 2005. State-space likelihoods for nonlinear fisheries time series. Canadian Journal of Fisheries and Aquatic Sciences 62:1937-1952. Dennis, B., J.M. Ponciano, S.R. Lele, M.L. Taper, and D.F. Staples. 2006. Estimating density dependence, process noise, and observation error. Ecological Monographs 76:323-341. Ellner, S.P. and E.E. Holmes. 2008. Resolving the debate on when extinction risk is predictable. Ecology Letters 11:E1-E5. Hinrichsen, R.A. and E.E. Holmes. 2009. Using multivariate state-space models to study spatial structure and dynamics. In Spatial Ecology (editors Robert Stephen Cantrell, Chris Cosner, Shigui Ruan). CRC/Chapman Hall. Hinrichsen, R.A. 2009. Population viability analysis for several populations using multivariate state-space models. Ecological Modelling 220:1197-1202. Holmes, E.E. 2001. Estimating risks in declining populations with poor data. Proceedings of the National Academy of Sciences of the United States of America 98:5072-5077. Holmes, E.E. and W.F. Fagan. 2002. Validating population viability analysis for corrupted data sets. Ecology 83:2379-2386. Holmes, E.E. 2004. Beyond theory to application and evaluation: diffusion approximations for population viability analysis. Ecological Applications 14:1272-1293. Holmes, E.E., W.F. Fagan, J.J. Rango, A. Folarin, S.J.A., J.E. Lippe, and N.E. McIntyre. 2005. Cross validation of quasi-extinction risks from real time series: An examination of diffusion approximation methods. U.S. Department of Commerce, NOAA Tech. Memo. NMFS-NWFSC-67, Washington, DC. Holmes, E.E., J.L. Sabo, S.V. Viscido, and W.F. Fagan. 2007. A statistical approach to quasi-extinction forecasting. Ecology Letters 10:1182-1198. Kalman, R.E. 1960. A new approach to linear filtering and prediction problems. Journal of Basic Engineering 82:35-45. Lele, S.R. 2006. Sampling variability and estimates of density dependence: a composite likelihood approach. Ecology 87:189-202. Lele, S.R., B. Dennis, and F. Lutscher. 2007. Data cloning: easy maximum likelihood estimation for complex ecological models using Bayesian Markov chain Monte Carlo methods. Ecology Letters 10:551-563. Lindley, S.T. 2003. Estimation of population growth and extinction parameters from noisy data. Ecological Applications 13:806-813. Ponciano, J.M., M.L. Taper, B. Dennis, S.R. Lele. 2009. Hierarchical models in ecology: confidence intervals, hypothesis testing, and model selection using data cloning. Ecology 90:356-362. A Textbooks and articles that use MARSS modeling for population modeling 105 Staples, D.F., M.L. Taper, and B. Dennis. 2004. Estimating population trend and process variation for PVA in the presence of sampling error. Ecology 85:923-929. Bayesian papers This is a sample of the papers from the population modeling and animal tracking literature. Buckland, S.T., K.B. Newman, L. Thomas and N.B. Koestersa. 2004. State-space models for the dynamics of wild animal populations. Ecological modeling 171:157-175. Calder, C., M. Lavine, P. Müller, J.S. Clark. 2003. Incorporating multiple sources of stochasticity into dynamic population models. Ecology 84:13951402. Chaloupka, M. and G. Balazs. 2007. Using Bayesian state-space modelling to assess the recovery and harvest potential of the Hawaiian green sea turtle stock. Ecological Modelling 205:93-109. Clark, J.S. and O.N. Bjørnstad. 2004. Population time series: process variability, observation errors, missing values, lags, and hidden states. Ecology 85:3140-3150. Jonsen, I.D., R.A. Myers, and J.M. Flemming. 2003. Meta-analysis of animal movement using state space models. Ecology 84:3055-3063. Jonsen, I.D, J.M. Flemming, and R.A. Myers. 2005. Robust state-space modeling of animal movement data. Ecology 86:2874-2880. Meyer, R. and R.B. Millar. 1999. BUGS in Bayesian stock assessments. Can. J. Fish. Aquat. Sci. 56:1078-1087. Meyer, R. and R.B. Millar. 1999. Bayesian stock assessment using a statespace implementation of the delay difference model. Can. J. Fish. Aquat. Sci. 56:37-52. Meyer, R. and R.B. Millar. 2000. Bayesian state-space modeling of agestructured data: fitting a model is just the beginning. Can. J. Fish. Aquat. Sci. 57:43-50. Newman, K.B., S.T. Buckland, S.T. Lindley, L. Thomas, and C. Fernández. 2006. Hidden process models for animal population dynamics. Ecological Applications 16:74-86. Newman, K.B., C. Fernández, L. Thomas, and S.T. Buckland. 2009. Monte Carlo inference for state-space models of wild animal populations. Biometrics 65:572-583 Rivot, E., E. Prévost, E. Parent, and J.L. Baglinière. 2004. A Bayesian state-space modelling framework for fitting a salmon stage-structured population dynamic model to multiple time series of field data. Ecological Modeling 179:463-485. 106 A Textbooks and articles that use MARSS modeling for population modeling Schnute, J.T. 1994. A general framework for developing sequential fisheries models. Canadian J. Fisheries and Aquatic Sciences 51:1676-1688. Swain, D.P., I.D. Jonsen, J.E. Simon, and R.A. Myers. 2009. Assessing threats to species at risk using stage-structured state-space models: mortality trends in skate populations. Ecological Applications 19:1347-1364. Thogmartin, W.E., J.R. Sauer, and M.G. Knutson. 2004. A hierarchical spatial model of avian abundance with application to cerulean warblers. Ecological Applications 14:1766-1779. Trenkel, V.M., D.A. Elston, and S.T. Buckland. 2000. Fitting population dynamics models to count and cull data using sequential importance sampling. J. Am. Stat. Assoc. 95:363-374. Viljugrein, H., N.C. Stenseth, G.W. Smith, and G.H. Steinbakk. 2005. Density dependence in North American ducks. Ecology 86:245-254. Ward, E.J., R. Hilborn, R.G. Towell, and L. Gerber. 2007. A state-space mixture approach for estimating catastrophic events in time series data. Can. J. Fish. Aquat. Sci., Can. J. Fish. Aquat. Sci. 644:899-910. Wikle, C.K., L.M. Berliner, and N. Cressie. 1998. Hierarchical Bayesian space-time models. Journal of Environmental and Ecological Statistics 5:117154 Wikle, C.K. 2003. Hierarchical Bayesian models for predicting the spread of ecological processes. Ecology 84:1382-1394. B Package MARSS: Object structures B.1 Model objects: class marssm Objects of class ‘marssm’ specify Multivariate Autoregressive State Space (MARSS) models. The model component of an ML estimation object (class marssMLE; see below) is a marssm object. These objects have the following components: data An optional matrix (not dataframe), in which each row is a time series (time across columns). fixed A list with 8 matrices Z, A, R, B, U, Q, x0, V0, specifying which elements of each parameter are fixed. free A list with 8 matrices Z, A, R, B, U, Q, x0, V0, specifying which elements of each parameter are to be estimated. M An array of dim n × n × T (an n × n missing values matrix for each time point). Each matrix is diagonal with 0 at the i, i value if the i-th value of y is missing, and 1 otherwise. miss.value Specifies missing value representation in the data. The matrices in fixed and free work as pairs to specify the fixed and free elements for each parameter. See Chapter 4. The dimensions for fixed and free matrices are as follows, where n is the number of observation time series and m is the number of state processes: Z nxm B mxm U mx1 Q mxm A nx1 R nxn x0 m x 1 V0 m x m 108 B Package MARSS: Object structures Use is.marssm() to check whether an marssm object is correctly specified. The MARSS package includes an as.marssm() method to convert objects of class popWrap (see next section) to objects of class marssm. B.2 Wrapper objects: class popWrap Wrapper objects of class popWrap contain specifications and options for estimation of a MARSS model. A popWrap object has the following components: data A matrix (not dataframe) of observations (rows) × time (columns). m Number of hidden state processes (number of rows in x). constraint Either a list with 8 string elements Z, A, R, B, U, Q, x0, V0 (see below for details), or string "use fixed/free". fixed If constraint[[elem]]="use fixed/free", a list with 8 matrices Z, A, R, B, U, Q, x0, V0. free If constraint[[elem]]="use fixed/free", a list with 8 matrices Z, A, R, B, U, Q, x0, V0. inits A list with 8 matrices Z, A, R, B, U, Q, x0, V0, specifying initial values for parameters. Dimensions are given in the class ‘marssm’ section. miss.value Specifies missing value representation (default is -99). method The method used for estimation: ‘kem’ for Kalman-EM, ‘BFGS’ for quasi-Newton. control List of estimation options. For the EM algorithm, these include the elements minit, maxit, abstol, iter.V0, safe and trace. For Monte Carlo initialization, these include the elements MCInit, numInits, numInitSteps and boundsInits. See class marssMLE section for details. Component constraint is a convenient way to specify model structure for certain common cases. If constraint="use fixed/free", both fixed and free must be provided. See the class marssm section for how to specify fixed and free matrices. The function MARSS() calls popWrap() to create a popWrap object, then is.marssm() to coerce this object to class marssm for the estimation function. The popWrap() function calls checkPopWrap() to check user inputs from MARSS(). Valid constraints are below. A May be either the string ‘scaling’ or the string ‘zero’ to specify a column vector of zeros (a = 0). B String ‘identity’ or a numeric matrix specifying a fixed B matrix. The string ‘zero’ may be used to specify a m × m matrix of zeros (B = 0). Q String ‘unconstrained’, ‘diagonal and unequal’, ‘diagonal and equal’, or ‘equalvarcov’. May also be numeric or character vector of class factor specifying shared diagonal values or a numeric matrix specifying a fixed Q matrix. B.3 ML estimation objects: class marssMLE 109 R String ‘unconstrained’, ‘diagonal and unequal’, ‘diagonal and equal’, or ‘equalvarcov’. May also be numeric or character vector of class factor specifying shared diagonal values or a numeric matrix specifying a fixed R matrix. U String ‘unconstrained’=‘unequal’, or ‘equal’. May also be numeric or character vector of class factor specifying shared u elements or a m×1 numeric matrix specifying a fixed u matrix. The string ‘zero’ may be used to specify a column vector of zeros (u = 0). x0 String ‘unconstrained’=‘unequal’, or ‘equal’. May also be vector of class factor specifying shared π (t = 1) values or a m × 1 numeric matrix specifying a fixed π (t = 1) matrix. The string ‘zero’ may be used to specify a column vector of zeros (π = 0). Z A vector of class factor specifying which y time series correspond to which state time series (in x) or a numeric n×m matrix specifying the Z matrix. The string ‘identity’ can be used to specify a n × n identity matrix and string ‘ones’ may be used to specify a column vector of n ones. B.3 ML estimation objects: class marssMLE Objects of class marssMLE specify maximum-likelihood estimation for a MARSS model, both before and after fitting. A minimal marssMLE object contains components model, start and control, which must be present for estimation by functions like MARSSkem(). model MARSS model specification (an object of class ‘marssm’). start List with 7 matrices A, R, B, U, Q, x0, V0, specifying initial values for parameters. Dimensions are given in the class marssm section. control A list specifying estimation options. For method="kem", these are minit Minimum number of iterations in the maximization algorithm. maxit Maximum number of iterations in the maximization algorithm. abstol Optional tolerance for log-likelihood change. If log-likelihood decreases less than this amount relative to the previous iteration, the EM algorithm exits. iter.V0 Maximum number of iterations for final likelihood calculation with V0 = 0. trace A positive integer. If not zero, a record will be created of each variable the maximization iterations. The information recorded depends on the maximization method. safe If TRUE, MARSSkem() will rerun MARSSkf() after each individual parameter update rather than only after all parameters are updated. MCInit Use Monte Carlo initialization? numInits Number of random initial value draws. numInitSteps Number of iterations for each initial value draw. 110 B Package MARSS: Object structures boundsInits Bounds on the uniform distributions from which initial values will be drawn. (Note that bounds for the covariance matrices Q and R, which require positive values, are specified in logs.) silent Suppresses printing of progress bar and convergence information. MARSSkem() appends the following components to the marssMLE’ object: method A string specifying the estimation method (‘kem’ for estimation by MARSSkem()). par A list with 8 matrices of estimated parameter values Z, A, R, B, U, Q, x0, V0. If there are fixed elements in the matrices, the corresponding elements in $par are set to the fixed values. kf A list containing Kalman filter/smoother output. See Chapter 2 numIter Number of iterations required for convergence. convergence Convergence status. logLik the exact Log-likelihood. See Section 5.2. errors any error messages iter.record record of the parameter values at each iteration (if control$trace=1) Several functions append additional components to the ‘marssMLE’ object passed in. These include: MARSSaic Appends AIC, AICc, AICbb, AICbp, depending on the AIC flavors requested. MARSShessian Appends Hessian, gradient, parMean and parSigma. MARSSparamCIs Appends par.se, par.bias, par.upCI and par.lowCI. C Package MARSS: The top-level MARSS functions and the base functions Package MARSS includes functions for estimating Multivariate Autoregressive State Space models, obtaining confidence intervals for parameters, and calculating Akaike’s Information Criterion (AIC) for model selection. To make the package both flexible and easy to use, it is designed in two levels. At the base level, the programmer can interact directly with the estimation functions, using two kinds of R objects: objects of the model specification class ‘marssm’, and objects of estimation classes such as ‘marssMLE’. At the user level, the MARSS() function allows model estimation with just one function call, hiding the details for ease of use. Users create models in an intuitive way by specifying constraints; the MARSS() function then converts these constraints into the object structures required by the estimation functions, performing error checking as necessary. The two-level package structure allows new users convenient access to the underlying functions, while maintaining flexibility to incorporate different applications and algorithms. Developers can use the base object types to write new functions for their own modeling applications. To use MARSS(), the user specifies a model by supplying the constraint argument to MARSS(), using the method argument to specify an estimation method. Optionally, the user may provide initial values for the free parameters, and specify estimation options; for details see the MARSS() help file. The function returns an object containing the model, parameter values and estimation details. The user may pass the returned object to MARSSboot(), which generates bootstrap parameter estimates, or to MARSSaic(), which calculates various versions of AIC for model selection. Figure C.1 shows the underlying base level operations MARSS() performs. The function creates a wrapper object of class ‘popWrap’. It then calls the as.marssm() method for ‘popWrap’ to create a marssm object from the constraints provided. This model object, initial values and control information are the minimal information required by the estimation functions, and are combined into an object of class appropriate for the estimation method. The estimation function adds to this object the estimated parameter values, esti- 112 C Package MARSS: The top-level MARSS functions and the base functions mation details, and other function-specific components, and then returns the augmented object. Fig. C.1. Two-level structure of the MARSS package. Rectangles represent functions; ovals represent objects. References Biernacki, C., Celeux, G., and Govaert, G. 2003. Choosing starting values for the EM algorithm for getting the highest likelihood in multivariate gaussian mixture models. Computational Statistics and Data Analysis 41:561–575. Brockwell, P. J. and Davis, R. A. 1991. Time series: theory and methods. Springer-Verlag, New York, NY. Cavanaugh, J. and Shumway, R. 1997. A bootstrap variant of AIC for state-space model selection. Statistica Sinica 7:473–496. Dempster, A., Laird, N., and Rubin, D. 1977. Likelihood from incomplete data via the EM algorithm. Journal of the Royal Statistical Society, Series B 39:1–38. Dennis, B., Munholland, P. L., and Scott, J. M. 1991. Estimation of growth and extinction parameters for endangered species. Ecological Monographs 61:115–143. Dennis, B., Ponciano, J. M., Lele, S. R., Taper, M. L., and Staples, D. F. 2006. Estimating density dependence, process noise, and observation error. Ecological Monographs 76:323–341. Ellner, S. P. and Holmes, E. E. 2008. Resolving the debate on when extinction risk is predictable. Ecology Letters 11:E1–E5. Gerber, L. R., Master, D. P. D., and Kareiva, P. M. 1999. Grey whales and the value of monitoring data in implementing the u.s. endangered species act. Conservation Biology 13:1215–1219. Ghahramani, Z. and Hinton, G. E. 1996. Parameter estimation for linear dynamical systems. Technical Report CRG-TR-96-2, University of Totronto, Dept. of Computer Science. Harvey, A. C. 1989. Forecasting, structural time series models and the Kalman filter. Cambridge University Press, Cambridge, UK. Harvey, A. C. and Shephard, N. 1993. Structural time series models. In G. S. Maddala, C. R. Rao, and H. D. Vinod (eds.), Handbook of Statistics, Volume 11. Elsevier Science Publishers B V, Amsterdam. 114 References Hinrichsen, R. 2009. Population viability analysis for several populations using multivariate state-space models. Ecological Modelling 220:1197–1202. Hinrichsen, R. and Holmes, E. E. 2009. Using multivariate state-space models to study spatial structure and dynamics. In R. S. Cantrell, C. Cosner, and S. Ruan (eds.), Spatial Ecology. CRC/Chapman Hall. Holmes, E. E. 2001. Estimating risks in declining populations with poor data. Proceedings of the National Academy of Sciences of the United States of America 98:5072–5077. Holmes, E. E. 2004. Beyond theory to application and evaluation: diffusion approximations for population viability analysis. Ecological Applications 14:1272–1293. Holmes, E. E. 2010. Derivation of the EM algorithm for constrained and unconstrained marss models. Technical report, Northwest Fisheries Science Center, Mathematical Biology Program. Holmes, E. E., Sabo, J. L., Viscido, S. V., and Fagan, W. F. 2007. A statistical approach to quasi-extinction forecasting. Ecology Letters 10:1182–1198. Holmes, E. E. and Ward, E. W. 2010. Analyzing noisy, gappy, and multivariate population abundance data: modeling, estimation, and model selection in a maximum-likelihood framework. Technical report, Northwest Fisheries Science Center, Mathematical Biology Program. Jeffries, S., Huber, H., Calambokidis, J., and Laake, J. 2003. Trends and status of harbor seals in washington state 1978-1999. Journal of Wildlife Management 67:208–219. Kalman, R. E. 1960. A new approach to linear filtering and prediction problems. Journal of Basic Engineering 82:35–45. Lele, S. R., Dennis, B., and Lutscher, F. 2007. Data cloning: easy maximum likelihood estimation for complex ecological models using bayesian markov chain monte carlo methods. Ecology Letters 10:551–563. McLachlan, G. J. and Krishnan, T. 2008. The EM algorithm and extensions. John Wiley and Sons, Inc., Hoboken, NJ, 2nd edition. Rauch, H. E., Tung, F., and Striebel, C. T. 1965. Maximum likelihood estimation of linear dynamical systems. Journal of AIAA 3:1445–1450. Schweppe, F. C. 1965. Evaluation of likelihood functions for Gaussian signals. IEEE Transactions on Information Theory IT-r:294–305. Shumway, R. and Stoffer, D. 2006. Time series analysis and its applications. Springer-Science+Business Media, LLC, New York, New York, 2nd edition. Shumway, R. H. and Stoffer, D. S. 1982. An approach to time series smoothing and forecasting using the EM algorithm. Journal of Time Series Analysis 3:253–264. Staples, D. F., Taper, M. L., and Dennis, B. 2004. Estimating population trend and process variation for PVA in the presence of sampling error. Ecology 85:923–929. References 115 Stoffer, D. S. and Wall, K. D. 1991. Bootstrapping state-space models: Gaussian maximum likelihood estimation and the Kalman filter. Journal of the American Statistical Association 86:1024–1033. Taper, M. L. and Dennis, B. 1994. Density dependence in time series observations of natural populations: estimation and testing. Ecological Monographs 64:205–224. Ward, E. J., Chirakkal, H., González-Suárez, M., AuriolesGamboa, D., Holmes, E. E., and Gerber, L. 2009. Inferring spatial structure from time-series data: using multivariate state-space models to detect metapopulation structure of California sea lions in the Gulf of California, Mexico. Journal of Applied Ecology 1:47–56. Index animal tracking, 95 kftrack, 101 bootstrap innovations, 9, 26, 27 MARSSboot function, 9, 43 parametric, 9, 26, 27 confidence intervals, 64 Hessian approximation, 9, 64 MARSSparamCIs function, 9 non-parametric bootstrap, 9 parametric bootstrap, 9, 64 density-independent, 47 diagnostics, 75 DLM package, 3 error observation, 48 process, 47, 48 errors degenerate, 4 ill-conditioned, 4 estimation, 51 BFGS, 30 Dennis method, 52 Kalman filter, 8, 23 Kalman smoother, 8, 23 Kalman-EM, 8, 25, 51 maximum-likelihood, 51, 52 Newton methods, 26 quasi-Newton, 8, 30 REML, 3 extinction, 47 diffusion approximation, 56 uncertainty, 60 functions as.marssm, 108 checkPopWrap, 108 find.degenerate, 4 is.marssm, 9, 108 is.marssMLE, 8 MARSS, 7, 30–34, 108 MARSSaic, 8, 26, 27, 43, 110 MARSSboot, 9, 26, 41, 43 MARSShessian, 9, 110 MARSSkem, 8, 25, 109, 110 MARSSkf, 8, 23, 24, 38 MARSSmcinit, 8, 26 MARSSoptim, 8 MARSSparamCIs, 4, 9, 26, 36, 110 MARSSsimulate, 9, 26, 42 MARSSvectorizeparam, 9, 38, 43 optim, 3, 8, 26 popWrap, 108 summary, 9, 36 initial conditions setting for BFGS, 31 likelihood, 8, 24, 42 and missing values, 25 innovations algorithm, 24 MARSSkf function, 42 missing value modifications, 24 multimodal, 26 118 Index parameters not converged, 5 troubleshooting, 4, 26 MARSS model, 1, 95 multivariate example, 67, 87, 95 print, 36 summary, 36 univariate example, 47 missing values, 3 and AICb, 27 and parametric bootstrap, 26 likelihood correction, 25 model selection, 27, 87 AIC, 27, 73, 75, 84, 85, 90, 94 AICc, 27, 84 bootstrap AIC, 27, 84 bootstrap AIC, AICbb, 27, 43 bootstrap AIC, AICbp, V, 27, 43, 84 MARSSaic function, 8, 43 model specification in MARSS, 11 in marssm objects, 19 objects marssm, 7, 9, 107 marssMLE, 7, 43, 109, 110 popWrap, 108 simulation, 26, 42, 48 MARSSsimulate function, 9, 42 standard errors, 9