1
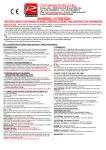
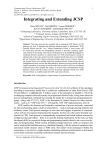
Proceedings of the ASME 2011 International Design Engineering Technical Conferences & Computers and Information in Engineering Conference IDETC/CIE 2011 August 28-31, 2011, Washington, DC, USA IDETC2011-47530 EVALUATION AND COMPARISON OF TWO DESIGN FOR ASSEMBLY METHODS: SUBJECTIVITY OF INFORMATION INPUTS Eric Owensby Research Assistant Mechanical Engineering Clemson University Clemson, SC 29634-0921 [email protected] Aravind Shanthakumar Research Assistant Mechanical Engineering Clemson University Clemson, SC 29634-0921 [email protected] Essam Namouz Research Assistant Mechanical Engineering Clemson University Clemson, SC 29634-0921 [email protected] ABSTRACT This paper presents a comparison study on two design for assembly (DFA) tools, Boothroyd and Dewhurst’s Design for Manufacturing and Assembly software and the MathiesonSummers connective-complexity algorithm, focusing on the amount of information required from the designer to complete the analysis and the subjectivity of this information. The Boothroyd Dewhurst software requires the user to answer a set of questions about each part and how it is assembled to estimate an assembly time, assembly cost, and to suggest design improvements. The connective-complexity method predicts assembly times based on the physical connectivity between parts within an assembly. The methods are applied to three consumer products and evaluated and compared through five criteria: approximate time to conduct the analysis, predicted assembly time, amount of required input information, amount of subjective information, and number of redesign features provided to the user. The results show that the DFMA software requires the user to go through eight types of information answering a total of forty nine questions per part. Sixteen of these questions are based on subjective information making the analysis nearly a third subjective. The connectivity method requires only two types of information and a total of five questions per part to complete the analysis, none of it being subjective. The predicted assembly times from the connectivecomplexity DFA method ranged from 13.11% to 49.71% lower than the times predicted by the DFMA software. The results from this comparison can be used to bench mark DFA methods so that their weaknesses can be identified and improved. Keywords: Design for Assembly, Information Subjectivity, DFA 1 Copyright © 2010 by ASME Vikrant Rayate Research Assistant Mechanical Engineering Clemson University Clemson, SC 29634-0921 [email protected] Joshua D. Summers Associate Professor & IDEaS Professor Mechanical Engineering Clemson University Clemson, SC 29634-0921 [email protected] (corresponding author) 1 MOTIVATION AND BACKGROUND INFORMATION Design for assembly (DFA) methods originated in the 1960’s when companies first started publishing manuals to aid designers during the design process [1]. Following these manuals, new methods used extensive time studies to develop tables where users selected assembly penalties based on the part/design’s features to predict a product's assembly time [1,2]. After the development of these table based methods researchers began to realize the advantages of implementing DFA through computer software to improve the speed and ease of the analysis. This is illustrated by the development of the MOSIM method which aimed to make DFA a concurrent design tools instead of it being implemented as a re-design tools [1]. Other research has focused on integrating DFA methods into computer aided design (CAD) software [3]. This type of DFA method would hide the volume of required information from the user improving the speed and consistency of the analysis making it desirable to use by the designer [4]. Design for assembly analysis is important to the design process as up to seventy percent of the product’s life cycle cost is determined early in the design process [5]. Further, nearly forty percent of manufacturing cost can be related directly to assembly costs [6]. Incorporating DFA methods into the design process provides advantages such as shortened development time, assembly time reduction, and manufacturing cost savings [7]. However, DFA methods are often not implemented in industry because they tend to be tedious and time consuming requiring the user to provide extensive information to conduct the analysis [8]. To effectively benchmark and improve DFA methods they need to be evaluated to identify their strengths and weaknesses so that future research and development can focus on their critical needs. This work evaluates two current DFA methods, the Boothroyd Dewhurst Design for manufacture and assembly (DFMA) software and the Mathieson-Summers connectivecomplexity metric DFA method. The DFMA software developed by Boothroyd Dewhurst Inc.1 requires the user to provide specific information about the product as an assembly, the sub-assemblies of the product, and the individual parts of the product. The user specifies information used to apply part count minimization rules and different information used to determine the assembly time of each part. To determine the assembly time of the part, questions regarding the size, assembly orientation, handling difficulties, and insertion difficulties are answered [7]. The Mathieson-Summers connective-complexity metric method predicts assembly time using only the topological connections between parts within assemblies. To do this each part is evaluated by determining what other parts it is connected to and how they are connected. The specified architecture is then represented in bi-partite graphs and the connective complexity of the architecture is calculated. The complexity information is then used to predict the assembly time of the product [9]. Both the Boothroyd Dewhurst and the Mathieson-Summers connective-complexity metric methods require different amounts and different types of information to be specified by the user to complete the DFA analysis. Three different consumer products are analyzed with each method and the information requirements and results are evaluated. The results from this evaluation and comparison can be used to benchmark the two methods and to identify areas for potential improvement. 2 BOOTHROYD AND DEWHURST METHOD The Boothroyd Dewhurst DFA method has two main sections of the analysis: determining the theoretical minimum number of parts and determining assembly times and costs. The theoretical minimum number of parts is used to identify parts that can be eliminated from the assembly. These are often fasteners, fittings, or parts that have multiple instances. The theoretical minimum number of parts is determined first by answering three questions: 1. Does the part move relative to the other parts during the operation of the product? 2. Does the material of the part have to be different from the other parts within the assembly? 3. Does the part have to be separated so that other parts can be assembled or disassembled? If the answer to any of these questions is yes, then the part is not a candidate for elimination and the minimum number of this part has already been achieved. If the answers to all three questions is “no” then the part could theoretically be eliminated [7]. This is the section of the analysis that suggests design improvements to the user focusing primarily on eliminating or reducing the number of excessive parts. One of the results 1 http://www.dfma.com 2 Copyright © 2010 by ASME presented to the user during this section of the analysis is the design efficiency which shows the user how efficient the product is with respect to design for assembly. This design efficiency is determined by comparing the number of parts included in the original design and the theoretical minimum number of parts. This gives the designer one way of documenting the improvements that a product undergoes from pre to post DFA analysis. The second part of the Boothroyd Dewhurst design for assembly analysis focuses on estimating an assembly time and assembly cost. This is achieved by determining: the size, orientation/symmetry, the handling difficulties, and the insertion difficulties of the part. Each area requires the designer to choose from several options to determine the correct assembly time of the part. The estimated assembly time can be used to compare the assembly time of a suggested redesign to the current design. The original table based design for assembly method is implemented through a software package that guides designers through the analysis [7]. The software makes the analysis less demanding by eliminating the need for the user to manually collect and perform calculations. The software has been effectively used to analyze products for assembly improvements as well as estimating assembly times [7]. 3 DFA CONNECTIVITY COMPLEXITY METRICS METHOD The connective-complexity metrics method calculates the complexity of the part connections within an assembly, mapping the results to previously predicted assembly times based on the Boothroyd Dewhurst DFA tables [9]. Thus, the Mathieson-Summers connective-complexity method is based on the same empirical data on which the Boothroyd Dewhurst method is based. The key difference is not the source of historical trends, but the usability of the method from the perspective of the engineer that is running the design for assembly analysis. Complexity metrics can be used to create surrogate models of engineering design representations that capture knowledge not explicitly encoded in the models [9,10,11]. These graphs are used to track similarities so that relationships or trends between properties can be developed [12,13]. The connectivecomplexity method is used to map graph properties of the assembly architectures to established assembly times. A historical regression model is then created to predict future assembly times on different architectures. The previously established assembly times that were used for this model are derived from DFA analysis on ten products using Boothroyd Dewhurst’s DFA manual tables [9]. The system architecture used to identify a trend between it and assembly time is developed by identifying connections between system elements and representing them in a bi-partite graph. The bi-partite graph is defined by two independent sets, the elements (components or parts) within the system and the relationships (connections or contact) between the elements. This graph is then used to determine three system properties that were found to be predictors for assembly time: path length, part count, and path length density. A function of these three measures is used to create the surrogate connectivecomplexity model for assembly time. The results were within 20% of the original assembly times predicted by the Boothroyd Dewhurst tables, which is considered acceptable for use in early stages of engineering design if the cost of estimation is reduced. More information on the development of this method can be found in [9]. To use the Mathieson-Summers connective-complexity method the first step is to build the assembly bi-partite graph. Every part in the assembly is captured, even if the parts are repeated within the assembly. The type of connection between each part set is defined. Currently, four general types of connections are defined: surface contact, fasteners, snap/press/interference fits, and other connections. For example, a fastening relationship is defined when a part is used to hold/secure other parts (a nut and bolt used to hold two plates together). Details and examples of the other types of contacts or connections can be found in [9]. 4 EVALUATION OF METHODS To evaluate the two different DFA methods a full design for assembly analysis of three consumer products is done. A Black & Decker One Touch Chopper, a Black and Decker cordless drill, and a RIVAL can opener were chosen for the analysis because they are commercially available, have part counts less than fifty, are low cost, and are mature products (Figure 1). a. b. The method’s repeatability/subjectivity The method’s features for redesign support The comparison between the predicted assembly times will be a relative one since the connective-complexity DFA times are based on a regression analysis using assembly times from the Boothroyd Dewhurst original manual tables. This method has been extensively used in industry, so the assembly times it predicts are assumed to be close to the true values and are used as the baseline datum. The different amounts and types of information required will focus on identifying the total number of possible questions per part and whether these questions are subjective or objective. The repeatability of each method will be determined by the percentage of subjective questions to the total questions required. Finally, the features that each method provides to support redesigns to improve assembly are identified. The evaluation criterion results for each method are discussed in their individual sections and they are summarized again in the comparison section. 4.1. Evaluation of Boothroyd & Dewhurst Software Conducting the DFA analysis using Boothroyd Dewhurst DFMA software requires the user to develop the product structure of a desired assembly by answering a series of questions. The software uses this information, a mix of objective and subjective inputs, to automatically estimate the assembly time for the specified product structure. The typical DFMA graphical user interface (GUI) for a subassembly of the drill is shown in Figure 2. The DFA analysis was performed with Boothroyd Dewhurst Inc.’s DFMA software version 9.4. c. Figure 1: (a) One Touch Copper, (b) Black & Decker Cordless Drill, (c) RIVAL Can Opener These products were disassembled and the DFA analysis was conducted during the reassembly. It should be noted that the analysis done in this exercise is for reverse engineering instead of forward design. The conclusions on effectiveness should be tempered when considering the use of the DFA methods to assist designers in generative forward design problem scenarios. As the analysis was being conducted the following information was recorded to evaluate each method: The approximate time required to complete the analysis The predicted assembly times for each product The amounts and types of information required by the user to complete the analysis 3 Copyright © 2010 by ASME Figure 2: DFMA Software Graphical User Interface The information input by the user as answers to DFA questions include a broad spectrum of data related to symmetry, minimum part criteria, handling difficulties, operation characteristics, operations (e.g. apply grease or not, soldering, and adhesive operations), labor rate, and envelope size. To build the product structure in the software the user needs to: have a thorough knowledge about the product, operations required during assembly, and have sufficient expertise to use the software. If the user is new to the software, the user manual and built in help file can be used for navigation and clarification. This help file is useful for obtaining clarifications on many of the DFA questions but it does leave some ambiguous instances where the user has to make a decision. For example, the four bushings from the Black and Decker chopper assembly which are inserted into the product’s base structure are semi flexible parts. According to the DFMA software help file, these parts can be “flexible” because they deform when pressed, but the help file does not tell the user how much force should be applied to see if it deforms. Another issue was that the bushing’s flexibility offered no difficulty for assembly which was a mild press fit; therefore it may or may not be considered rigid. Conducting the DFA analysis using the DFMA software requires many information inputs from the user. To conduct the analysis on one part using the software eight different areas are evaluated by the user. The user determines if these areas are applicable to the part, specifically the handling and insertion difficulties. The eight areas, the number of questions per area, the number of subjective questions from each area, and the percentage of subjectivity in each area are found in Table 1. Table 1: DFMA Software Required User Inputs Inputs required Total # of # Subjective % from the user Questions Questions Subjective 1 Product definition 2 0 0.00 2 Securing method 9 1 11 Minimum part 43 3 7 3 criteria Envelope 0.00 4 3 0 dimensions Insertion & 0.00 5 Orientation 6 0 Symmetry 6 Handling difficulties 12 6 50.00 7 Insertion difficulties 9 6 67 8 Fetching distance 1 0 0.00 49 16 33 Total During the assembly analysis the user answers evaluate 49 or more questions to complete the analysis for one part. The cognitive workload on answering these questions is reduced through the software interface and the use of icons and keywords. This allows the user to quickly skim the questions and determine which ones apply to the part being analyzed. This is the number of possible questions that the user has to evaluate per part, not per assembly so the amount of information required by the user grows quickly with the complexity of the product. Answering these questions can be tedious and time consuming while still yielding inconsistent results because sixteen of the forty nine queries are based on subjective information or the designer’s opinion. This means that one third (33%) of the total analysis is based on subjective information. 4 Copyright © 2010 by ASME Different designers, when answering the subjective questions, may answer in different ways, resulting in different time estimates, thereby reducing the repeatability and confidence of the method. 4.1.1. DFMA software subjective information This section focuses on identifying the subjective information required by the user to conduct the DFA analysis using the DFMA software. As each area of subjective information is identified examples of this information are given. 4.1.1.1. Handling difficulties When determining the handling difficulties, the designer is asked to assign “penalties”. This subjectivity is mitigated through the use of example parts for different scenarios, as presented through the software. This is limited to a small set of general, non-specific examples. An example of the subjectivity of the handling difficulties can be seen in the drive gear sub assembly shown in Figure 3. The handling difficulties for this sub assembly were specified as “flexible” and “two hands.” This sub assembly has several small parts and once they are assembled they have to be held together using two hands. The other handling difficulties of the sub assembly could be “difficult to grasp” because the parts in the assembly are small. Alternatively, the sub assembly could be considered “flexible” because the sub assembly is not fully constrained. The user then has to choose which one is more appropriate and “flexible” was eventually chosen. Ref. scale Shaft Drive Gear Ball Bushing ` Figure 3: Drive gear sub assembly An example of the subjective handling difficulties tangling, severe tangling, and flexible can be found in the switch pin sub assembly of the Rival Can Opener shown in Figure 4. The handling difficulties chosen for this sub assembly were “severe tangle” and “flexible”. One of these parts is a spring which makes handling difficult due to tangling. If the user has to remove one spring from a box of springs then it may require them to use two hands to separate the springs giving it the “tangling” penalty. In some cases designers may not consider tangling as a handling difficulty if it is easy for them to hold the spring or remove the spring from a box. The presence of the spring also allows the sub assembly parts to move relative to one another making it “flexible.” Plain washer Ref. scale Ref. scale Spring Switch pin Figure 4: Switch pin sub assembly Figure 5: Motor and switch sub assembly The assessment of the sub assembly being flexible is subjective because flexibility cannot be measured. It is left up to the user’s judgment to decide if the movement of the assembly justifies a penalty of “flexible” or not. Some users may neglect relative motion of the parts since it is a relatively small amount of movement. Designers experiencing easy assembly and little assembly time may not consider the selection of certain handling difficulties while other designers experiencing difficulties may consider multiple handling difficulties. These types of decisions depend on their perception of the handling difficulties that they experienced during assembly of the product. designer has to hold the spring down, and then insert the assembly at an angle so it goes through a hole in the housing. The “resist” difficulty comes from the designer having to push the spring against the housing before the pin can be pushed into place. The subjectivity of these difficulties in this example comes from the ease at which the designer can insert the assembly. A designer with small fingers experienced little insertion difficulties where a designer with larger fingers experienced significant insertion difficulties. These two different points of views will result in different insertion difficulties being specified in the analysis. 4.1.1.2. Insertion difficulties Another aspect of the DFMA software that can be subjective is determining the insertion difficulties of parts and assemblies. The subjectivity of the insertion difficulties comes from determining when and to what extent these difficulties apply. If the answer is not clear the user does not decide what insertion difficulty is correct but instead which one they think is more appropriate. An example of the subjectivity of choosing insertion difficulties is found in the drill’s motor and switch sub assembly shown in Figure 5. This sub assembly was given insertion difficulties of “align” and “resist.” The alignment difficulties came from trying to locate several parts at once that were flexible connected to each other by wires. At one end, the battery pack has to be located and at the other end the motor has to be located. These alignment issues make selecting “align” as an insertion difficulty less subjective since they are easily identified. One issue with these alignment issues is that they can cause insertion resistance if every part is not exactly aligned. This resistance becomes subjective because it may only be present one out of five times meaning that one designer may include it in the analysis and another may not. An example of subjective insertion difficulties “access” and “resistance” can be found where the switch pin sub assembly from Figure 4 is inserted into the housing shown in Figure 6. This “access” difficulty is present because the 5 Copyright © 2010 by ASME Ref scale Front housing Location of switch pin sub assembly Figure 6: Switch pin sub assembly inserted into housing During the assembly of the can opener top assembly shown in Figure 7 an insertion difficulty of resist was specified. While tightening the screw, a spring on the other side caused insertion resistance. Designers may or may not specify resistance depending on their perception of the difficulty. The switch pin sub assembly in Figure 7 is flexible, inserting it from the top and tightening the screw through the metal-plastic sub assembly. This is difficult if the bottom part is not aligned with the top sub assembly. Since the top sub assembly is flexible it is difficult to keep it in the same position because it needs continuous pressing from above. The small screw size and the varying resistance experienced also add to the insertion difficulties experienced by the designer. If one designer is able to tighten the screw easily they will not face any alignment or resistance issues whereas, for those who experience difficulties, they will consider selecting these as insertion penalties. Switch pin subassembly Can opener top Screw Metal-plastic cap subassembly Figure 7: Can opener top assembly 4.1.1.3. Wiring Harness Operation Another type of subjective information included in the DFMA software comes from the wire harness specifications. The DFMA software includes methods that can be used to conduct DFA on wires, wire connectors, and other aspects involved with wire harness assemblies. This information allows the assembly labor time to be accurately estimated but it also adds another area of subjective information. Several different features have been included in the software to accommodate assembly issues regarding wiring. The two main areas are specifying electrical securing methods or specifying an assortment of wiring operations that can be chosen. The securing method determines that the part is going to be secured immediately by that method. It gives the designer options of choosing from thirteen specific electrical operation characteristics like a standard electrical plug to secure the part. The wiring operations list lets the designer choose operations like wire preparation, wire assembly, wire installation, and more that can be applied to parts and assemblies. Figure 8: Quick wire connections from switch to battery pack within motor & switch sub assembly An example of subjective wire information can be found in the drill’s motor and switch sub-assembly and the wire connections within it shown in Figure 8. The issue with the wiring assembly information comes from the fact that it is hard to determine if the switch’s securing method should be secured later or if it should be documented as electrical securing. If it is secured later then wiring operations could be specified separately to connect it to the battery pack and the motor. If it is secured immediately using the electrical securing method, operation characteristics can be selected to account for the 6 Copyright © 2010 by ASME assembly operations. Since the switch has five quick wire connections the user has to be delicate in how the operations are specified because if the chosen penalty is incorrect the error will compound. One of the wiring harness operations that can be chosen under wire assembly is “wire end/lug insertion.” This lets the designer choose from three connector pin rows, specify the repeat count, specify lug orientation requirement, and ease of insertion. Determining if the connector is easy or difficult to insert is subjective information that affects the assembly time and must be determined by the designer. 4.1.1.4. Minimum part criterion The minimum part criterion does not directly affect the predicted assembly time but it is the primary method used to identify design improvements within the product. The information required to identify the minimum part criterion is subjective and requires the designer to answer multiple questions to determine it. The subjectivity of this information will not affect the overall initial assembly time but it will affect the re-design’s predicted assembly time. A more important issue that occurs since this information is subjective is that the designer has to determine the most appropriate answer for it to be effective. This will increases the amount of time the DFA analysis takes to conduct. Spacer Figure 9: Spacer as a minimum part criterion An example of minimum part criterion subjectivity is shown in the assembly analysis on the spacer piece shown in Figure 9. This part is located between the motor and the gear on the chuck assembly. The piece appears to be a spacer to prevent the gear on the motor from touching the gear on the chuck so the minimum part criteria could be based on “material” where the part must theoretically separate from the others. Another way of looking at this part is that it is just a spacer not serving a special task and that “other” could be chosen for its minimum part criterion which would make it a candidate for elimination. If the person conducting the assembly analysis is not the designer they will have to find the designer to determine if that part could be eliminated or not and why. This is the case with many of the parts that the minimum part criterion may identify as possible candidates for elimination. 4.1.2. DFMA evaluation criterion summary The results from the DFMA evaluation based on the five criteria are summarized in Table 2. The DFMA requires extensive amounts and types of user imputed information which slows down the analysis time and reduces its repeatability, consistency, and accuracy. It does provide the user with validated assembly times and eleven areas to focus redesign efforts both of which are critical for a DFA method to be effective. Table 2: DFA evaluation criterion summary Evaluation Criteria Approximate analysis time Evaluation Results Justification Medium Not minutes (High) but not days (Low) Predicted assembly times Baseline Previously validated results Amounts/types of information 8 types, 49 questions, 16 subjective Requires extensive amounts & types of user inputs Repeatability/ subjectivity 33% Subjective Reduces repeatability and accuracy # of Features for redesigns 11 Identifies eleven types of issues to focus on 4.2. Evaluation of Connectivity Complexity Metric DFA Method Two types of information are required from the user to complete the analysis using the connective-complexity DFA method. The user must evaluate each part based on which parts it is connected to and the type of connections between those parts. These two types of inputs are listed in Table 3 along with the number of questions that have to be answered per type and how many of those questions are subjective. since they are separated into distinct types of connections. For example shafts are easy to identify so if a part connects to it then it is part of the shaft instance. If the part is used to fasten or secure another part then a fastening instance is chosen as the connection. In some cases the user may not be able to distinguish which type of connection instance is most appropriate but as long as the user chooses a similar connection type that will have the same path length the results will not be affected. This method requires the user to identify that a connection instance between parts exists and does not typically distinguish between the types of connection instances. This is because the number of parts connected by that one instance increases the path length in the bi-partite graph. Two parts connected by a snap fit instance and two parts connected by a surface instance will have the same path length so there is no distinction between these instances within the algorithm. In the case of a shaft instance or a bolting instance where more than two parts are connected through one instance there is distinction between these types but only from instances with different path lengths. An example of a shaft instance and its bi-partite graph can be seen in Figure 10. Ball bushing (bush1) Drive gear (g1) Shaft Instance Shaft (s1) Ball bushing (bush2) (a)Bi-partite graph for a shaft instance within the drill Table 3: Connectivity required user inputs Ref. scale Inputs required Total # of # Subjective % from the user Questions Questions Subjective What parts is it 0 1 0 connected to What type of 2 4 0 0 connection 0 5 0 Total The number of basic questions required by this method is five and none of them are subjective, (Table 3). Determining which parts a part is connected to can be determined quickly and objectively. All the user has to ask themselves is “Does the part touch the part next to it within the assembly?” The answer to this question is “yes” or “no” which minimizes user missinterpretation. Once a connection between parts has been identified the user has to specify the type of connection. To do this the user determines if the connection is: a fastening instance, a snap/interference/press fit instance, a shaft instance, a surface instance, or another type of connection instance. In most cases determining the connection instance is obvious 1 7 Copyright © 2010 by ASME Bush 1 s1 g1 Bush 2 Shaft Instance (b) shaft and the parts connected within the sub-assembly Figure 10: Shaft Connectedness The shaft instance in Figure 10 is from the drive gear sub assembly of the drill. This sub assembly connects the gear on the motor to the gear that drives the chuck assembly. Looking at the parts of the sub assembly it is easy for the user to identify that a shaft is the common part that all of the other parts are connected to. This signifies that a shaft instance is the main connection unifying all of these parts. All of the connections that exist for the parts of this sub assembly are shown in Table 4. Table 4: Drive gear sub assembly connections Parts Instance Description Shaft Drive gear assembly bush1 g1 s1 bush2 Instance shaft connections Surface Bushing 1 to Bottom bush1 h1 Instance Grip Surface Bushing 1 to Top bush1 h2 Instance Grip Surface Bushing 2 to Bottom bush2 h1 Instance Grip Surface Bushing 2 to Top bush2 h2 Instance Grip Surface Drive gear to motor g1 m1 Instance gear Surface Drive gear to chuck g1 cs Instance gear Surface s1 h1 Shaft to bottom grip Instance Surface s1 h2 Shaft to top grip Instance The shaft instance in Figure 10 is shown in the first row of Table 4. The other rows show the other connections that exist between the parts of this sub assembly. The first four columns, highlighted in red, of this table are the only items that are put into the bi-partite excel table that is processed by the Matlab algorithm. The algorithm does not need column five or column six to determine the assembly time. These extra two columns shown in Table 4 are included for documentation purposes and user readability. The fifth column shows the instance between the parts and the sixth column describes which parts are being connected by that instance. The results from the connective-complexity DFA method evaluation based on the five criteria are summarized in Table 5. The connective-complexity method requires moderate amounts of time to complete the analysis and only requires the user to provide input based on a few different types of objective questions. This should make the analysis repeatable and consistent between users. The predicted assembly times that the method provides have not been fully validated so they cannot be accepted as correct. This method currently does not provide the user with features to aid in redesigning the part to improve assembly. 5 COMPARISON OF METHODS The results from the evaluations of each DFA method based on the specified criteria are discussed and compared in this section. 8 Copyright © 2010 by ASME Table 5: Connectivity evaluation criterion summary Evaluation Criteria Approximate analysis time Evaluation Results Justification Medium Not minutes (High) but not days (Low) Predicted assembly times Not accurate Validation needed Amounts/types of information 5 types, 0 subjective Requires few types of objective user inputs Repeatability/ subjectivity 0% Subjective Repeatable, and consistent # of Features for redesigns 0 Currently provides no redesign features 5.1. Comparison of approximate time to use each method The approximate time to conduct the DFA analysis using each method was evaluated to determine which method could be implemented the fastest. After the analyses were conducted on each product using both methods it was determined that the connectivity method could be implemented about 25% faster than the DFMA software. This is based off of approximate times since the analyses did not always take place in one sitting. Both methods required between 1.5 to 2.5 hours to complete the analysis depending on the complexity of the products. A High level of satisfaction would have an analysis time in minutes because it would give the user quick results, a medium level in hours, and a low level in days. Both methods had analysis times within hours so a medium level of satisfaction was chosen (Table 6). Table 6: Satisfaction with approximate analysis time Evaluation DFMA ConnectiveCriteria Software Complexity Method Approximate Medium Medium analysis time Reducing the analysis time for both methods will make them more appealing to designers because they will be faster and easier to implement. 5.2. Comparison of predicted assembly times The two DFA methods were compared based on their predicted assembly times to determine how close the connective-complexity method’s times were to the DFMA times. This data was gathered from three designers (D1, D2, and D3) who were trained on both methods before conducting the assembly analyses on the three products. This comparison includes the designer that conducted the analysis, their respective predicted assembly times per product, and the differences between the times (Table 7). The DFMA software has been in use since the early 1980’s [15] so its predicted assembly times are considered to be accurate and therefore they are the baseline for this comparison. B&D Drill with chuck assembly RIVAL Can Opener DFMA Software Assembly Time Connectivity Assembly Time Time Difference % Difference between methods B&D Drill Conducted by Measures of Effectiveness Table 7: DFA comparisons of method effectiveness D1 D2 2.42 2.16 1.22 - 1.20 50 44 D1 2.89 1.69 1.21 42 D2 5.49 4.77 0.72 13 D1 6.40 4.18 2.21 35 D2 5.52 4.61 1.34 24 D3 6.36 2.18 34 *All times are in minutes For all of the DFA analyses on the different products the connective-complexity DFA times were substantially lower than the DFMA predicted times. These times varied considerably where the smallest difference was 13% lower and the largest difference was 50% lower. The average of the % differences of the six analyses was 35% lower than the DFMA times. This is substantially higher than the +/- 16% difference originally found in the complexity connectivity DFA paper [9]. These significant differences were unexpected so some possible causes were investigated. Since the Drill had the largest percent difference of 50%, it was the primary area of investigation. The original assembly analysis of the drill assumed the chuck assembly to be one preassembled part so it was treated as a part during the analysis. This assumption was re-evaluated and both analyses were preformed again separating the chuck assembly into individual parts to be assembled as a sub assembly. This resulted in an even twenty eight second predicted assembly time increase with both methods reducing the percent difference by 8%. This shows that the two methods predict similar assembly times for certain parts of the drill but there are still significant differences between the two methods. Another possible source of the discrepancies between the predicted assembly times could be because the connectivecomplexity metric is based off a regression model that uses assembly times determined by the original Boothroyd Dewhurst DFA tables. The DFMA software has been improved over the years incorporating more features to improve the DFA method which were not included in the original tables. Future research could be to identify the cause of the discrepancies found in this part of the study. B&D Chopper 5.3. Comparing amounts of required user information Both methods require that a user disassemble a product, and then reassemble it to conduct the DFA analysis. Both 9 Copyright © 2010 by ASME methods also require the user to go through a set of procedures or questions to conduct the DFA analysis but they require different types and amounts of information. The specifics about the types and amounts of information that each method requires have been discussed in the previous sections. The total number of questions and the total number of subjective questions from each method are summarized in Table 8. Table 8: DFA methods required information summary Total # of # Subjective % Questions Questions Subjective Method 1 DFMA Software 49 16 33 Connectivity DFA 2 5 0 0.00 method The DFMA software requires the user to answer a total of forty nine questions per part where sixteen of them are subjective. The connectivity DFA method requires the user to evaluate a total of five questions per part where none of them are subjective. Since the connective-complexity method requires only objective information it should be repeatable between users. 5.4. Comparing repeatability of methods The repeatability of each method is measured by comparing the outputted predicted assembly times when the same analysis is conducted by different designers. The analyses of the drill and chopper were conducted by two and three designers respectively using the DFMA software, Table 9. The analysis of the chopper was conducted by two designers using the connectivity method, Table 9. The maximum percent internal differences of the method’s assembly time on the respective product are shown in Table 9. Table 9: Repeatability of methods Measures of DFMA Internal Connectivity Internal Repeatability % Difference % Difference B&D Drill 11 B&D Chopper 14 9 Based on the comparison of the amounts and types of information required by the user to complete each analysis, it was expected that the connectivity would have no internal difference. The connective-complexity method and DFMA software had internal differences of 9% and 14% respectively for the chopper analyses. This shows that the connectivity method has a lower percent difference but it doesn’t appear to be significant. One possible reason that the connectivecomplexity method showed repeatability issues could be due to the lack of formalized rules. 5.5. Comparison of methods redesign features The two methods were compared based on their redesign features to aid the designer in improving their assembly. This is important because for a DFA method to be effective they need to provide the designer with suggestions on how to redesign their product to improve its assembly characteristics. The DFMA software has eleven redesign features and the connective-complexity DFA method currently provides the user with no redesign features, Table 10. Table 10: Comparison of redesign features Evaluation Criteria Features for redesigns DFMA Software ConnectiveComplexity Method 11 0 The DFMA software is effective at providing eleven different areas to focus designers redesign efforts. The software identifies the area, the parts that are relative to that area, and the amount of assembly time or cost that could be improved by focusing their efforts accordingly. This feature does not always help the designer redesign the part but it will identify and prioritize areas for the designer to focus on to improve assembly. Currently the connective-complexity DFA method provides no aids to help the designer redesign the product to improve assembly. 6 CONCLUSION This paper evaluated Boothroyd Dewhurst’s DFMA software and a connective-complexity DFA method based on five criteria. The results from the evaluations of the two methods are summarized in Table 11. Table 11: Comparison summary of two DFA methods Evaluation Criteria Approximate analysis time Predicted assembly times Amounts/types of information DFMA Results Connectivity DFA results Medium Medium Baseline Not accurate 8 types, 49 questions, 16 subjective 33% Subjective 5 types, 0 subjective Repeatability/ 0% Subjective subjectivity # of Features 0 11 for redesigns The DFMA software satisfies all five criteria but does not perform well with the required amounts and types of information required by the user and its repeatability. The connective-complexity method does not provide the user with accurate results and does not provide the user with features to aid in the redesign to improve assembly. The amount and type of information required by the user to conduct the DFA analysis using the connectivity method was substantially less in quantity and in subjectivity compared to that of the DFMA software. This suggests that the connectivecomplexity method would be more repeatable and consistent than the DFMA software. Even if this is the case until the connective-complexity method can provide the user with 10 Copyright © 2010 by ASME accurate results and provide the user with suggestions for redesign it will not be a truly effective design for assembly method. The results from this evaluation and comparison can be used to identify weaknesses in existing DFA methods. This will allow researchers to focus their efforts so that the method in question can reach its full potential. If this study is going to be repeated or used to compare other DFA methods some possible improvements could be made. This research did not implement a full user study to obtain the results which limits the effectiveness of the study. The results from this study indicate that differences between these two DFA methods does exist and that a fully user study would effectively document all benefits and drawbacks of each method including the time to conduct the analysis. 7 FUTURE WORK Future work for this research has been identified as further evaluating the two methods by conducting a set of experiments to focus on some of the issues presented in this paper. One area is to try to identify the 50% variation of the connectivecomplexity assembly times from the DFMA assembly times. This would require identifying the connectivity’s ability to predict the assembly times for different instances with respect to the DFMA method. The complexity method may be more effective at predicting assembly times for some types of instances than others. Another area would be to develop an easy to read set of rules for the connective-complexity method. The rules currently are informal and would not be completely effective if handed to a designer who was not familiar with the method. If a set of case studies is to be conducted on this method, the set of rules should be easy to read with multiple examples. REFERENCES [1] G. Boothroyd and L Alting, "Design for Assembly and Disassembly," in CIRP Annals-Manufacturing Technology, 1992, pp. 625-636. [2] G. Boothroyd, "Design for Manual Assembly," in Assembly Automation and Product Design, 2nd ed. Boca Raton, FL: CRC Press, 2005, ch. 7, pp. 219-255. [3] G.G.F Dalgleish, "Desing for assembly: Influencing the design process," Journal of Engineering Design, vol. 11, no. 1, pp. 17-29, 2000. [4] G.E.M. Jared, M.G. Limage, I.J. Sherrin, and K.G. Swift, "Geometric reasoning and design for manufacture," Computer-Aided Design, vol. 26, no. 7, pp. 528-536, 1994. [5] Theory and Methodology Committee on Engineering Design, Commission on Engineering and Technical Systems, and National Research Council, "Executive Summary," in Improving Engineering Design: Design for Competitive Advantage. Washington, D.C.: National Academy Press, 1991, pp. 1, 23, http://www.nap.edu/catalog/1774.html. [6] X.F. Zha, H.J. Du, and J.H. Qiu, "Knowledge-based approach and system for assembly oriented design, Part I: the approach," Engineering Applications of Artificial Intelligence, pp. 61-75, 2001. [7] Geoffrey Boothroyd, "Product design for manufacture and assembly," Computer-Aided Design, vol. 26, no. 7, pp. 505-520, 1994. [8] D.D. Sanders, "An expert system for automatic design for assembly," Assembly Automation, vol. 29, no. 4, pp. 378388, 2009. [9] James L Mathieson, Bradley A. Wallace, and Joshua D. Summers, "Assembly Time Modeling Through Connective Complexity Metrics," in International Conference on Manufacturing Automation, 2010. [10] J. Mathieson and J. Summers, "Complexity Metrics for Directional Node-Link System Representations: Theory and Applications," in ASME International Design Engineering Technical Conferences, vol. DTM, Montreal, Canada, 2010, pp. DETC2010-28561. [11] J. Mathieson, C. Sen, and J. Summers, "Information 11 Copyright © 2010 by ASME Generation through the Design Process: Student Project Case Study," in ASME Design Engineering Technical Conferences, , Aug. 30-Sep. 2, 2009, -., vol. CIE, San Diego, CA, 2009, pp. DETC2009-87359. [12] J. Summers and J. Shah, "Mechanical Engineering Design Complexity Metrics: Size, Coupling, and Solvability," Journal of Mechanical Design, vol. 132, no. 2, p. 021004, February 2010. [13] F. Ameri, J. Summers, G. Mocko, and M. Porter, "Engineering Design Complexity: An Experimental Study of Methods and Measures," Research in Engineering Design, vol. 19, no. 2-3, pp. 161-79, 2008. [14] P. Dewhurst and G. Boothroyd, "Computer-Aided Design For Assembly," Assembly Engineering, pp. 18-22, 1983.