1
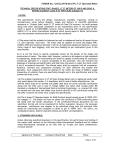
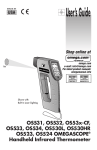
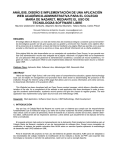
Lab Activities for an Interdisciplinary Energy Management Course Athula Kulatunga, Ph.D., CEM Department of Electrical and Computer Engineering Technology Purdue University, West Lafayette, IN Page 10.857.1 Proceedings of the 2005 American Society for Engineering Education Annual Conference & Exposition Copyright 2005, American Society for Engineering Education Lab Activities for an Interdisciplinary Energy Management Course Athula Kulatunga, Ph.D., CEM Department of Electrical and Computer Engineering Technology Purdue University, West Lafayette, IN Introduction It has been accepted that Engineering Technology courses should include some hands-on activities such as labs, projects, etc. In the field of energy management, energy audits have been used effectively to provide hands-on experiences. An energy audit, also known as energy survey, energy analysis, or energy evaluations, is a process that examines current energy consumption of a process or facility and suggests alternative ways to cut down energy consumption and/or costs. One aspect of the energy auditing process is to collect specific data of a process or a facility. Measuring temperature, flow rates (of heat, liquid, and air), intensity of light, electrical current, voltage, power, power factor, humidity, pressure, or vibration may be required to determine the energy consumption and waste. New measuring equipment are pouring into the measurement world making data collection easier, more accurate, and safer. Accurate data collection is paramount not only to analyze the energy consumption but also to evaluate the effectiveness of proposed changes suggested in an energy audit report. Some energy-saving electrical retrofits may introduce electrical power quality problems that may not be included by traditional meters causing erroneous data. With inaccurate data, a conclusion of an energy improvement project holds no validity. In a graduate course where energy efficient engineering technologies are taught, one may find students from different levels such as undergraduates in senior level, graduates with no ability to take electrical and/or mechanical measurements, and students from industry with little or no exposure to newer measuring instrument and techniques. This paper introduces several laboratory activities that could be replicated to teach students how to take accurate measurements of electrical, light, air flow, and heat flow parameters before conducting energy audits. The focus of these labs is not to introduce how to save energy but to introduce many aspects of the energy management. For example, predictive maintenance is an integral part of energy management. Ultrasonic and power quality measurements may not be used directly to determine energy savings, but they will be help identifying energy wasting components or the components that may fail in the near future. It is the responsibility of energy professionals to conserve energy and to prevent catastrophic failure of energy consuming machinery. For most industries the bottom line is cost savings, not energy savings. Sample labs Proceedings of the 2005 American Society for Engineering Education Annual Conference & Exposition Copyright 2005, American Society for Engineering Education Page 10.857.2 The following labs describe three aspects of energy data collection: 1) Heat flow measurements and energy cost calculations, 2) Ultrasonic leak detection, and 3) Power quality related measurement of 3-phase systems. These sample laboratory activities are formatted as a typical lab, hoping to make adoption of these labs easier. Figure numbering start from 1 in each lab activity. R-value measurement with Heat Flow Meter Objectives At the end of this activity students will be able to 1. Determine the R-value of an unknown material using Omega Heat Flow meter. 2. Determine the heating cost of a building. Equipment: The trainer, OMEGA OS652 Heat Flow meter, and insulation material with varying R-values. The Trainer The trainer shown in Figure 1 is made out of plywood and some residential insulation materials. It allows you to measure R-values of unknown insulation materials. One wall of the trainer has a removable fame (Figure 1(b)) that can be used to measure heat transfer properties of an unknown material. This area is also useful to evaluate new insulation materials that come to the market. Layers of insulation can be packed in to the frame to add insulation properties. See through window on the top is covered with a fiberglass material. Heat transfer properties of window covering material can be studied by placing them on this window. To obtain accurate heat flow measurement through an insulation material, there should be at least 20oF temperature difference between the two surfaces of the material. A 200W light bulb is placed inside the chamber to generate heat which is monitored through a temperature probe inserted as shown in Figure 1(a). A narrow window appears on the right hand side wall in Figure 1(c) allows a user to insert an infrared heat flow meter to take measurements. See through window (a) Contact Thermomet er Jig for insulation material (b) (c) Figure 1. Trainer for heat transfer measurements. Procedures Proceedings of the 2005 American Society for Engineering Education Annual Conference & Exposition Copyright 2005, American Society for Engineering Education Page 10.857.3 First the R-value of the wooden backplane of the jig should be determined. Next, insulation material can be packed into the jig and repeat the following steps. Since R-values can be added algebraically, the actual R-value can be determined by subtracting the jig’s R-value from the total R-value. To determine R-value, two measurements – net heat flow and reading difference – must be taken with OS652. Net heat flow measurement 1. Insert the insulation material listed in Table 1 into the jig one at a time. 2. Heat the trainer to 100oF. The temperature difference between inside and out must be greater than 20oF. 3. Insert the OS652 from the smaller window and aim the meter on to any inside wall other than the jig (Figure 2(a)). Press the trigger to the second position (trigger positions are described in the OS652 user manual) and wait for 3 seconds. While holding the trigger, aim the OS652 to the jig. Record the reading. A negative (-) reading appears if the outside temperature is less than the inside temperature. This is the Net Heat Flow through the insulation in British Thermal Units per square foot per hour or Btu/(sq.ft.hr). Reading Difference 4. To obtain the second reading, aim the OS652 to the insulation from inside (Figure 2(b)) and press the trigger halfway position. Record the reading. 5. Now move to the outside of the trainer, exactly opposite to the first location (Figure 2(c)). Record the reading in Table 1. (a) 6. (b) Figure 2. Measuring Heat Flow (c) Subtract the second from the first to get the reading difference in Btu/(sq.ft.hr). Record in Table 1. R-value determination 7. Using the R-value chart in Figure 3, find the point where the two above readings intersect to determine the R-value of the unknown material. Similarly, R-value of transparent material could be determined by placing them on the window located on the top of the trainer. Page 10.857.4 Proceedings of the 2005 American Society for Engineering Education Annual Conference & Exposition Copyright 2005, American Society for Engineering Education Material Net Heat Flow Reading Difference Step 3 Step 4 Step 5 Estimated R-value Step 6 Blue board Fiber glass Black form Figure 3. R-Value Chart, Courtesy of Omega Engineering The X-axis is of Figure 3 is the reading difference across the wall in Btu per square feet per hour. The Y-axis is net heat flow through the wall in Btu per square feet per hour. Energy Cost Estimation Proceedings of the 2005 American Society for Engineering Education Annual Conference & Exposition Copyright 2005, American Society for Engineering Education Page 10.857.5 Once students are familiar with R-value measurements, they can conduct a basic energy audit of a building. By taking several additional measurements such as area of walls, area of windows, and area of roofs, students may calculate the energy cost. The following method requires the Degree Day information in a given location. These tables are available through local weather stations. There are two types of degree days, heating degree days (HDD) and cooling degree days (CDD). A spreadsheet program such as Excel can be setup to automatically calculate the energy use and the cost. estimations. Figure 4 depicts an example Excel setup for HDD energy cost The following example shows how to determine the heating cost for a building with 1500sq.ft wall area, 100sq.ft of roof area, and 30sq.ft of windows. An Excel spreadsheet can be set up using the following formulas to calculate heating cost for any building. The following equation will yield the values in the highlighted cells. U_value = 1/(R_value +0.85) Btu lost= U value x Area x Monthly Average HDD x 24 Btu supplied by furnace = Btu lost/ heater efficiency Amount of energy units required = Btu of furnace/ Btu per unit of energy Monthly fuel cost = Fuel units requires x Fuel unit cost FUEL COST ESTIMATION FOR HEATING Enter value for red (underlined) cells only BUILDING ENVELOP R- Value of walls R- Value of roof U-Value of walls (BTU/sq.ft.hr.F) U-Value of roof (BTU/sq.ft.hr.F) U-value of windows* Area of walls (sq.ft) Area of roof (sqq.ft) Area of windows (sq.ft) Monthly Average Heating Degree days from table** Btu lost through walls Btu lost through roof Btu lost through windows 5 10 0.17094017 0.0921659 1.1 1500 100 30 1200 7384615.38 265437.788 950400 Total heat lost Btu's per month 8600453.17 * Select u-value for windows according to the following chart Single galss or plastic Double glazed Tripple glazed (1) (2) (3) (4) (5) 1.1 0.6 0.4 **(Temperature < 65F in a location) x (number of days per month) FURNACE Heter furnace efficiency Btu's supplied by the furnace 60 14334088.6 AMOUNT OF FUEL Energy per unit of fuel*** Ammount of Units required 144000 Btu/gal 99.5422821 COST ESTIMATION Unit cost of Fuel Monthly Fuel Cost $1.20 per gal $119.45 *** FUEL EFFICIENCY CHART & COSTS Type of fuel Heating Oil Natural gas Electric Propane Btu/unit of fuel 144000 Btu/gal 100000 Btu/therm 3412 Btu/kW hr 91500 Btu/gal Cost $1.50/gal $0.60/therm $0.06/kW hr $0.80/gal Proceedings of the 2005 American Society for Engineering Education Annual Conference & Exposition Copyright 2005, American Society for Engineering Education Page 10.857.6 Figure 4. Example Excel setup for heating fuel cost estimation in building Analysis By creating a template similar to above, repetitive calculations can be avoided and determine different options under different circumstances such as the cost of heating if you increase the insulation or change the fuel type. Spreadsheets not only calculate many equations simultaneously, they also allow data representation graphically. Graphical representation of energy data is very useful in determining energy saving opportunities. 1. Create an Excel spreadsheet similar to the one above, using the HDDs published for West Lafayette or a similar geographical location for the above building. Change the wall insulation to the measured blue board R-value and determine the difference between heating costs. A. Attach a printout of the file B. Save the file in a floppy disk and turn in with this report. C. Heating cost with given R-value = $_____________ D. Heating cost with if blue board are used on walls = $____________ 2. Describe any limitation of this method. 3. What additional information do you need to determine any problems associate with the model you just created and the actual energy consumption of the building? Explain. . Ultrasonic Detection Lab Ultrasonic signals are generated by moving components, air and gas leaks, electrical sparks, etc. Compressed air, natural gas, refrigerant leaks, overheated electrical terminals due to loose connections, failing bearings, could save significant costs if they are detected and fixed. Objectives At the end of this activity students will be able to 1. Describe the applications of ultrasonic detections 2. Detect ultrasonic sounds emitted from air leaks, defective gearings, stem traps, and electrical sparks 3. Develop ultrasonic profiles for above conditions. Equipment AccuTrak Ultrasonic detector; Hot-wire anemometer; Radiator with holes; Hamden Trainer or a motor with bearings; Electric drill machine; EasySCopeII or similar data logger Proceedings of the 2005 American Society for Engineering Education Annual Conference & Exposition Copyright 2005, American Society for Engineering Education Page 10.857.7 Background Information Read the documents “Ultrasonic Analysis” and “Energy Tips” found in the following websites: http://www.eere.energy.gov/femp/operations_maintenance/ under Operations and Maintenance Best Practices Guide Procedures Leak Signatures 1. 2. 3. 4. Read the AccuTrak user manual. Connect the radiator coil to compressed air supply. Adjust the pressure to 20 psi. Attach the yellow pointer to the detector and put head phones. Press and hold the red button and move the detector and locate all leaks and place a cross mark on the Figure 1 to indicate the locations. Label them A, B, C, D, etc. 1 10 2 3 4 5 6 7 8 9 Figure 1. Radiator coil leaks 5. Indicate the relative size of holes below. _________ > _________ > ________ > ___________ 6. Connect the audio output of the signal to USB Instrument connected to a PC. Red and activate EasySCopeII and then EasyLogger for DSIM12. You may need to refer to on line help topic to learn the features of the EasySCopeII and EasyLogger software. 7. Adjust time per division to 500µs or so (adjust if necessary) and adjust volts per division to 4V. Press the red button Observe signature of the waveform. Stop the acquisition. Move the scroll bar and notice the repetitive nature of the waveform. Copy to clipboard using copy chart to clipboard option under Edit. Past on a MS Word file for later use. 8. Repeat step 7 for each hole. Properly label and save. 9. Using the hot-wire anemometer, measure the air flow from each hole and record below. Table 1 Hole Cfm A B C D 10. Turn off air and disconnect the radiator. Page 10.857.8 Proceedings of the 2005 American Society for Engineering Education Annual Conference & Exposition Copyright 2005, American Society for Engineering Education Bearing Signatures 11. Connect a 3-phase induction motor to a dynamometer on a Hamden trainer as shown in Figure 2. The power should be off. Set the DC field voltage to 120 volts and turn the field rheostat all the way off. Turn off all switches on the resistor box. Call instructor to verify the connections. Resistor Box 110V/208V 3-phase AC C B A T1 A B C T2 T3 N L1 L2 L3 3-phase induction motor 1 2 1 2 arm 1 0-150V DC, 1A (set at 120V) 2 + - + - + - Seperately Excited Generator (dynamometer) Figure 2. Loaded motor 12. Turn motor’s switch off. Turn main breaker on and then turn motor switch on. Turn on the switches on the resistor box to obtain 1 ft-lb torque. 13. Using AccuTrak (with the pointed metal probe) and the EasyLogger for DSIM12, capture the ultrasonic signature of two motor bearings. Label and save the waveforms. 14. Turn off 3-phase power and disconnect the circuit. Electrical sparks signatures 15. Connect the electrical drill machine to a 110V outlet. 16. Turn on the drill. 17. Remove any probes attached to the detector. Move the detector closer to the where brushes are located and obtain the maximum reception by adjusting the volume until red bar moves around the mid range of the display. 18. Capture the waveform using EasyLogger for DSIM12 (± 4V Y-axis and 500µs for xaxis). 19. Now move the detector towards the chuck and observe the difference. 20. Properly label and save waveforms. You may have to try several times to obtain a good signature. Analysis Proceedings of the 2005 American Society for Engineering Education Annual Conference & Exposition Copyright 2005, American Society for Engineering Education Page 10.857.9 1. List some advantages and disadvantages of ultrasound detection. 2. Determine the annual cost of air leaks you found on the radiator if the utility costs 8 cents/kWh, compressor runs on a 24 hours-7 day schedule, and 4 cfm/hp. Assume orifices are well-rounded. Hint: examine unit cancellation to check the accuracy of your equation. 3. What can you say about the relative condition of four bearing by looking at their ultrasonic signatures? 4. What is the range of frequency produced by an electric spark? Power Quality Related Measurements The quality of an electrical power distribution system in a facility effects electrical motors, computers, electronic ballast based lighting systems, and microprocessor based controllers powered by the grid. Voltage sags, swells, uncontrolled current harmonics, an overloaded neutral conductors have been identified as leading causes of catastrophic failures, costing thousands of dollars. Objectives 1. Troubleshoot power quality problems in receptacle branch circuits 2. Troubleshoot power quality problems in the service panel 3. Troubleshoot power quality problems in 3-phase transformers Equipment Hamden Trainer or 208V/110V 3-phase supply; Fluke 43B Analyzer Required Reading View the video tape titled “Power Quality Troubleshooting” by Fluke Corporation. Background Typical electrical power distribution network is summarized in the line diagram shown in Figure 1. Each sub circuit may experience power quality problems. Power quality problem may lead to unexpected computer freezing, transformer shut downs, premature motor burn outs, lamp flickering, etc., causing expensive shutdowns in commercial and industrial processes. Identification and correction of power quality problems have become an important activity in the process of energy efficiency improvement. Page 10.857.10 Proceedings of the 2005 American Society for Engineering Education Annual Conference & Exposition Copyright 2005, American Society for Engineering Education Figure 1. Typical electrical power distribution network Procedures Power Quality in Receptacle Branch Circuits 1. Set up the circuit in Figure 2. Use three different watt lamps. Figure 2. Circuit set up for branch circuit trouble shooting 2. Our receptacle is connected to phase-C. Measurements required to troubleshoot a branch circuit include a. waveforms of each phase with respect to neutral, their RMS values, peak values, and b. ground to neutral voltage. Proceedings of the 2005 American Society for Engineering Education Annual Conference & Exposition Copyright 2005, American Society for Engineering Education Page 10.857.11 Clipped peaks indicate that computer loads (non-linear) are connected to the branch. If the peaks are clipped too much, this effects the operation of switching power supply inside computers. Voltage between N to Gnd is less than 2V is acceptable. More than 2V indicated overloading of the branch. 3. Take those readings using Fluke 43B and record below. Save the waveforms for the report. Table 1 Vp C to N Vrms C to N V N to GND 4. Next, use sags & Swell mode of Fluke 43B across Phase-C to N over 4 minutes. During this time activate the non-linear load. Save the waveform. If too deep sags or swell occur, the circuit branch need reconfigurations. List the recommended (video) solution in the Analysis section. Power Quality in Service Panels Electrical service panel should be evaluated if random resetting of computers and light flickering occurs. The troubleshooting involves: a. Visual inspection to see any loose connections and discolored conductors. Electrical sparks emits ultrasound waves. An ultrasonic detector may be used to locate such loose connections. b. Measurement of feeder conductor current measurement to see the load balancing. c. Measurement of branch neutral current to locate the branch circuit that produces the harmonics. d. Measurement of neutral current to see presence of zero sequence harmonics and overloading e. Measurement of phase to neutral voltages and neutral to ground voltages. 5. Measure the following quantities using Fluke 43 B or with any true RMS meter and record in Figure 2 (or an actual service panel). Turn on all loads. Table 2 I rms phase A I rms phase B I rms phase C I rms neutral Table 3 V rms A to N V rms B to N V rms C to N V rms N to GND I rms ground 6. Capture the current harmonics in the neutral conductor. Proceedings of the 2005 American Society for Engineering Education Annual Conference & Exposition Copyright 2005, American Society for Engineering Education Page 10.857.12 High content of harmonics indicates overheating. Typically total harmonic distortion THD < 20% is acceptable but this does not guarantee that the neutral is not overheating. An IR thermal imager would reveal the relative temperature of the neutral conductor. Figure 4 depicts an example of an IR imager. The middle conductor appears hot compared to other two conductors. This indicates that the middle conductor is either carrying too much current or there is a loose connection. Further test such as current measurements should be made to isolate the associated problem. Branch currents of each phase must be equal to the phase current. Figure 3. An IR imager of electrical terminals There should be some voltage between neutral to ground, typically less than 2Vrms. Zero voltage may indicate an illegal physical connection between neutral to ground at the service panel. Too high neutral to ground voltage could cause by too much current or too long neutral conductor. Power Quality in Service Transformers Even in a small commercial building or in an industrial facility it is not uncommon to find several step down transformers feeding service panels. They are hidden in many plants and receive little attention. As new loads are added, especially non-linear loads, overheating of the transformers will cause power quality problems. Transformers must be evaluated when they deliver full loads. The evaluation procedures include: a. Make visual inspection for overheating and blocked cooling vents. b. Record kVA rating form the nameplate c. Measure true RMS current, kVA, THD, harmonic spectrum, and k-factor as follows. If kVA measured < 0.5 x kVA nameplate rating, the transformer is not heating. ed ro be Bl ac k k ac Bl IP ro be be ro R IP IP Proceedings of the 2005 American Society for Engineering Education Annual Conference & Exposition Copyright 2005, American Society for Engineering Education Page 10.857.13 Figure 4. Measuring kVA of a 3-phase load d. Obtain harmonics chart of the neutral current. Expect amplitudes of harmonic bars to go down as the frequency goes up. If an unusually higher harmonic is present this indicates a possible resonant condition of that frequency. e. Record the k-factor as well. 7. If available, insert a 3-phase transformer in Figure 2 before the loads. Move the neutral to the transformers secondary center tap. Take the following measurements. Table 3 kVA Rating of the transformer kVA1 kVA2 kVA3 kVA Total 8. Capture the harmonic of the neutral current. You may use the current probe by itself. Analysis Insert waveforms and harmonics charts under the related question only. Do not staple print out all at the end. 1. Compare the reading in Table 1 against the acceptable ranges. Be specific in your answers. 2. How would you characterize the peak values of waveforms? Both peaks are clipped or one peak is clipped? 3. List the recommended solutions for branch circuit power quality problems. 4. What can you say about the phase currents in Table 2? How do they compare with the neutral current? 5. Does the current harmonic reveal anything about unwanted harmonics? Is THD within acceptable range? 6. What is neutral to ground voltage at the panel? Does this give you any clues? 7. What recommendations are suggested in the video to fix power quality problems associated with service panels? 8. What can you say about measured kVA and the given rating? 9. Any presence of current harmonics. If so, explain the nature. 10. What recommendations are suggested in the video to fix power quality problems associated with service transformer? Conclusions Proceedings of the 2005 American Society for Engineering Education Annual Conference & Exposition Copyright 2005, American Society for Engineering Education Page 10.857.14 The goal of energy management is to reduce costs through energy conservation and good maintenance practices. Energy consumption of residential, commercial, and industrial facilities can be determined with little preparations. Many plant mangers and engineers are reluctant to address energy issues assuming that specialized training is required to conduct basic energy evaluations. One with some electrical or mechanical background may easily learn how to conduct an energy audit if they know what to do. A simple trainer and few basic instruments allow students to learn key concept. One trainer would be sufficient if several other preparatory labs such as power quality, combustion analysis, light measurements, leak detection, flow measurements, etc. could be developed. This paper presented three example labs in detail. The equipment and procedure could be changed to suit the need and facilities in each institution. Before conducting any of the power quality labs, students must be aware of electrical safety. When students are conducting an energy audit in a real world situation, they should ask for help from a trained electrician who is familiar with the facility being audited. References [1] Kulatunga, A. “Energy engineering management curriculums for academia and industries in developing countries”, Proceeding of 3rd International Conference on Engineering and Computer Education (ICECE 2003), Sao Palo, Brazil, March 16-19, 2003, four pages. [2] Omega Engineering, “User’s Guide OS530L Handheld Infrared Thermometer”, Omega Engineering Inc., Stamford, CT, USA, 2003. [3] Omega Engineering, “OS650 Series Energy Conservation and Plant Maintenance Kits- Operator’s Manual”, Omega Engineering, Inc., Stamford, CT, USA, 1995 Biographical Information N. ATHULA KULATUNGA is an Associate Professor in the Electrical and Computer Engineering Technology Department at Purdue University, where his areas of expertise include power systems and energy management. He is a Certified Energy Manager (CEM). He can be reached by phone at (765) 494-7724 or by email at [email protected]. Page 10.857.15 Proceedings of the 2005 American Society for Engineering Education Annual Conference & Exposition Copyright 2005, American Society for Engineering Education