1
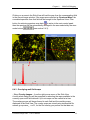
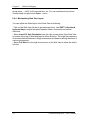
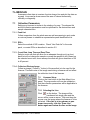
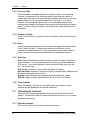
Chapter 1 Quick Start
1.2
Quick Start Linescan
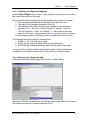
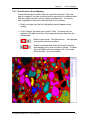
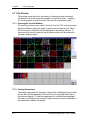
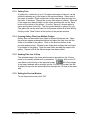
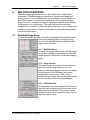
1. Set a preset for spectrum collection.
2. Select an appropriate amp time to obtain a dead time between 20 and 40
percent.
3. Collect an electron image.
4. Collect a spectrum.
5. Identify the peaks.
6. Switch to Linescan.
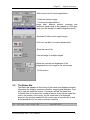
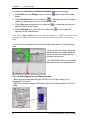
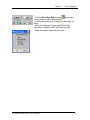
7. Click on the draw line button. Click and drag the mouse on the image to
draw the line.
8. Select the number of points, a dwell for collection at each point, the data
type and if desired, check the Quant box for a Quant linescan. (A time
estimate based on the number of points and the dwell will be displayed in
the status bar at the bottom of the screen.)
9. Begin the linescan. A dialogue box will open to select a file name and
location.
10. When finished, Microsoft excel will open automatically with the collected
data displayed. Plot the linescan using the chart wizard.
2
GENESIS Maps/Line - User’s Manual