1
GENESIS
UTILITIES
USER’S MANUAL
COPYRIGHT © 2007 EDAX INC.
ALL RIGHTS RESERVED
EDAX INC.
91 McKee DRIVE
MAHWAH, NJ 07430
USA
9499.203.98120
July 06, 2007
Version 5.20
GENESIS Utilities – User’s Manual
1
Chapter 1 Introduction
TABLE OF CONTENTS
1
INTRODUCTION.........................................................................................4
2
EDAX EPIC TABLE UTILITY .....................................................................6
The Omitted Elements.............................................................................................. 8
The Compound Calculation Utility.......................................................................... 9
3
EDAX SCREEN CAPTURE ......................................................................12
3.1 Grab32 File Requirements.....................................................................12
3.2 EDAX Grab32 Setup Menu.....................................................................13
3.3 EDAX Grab32 Setup Options ................................................................14
3.4 AVI File Creator ......................................................................................16
4
LIVE SPECTRUM MAPPING DATA VIEWER .........................................18
5
SPECTRUM UTILITIES - SPECTRUM.........................................................28
5.1 Setup......................................................................................................29
5.1.1 Number of Spectra per Printed Page ...............................................30
5.1.2
EDAX Reports & Annotation Parameters......................................32
5.1.3
Username for Spectral Printouts ...................................................32
5.1.4
User Bitmap Logo ...........................................................................32
5.1.5
Color Overlay Printing Options .....................................................32
5.1.6
Saved Spectrum DPI .......................................................................32
5.1.7
MSA/EMSA Save Format ................................................................32
5.2 Snap Reports .........................................................................................42
5.3 Image and Spectrum Overlay Mode ......................................................44
5.4 Live Spectral Color Overlay Mode.........................................................45
2
GENESIS Utilities - User’s Manual
5.5 Spectral Labeling Utility.........................................................................46
5.6 Microsoft Word Reports for Spectra .....................................................46
5.7 Spectral Color Selection ........................................................................47
5.8 Particle Options .....................................................................................49
5.9 Image Thumbnails ..................................................................................53
5.10 Particle / GSR User Interface Support ...............................................55
6
SPECTRUM UTILITIES – IMAGING DATA .................................................58
6.1 Bitmap Image Viewer............................................................................59
6.1.1 Print Multi-Color........................................................................................... 59
6.1.2 Copy to Clipboard......................................................................................... 59
6.1.3 Disk File Save ............................................................................................... 59
6.1.4 Preview Annotation....................................................................................... 60
6.1.5 Display Multiple ........................................................................................... 60
6.1.6 Zoom+........................................................................................................... 60
6.1.7 “W” button .................................................................................................... 60
6.1.8 # of Images per Report.................................................................................. 60
6.1.9 Palette........................................................................................................... 60
6.1.10 Grayscale Palette......................................................................................... 60
6.1.11 Thermal Palette ........................................................................................... 60
6.1.12 Pseudo Palette ............................................................................................ 61
6.1.13 User Palette ................................................................................................ 61
6.1.14 Data Scaling : .............................................................................................. 63
6.1.15 Creating Bitmap Images with Parameter’s Annotation .............................. 64
6.1.16 Converting Bitmap Images to ASCII CSV Files ........................................ 66
6.2 RGB Mixer .............................................................................................67
6.2.1 Selecting the “White Image & RGB Mode”. ................................................ 69
6.2.2 Selecting the “White Image & Pseudo Color Overlay”. ............................... 70
6.3 X-ray Map / Image Merger ....................................................................71
6.3.1 Bitmap Folder Orientation ............................................................................ 73
6.3.2 Example Merged Output Examples .............................................................. 73
7
CUTEPDF WRITER......................................................................................78
GENESIS Utilities - User’s Manual
3
Chapter 1 Introduction
1
Introduction
There are 4 utility packages installed on most Genesis systems. They can be very useful for
the examination of your spectral and Imaging data, and all can be found in the EDAX
Genesis folder that’s on your desktop.
EPIC Table : EDAX Periodic table of elements. This is most useful for checking the
theoretical energy values for the elemental lines, and modifying the Automatic Peak
Identification Omission list.
Screen Capture : Used to capture sections of the data displayed on the screen and save it
in BMP or JPEG format , send it to the clipboard or just print it out.
Spectral Utility : This is a 2 part software package for dealing with all types of
(1) Spectral data and (2) Bitmap imaging data.
LiveSpcMap Viewer : Used to examine spectral mapping data either collecting live or
after it has been collected. Only the EDAX *.spd file data is supported, not the older
Multipoint Spectrum map data. The Multipoint / Eagle Vision Spm/Spz data files can be
converted to the SPD file format, using the “Convert2-SPD” function within the “Display
Map Results” dropdown selection.
4
GENESIS Utilities - User’s Manual
Chapter 1 Introduction
Other EDAX Non-Utility ICONS in Genesis Folder
Manuals : A folder that contains shortcuts to most of the PDF user manuals for the
Genesis software, including this manual. Only the user manuals for the software you
purchased & installed will be displayed here.
EDAX Software Movies : This icon is installed only on English Genesis systems. This
program is used as a launcher to view the EDAX Software movies. These movies are based
on Genesis 2.5 to 3.6 software versions, but are very informative on how to use the Genesis
software.
Genesis : Icon used to start the main Genesis software.
Genesis DPP-2 Shell : Icon used by the installation engineer to align & calibrate the newer
systems EDS detector(s). This applies to both Silicon based and Apollo 10/40 SDD as well.
Genesis SG-2 Shell : Icon used by the installation engineer to align & calibrate the systems
imaging / beam control.
Uninstall ALL : Icon used remove all the EDAX Genesis software from the workstation.
Warning : Use of the application will un-install ALL the software in the folder C:\EDAX32.
What’s new in V5.20 : Windows help file that outlines what is new in the latest version of
the Genesis Software.
GENESIS Utilities - User’s Manual
5
Chapter 2 EDAX Epic Table
2
EDAX Epic Table Utility
The EPIC table can be started by clicking the EPIC button in most of the Genesis tabs, or you
can click “Epic Table” Icon in the EDAX Genesis folder on your desktop.
The layout of the EPIC table (EDAX Peak Identification Chart) is based on the periodic table
and contains the positions and energies of the peaks for all series of an element. The energy
data in this table could be edited if needed to fine tune the Peak Identification for a specific
detector.
The EPIC table can be started from the expanded Peak ID section by clicking on the EPIC
button found on most of the main control panels of Genesis.
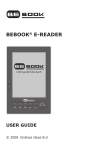
The periodic table of the elements is displayed as shown below. Clicking on any element
will display the major peak positions for K, L and M alpha lines for that element in the center
portion of the table.
To examine the complete energy table for an element click on the element in the periodic
table and then click the “EDS Energy Table” button to display the energy and relative
intensities of all of the lines.
Total Ka : When your checking “K” lines for elements this option is checked, it will usually
display the averaged energy value for all the K lines of that element, not just the KA1 line.
6
GENESIS Utilities - User’s Manual
Chapter 2 EDAX Epic Table
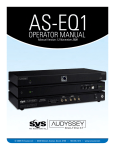
The energies can be edited in this table so that the EPIC table can be customized for each
detector, if desired. To edit the values, highlight the old value, type in the new value and
then click on “Change”. If the original values need to be restored, click on the “Reset” in
the EPIC tables main menu.
GENESIS Utilities - User’s Manual
7
Chapter 2 EDAX Epic Table
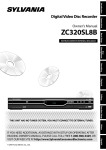
The Omitted Elements
The Omitted element list contains 15 default elements that will not be included in an Auto
Peak ID. However, other peaks can be manually added to a peak list in the same manner as
any other element. Elements can also be added or removed from the “Omitted List” if
desired. To access the omitted element list, click on “AutoID” in the menu of the EPIC
table. The current list of omitted elements will be shown. To add an element, simply click
on that element on the EPIC chart. To delete an element, highlight the element in the list and
then click “Delete”. Once all of the changes have been made, click on the save button.
Select the program that the list is to be applied to (choice 9, for Genesis Spectrum and
Mapping) and then click “OK”. To review an omitted element list, click on “read” at the
bottom of the element list and then select the program for which the list is to be reviewed.
8
GENESIS Utilities - User’s Manual
Chapter 2 EDAX Epic Table
The Compound Calculation Utility
Another feature of the EPIC table is the calculation of the atomic and weight percents from a
chemical formula. In the menu, click on the “Comp” selection. In the displayed window
enter the elements by typing the symbol into the top edit box or clicking on the element in the
main EPIC window. Enter the number of atoms in the formula unit into the At. No edit
boxes and click Wt% or At% in the menu.
SOFTWARE MENU
Menu - Energy:
Used to select the energy table. Normally the user will deal only with set 2. However, the
user may examine, but not modify, the data in set 0, set 1 and set 3.
File - Open Peak Set 2 : If you wish to view the contents of any Dxenrg2.eng file that has
been customized you can read it in.
File - Save Peak Set 2 : You can save a customized copy of the dxebrg2.eng file to any
name you like.
Always On Top : If you want the EPIC table to stay as the Top-Most window above all
others. This is the default mode.
Menu - Print:
To print the energy table for any currently selected element. It can also print the modified
element list in Set 2.
GENESIS Utilities - User’s Manual
9
Chapter 2 EDAX Epic Table
Menu - Reset:
The application software always loads DxEnrg0.eng & DxEnrg2.eng. If the system is
configured for a non-sapphire detector, when you click on the Reset function, the
DxEnrg1.eng file is copied into the DxEnrg2.eng file. If the system is configured for a
Sapphire detector, when you click on the Reset function, the DxEnrg3.eng file is copied into
the DxEnrg2.eng file.
Menu – Comp :
This is a small utility to calculate the Weight% and Atomic% from the chemical formula.
Select the elements from the periodic table. Then select the atomic number with the mouse
and input the atom number in the text box. Press the C (Change) button or the return key will
update the table. After inputting all atomic numbers in the column, clicking on Calc-W will
calculate the Wt% and At%. You may copy or print the data.
You may also change Wt%. Use the R (Rest) button to calculate the remainder (=100-rest
wt%). Then press the At% menu function to calculate the At% and Atomic number ratio,
which will be scaled to the first Atomic number.
After getting the Wt% data, many other calculations can be easily done under the Menu
Others.
There is an additional feature useful to calculate X-ray Transmission.
These are the steps used to measure the x-ray transmission using this Program :
For example if you need to know how thick the Pb layer must be in order to
Stop Au X-ray K line energy for 90% radiation, then perform the following steps :
1. Run the DxEnrg32 program and select the Comp menu item.
2. Select Au by clicking on the Au cell from the table.
3. Select Pb by clicking on the Pb cell from the table.
4. Input the Wt% for Au, say 0.01, then click on the "C" button or press enter.
5. Click on the R button to derive the remainder of the Wt%.
6. Click the first column with the cell containing "1", next to Au. This selects
the Au energy, the Line is controlled by the EPIC Windows K, L, M Radio Selection.
7. Click on the Others menu item and select the last one in the list, X-ray Abs in film.
8. Enter absorption %, default is 90%. Then click on the OK button.
9. The result is next to the R button: AuK T (um) : 571.8.
This means for AuK energy, 571.8 um thickness of Pb will absorb
90% AuK energy.
This is all that needs to be done. However, you may use any material such
as stainless steel. In step 6, you can also select cell 2, next Pb for PbK energy.
10
GENESIS Utilities - User’s Manual
Chapter 2 EDAX Epic Table
Menu - Oxide :
This is a small utility for oxides to calculate its weight% in element or oxide (Wt%) form.
Select the elements from the periodic table. Then edit the oxide ratio with the mouse and
input the value in the text box. Press the C (Change) button or the return key will update the
table. After inputting all of the Wt% column, click on Elem% from the menu will do the
Elem% calculation.
Input all Elem% column and hit Wt% from the menu. It will do Oxide calculation. Use R
(Rest) button to calculate the last one oxide value (=100-rest wt%)
Under menu Others, you may also calculate the oxide wt% from the oxide ratio alone or
input number of atoms in Elem% column. You may also calculate the mass abs. coeff. once
you do this, a manual "Save" function will become available. This function can only be used
on a DX-95 using the Compton method with XRF Combine or XRF No-Standards software.
GENESIS Utilities - User’s Manual
11
Chapter 3 EDAX Screen Capture
3
EDAX Screen Capture
The Screen Capture program is used to grab any portion of a Windows screen and copy it to
the clipboard. It can also save the image to disk or send it to your printer. You must move the
capture window and cover the screen area you wish to grab. Then click on Capture Only,
the image will be copied to the clipboard.
However, sometimes, you need to grab more than one image with or without the same size
and location. Then use the Setup button for a more customized setup. The following
window will be displayed when you click.
Added to V5.20 : Added new button ( picture of Camera), to just click and drag on screen
area. Click on this button, draw the Red Box to cover the area you wish to place on the
clipboard, and then paste the data into your desired application ( e.g : Microsoft Word)
3.1 Grab32 File Requirements
The Grab32 program needs three files to run , they are all located in “C:\Edax32\Utl”
Grab32.exe, Grab32.Hlp , MSVBVM60.DLL , CreateAVI.exe
This utility can be used on any PC, even without EDAX software installed by simply placing
these 4 files into the above mentioned folder. If you wish to use JPG files a full Genesis
installation will be required.
12
GENESIS Utilities - User’s Manual
Chapter 3
EDAX Screen Capture
Clicking the “Setup” menu item will display the following window to setup
output parameters.
3.2 EDAX Grab32 Setup Menu
File - Used to select the proper path and filename for next BMP/JPG file to store.
Printer Setup – Used to select the printer desired for output to.
GetHomePos – Size & Move the main grab window first. Then click GetHomePos to
locate the future program location. You may also edit the location from the 4 text boxes.
The numbers displayed / used are in Screen Pixels * 16.
GetCapturePos – Size & Move the main grab window first. Then image grab location can
be set by clicking this. You may also edit the locations from the 4 text boxes.
AviTool – Launches another utility shell used to merge image files (bmp/jpeg) to the AVI
file format (Windows Movies – WITH Compression).
Back - Back to main program. It will be ready for new image grab.
GENESIS Utilities - User’s Manual
13
Chapter 3 EDAX Screen Capture
3.3 EDAX Grab32 Setup Options
Always On Top – The capture window is displayed on top of all other windows – it cannot
be hidden when this mode is active.
Exit after Capture – Automatically closes the window/application after a capture is
completed.
Repeat Capture location - It will use the same location to grab the image. So you do not
move the main program anymore, after you properly Setup and Load.
Slow Capture for eDrawing – Slows down the capture process to allow grabbing images
being produced by eDraw software. eDraw requires a lot of computer processor time so you
must turn this option on to grab images more reliably.
Print Orientation : When outputting screen shots to the printer you select either a
Landscape or Portrait format.
Printed Area : When outputting screen shots to the printer, you can select to print the data in
the actual size you selected, or expanded to fill the full page of paper.
Keyboard “Print Screen” to Printer : When this option is selected, you can leave the
Screen Capture software minimized, and by simple pressing the print screen button on your
keyboard, will output the entire screen snapshot to the printer.
Keyboard “Print Screen” Capture : Same as above option, but the screen snapshot is sent
instead to a image (BMP/JPEG) file.
Timed Screen Capture – Selecting this option allows the software to automatically save a
picture to disk at the time interval in seconds that you define.
Save Images (BMP/JPG) to disk - Program will create BMP or JPG file after each Capture.
Auto Save – Option to use if you wish to save several files with names that are numerically
incremented. Files are saved with increment numbers of 1, such as AA11, AA12, ... It is best
to assign the filename with letters and that ends with a number.
Save file in JPG Format – When un-checked the image files will be saved as 24 bit color
Bitmap files with NO Compression. When checked it saves as JPEG, with a 95% quality
mode which typically results in a 90% reduction in file size with minimal loss in printable
image quality. You can change the path and filename to be used in the “Auto Save” mode
by simply typing in the edit box at the bottom of the window. The New Paths will be created
automatically. There is also a Browse… button to define a path/filename.
14
GENESIS Utilities - User’s Manual
Chapter 3
EDAX Screen Capture
GENESIS Utilities - User’s Manual
15
Chapter 3 EDAX Screen Capture
3.4
AVI File Creator
If you click on the Setup Menu option AviTool – The following window will be displayed.
FPS (Frames per Second) : Typically use a value of 1 here as the speed of playback.
Fast Auto Name : A quicker way to define the input starting filename and the output AVI
filename. You will see the first image displayed after you select a path. Alternately you can
select the Source and Destination filenames for the images.
Click the “Create AVI” button to start the conversion of image data to AVI-Movie data.
16
GENESIS Utilities - User’s Manual
Chapter 3
EDAX Screen Capture
The following window will be displayed. It allows you to select the compressor method for
the AVI output file. Using “Uncompressed” will output an AVI file the same size as the
sum of the size of all the input image files.
Here is a listing of compressors available on a typical laptop computer using Windows XP.
Depending on the compressor you have installed on your computer, the compression of data
can be anywhere from 0% to 95%.
During the compression process the % completed will be displayed in “RED” in the
completion status bar.
GENESIS Utilities - User’s Manual
17
Chapter 4 Live Spectrum Mapping Data Viewer
4
Live Spectrum Mapping Data Viewer
This is a utility used to view Live collecting (via the Maps/Line Genesis Tab or Eagle Vision) or
saved spectral map data in Color overlay mode, using the same 6-color palette (32 shades per Color)
as is used in the Genesis Maps/Line tab. Or you can use the RGB display mode for true color mixing
of 2 or 3 elements. One of the key features of this utility is that you can change the element list
as the data is being collected.
This software can be started in 3 different ways. (1) You can click on Start, All Programs, EDAX
Genesis and LiveSpcMap Viewer. (2) You can start this software from the Spectrum Utilities
software – View Menu item, or (3) just double click on the file “C:\ Edax32\ Utl\ LiveSpcMap.exe”
from the Windows explorer.
This software can only be used if you have purchased the Genesis Medium or High Resolution
Spectrum Mapping Option, or the Eagle Vision software.
When you start the software you will see the following window appear. At this point the software
can be set to read live collecting data from the Genesis “Maps/Line” tab or you can read in a stored
spectrum mapping data file. (*.SPD) .
If you are collecting live data, just click on the “SPC-Info” button and the elements (Maximum of
6) will be set, as will the data set that is being colleted. The “Read SPD” button and the AutoUpdate dropdown will then become enabled.
The path and filename of the dataset will be displayed directly above the x-ray maps image data.
18
GENESIS Utilities - User’s Manual
Chapter 4 Live Spectrum Mapping Data Viewer
You can then click the “Read SPD” button to do a one time read and display of the current mapping
elements. Or, if you want the map to be updated periodically , use the “AutoUpdate “ dropdown
list (e.g. 20 Secs) , as a default the software is set to Autoupdate Off.
Clicking on the SPC-Info button reads the mapping elements ( Maximum of 6 ) from the file
C:\Edax32\Genesis\GenMaps.Spc file & the Spectral Mapping collection mode / properties.
For Live mapping updates, you can select the Auto-Update period for the display; typically this
should be longer than the frame time used for the map being collected. These are the possible time
update periods for this selection:
Options: Displays the periodic chart to change your own element selections. Click on Update after
making your selections. There is a limit of 6 elements in substitution mode, or 3 using RGB mode.
When you use this Options mode it will force the image display to a smaller size to fit both the
image and the periodic chart.
You can extract data from the ROI’s of K, L or M lines as long as the energy you select is within the
region of the SPD file that was stored. You cannot extract ROI data for multiple lines of a single
element (e.g. CuL + CuK) .
GENESIS Utilities - User’s Manual
19
Chapter 4 Live Spectrum Mapping Data Viewer
Window Resizing: If you are NOT in Options Display mode, you can click on the Maximize button
to view the Map data full screen, or you can click & drag on the X-axis boarder to expand/shrink the
window, you need to maintain a 1:1 Aspect ratio! In this resize mode the window is not forced to
keep a fixed aspect ratio so you can size the x-width and y-height of the window independently.
This can be useful for instance if you are interested in only watching the image data and not the
intensity values as they are updated.
This option was added to the Genesis V4.60 software. Selecting it will maintain the
window aspect ratio more correctly to view image and intensity data. This applies when the window
is in sizable mode, not when maximized or in Option display mode.
Also starting with V4.60 there is the ability to extract the linescan data from the
stored or live SPD file. There is still the limitation of 6 elements. Just click this option checkbox,
and then the “Draw Line” button. When you draw any line on the map data you will see the
extracted line profiles displayed. The Lines X/Y coordinates are displayed along with the X-ray ROI
intensities for each element. Note : Linescan Display and Spectral display cannot be used at the
same time.
By enabling the checkbox “Keyboard Arrow Shift”, you can use the keyboards 4 directional keys,
up/down/left/right to shift the position of the extracted line data.
20
GENESIS Utilities - User’s Manual
Chapter 4 Live Spectrum Mapping Data Viewer
Starting with Genesis V4.60 there was the ability to view the spectral data from a
reduced area of the stored or live SPD file. The center X/Y coordinates are displayed along with the
X-ROI intensities for each element. To identify unknown peaks in the spectrum you can click on the
“PeakID Lines” Checkbox
Fe
to scroll down/up the periodic table to view each elements (K,L,M) characteristic lines.
Each time you click on the map data and the “eXtract” checkbox is selected, the spectral data from
a small area of the SPD will be displayed. If the software is updating the maps automatically it will
also update this spectrum.
Starting with Genesis V5.20 there was the ability to extract data from a reduced area or a single data
point from the SPD file. As you can see above a reduced area is being used since the reduced
selection is active (yellow).
ReadTotalSpc : If you wish to read back in the total spectral data for the map click this button. The
total counts for the map (in millions) will be displayed next to the button.
Using this option will keep this utility always visible, on top of any other window,
like Genesis.
Element Line Series Selection : You can select 1 elemental line at a time (highlighted with a blue
box) to select which line series you which to use for a particular element. Then click on an element
from the periodic table. Click on the “Update” button to refresh the x-ray map displays.
Read-Spd: Starts the manual Reading mode to display the spectrum map data. During this time a
progress bar is displayed and at the conclusion the time spent in seconds creating the map overlays is
displayed.
ROI Scan : Scans all possible elements using the currently selected line series (K , L, or M Lines ),
and a list is displayed with their ROI intensity values. Double click on this list to erase it from the
display.
GENESIS Utilities - User’s Manual
21
Chapter 4 Live Spectrum Mapping Data Viewer
The ROI's with greater then the background count will be displayed. The minimum ROI value is
based on the # in the dropdown list { Bkg Subtract } *100. The Bkg Subtract dropdown list has
fixed integer increments (1,2,3…) , but you also type in any value you like , e.g. : 0.45.
Color Palette Mode: 2 distinct color-scaling modes are possible, Substitution Overlay whereby
the highest relative intensity per image data point is displayed, and RGB Color Merging. The later
mode can only be used for 2 or 3 elements. The following is an example of the color output mixing
using RBG mode.
22
GENESIS Utilities - User’s Manual
Chapter 4 Live Spectrum Mapping Data Viewer
Intensity Scaling: You can use Auto scale to let the software automatically determine the maximum
intensity per element, or you can use Manual Scaling where you set the intensity scaling values per
element. This gives you greatest control over the visual map data. Each time you click the Update
button will cause the full scale values to Auto Scale, so don’t do this when you are in manual scaling
mode, click the “Read SPD” button instead. The “True Max” values were not displayed in
versions prior to V4.60.
AutoFull Scale Adjustments: When you are in Auto-Scaling mode and you wish to adjust the
overall image brightness up/down, you can use this percentage amount to accomplish this. The
default value is always 125%. BKG Subtract is the minimum counts in all channels that will be
used for threshold the display. This should typically only be used for very high quality maps.
All the x-ray map data displayed is based on Region of Interest (ROI) data extraction. NET
intensity, WT% or any other method is currently not possible. The resolution value saved within the
spectral file (SPC) is used to calculate the ROI widths.
Step Element ( +, -) : A mode used to step up & down the periodic chart so you can examine Xray map data from all possible elements & lines, one at a time. You can only examine ROI data
within the SPD data cube (# of Channels) defined. Attempting to do so will display a warning
message.
Grey Scale Image Mode : When you are examining 1 element at a time using Step Element mode,
the default color used for the image data is RED. Sometimes using this Grey Scale Image mode can
make image features easier to see.
File: Allows you to manually select a stored Spectrum Map Data file (*.Spd). Now in V5.2, when
you read in a file the image from the x-ray map is displayed first.
Save: Copies the color image displayed to a BMP file.
Print: Outputs the current image with Comments you’ve written to the printer.
Copy: Transfers the displayed color image to the windows clipboard.
Process : Allows you to create the max channel spectrum for the map.
Comments : Allows you to write text comments to simple identify your sample.
The Genesis Maps/Line tab in V4.60 was improved to support Slow-Spectrum
Mapping ( Non-Live) and this utility.
GENESIS Utilities - User’s Manual
23
Chapter 4 Live Spectrum Mapping Data Viewer
After selecting an SPD file using the File button the parameters for the SPD file will be displayed,
below the periodic chart.
Computer Memory : A warning message may be displayed if you are trying to display map data
when the available system memory is less then that required to fit the entire dataset into it. The
overlay creation process will still work, but may be 5x slower. This happens mostly when using the
512 or 1024 map matrices.
High Resolution Map Example
A high resolution 512x400 map collecting live with both the “Maps/Line” tab displaying the
individual maps and the live showing the overlay of them.
Note : This utility can only support SPD data sizes ( Max Counts per Channel ) , 1 Byte
(256) , 2 Byte (65000) . 4bytes (Any) is NOT currently supported and not practical.
24
GENESIS Utilities - User’s Manual
Chapter 4 Live Spectrum Mapping Data Viewer
# Maps View : Three options are possible, 0, 6 or 12 individual maps. Using this
option allows you to view the maps with no substitution, so you can see the true makeup of
each selected map.
You can get a much better view of the individual maps by clicking once on the map image,
and it will be displayed atop the periodic chart area. Click on the small version once again to
erase the large image. The example here below shows a zoomed TiK Map.
GENESIS Utilities - User’s Manual
25
Chapter 4 Live Spectrum Mapping Data Viewer
If you select 12 map display , you can then select 12 elements but only the first 6 will be used
for the Live X-ray map overlay.
When using the 12 maps view mode, the intensities for the 2nd 6 maps will be displayed next
to the x-ray map signals name.
26
GENESIS Utilities - User’s Manual
Chapter 4 Live Spectrum Mapping Data Viewer
PCA Data Extraction Mode : New in V5.20, you can view your spectral map data using
Phase Cluster Analysis mode. This can only be used for high quality data – offline. The
process for creating the maps is slow and takes approximately 1 minute for a 128x100 map.
To enable this function select from the Color Palette Mode drop down, PCA Data
Extract.
Up to 6 phases can be added, just click on an area of the map, then a new spectrum from that
area will be displayed, click on the “Add” button to add that phase. When you are done
adding phases click on the “Read-SPD” button to generate the phase map. The status area
will display “ChiFit” while the data is being processed. Below the phase map is the area
fraction % for each phase.
You can define the selection of phase areas from the reduced area mode or Spot mode.
GENESIS Utilities - User’s Manual
27
Chapter 5 Spectrum Utilities – Spectral Data
5
Spectrum Utilities - Spectrum
SpecUtil is a software utility used to Print ,View & Convert EDAX Spectral and Imaging
data. It supports many formats of spectral data that can be read and saved, but for image
data mainly BMP files are supported.
File :
Open
28
Used to read in a spectral directory. This is the list of file types that
can be opened. Clicking on any of the filenames in the spectrum list
will display that spectrum. You can select multiple files if you click
and drag on the list or use the keyboard Shift-Click sequence.
GENESIS Utilities - User’s Manual
Chapter 5 Spectrum Utilities – Spectral Data
Save SPC as BMP… Used to save the current spectrum display to a *.Bmp or *.Jpg file.
Spectrum Labels
Displays a utility to view and print all the selected spectral labels for
cataloging purposes.
Print Screen...
printer.
Outputs the currently displayed Spec Util window to the system
Printer Setup..
Standard Windows Printer Configuration.
5.1 Setup
Displays the following dialog to configure data display & output.
GENESIS Utilities - User’s Manual
29
Chapter 5 Spectrum Utilities – Spectral Data
5.1.1 Number of Spectra per Printed Page
You can select to use 1 , 5, or 10 spectra per page. If you need to view the spectrum with
the greatest detail, select “1”. By enabling the “Grids” option , the spectrum will be
displayed in the spectral area of the window with grids, but the grids will not appear on the
printouts.
Example 1 spectrum / Page
Black & Outline
30
Example 5 spectra / Page
Color and Outline
GENESIS Utilities - User’s Manual
Chapter 5 Spectrum Utilities – Spectral Data
Example 10 spectra / Page
Color and Solid Fill
GENESIS Utilities - User’s Manual
31
Chapter 5 Spectrum Utilities – Spectral Data
5.1.2
EDAX Reports & Annotation Parameters
When you create Microsoft Word reports OR Re-save image data you have the option to
include parameters at the bottom of each map/image. In the Image Utilities section there is
now a preview button so you can see what the annotation will look like prior to creating
output. The “Vertical Image Palette” mode is now the recommended mode to use because
the palette section is much larger, and more informative because it contains 10 steps instead
of 4.
5.1.3
Username for Spectral Printouts
Used to input your personalized text that will be output in the title bar of each spectra page
printed.
5.1.4 User Bitmap Logo
You can use your own company’s logo in the title of each printed page. Just follow the
instructions on this dialog, click on the “Set Bitmap” button to load a different Logo bitmap
that you are familiar with.
5.1.5 Color Overlay Printing Options
There is a selection to add Smoothing to the spectra to give the peaks more of a Gaussian
shape, also you can select to Auto Vertical Full Scale each spectra or just use the full scale
of the largest peak of ALL the spectra.
5.1.6 Saved Spectrum DPI
In the case where you want to save the spectral BMP files with higher or lower resolution,
you can set the Dots per Inch saved into the BMP file. As a default when Spectrum Utility
starts this will always be set to 96 Dpi.
5.1.7 MSA/EMSA Save Format
3 selections are possible. A) Standard MSA format, B) ISO22029 format, C) Standard MSA
with 1 column of energies and 1 column of intensities.
Edit - Copy SPC to Clipboard…
clipboard.
32
Sends the current spectrum display to the Windows
GENESIS Utilities - User’s Manual
Chapter 5 Spectrum Utilities – Spectral Data
Edit – Create SUM Spectra Used to sum all the selected spectra (*.spc) into a single file.
After using this function, click on File – Save SPC…. to store the new file to disk.
View – Live Spectrum Map - Launches the Live Spectral Map viewer where you can
View stored (*.spd) files, or actively collecting Live Spectrum maps, and change the element
lists on the fly.
View – Show Peaks - Used to determine the centroid in Ev, resolution in Ev, and full scale
of all the labeled peaks in the current spectrum. You are given the option to send these
results to the printer.
View – SNAP Spc into Genesis “Spectrum” - Launches a Top-Most floating window
above Genesis Spectrum to load spectra into easily into the Genesis Spectrum tab. The
spectrum utility window will minimize at that point.
This window can be closed by clicking the “OK” button or the close button in the right of
button can be used to re-define the path used to display spectra files.
the window. The
Clicking on the spectral filename will display that spectrum in the Genesis “Spectrum” tab
and also the date and time the file was saved. The pathname being used is displayed directly
above the spectral listing. If the pathname is too long to fit , it will always be displayed in the
tooltip area. This window can be minimized to remove it from the display and / or it can be
resized to reduce the amount of space it consumes on top of Genesis Spectrum tab.
GENESIS Utilities - User’s Manual
33
Chapter 5 Spectrum Utilities – Spectral Data
You can also use the keyboards up/down arrow keys to slide through the spectral filenames
to view. While the spectral data is being loaded the path name will be displayed in red and
cursor switches to an hourglass to show the system is busy. Scroll slowly to view all the
spectra.
34
GENESIS Utilities - User’s Manual
Chapter 5 Spectrum Utilities – Spectral Data
The following main MENU functions all run in batch mode. This means that all the
spectra you have selected will be converted to the file type you have selected, when you
click on one of these selections.
SPC>>Printer
SPC>>BMP/JPG
SPC>>MSA
EDS>>SPC
CSV>>SPC
SPE>>SPC
MSA>>SPC
WDS>>Printer
WDS>>Bmp
Starts outputting EDS spectra to the printer.
Converts EDS spectral display to Windows Bitmap or JPG format.
Converts EDAX Windows spectra to MSA (*.Msa) format (Ascii).
Converts 9800/9900 collected spectra to Windows SPC format.
Converts EDAX CSV spectral data to Windows SPC format.
Converts Electron Flight Simulator spectra to Windows SPC format.
Converts MSA (*.Msa) format (Ascii) to EDAX *.Spc Windows format.
Starts outputting WDS spectra to the printer.
Converts WDS spectral display to Windows Bitmap files. (New V5.1)
Main Menu - Particle Options
If you read in a Particle Analysis or GSR dataset’s (*.Csv) this menu item will become
visible and it allows you to create histograms of this data.
Main Menu - Image Utilities
Clicking on this function first asks you the starting BMP filename and then displays the 3
imaging utilities for working with bitmap data. Those functions are fully explained in
Chapter 6.
Help Contents : Displays the On-Line help file (last updated at version 3.5)
Help Users Manual : Displays this PDF file.
Help - Display Purchased Genesis Software : Reads what software was purchased and is
available in the Genesis License key file. You must navigate to the path of the Genesis.edx
or GenesisRemote.edx license key files.
Help - Display Installed Genesis Software : Reads what software was installed previously
via the ComputerId.txt file
Help About
: Display the software version number and creation date.
GENESIS Utilities - User’s Manual
35
Chapter 5 Spectrum Utilities – Spectral Data
EDS Spectral Format Types
*.SPC EDAX 32Bit and DX-4 (16bit) Spectra and Macintosh
*.EDS EDAX 9900/9800 System Spectra
*.MSA Microscopy Society of America V1.0 – Single Column (ASCII).
*.SPE
Electron Flight Simulator Native Format
*.CSV Comma Separated Values (ASCII).
Macintosh Note : Because of the fact that EDAX Macintosh spectra and DX4/Phoenix
spectra have the same file extension (.SPC), when you read in MAC Spectra you can convert
them 1 at a time by double clicking on the filename in the list box. If you wish to convert
multiple MAC spectra to EDAX Windows format, first select the folder, then disable the
Printer toolbar button in the top right of the Application, and then click on SPC>>Printer.
You will be prompted if you wish to Convert the Mac spectra to Windows Spectra. Also, the
original MAC spectra file will be re-saved with the file extension *.Mac.
Current Active Folder
Displays the folder name where the spectral data is currently being displayed from. Each
time you use the File-Open mode this field will be updated. This is located directly below the
main menu.
36
GENESIS Utilities - User’s Manual
Chapter 5 Spectrum Utilities – Spectral Data
Total Spectra List
A file listing (directly to the left of the spectral display) of all the spectra files that are in the
current active folder. To the right of the filename is it’s date time. By clicking on the
filename it will display the contents of that file. As a default when you use the File-Open
mode to select a folder, all the spectra in that folder will be selected ( highlighted ), and any
operation you select will be performed on all the selected spectra.
When you make multiple selections of spectra ( for example by click and dragging on this list
or (Control Clicks)) the number of selected spectra and the total will be displayed above the
spectral movement controls.
Spectral Processing Speed Selection
This is the print speed control used to adjust the display update time per spectra when the
SPC>>Printer mode is used. The range of Delay times possible is from 0.1 second (99%) to
10 seconds (1%).
GENESIS Utilities - User’s Manual
37
Chapter 5 Spectrum Utilities – Spectral Data
MSA Spectral Data : The following is an example of an EDAX spectral file converted into
the MSA file format (which is ASCII). This can be read and examined in Microsoft Excel.
#FORMAT
: EMSA/MAS SPECTRAL DATA FILE
#VERSION : 1.0
#TITLE
: Anchor Premium Grade
#DATE
: 2/25/2005
#TIME
: 8:36:54 AM
#OWNER
: Jenny
#COMMENT : Converted by SpecUtil32 of EDAX INC.
#NPOINTS : 2500
#NCOLUMNS : 1.
#XUNITS
: Energy (eV)
#YUNITS
: Intensity
#DATATYPE : Y
#XPERCHAN : 10.
#OFFSET
: 0.
#CHOFFSET : 0.
#SIGNALTYPE : EDS
#XLABEL
: X-RAY Energy
#YLABEL
: X-RAY Intensity
#BEAMKV -kV: 25
#LIVETIME -s: 100
#EDSDET
: SIBEW
#SPECTRUM : Spectral Data Starts Here
3
1
3
….etc
….etc
#ENDOFDATA:
If you use the X/Y mode in the Setup dialog, the energies in Ev will also be output :
10.0, 0
20.0, 0
30.0, 0
40.0, 0
50.0, 0
60.0, 0
70.0, 1
80.0, 13
90.0, 118
100.0, 105
110.0, 79
120.0, 85
130.0, 75
140.0, 104
150.0, 93
38
GENESIS Utilities - User’s Manual
Chapter 5 Spectrum Utilities – Spectral Data
WDS Spectral Data : Since WDS scans are typically a small # of channels scanned, the
SpecUtil software does not give you the option to re-position the data on the display. The
Start and End energies are defined by the *.wds file, which is actually an ASCII file. If you
wish to output the scans to the printer select the WDS>Printer main menu function to start
this process.
Contents of Example WDS File Above. (First 8 Channels of data)
_LABEL:
_DATE:26-Feb-2004 _TIME:11:31:43
_KV:10.0 _MAG:8000 _WD:14.00 _SPOT:69.00
_BEAMCRT:28.600 _TILT:2.1 _TAKEOFF:40.07
_DIFFR:3(W-Si) _2D:60.600 _DQX:1431
_PROP_HV:2050 _GAIN:20888 _BLM:118 _LLD:179 _ULD:3200
_START_EV:450.0 _END_EV:750.0 _EVSTEP:1.0 _DWELL:1.0
Region_1 of 1 Data_points = 301
450.0 0.0
451.0 0.0
452.0 96.0
453.0 112.0
454.0 109.0
455.0 120.0
456.0 114.0
457.0 130.0
GENESIS Utilities - User’s Manual
39
Chapter 5 Spectrum Utilities – Spectral Data
Spectrum Sorting Mode
If you read in a Particle Analysis or GSR dataset (*.Csv) that was collected using the
“Classification” mode, this option button will be displayed below the spectra file listing
and selecting it allows you to sort out the spectra for only the classification groupings you are
interested in. It will display the # of spectra within that class , the number of the class, , and
the classification name.
Sort : Inserts only the “Checked” classes into the SpecUtil – master spectral listing.
Restore : Reverts back to the original master spectral listing.
Print : Outputs a listing of the spectra for the enabled classification groups to the printer.
Un-Sort : Reverts back to the master spectral listing , and disables the sorting mode.
40
GENESIS Utilities - User’s Manual
Chapter 5 Spectrum Utilities – Spectral Data
Spectral Processing Abort
If during a long spectral print sequence, you want to stop the printing, just click on this
button “Stop” and the software will terminate the printing. All printed data that was
submitted will continue to printout until the print buffers are cleared.
EDS Spectral Display
The main display area is where you can manipulate a spectrum’s start/end energies and
vertical scale by simply clicking and dragging on a section of the spectrum. Only 1 spectrum
can be displayed at time, unless you check the “Multiple-Spectra” Toolbar button.. You
can also use the spectral control buttons located above the spectrum to adjust the spectrum
display.
You can also use the keyboard keys to alter the spectral display region. Page
Up=HorzExpand, Page Down=HorzCompress, UpArrow – VertExpand, DownArrow –
VertCompress, Cursor Left right with arrow keys, and Home.
Whenever you click on a section of the spectrum displayed, the keV energy and counts at
that channel are displayed directly above the spectrum.
Solid Versus Outline Spectra
The spectral display in Spectral Utility follows the Genesis Spectrum tab software’s selection
“Overlay Mode”. With this mode set the spectra displayed within this utility will be in
outline.
GENESIS Utilities - User’s Manual
41
Chapter 5 Spectrum Utilities – Spectral Data
5.2 Snap Reports
Used to create Microsoft Word reports easily from EDAX spectral & Image Data. Just click
the “Snap Report” checkbox in the top right of the window to enable this function. When
you first check the “Snap Report” option you will see a small outline of a box displayed in
the spectral display area. This is the default area where the image will be displayed.
Tips : To remove a single name from the grid, select it & press the keyboards Delete key.
Double click on a Spectrum or Image name from the SnapReports grid to display it in the
SpecUtil window. You must first check the SnapReport checkbox before using the FileOpen function !!
42
GENESIS Utilities - User’s Manual
Chapter 5 Spectrum Utilities – Spectral Data
You can only insert names into cells that were previously filled.
Add-1 / Insert : Click to Add or Insert a file name. The files used can be from different
folders.
Add-Mult : A ne mode added in V5.1, allows you to add in all the selected files names from
either the spectra or bitmap filename listings.
Clear ALL
: Clears out all the Spectra & Image Names.
Make Report : Starts the report generation process. The number of Spectra + Images
will be displayed, and the Microsoft template name currently defined to use for the report
will be displayed.
When you have clicked the “Snap Report” checkbox , another checkbox beneath it will be
displayed. That would be “Large Image” mode. When this option is selected, the image
will be displayed on top of the entire spectral display, and gives you a better view of large
complex image files. In large mode the image displayed has 7x more pixels. Small image
mode is close to a 110x90 pixel size the large display is about 512x400 pixels.
GENESIS Utilities - User’s Manual
43
Chapter 5 Spectrum Utilities – Spectral Data
5.3 Image and Spectrum Overlay Mode
A new function available in V4.60 is the ability to overlay Spectral and Imaging data on a
single view. The resultant bitmap file created from this process is always 512x400 pixels in
size, true color.
This mode is only possible if you checked the “Snap-Report” option checkbox. You will
see the “Image Overlay” option selection. Then click on File-Open; select a path &
filename to display. At this point a spectral and Image bitmap lists will be selectable.
2 possible draw colors are selectable by the dropdown list, Black or White, the selection will
be used to draw the spectral parameter data onto the image.
You can use the main menu Edit-Copy Spectrum… to send the data to the clipboard, or FileSave Spc as Bitmap to save it to a file.
If you read in a Particle Analysis or GSR datasets, you can generate a display that contains
Spectral / Image and Quant Results.
The image filename will be displayed in the bottom left corner of the display.
44
GENESIS Utilities - User’s Manual
Chapter 5 Spectrum Utilities – Spectral Data
5.4 Live Spectral Color Overlay Mode
Up to 6 spectra can be displayed live, in 6 different colors and manipulated. Just click
the toolbar button , next to the Word Template Dropdown list. Select the “Multi-Color
Overlay” checkbox and each time you click and select a spectrum it will be added to the list
and displayed.
Reset
: Used to clear out all the selected spectra
Re-Scale : Used to scale all the spectra to the one that has the largest full
scale count value.
Each of the spectra’s filenames will be displayed directly above the total spectral display.
GENESIS Utilities - User’s Manual
45
Chapter 5 Spectrum Utilities – Spectral Data
5.5 Spectral Labeling Utility
If you want to view and or print the labels of all your spectra files, this is the utility to use.
Click on File – Spectrum Labels…, to start this utility.
Just select the spectra you want the labels for from the Disk Spectra column, click on Select
and then on Label to view the labels. If you just want to output all the labels to the printer,
click on Print-ALL.
Click the “Path” button to select a new file path for spectra file.
5.6 Microsoft Word Reports for Spectra
This mode is only supported on Genesis systems and Vision32 because it relies on the
EDAX Ultra report software option to be installed. If this option is not properly installed the
“W” button will not be displayed or will display it grey’ed out.
In the most basic mode of using the software, by clicking on the “W” button, the software
will send all the active spectra to a Microsoft Word report using the template you have
selected. The dropdown list next to this button contains all the templates you have created. If
this is a particle analysis dataset, the Spectrum , Quant Results and Particle bitmap will all be
sent to the report, if using the Standard Template.
You can create any type of custom report with the Report Templates Wizard, so the reports
are not limited to single analysis per page if you create your own custom report layout.
Simply click on the Wizard selection at the button of the template drop down list.
46
GENESIS Utilities - User’s Manual
Chapter 5 Spectrum Utilities – Spectral Data
5.7 Spectral Color Selection
The following 4 toolbar icons are used to set the color & print mode desired. The first 3
modes can print 1, 5 or 10 spectra per page, when you click on the menu item SPC>Printer.
Each time you click on this Icon the next possible mode is enabled.
The 1st button prints in Black & White - Outline
The 2nd button prints in Red-Color - Outline
The 3rd button prints in Red-Color – Solid
The 4th button sets the print mode to print a single spectral region to the printer in outline
Mode. This will be a Color Overlay of up to 6 spectra per page.
GENESIS Utilities - User’s Manual
47
Chapter 5 Spectrum Utilities – Spectral Data
Toolbar Printer Enable/Disable Mode
If want to automatically preview a lengthy list of the selected spectra you can select the
Printer Enabled / Disabled switch as a visual preview, but as a first pass don't need a
hardcopy output.
Select your spectra of interest, set the speed at which you want to preview them , then click
on the Spc>Printer menu item to start the process.
48
GENESIS Utilities - User’s Manual
Chapter 5 Spectrum Utilities – Spectral Data
5.8 Particle Options
By clicking on File – Open selecting the Particle & Phase or GSR CSV data type, and
then choosing a filename, the dataset is read in and the Phase Options menu item will be
displayed. Click on the main menus Phase Options to access it’s functions.
View
: Displays the first selected dataset you have checked (e.g. : X-Ferret)
View Next
: Displays the next possible selection in either the Morphological selections
column or the Elemental selection column.
Copy
: Transfers the histogram displayed to the windows clipboard
Print Graphic : Prints the histogram currently displayed.
Save BMP
: Saves the histogram displayed to a BMP of your choice.
Print Multiple Histograms : Used to print up to the first 6 datasets you have checked.
Number of Bins : Used to select the number of columns to load the dataset into.
GENESIS Utilities - User’s Manual
49
Chapter 5 Spectrum Utilities – Spectral Data
Chemical Classification : If the X-ray data was collected in the Particle Analysis software
with the “Classification” option checked this option will display the class type groupings in
columns.
Build Location Bitmaps : Used for burning the analysis location coordinates into new BMP
(Loca*.Bmp) files, using selectable colors. The new bitmap file will be named
Loca****.BMP. The stars indicate the field number of the image.
The BuildBitmaps Color Selection (dropdown list) is the color that will also be used for the
crosshairs on the small particle images printed ( or in the Word Report) in multiple mode. A
new entry for V5.1 (last one) is Classification.
Attach particle on Printouts : When you want to do a multiple spectrum printout this will
print with each particle with it’s associated spectrum.
Attach Particle Data on SPC : When you want to do a multiple spectrum printout this will
print the intensity (or Concentration) data from it’s associated spectrum.
Particle Numbers per Field : If you want the numbering added to the bitmaps for each
field ( Starting from 1, instead of the running total) check this option.
50
GENESIS Utilities - User’s Manual
Chapter 5 Spectrum Utilities – Spectral Data
ThumbNails : Displays a window where you can collect better quality images (*.bmp files)
for each particle that was collected from the Particle Analayis software.
Note : Spectrum Utility CANNOT process an entire Multi-Stub Mode {JOB}
Automated Data result !, but you can process each STUB individually by loading the
CSV file from each Stubs sub-folder one at a time.
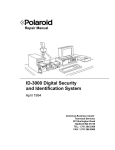
USING SPEC UTIL TO DISPLAY PARTICLE/
PHASE DATA
The EDAX Spectral Utility program
compliments Particle/Phase analysis by
providing, easy, meaningful and
comprehensive methods of displaying the
large amount of data generated in a
particle analysis. The basic function of
spec util, printing ten spectra per page,
works well for displaying the large
number of spectra acquired in a particle
analysis. Other features now available in
Spec Util such as particle histograms for
all of the chemistry and morphology
characteristic, creating a numbered particle
location map as well as adding the bitmap of the zoomed particle and/ or the quantitative
results to the printout, make SpecUtil an excellent accessory for particle data reporting.
To begin, open the .csv file that is created with each particle analysis.
¾ Use the “File”, “Open” pull down menu, switch the file type to “EDX Particle &
Phase Data .CSV”.
¾ Browse for and open the .csv file from the desired analysis.
¾ A new selection, “particle options” will now appear in the menu bar.
¾ Clicking on this option will open the Particle Options Window.
¾
When the window opens, one of the histograms will be displayed on the left hand side of the
window, and the options selections will be on the right side. Select the first morphology
characteristics box and click the “view Button”. That histogram will now be displayed. By
clicking the “View Next” button, the histogram for the next characteristic can be viewed all
GENESIS Utilities - User’s Manual
51
Chapter 5 Spectrum Utilities – Spectral Data
the way down the list. To look at a particular characteristic, deselect the checked category,
select a new category and hit “View”. The same can be done with the Chemistry. If a class
library has been utilized, a classification data histogram can be created by checking the
Chemical Classifications box at the bottom of the list and then hitting the view button.
The histograms can now be printed by checking the desired categories and clicking the “Print
Multiple Histograms” button. Up to six histograms can be printed at once (scaled to be six
per page), or a single graphic can be printed on a full page
by clicking on “Print Graphic”. A histogram can also be saved as a bitmap, by clicking on
the “Save BMP” button. This will open a window to select a name and location.
To add the particle zoom to the spectra printout, check the “Attach particle data to SPC” box.
To add the quantitative results, click on the “Attach Spectrum Results” checkbox. These
options will now be utilized when printing the spectra in the 1, 5 or 10 spectra per page
modes.
For the display of data, it may also be useful to have an image with the particles labeled with
their number. To do this, click on the “Build location Bitmaps” button. A bitmap file will be
created for each field. The color of the numbers can be selected (before building the maps)
by choosing a color from the drop down menu. The image will be saved as
“LocaXXXX.bmp”, with X being the field number.
Using each of the different display modes for particle data in SpecUtil, and easy, informative
report can be created.
52
GENESIS Utilities - User’s Manual
Chapter 5 Spectrum Utilities – Spectral Data
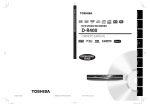
5.9 Image Thumbnails
Clicking this button will display the window.
A module that can be used to re-collect a better quality image from each particle found in a
particle search, and save them to individual BMP files.
This dialog displays the full field image (512x400 Pixels) at the center, and a new 256x200
image that it collects live from the microscope from each particle in the top right of the
window.
Below this 256x200 image are the datasets parameters (X,Y, Class) . Multiple stage Fields
can be reprocessed and all the new image data is stored in a sub-folder of the main dataset
named "\ ParticleBMP".
The total particle list for the *.Csv file will be displayed below the last fields image. Click on
the Connect to SEM button , to setup the imaging and microscope control functions.
Start : Initiates the particle image data collection sequence.
GENESIS Utilities - User’s Manual
53
Chapter 5 Spectrum Utilities – Spectral Data
Reads : Sets the number of averaging reads you wish to perform on the images collected.
The larger the value the better the image quality. The minimum is 100 and the maximum is
1000.
Particle ZoomOut Factor : Selects how many times the actual particle size you wish to
scan. The default value is 1.0, the maximum value is 3.0. The larger this value the greater is
the area scanned around the particle. If the particles are quite small this is a useful function.
Slow Presentation for DEMO : Selecting this option will slow down the process by 10x so
you can visually watch each step more carefully.
Collect –e : Collects a single image.
ExtXY : Enables or disables the EDAX control of the microscope image.
Example of imaging ZoomUp using the Image ThumbNail mode.
54
GENESIS Utilities - User’s Manual
Chapter 5 Spectrum Utilities – Spectral Data
5.10 Particle / GSR User Interface Support
When you read in a Particle data or GSR Data set using the File-Open sequence, the display of the window will be stretched
out to display each particle. You can see the spectrum, the quant results and the particle
information each time you click on a spectra filename.
Clicking the button switches between viewing the spectral data, or the (512x400)
image view for the currently selected field #.
New in V5.1, you can now read in a particle or GSR data set that was saved using the image
file format option “.PNG. But, the PNG file format is NOT currently supported anywhere
else in the spectrum utility software.
GENESIS Utilities - User’s Manual
55
Chapter 5 Spectrum Utilities – Spectral Data
In the example below the
button has been clicked to move the image for the
current field into view. Also, the “Draw Crosses” button has been clicked which shows all
the particles with crosshairs/numbering. In this case the particle numbering does not begin
with 1 since the Particle Options selection (# per field) is not checked.
In the example above, if you have "Classification" selected as the crosshair color, the
crosshair color will be defined by the class of the particle. A table was also be displayed.
56
GENESIS Utilities - User’s Manual
Chapter 5 Spectrum Utilities – Spectral Data
If the Windows display is set to 1280x1024 screen resolution or higher, you are able to view
the spectral data on the top of the window and the full fields image below it. You must
manual stretch the bottom of the window to see the image at the bottom.
GENESIS Utilities - User’s Manual
57
Chapter 6 Spectrum Utilities – Imaging Data
6 Spectrum Utilities – Imaging Data
There are 3 separate tabs that can perform different image utility tasks, and they are the
Bitmap Viewer, RGB Mixer and X-ray Map / Image Merger. See the text below the
graphic for the function descriptions. This window is now displayed as a full screen window
to make viewing of the image data easier.
File : You can use this selection to open new file datasets, or if you are in RGB Mixer mode
or the Bitmap Image Viewer, and you’ve created a new color bitmap, then you can use this
menu to save that bitmap file.
Print Screen : Sends a snapshot of the current display, to the system printer.
ConvertBMP to JPEG : Converts all the selected images from BMP file to highly
compressed JPG files. Compression is typically at least 10 :1.
ConvertBMP to CSV : Converts all the selected images from BMP files to ACSII CSV
files. This function is new in V4.60.
Exit : To Close the Image Utilities window.
The first step for using any of these 3 imaging utilities is to read in the first file in the
mapping filename series by clicking on Image Utilities from the Spectrum Utility main
menu, and selecting a bitmaps filename. This will then display the tri-tab Image Utilities
window.
58
GENESIS Utilities - User’s Manual
Chapter 6 Spectrum Utilities – Imaging Data
6.1 Bitmap Image Viewer
The first tab, it is used to view , & print images and create Word reports. Near the top of the
window there is the current path and filename for the image being displayed. Just below that
is a file list you can click on to select 1 image or a group of images.
6.1.1 Print Multi-Color
Outputs all the selected images to the printer. The image output to the printer tries to do a
best fit layout on the paper. There are 3 optimized sizes, 2 , 6 or 12 images per sheet of
paper.
6.1.2 Copy to Clipboard
Send the current displayed image to the windows clipboard.
6.1.3 Disk File Save
Clicking on the
named “Annotate”.
button allows you to save all the selected images to a new subfolder
GENESIS Utilities - User’s Manual
59
Chapter 6 Spectrum Utilities – Imaging Data
6.1.4 Preview Annotation
Displays the selected image / map , with all the annotation that was selected from the Setup
- EDAX Reports & Annotation Params” window of Spectrum Utility. Once you select
this you can just click on another filename and it will also be displayed in this preview mode.
Clicking again on the preview window displayed will close it.
6.1.5 Display Multiple
You can select up to 16 filenames from the list , and by selecting this function , all will be
displayed in the image area’s. The image name and maximum intensity (Smax) will be
displayed next to the images name.
6.1.6 Zoom+
To get a better view of image data this will switch between displaying the small image in the
bottom of the window as a single large image, and the 16 image view mode.
6.1.7 “W” button
Used to create Microsoft Word reports. All the active image filenames will be sent to the
report. Depending on how you’ve selected the Setup-Word Report-Image Data Parameters,
will determine what extra parameters will be attached to each image output.
6.1.8 # of Images per Report
When using the “W” button, this allows you to control the visible image resolution of the
images copied into the report. So if you only want 4 images per page it will make stretch out
these 4 images to provide more detail for viewing them easier.
6.1.9 Palette
4 possible palettes are possible, Grayscale, Thermal, Pseudo, and User Palettes. The purpose
of the palettes is to bring out image details that cannot be seen using the default palette of the
image.
6.1.10 Grayscale Palette
Displays the palette that’s stored in the Bitmap file, this is not necessarily gray, but is
comprised of multiple shades of a single color (e.g. Red).
6.1.11 Thermal Palette
A 16 color palette heat scale starting with black, then red, yellow and white.
60
GENESIS Utilities - User’s Manual
Chapter 6 Spectrum Utilities – Imaging Data
6.1.12 Pseudo Palette
A 16 color palette containing a wider separation of colors of the rainbow.
6.1.13 User Palette
A mode used to save, edit, print and view 64 colors you wish to use within a single palette
(*.pal) file. Click on the User Palette button to display the dialog to adjust the color palette.
For some default settings there are 12 Palette files supplied on each system. They are saved
in the c:\edax32\utl folder and end with the file extension (.pal). They are Red, Green,
Cyan , Yellow, Blue, Magenta, Rainbow ,Thermal64, Pseudo, AE, AE2 and 10Scale.
File - Open : Reads in a *.PAL palette file from disk.
File - Save : Saves a *.PAL palette file to disk
Print - Outputs the current palette RGB values and colors to the printer
Exit - Closes window, and saves the current palette to c:\edax32\utl\default.pal
Left click on the gradient image to select a color.
Right click on the gradient image to save this color into the palette at the current index
The palette is always composed of 64 colors. {@ TRUE Color }
UPDATE button : Copies the current color into the current index
Color Ramp : Used to build up a sequence of color entries. Clicking on “First Color” sets
the starting point of a ramp and “Last Color” will do a linear fill of the range.
GENESIS Utilities - User’s Manual
61
Chapter 6 Spectrum Utilities – Imaging Data
62
GENESIS Utilities - User’s Manual
Chapter 6 Spectrum Utilities – Imaging Data
6.1.14 Data Scaling :
The intensity data scaling has 3 modes of operation.
Default : Where the intensity data is displayed as it was collected.
AutoScale : Where all the maps that are selected are displayed relative to the maximum
intensity map.
Manual : Where you define the Set User Maximum Intensity values for the maps.
The Data Min/Max is the acquired range of the data. You can only input the User-Max
value when you select the Manual (dropdown) mode. Directly above this dropdown is the
type of data you are displaying. This can be Image, ROI, Net, or Wt%,
Manual Data Scaling is only possible if you have selected
on the Setup Page – “Vertical Image Palette”, and you
must use the “User Palette” mode.
GENESIS Utilities - User’s Manual
63
Chapter 6 Spectrum Utilities – Imaging Data
6.1.15 Creating Bitmap Images with Parameter’s Annotation
Clicking on the
button allows you to save all the selected images to a new subfolder
named “Annotate”. This assumes that you have checked the following options on, in the
main applications menu’s “Setup Dialog”. As you can see you can select many possible
combinations of parameters. The output image is always 512x400 pixels in size , at true
color. The output file can either be a BMP file or a JPEG file. The example below was
created while the Thermal64 palette was selected.
64
GENESIS Utilities - User’s Manual
Chapter 6 Spectrum Utilities – Imaging Data
Clicking the “Preview” button allows you to quickly see what the map output will look like
in the BMP file or the Word Report. This example is using a Wt% x-ray map with Vertical
Image Palette and the 10Scale.pal supplied user palette file.
This palette consists of 10 distinct colors.
Clicking on the preview window area will automatically erase it.
GENESIS Utilities - User’s Manual
65
Chapter 6 Spectrum Utilities – Imaging Data
6.1.16 Converting Bitmap Images to ASCII CSV Files
After you have read in the Bitmap files you wish, there is a menu function “Convert BMP to
CSV”. Clicking this function will output a CSV file for each of the highlighted filenames. A
warning message will be displayed for larger size images (256 & up), just to warn you that
Microsoft Excel will only support 256 columns of information. Most of the pertinent
parameters saved in the *.ipr (Image Parameters File) are attached to the header of this file.
66
GENESIS Utilities - User’s Manual
Chapter 6 Spectrum Utilities – Imaging Data
6.2 RGB Mixer
A tab used for mixing of 2 or 3 images, using 3 possible colors, red , green and blue. The
resultant image is displayed and saved in 24 bit color mode, and can produce vivid colors,
and interesting shadings that aren’t possible to see using color pixel substitution modes of
other packages.
Select a filename from the list, select a color button (Red, Blue, Green), repeat for other
images, and then select “Start Mixing” to produce a mixed image.
View : Displays the mixed image in a full image mode to make small features easier to see.
These true bitmap images can be saved to disk , using the file –save menu item.
After loading each image, you can use the Intensity control next the selection button to
increase or decrease the images intensity before mixing.
As a default this utility works using standard EDAX image matrices, like 64x50 , 128x100
etc… , but you can also use the size option button
GENESIS Utilities - User’s Manual
located below the info-text box
67
Chapter 6 Spectrum Utilities – Imaging Data
located in the top right of the window to allow you to input the pixel resolution of the bitmap
file you are trying to color merge, for example 200x200 pixel size.
Intensity Scaling : A dropdown list selection of how intense you want that color. There are
predefined values, 50,100,150 or you can type in any number and press enter.
Clicking on the “View” button will display the single full RGB image, as seen here below.
68
GENESIS Utilities - User’s Manual
Chapter 6 Spectrum Utilities – Imaging Data
6.2.1 Selecting the “White Image & RGB Mode”.
Make your 2 or 3 element selections, then enable this checkbox option and pick the Image
file to use, and then click the “Start Mixing” button. Using this mode you can mix x-ray
data with the Electron image collected and can produce images with superior details, because
the image will be composed of topographical data and x-ray components.
GENESIS Utilities - User’s Manual
69
Chapter 6 Spectrum Utilities – Imaging Data
6.2.2 Selecting the “White Image & Pseudo Color Overlay”.
If you wish to mix pseudo color images and electron images both checkboxes must be
selected. This will allow you to mix multi-color image overlays with the electron images or
PCA maps and electron images. The example below is a PCA Map. You must place the
pseudo color image only in the bottom left most image cell. Once you select the checkbox’s
you will see the button name change to “Select Pseudo”. Cick “Start Mixing” when you
have defined both images.
70
GENESIS Utilities - User’s Manual
Chapter 6 Spectrum Utilities – Imaging Data
6.3 X-ray Map / Image Merger
A tab used to merge multiple “Bitmap-Only” files into a single file. Multiple images
can be collected by several EDAX software packages and using this mode can stitch
all them into 1 file.
Mapping Data can be merged from 4 distinct software modules.
Genesis Maps/Line Tab ,
Genesis Particles Analysis /GSR for images only.
Multipoint – X-ray Spectrum Maps,
Eagle Vision
At the top of the window is the current path and filename selected, this can be changed using
the File – Open menu item. Below that there are 2 merging modes possible. IMG or X-ray.
For Particle Analysis you must use the “IMG Hi-Res” button.
For imaging, you can use IMG Hi-Rez if you are trying to mix only electron
Images. Use “X-ray & Img Merge” , if you are trying to mix x-ray bitmap data.
GENESIS Utilities - User’s Manual
71
Chapter 6 Spectrum Utilities – Imaging Data
If you select Particle Analysis merging, there is an option displayed next to this selection to
invert the X-axis field orientation. This may be necessary to correct for an orientation
problem in the collected data.
Below these selections, the image resolution is displayed and the total number of fields
found. YOU, must input the number of X and Y Axis fields into the 2 white input boxes
below the image resolution.
Clicking on the merge buttons will place a single merged BMP file into a new folder
“\ MapMerger” in the current working folder. You can change the \MapMerger folder
name to whatever you like, so you can create several different builds in 1 folder.
When you are merging x-ray map data you can select a “Intensity Scaling - Normalization
Boost Percentage.” If the x-ray maps don’t have enough contrast this will make the map
data easier to see.
Here below is an example of the display after merging 2x3 fields. You can see at the bottom
of the image area the path / filename and maximum intensity for the data.
72
GENESIS Utilities - User’s Manual
Chapter 6 Spectrum Utilities – Imaging Data
6.3.1 Bitmap Folder Orientation
Sometimes with Particle Analysis datasets, the stage X/Y orientation does not match the
actual field data collected. For this reason you can select to invert the X, Y or X&Y scan
data fields, so that the data can be correctly merged.
6.3.2 Example Merged Output Examples
Simple merge Bitmap example of 6 - 256x200 x-ray maps.
GENESIS Utilities - User’s Manual
73
Chapter 6 Spectrum Utilities – Imaging Data
Multi Field X-ray Map Merge – Large Area of 272 Fields
Signal : Backscatter Detector.
74
GENESIS Utilities - User’s Manual
Chapter 6 Spectrum Utilities – Imaging Data
The “SPD” data merge mode currently is now supported in V5.1. X-ray map data can only
be built using ROI windows. Net or concentration maps are not supported. Using SPD
mode will give the best field-field balance of intensities.
This enables SPD mode.
When you use this mode the following window will be displayed when you click on the Xray & Image merge button, as a reminder of the elements saved in the spectrum file saved
with the map.
New in V5.2 you can use ROI Data or NET Data. Select this by the “SPD Output Data
Type”. In the future Wt% mode will also be possible. When building maps in SPD mode
there is also now a *.txt file generated so can easily read the results of the map generated.
Note : The Elements button selection above in the V5.20 release is not functional.
GENESIS Utilities - User’s Manual
75
Chapter 6 Spectrum Utilities – Imaging Data
Selecting to rebuild the maps in ROI mode will display this window.
Selecting to rebuild the maps in NET mode will display this window.
76
GENESIS Utilities - User’s Manual
Chapter 6 Spectrum Utilities – Imaging Data
All data is first read from all the SPD files and then a list of intensities is generated.
The image on the right side is an example of the even intensity balance between 2 vertically
oriented fields that were merged.
In SPD – NET Mode, after the scan is scanned the Minimum and Maximum intensity values
are displayed.
GENESIS Utilities - User’s Manual
77
Chapter 7 CutePDF Writer
7 CUTEPDF Writer
Although this is not a Genesis utility developed by EDAX, this PDF utility is provided
on all Genesis V4.5 or later CD’s. On Genesis V5.1 or later, the 2 installer files are
also copied to the folder : “C:\edax32\Genesis” for convenience.
The EDAX Genesis media has included on it a freeware PDF writer program that
can be used in place of your standard printer driver. So anything (Single Page
Output) you want to send to the printer can instead be sent to a PDF file.
Installation Requirements
Supports Microsoft Windows 98/ ME/ 2000/ XP/ 2003.
Requires PS2PDF converter such as Ghostscript (recommended).
Listed here below is the PDF writers webpage address is you wish to find out more
about enhanced versions of their products.
http://www.cutepdf.com/products/cutepdf/Writer.asp
Create PDF documents on the fly — for Free!
Portable Document Format (PDF) is the de facto standard for the secure and reliable
distribution and exchange of electronic documents and forms around the world.
CutePDF Writer (formerly CutePDF Printer) is the free version of commercial PDF
creation software. CutePDF Writer installs itself as a "printer subsystem". This
enables virtually any Windows applications (must be able to print) to create
professional quality PDF documents - with just a push of a button!
FREE for personal and commercial use! No watermarks! No Popup Web Ads!
Thanks to :
========================================================
Acro Software Inc.
102 Kentucky Drive
Yorktown, VA 23693 U.S.A.
Voice*/Fax#: (+1) 443-494-0019
Web Address : http://www.cutepdf.com/Products/CutePDF/writer.asp
~ for supplying a "freeware" edition of software to create PDF files with using the same
print function you now use from any of the applications on your computer.
78
GENESIS Utilities - User’s Manual
Chapter 7 CutePDF Writer
The 2 Files needed from the Genesis CD are located in the
"Cd\ V5XXGen\ Manuals\ Disk1" folder.
Installation files required :
1) Converter.exe - Installation of Postscript Print Engine. (Run this 1st)
2) CuteWriter.exe - Installation of Cute PDF writer.
(Run this 2nd)
Then in the windows Control-Panels Printer section - select the "CutePDF Writer" as the
default printer.
Optional Installation file for Multiple Page PDF Support :
CutePDFEvl.exE - Installation for Evaluation version of Advanced PDF Writing tool (Opt)
There may be a problem if you install this & Cutewriter.exe together.
GENESIS Utilities - User’s Manual
79
Chapter 7 CutePDF Writer
When you send something to this printer device the following window will be displayed
where you can select the name of the PDF file you wish to save.
Example PDF file output from the Maps/Line Tab of Genesis.
80
GENESIS Utilities - User’s Manual