1
REV. 1.1
2009, 23rd March
HD2030
ENGLISH
The quality level of our instruments is the result of a continuous product development. This can lead to
differences between what is written in this manual and the tool that you purchased. We can not completely
rule out errors in the manual, we apologize for this inconvenient.
The data, pictures and descriptions, contained in this document, can not be legally enforced. We reserve the
right to make changes and corrections without notice.
Vibration Analyzer
HD2030
-
2
-
CONNECTORS AND KEYBOARD
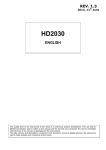
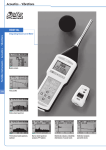
The tool is endowed with keyboard with 13 keys, six connectors on the top and three connectors on the bottom. On the top there is also the memory card slot.
With reference to the figure at page 2 there are:
1
2
3
4
5
6
7
8
9
10
11
12
13
14
15
16
17
18
19
20
21
22
23
24
25
26
Slot for SD memory card with a maximum size of 2GB.
4 poles LEMO-B type connector for the connection of a triaxial or monoaxial accelerometer with
integrated electronics (type IEPE or compatible).
6 poles LEMO-B type connector for the analog outputs (LINE) of the 4 accelerometric channels.
LEFT arrow key on the keypad: in the graphic mode it moves left the cursor or the two active cursors (blinking). In VLM mode it allows to scroll the VLM_1, …, VLM_4 screens. In the spectrum mode,
it allows to switch from acceleration viewing to speed and displacement viewings.
CURSOR key on the keypad: in graphic mode it allows to select one of the two cursors or both of
them. Holding pressed the CURSOR key for at least 2 seconds when the third-octave spectrum is
displayed, the limit acceleration curve tracking is activated.
HOLD key: it temporarily stops the display update.
MENU key: it allows to access the configuration menu and the programs list. With the same key, the
menu is exited to go back to the measure mode.
REC (recording) key: in combination with START / STOP / RESET, it activates the continuous data
recording in the memory. If it is hold pressed for at least 2 seconds, it is possible to memorize what
it is displayed as single record or to start the vocal recording.
PAUSE/CONTINUE key: to put in pause mode the integrated measures. From PAUSE mode, press
the same key to start again the integrated measures. In PAUSE mode, the measures are reset if the
START / STOP / RESET key is pressed.
UP arrow key: in menu mode, it selects the previous row or increases the selected parameter. In
VLM screen, it adjusts the boundaries of the horizontal bar. In graphical mode it decreases the initial
and final levels of the vertical scale; in this way, the graph is moved upward.
LEFT arrow key: in menu mode, it is used to edit the parameters with attribute. In VLM screen, it
changes the measure unit. In graphic mode, it compresses the vertical scale.
MiniDin type connector for RS232C serial port. For the connection to a PC RS232 port or to the
HD40.1 printer, it is necessary to use the adequate null-modem serial cable (HD2110CSNM code),
provided with a D-sub 9 poles connector.
Male connector for external power supply (∅ 5.5mm-2.1mm socket). It requires a
9…12Vdc/300mA power supply. The power supply positive pole must be connected to the central pin.
USB connector type B to connect the vibration analyzer to the USB port of a PC using a standard
USB cable with type A and B connectors (CP22 code).
DOWN arrow key: in menu mode, it selects the subsequent row or decreases the selected parameter. In VLM screen, it changes the limits of the horizontal bar. In graphic mode, it increases the initial
and final levels of the vertical scale; in this way, the graph is moved downward.
RIGHT arrow key: in menu mode, it is used to edit the parameters with attribute. In graphic mode,
it expands the vertical scale. In the VLM screen, it changes the measure unit.
ENTER key: it confirms the insertion of the data or the modification of a parameter.
START/STOP/RESET key: if pressed in STOP mode, it starts the measurements (RUN mode). In
RUN mode, it stops the measurements. If pressed in PAUSE mode, it resets the values of the integrated measures like Aeq, MAX/MIN levels, etc ...
CHN key: it selects the four measuring channels CH1, ..., CH4 (circular scrolling).
MODE key: it selects in a circular sequence the different instrument visualizing modes: VLM, timing
profile, octave or third-octave spectra, distribution of probability and percentile levels.
ON/OFF key: to turn on and shutdown the instrument.
RIGHT arrow key on keypad: it moves right the cursor or the two active cursors (blinking). In VLM
mode, it allows to scroll the VLM_1, …, VLM_4 screens. In the spectrum mode, it allows to switch
from acceleration viewing to speed and displacement viewings.
4 poles LEMO-B type connector for the connection of a monoaxial accelerometer with an integrated electronics (type IEPE or compatible).
3.5 mm jack connector for the connection of a microphone for vocal recordings.
4 poles LEMO-00 type connector for the trigger output.
3.5 mm jack for the connection of headphones.
-
3
-
INSTRUMENT OVERVIEW
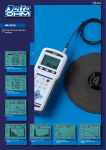
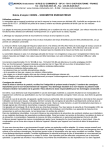
Block Diagram of HD2030
Channels
XYZ
Channel
E
Exit
LINE
Screen
Keyboard
Memory card
Flash Memory
RS232 Port
USB Port
I/O Trigger
Block Diagram of the tool
The block diagram represents the main elements of the HD2030 vibration analyzer.
Measure channels
HD2030 has four input channels polarized with direct current at 25V, It is possible to
connect accelerometers with an amplifying integrated electronics IEPE (or similar) type that
needs a maximum current of 2mA. The accelerometer connected to the RIGHT input is
triaxial type, the one connected to the LEFT input is monoaxial type.
The amplified electrical signal of the four channels is sent to the LINE output.
The instrument
The amplified signal of the four channels is converted into digital samples through as
many 25-bit A/D converters and digitally elaborated by two DSP.
The weighted levels and the related spectra of each channel are then transferred from
the DSP to the microprocessor that manages the display and the storage.
The microprocessor supervises all the instrument processes: the management of the calibration, the Flash memory and the memory card, the display, the keyboard and the serial
multi-standard RS232C/USB interface.
-
4
-
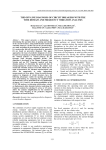
How to connect the accelerometers to the analyzer
The following diagram illustrates the different parts necessary to connect the accelerometers to
the HD2030. The left input is monoaxial, the right input is triaxial.
-
5
-
INTRODUCTION
The HD2030 is a portable vibration analyzer able to perform spectral and statistical
analysis. The instrument can supply all the measurement parameters required by the current
normative concerning the operators protection from the risk connected with the vibrations and is able to measure in hand-arm and whole body modes. It is also possible to
determine the vibrations transmitted to a person through the buildings.
The instrument has been designed mixing the easy to use concept with the maximum
flexibility and the possibility to update the instrument with the evolving normatives on vibrations. The firmware can be updated directly by the user through the supplied Noise Studio
software.
The HD2030 complies with the specifications of ISO 8041 (2005) and ISO 5349-1 (2001
- vibrations transmitted to the hand-arm system) and ISO 2631-1,2 and 4 (1997 – vibrations
transmitted to the whole body).
The octave and third-octave filters comply with the class 1 specifications of IEC 61260.
The HD2030 is a vibration analyzer suitable for the following applications:
• Evaluation of the exposure of operators to the risk connected with the vibrations transmitted to the hand-arm system through vibrating tools or items subjected to vibrations
or impacts;
• Evaluation of the operator exposure to the risk connected with vibrations transmitted to
the whole body through the use of movement or transportation ways;
• Evaluation of the operator exposure to the risk connected with vibrations transmitted to
the whole body by buildings subjected to vibrations or impacts;
• Octave or third-octave bands spectral analysis;
• Statistical analysis with calculation of the percentile levels from L1 to L99;
• Attenuation of vibrations and reclamations.
The HD2030 analyzer simultaneously acquires the acceleration value in 4 channels
and calculates, in parallel for all channels, both the weighted acceleration values and the
octave or third-octave bands spectra. In addition to the instant and average acceleration
values, the analyzer also elaborates peak levels, vibration dose (VDV) and crest factors.
The frequency weighting can be chosen freely according to the specific application.
The possibility to connect any type of accelerometer with integrated electronics (type
IEPE or compatible), both triaxial and monoaxial, ensures the maximum ease of use and reduces the possibility of making mistakes or taking measures affected by electromagnetic
interference or noise. The acquisition of the acceleration in 4 channels allows, for example, to
make objective evaluation of the vibrations transmitted by a transportation way through to the
driving seat or to evaluate, during the design and the production verification, the effectiveness
of damping introduced by the suspension and by the absorbent material of the seat itself.
A versatile data logging function memorizes, both in the 8MB internal memory and in
the memory card (SD up to 2GB), multiple profiles and spectra. Then, if desired, it is possible
to add to the profiles the accelerometers signals recording directly the digital samples. When
analyzing the memorized data, it is then possible to examine the signals provided by the accelerometers and calculate additional parameters or verify the absence of source of errors such
as those due to the DC-shift phenomenon. Each recording can be associated with a vocal
comment. Using the available audio channel, it is possible to record an audio signal up to one
hour, as a further opportunity to document the measures.
The performed recordings can be reviewed using the provided "Browser" program of the
HD2030 analyzer. The vocal comments associated with the recordings can be listened using
the appropriate headphones output.
-
6
-
Simultaneously to the acquisition of the profiles, it is performed the octave or thirdoctave bands real time spectral analysis. The vibration analyzer calculates the spectrum of
the sound signal every second and integrates it linearly up to 99 hours. It is also possible to
associate with the spectrum a frequency weighted measurement parameter whose value is calculated from the acceleration values of each octave or third-octave spectrum band. In addition
to the acceleration values for each band of the spectrum, it is possible to display the speed or
displacement value.
As statistical analyzer, the HD2030 calculates the probability distribution of a
measurement parameter at choice and analyzes it in classes of 1dB. In addition to the chart of
probability distribution, it is also supplied the graph with percentile levels from L1 to L99.
The LINE type not weighted analog outputs allows to record, for subsequent analysis,
the accelerometers signal on a tape or directly in a PC with an acquisition board.
The calibration can be done using the accelerometers calibration data or using a vibrations generator able to produce a known and stable acceleration. A reserved and protected
area in the permanent memory is used to record the last 120 calibrations performed. The supplied Noise Studio interface software allows to control the instrument and accelerometers and
to document the measurements by downloading automatically the register file of the instrument calibrations.
In order to easily carry out the different measurements on the field, in the HD2030 it is
possible to store up to 10 customizable and editable setups, even through the Noise Studio software. A title is associated with each setup in order to easily choose the desired one.
Considering that in order to measure in every possible situation it is necessary to use different types of accelerometers, up to 9 different sensor configurations both for the right
channel (triaxial) and for the left channel (monoaxial) can be selected based on the requirements. The sensors calibrations and configurations files are associated with the analyzer
setups, so that, by choosing one of the stored setups, the sensors to be connected to the input
channels are indicated and the last associated calibration values are automatically uploaded.
To simplify the reading of the data on the display, it is possible to disable one of the two
inputs or the single measurement channel.
The check of the vibration analyzer functionality can be done directly by the user, in the
field, thanks to a diagnostic program.
HD2030 can be completely controlled by a PC through the RS232 and USB serial interfaces, using an adequate communication protocol.
The Noise Studio interface software allows to download and visualize the data memorized in the instrument, to handle the files related to setups, calibrations and configurations.
With the software it is possible to load in the analyzer up to 10 different setups, chosen among
the available ones. The file related to calibrations is downloaded at every connection and it is
saved together with the measurement data. The different sensors configurations can be programmed through the PC, both inserting manually the accelerometers data and also using the
proper CD-ROM associated with the accelerometers that can be supplied by Delta Ohm together with the instrument.
The HD2030 analyzer is able to perform all the measurements required by the law about
the protection of operators from the risk of exposure to mechanical vibrations (Lgs. Decree
19th August 2005 N.187).
The choice to make hand-arm (HA) or whole body (WB and BV) measurements modifies
the extension of the spectral analysis: while for the hand-arm measurements the frequency
range is from 3.15Hz to 3.15kHz (from 4Hz to 2kHz for the octave bands spectrum), for the
measurements on the whole body the range of the central frequencies is shifted toward the
low frequencies, from 0.315Hz to 315Hz (from 0.5Hz to 250Hz for the octave bands spectrum).
-
7
-
DESCRIPTION OF DISPLAY MODES
The acceleration values and the calculations made by the HD2030 analyzer are presented
in 5 different screens. The instrument analyzes simultaneously the acceleration signals on 4
axis associated with four measurement channels (CH1,…, CH4.). It is possible, in each screen,
to choose the channel to display by simply pressing the CHN key.
When the instrument is switched on, it briefly shows the Delta Ohm logo and the program version. Then it is requested the selection of the configuration for the sensors connected
to the two inputs: first the right triaxial input and than the left monoaxial one.
RIGHT
PROD:
MOD:
SER. NUM:
TYPE:
SENS:
RANGE:
SEL.
firm.
CONFIG. #02
DELTA OHM
ACC_TRI
123456
ACC TRI
10mV/g CAL
500 gpk
PREV.
NEXT.
For both inputs, press PREV or NEXT to scroll the memorized sensor list, SEL to con-
Then, the instrument enters the VLM (Vibration Level Meter) mode, displaying in numerical form 3 instant or integrated measurement parameters.
The selection of the #00 (zero) configuration disables the corresponding input: if the
right input is disabled, CH1, CH2 and CH3 channels do not appear. If it is disables the left input, the CH4 channel does not appear.
If there is an external memory card, after the initial screen, the configuration files are
loaded and the following screen appears:
MC INSTALLED
AND READY TO USE
Size:
500MB
ESC
RD
RD/WR
Press RD/WR to enable all the reading and writing functions and continue with the selection of the configurations.
Now the instrument is ready for the use (for the details about the sensors setup, see the
SENSORS SETUP program description).
-
8
-
The possible screen modes are:
• VLM (Vibration Level Meter): divided into four screens with three measurement parameters each. The values displayed in numerical form are updated every second.
o VLM_1: 3 profiles of instant or integrated measurement parameters calculated on
each of the four channels;
o VLM_2: 3 profiles of instant or integrated measurement parameters calculated on
the vector built with the data of the first three channels (RIGHT input);
o VLM_3: 3 parameters integrated in all the measurement time and calculated on
each of the four channels;
o VLM_4: 3 parameters integrated on all the measurement time and calculated on
the vector built with the data of the first three channels (RIGHT input).
• PROFILE: graphical form profile of a chosen parameter, related to the acceleration on
each channel calculated at programmable intervals from 1s to one hour. The last 100
values of the chosen parameter are visualized.
• SPECTRUM: graph of the octave or third-octave bands spectrum graphic, related to the
acceleration on each channel. A wide band parameter, calculated from the measured
spectra, is associated with the spectrum. In addition to the accelerations, it is possible to
visualize the speeds or the displacements, making a single or double integration on the
spectrum. The spectrum can be visualized in multi-spectrum mode (MLT: 1 spectrum per
second) or in averaged spectrum (AVR) where the spectrum is linearly integrated in all
the measurement time.
• PROBABILITY: graph of the probability distribution of the parameter visualized in the
PROFILE screen for each channel. The values are analyzed in classes of 1Db.
• PERCENTILES: graph of percentile levels related to the parameter visualized in the
PROFILE screen for each channel.
The transition from one screen to the next one can be made at any time by pressing the
MODE key. At start-up, after the selection of the inputs configuration, the instrument displays
the VLM screen.
Some indications appear in all the modes, they are:
The indicator of the acquisition status,
The overload indicator,
The indicator of the remaining batteries charge.
Current Overload
Overload memory
Subfield memory
Current subfield
RUN
PAUSE
REC
STOP
Hold
Print
Replay
The first symbol in the top left corner of the display indicates the acquisition status
of the vibration analyzer.
RUN: the instrument is acquiring.
PAUSE: the calculation of the integrated measures and the eventual measures recording are
paused. The instant parameters continue to be measured and visualized.
REC: The instrument is acquiring and recording.
-
9
-
STOP: the instrument does not perform any measurement.
H (HOLD): the calculation of the integrated measurements has come to the end of the integration interval or the HOLD key was pressed.
P (Print): the printing of the current data is running.
R (Replay): it appears (blinking) when the “BROWSER” program is used to visualize a file
saved in the instrument memory.
Immediately to the right of the symbol indicating the acquisition mode, there is the symbol indicating the possible overload. An arrow pointing up indicates that the input level has
exceeded the maximum level measurable, a down arrow indicates that the input level is below the minimum according to the selected gain.
The maximum measurable level in the different settings of the measurement range selector is indicated in the technical specifications (see the chapter "TECHNICAL
SPECIFICATIONS").
An internally empty arrow reminds that an overload occurred, while a full arrow indicates
that the signal is currently exceeding the limit.
To the right of the overload indicator it is displayed the integration time Tint of the instrument, which is programmable from 1s to 99h. When the integration mode is set to
multiple, the "Tint" symbol in the VLM screen blinks. If Tint = 0, the integration is becomes
continue.
In the upper right corner there is the battery symbol. The batteries discharge appears
as a gradual emptying of the symbol. When the remaining working time of the instrument is
about 10%, which is roughly correspondent to 30 minutes in the continuous acquisition, the
battery symbol blinks. A protective device prevents the instrument from taking measurements
with insufficient charge level and automatically shuts the instrument off when the charge level
is reduced to a minimum.
The charge level of the batteries, expressed in percentage, is visible in the menu main
screen, that can be accessed pressing the MENU key once. Press the MENU key again to return
to the measurement screen.
For details, see the chapter "REPORTING OF LOW BATTERIES AND REPLACEMENT OF
BATTERIES."
Pressing the ENTER key, the parameters related to the visualized screen can be selected
in sequence. While the selected parameter is blinking, it is possible to change it pressing the
UP and DOWN arrow keys. Pressing ENTER, or automatically after about 10s, the parameter is
confirmed and the selection mode is exited.
In graphic visualization mode it is possible to change the parameters of the vertical scale
using the UP, DOWN, LEFT and RIGHT arrow keys: the LEFT and RIGHT keys compress and
expand the vertical scale respectively, the UP and DOWN keys decrease and increase the initial
and final levels of the vertical scale; in this way the graphic is moved upwards and downwards
respectively.
-
10
-
VLM SCREEN
Acquisition time
Integration Interval
Minimum Level
Maximum Level
Visualized channel
Ponderation
Bar indicating the
Instant level
Visualized parameters
The VLM screens shows, in numerical form, three frequency weighted parameters related
to each of the four measurement channels or to the acceleration vector calculated with the
data of the first three channels. It is possible to scroll in sequence the screens using the
right and left cursor keys.
The horizontal bar visualizes the instant levels of the four measurement channels expressed in dB.
VLM_1 and VLM_2
The first two screens VLM_1 and VLM_2 present instant and integrated parameters
that are acquired, and in case memorized, as a profile form with 1 second acquisition interval or integrated with intervals programmable from 10s to 1 hour. In the VLM_2 screen are
visualized the parameters related to the channels of the vector acceleration sum (CHΣ) and
maximum (CHM). The visualized measurement parameters can be set entering the
menu Settings >> Vibrometer.
VLM_3 and VLM_4
The last two screens VLM_3 e VLM_4 present global parameters integrated in all the
measurement period. It is possible to automatically memorize the value of these parameters at the end of each measurement session. In the VLM_4 screen are visualized the
parameters related to the channels of the vector acceleration sum (CHΣ) and maximum
(CHM). These measurement parameters can be set entering the menu Settings >>
Recording >>Global.
To change the measurement unit without entering the instrument menu, it is sufficient to use the RIGHT and LEFT arrow keys. The measurement units are dB, m/s2, cm/s2,
ft/s2, in/s2, g. The measurement unit selected is unique and it is applied to all the visualized
parameters.
The CHN key allows to change the visualized channel. The measurement channels of single axis acceleration are four (CH1,…, CH4) while the measurement channels of the vector
acceleration are two: the “sum” vector (CHΣ) and the “maximum” vector (GHM), both calculated with the data of the first three measurement channels (RIGHT input).
The “sum” vector is defined by the relation:
a vSOMMA =
(C1* a ) + (C 2 * a ) + (C 3 * a )
ch1 2
P1
ch 2 2
P2
ch 3 2
P3
While the “maximum” vector is defined by the relation:
[(
) (
) (
2
2
a vMASSIMO = max C1 * a Pch11 , C 2 * a Pch22 , C 3 * a Pch33
-
11
-
)]
2
Where:
•
C1, C2 and C3 are the multiplying coefficients for each channel that can be set through
the menu Settings>> General>> Measures>> Coeff.1, Coeff.2 and Coeff.3
•
ach1P1, ach2P2, ach3P3 are pondered acceleration found on each of the three channels. The
frequency ponderations are set in the menu Settings>> General>> Measures>>
Pond.1, Pond.2 and Pond.3.
From the menu (MENU>> Settings>> General>> Measure>> Ch1-4), it is possible to
disable one or more measurement channels, for example because they are not in use.
The status of each channel is indicated in the menu with a number: 0 (zero) indicates a disabled channel, 1 indicates an active channel.
The four channels are indicated in the order CH1, CH2, CH3, CH4: in order to have all the
channels activated, the menu item must be Ch1-4=1111. To disable the CH1 channel, for
example, the menu item must be Ch1-4=0111. It is not possible to disable all the
channels at the same time.
When one or more of the channels CH1, CH2 or CH3 are disabled, the measurements related to the “sum” and “maximum” vector are not visualized on the display.
The visualized measurement parameters can be changed without entering the menu of
the instrument. Pressing the ENTER key while the instrument is in STOP mode, the directly changeable parameters can be scrolled in sequence. When the selected parameter
blinks, it is possible to modify it using the UP and DOWN arrows.
The changeable parameters are:
• Integration time (Menu >> Settings >> General >> Measures >> Integration Interval).
Settable from 1s to 99 hours (when it is set to 0 the integration is continuous). Pressing
the RIGHT arrow while the value is blinking, the multiple integration mode is selected
(Menu >> Settings >> General >> Measure >> Integration Mode). To set the single integration mode, it is sufficient to press the LEFT arrow. When the integration mode is
multiple, the symbol “Tint” blinks to indicate that the instrument will execute many integration intervals in sequence, each of them with a duration equal to the integration time
set.
• The three measurement parameters of acceleration (Menu >> Settings >> Vibrometrer) for the three parameters related to each channel, to sum vector and
maximum value associated with VLM_1 and VLM_2 screens. For VLM_3 and VLM_4
screens, the acceleration measurement parameters changeable directly, are the ones in
Menu >> Settings >> Recording >> Global.
When one of the acceleration measurement parameters is selected, the parameter symbol blinks. Pressing the UP and DOWN arrows it is possible to scroll in sequence all the
measurement parameters available.
• The frequency weighting applied to each measurement channel (Menu >> Settings >>
General >> Measure >> Pond. Ch-x with x=1,..,4). While the frequency weighting symbol blinks, it is possible to modify the weight using the UP and DOWN arrows. The
weighting can be changed only in VLM_1 and VLM_3 screens. The VLM_2 and VLM_4
screens report the abbreviation of the weightings applied to the three channels CH1, CH2
and CH3: e.g. “zch” means CH1=Fz, CH2=Fc and CH3=Wh.
-
12
-
PROFILE SCREEN
Integration Time
Integration Interval
Visualized Parameter
Maximum Level
Scale Factor
Profile
Minimum Level
Frequency Weighting
Selected Channel
Sampling Interval
This screen presents in graphic form the profile of a frequency weighted parameter related to each of the 4 measurement channels.
The values can be visualized in dB or in m/s2 (Menu >> Settings >> General >>
Measure >> Measurement Unit).
The CHN key allows to change the visualized channel.
With the LEFT and RIGHT arrow keys it is possible to change the vertical scale
of the graph while with the UP and DOWN arrow keys it is possible to choose the
reference value of the vertical scale.
It is possible to activate two cursors to read the value in two points at choice of the
graph. Pressing the CURSOR key once, the first cursor is activated, pressing the second time,
the second cursor is activated while pressing the CURSOR key the third time, both cursors are
activated in tracking mode. To place the cursors in the desired points, the arrow keys next to
the CURSOR key can be used.
Using the HOLD key, the graph updating is paused, allowing a comfortable reading of
the measured values. Press again the HOLD key to return to real time visualization.
The sampling time of the graph can be selected from 1s up to 1 hour per point.
The parameter selected for this screen is the same used for the statistical analysis (see
PROBABILITY and PERCENTILES screens) with a 1s sampling interval.
The visualized measurement parameters can be modified without entering the menu of
the instrument. Pressing the ENTER key while the instrument is in STOP mode, the directly changeable parameters can be scrolled in sequence. When the selected
parameter blinks, it is possible to modify it using the UP and DOWN arrows.
The changeable parameters are:
• The acceleration measurement parameter (Menu >> Settings >> Vibrometer >>
Profile). Pressing the UP and DOWN arrows, it is possible to scroll in sequence all the
measurement parameters available.
• The sampling interval of the measurement parameter (Menu >> Settings >> General
>> Measurement >> Sampling Profile). It can be set from 1s up to 1 hour.
• The integration interval (Menu >> Settings >> General >> Measurement >> Integration Interval). It can be set from 1s to 99 hours (when it is set to 0, the integration is
continuous).
• The frequency weighting (Menu >> Settings >> General >> Measurement >>Wh.
Ch-x with x=1,..,4). The parameter is associated with the measure channel visualized.
To modify it, use the UP and DOWN arrows.
-
13
-
SPECTRUM SCREEN
Integration Interval
Integration Time
Visualized Parameter
Octave and third octave band
spectrum
Maximum Level
Scale Factor
Level with a large band
Minimum Level
Frequency Weighting
Selected Channel
The SPECTRUM screen presents in graphic form the octave or third-octave bands spectrum related to each of the 4 measurement channels. The order of the visualized spectrum, in
octave or third-octave bands, is set entering the Menu >> Settings >> Spectrum Analyzer >>
Order.
The values can be visualized in dB or in m/s2.
The CHN key allows to change the visualized channel.
With the LEFT and RIGHT arrow keys it is possible to change the vertical scale
of the graph while with the UP and DOWN arrow keys it is possible to choose the
reference value of the vertical scale.
The spectral analysis is made both in multi-spectrum mode (MLT), where a spectrum
every second is visualized, and in average spectrum mode (AVR), where the spectrum integrated in all the measurement time is visualized.
It’s possible to associate with the octave or third-octave bands spectrum, the value of
the frequency weighted acceleration, calculated from the spectrum.
CURSORS WORKING
It is possible to activate two cursors to read the value of the visualized bands. Pressing
the CURSOR key once, the first cursor is activated, pressing the second time, the second cursor is activated while pressing the CURSOR key the third time, both cursors are activated in
tracking mode. To place the cursors in the desired points, the arrow keys next to the CURSOR
key can be used.
When the cursors function is not active, it is possible to pass from the visualization of the
acceleration for each band to the speed or displacement visualization, pressing in sequence
the left and right cursor keys.
Using the HOLD key, the graph updating is paused, simplifying the reading of the measured values. Press again the HOLD key to return to the real time visualization.
Keeping pressed the cursors activation key, the limit acceleration curve is
visualized. This curve is based on the acceleration value in the band selected with the cursor
L1 and presents for each band the limit value of the acceleration corresponding to a
displacement equal to that of the selected band.
For example, it is possible to choose as reference band with the cursor L1 the band corresponding to the dominant frequency of the spectrum and, supposing that the displacement
component at this frequency is also dominant, visualize the maximum acceleration levels on
the other bands of the spectrum that cause displacement values equal to or lower than the one
of the selected band. Eventual phenomena of DC-shift happen with acceleration values at low
frequencies with unreal associated displacements and so can be easily localized because they
-
14
-
will be associated with values of acceleration at low frequencies greater than the visualized
limit.
To disable the limit acceleration curve keep pressed the CURSOR key.
The visualized measurement parameters can be modified without entering the
menu of the instrument. Pressing the ENTER key while the instrument is in STOP mode, the
directly changeable parameters can be scrolled in sequence. When the selected parameter
blinks, it is possible to modify it using the UP and DOWN arrows.
The changeable parameters are:
• The integration interval (Menu >> Settings >> General >> Measure >> Integration
Interval). It can be set from 1s to 99 hours (when it is set to 0, the integration is continuous)
• The frequency weighting of the acceleration value associated with the spectrum
(Menu >> Settings >> Spectrum Analyzer >> Auxiliary weight). This parameter is
changeable also in measuring mode.
• The type of the visualized spectrum MLT or AVR (Menu >> Settings >> Spectrum
Analyzer >> Mode). This parameter is changeable also in measuring mode.
-
15
-
DISTRIBUTION OF PROBABILITY SCREEN
Integration Time
Visualized parameter
Weighting
Maximum Level
Scale Factor
Minimum Level
Selected channel
Probability
The PROBABILITY screen presents in graphic form the probability distribution of the
values of the parameter visualized in the PROFILE screen for each of the 4 channels.
The values can be visualized in dB or in m/s2.
The CHN key allows to change the visualized channel.
With the LEFT and RIGHT arrow keys it is possible to change the vertical scale
of the graph while with the UP and DOWN arrow keys it is possible to choose the
reference value of the vertical scale.
CURSORS WORKING
It is possible to activate two cursors to read the probability in two points at choice in
the graph or, when they are both selected, to calculate the probability to have a value between
the two cursors. Pressing the CURSOR key once, the first cursor is activated, pressing the
second time, the second cursor is activated while pressing the CURSOR key the third time,
both cursors are activated in tracking mode. To place the cursors in the desired points, the
arrow keys next to the CURSOR key can be used.
The statistical analysis is done in 1dB classes, sampling the value of the parameter
selected for the PROFILE screen once per second for each of the 4 channels.
The visualized measurement parameters can be modified without entering the
menu of the instrument. Pressing the ENTER key while the instrument is in STOP mode, the
changeable parameters can be scrolled in sequence. When the selected parameter blinks, it is
possible to modify it using the UP and DOWN arrows.
The changeable parameters are:
• The acceleration measurement parameter (Menu >> Settings >> Vibrometer >>
Profile).
• The frequency weighting (Menu >> Settings >> General >> Measurements >> Wh.
Ch-x with x=1,..,4). The parameter is associated with the visualized measurement channel. To modify it, use the UP and DOWN arrows.
-
16
-
PERCENTILES SCREEN
Integration time
Visualized parameter
Weighting
Maximum Level
Scale Factor
Minimum Level
percentile level
Selected Channel
Percentile screen presents in graphic form the percentile levels from L1 to L99 associated
with the parameter visualized in the PROFILE screen for each of the 4 channels.
The values can be visualized in dB or m/s2.
CHN key allows to change the visualized channel.
With LEFT and RIGHT arrow keys you can change the vertical scale of the
graphic while with UP and DOWN arrow keys you can chose the value in reference
with the vertical scale.
CURSORS FUNCTIONS
It is possible to activate a cursor to examine the graph. Pressing the CURSOR key, the
cursor is activated; in order to place the cursor in the desired point, the arrow keys next to the
CURSOR key can be used.
To facilitate the graph viewing, two dashed vertical bars are displayed in correspondence
of 5 and 95%.
The visualized measurement parameters can be modified without entering the
menu of the instrument. Pressing the ENTER key while the instrument is in STOP mode, the
changeable parameters can be scrolled in sequence. When the selected parameter blinks, it is
possible to modify it using the UP and DOWN arrows.
The changeable parameters are:
• The acceleration measurement parameter (Menu >> Settings >> Vibrometer >>
Profile).
• The frequency weighting (Menu >> Settings >> General >> Measurements >> Wh.
Ch-x with x=1,..,4). The parameter is associated with the visualized measurement channel. To modify it, use the UP and DOWN arrows.
-
17
-
APPLICATIONS
The HD2030 analyzer can measure vibrations in three different applications selectable
with the parameter Menu >> Settings >> General >> Measures >> Applications:
• Hand Arm (HA) for the measurements of vibrations transmitted to the hand-arm system, for example by tools through the grip.
• Whole Body (WB) for the measurements of vibrations transmitted to the whole body,
for example to a driver through the seat.
• Building Vibration (BV) for the measurement of vibrations transmitted to the whole
body by buildings.
HAND ARM
With this application, the HD2030 analyzer performs measurements in compliance with
ISO 5349 rule. The accelerometers used for this kind of measurements are usually very small
and light so not to interfere with the measure. Their weight should be lower than 10% of the
tool weight and typically lower than 30g including the weight of the grip mounting adapter.
The accelerometer sensitivity should be enough not to generate DC-shift phenomena
and, in general, equal to or lower than 10mV/g. The peak acceleration produced by certain
tools can be very high and reach the 5000g. In most practical situations it is used a miniature,
triaxial accelerometer, with sensitivity of 10mV/g and resonance frequency greater than
10kHz.
When the peak accelerations exceed repeatedly 1000g, it is necessary to use an
accelerometer for shock measurements with a sensitivity of 1mV/g and resonance frequency
greater than 50kHz. In this case even a monoaxial accelerometer is sufficient, having the care
of orientating it so to measure the acceleration along the dominant axis.
The spectral analysis is performed in the range 3.15Hz to 3150Hz. In the measurements
of the vibrations transmitted to the hand-arm system, it is useful the visualization of the limit
acceleration available in the SPECTRUM screen.
In case of doubt, it is possible to enable the direct recording of the signal provided by the
accelerometers (only with storage in memory card). The DC-shift phenomena can be easily detected analyzing the signal of the accelerometers with the Noise Studio software supplied.
WHOLE BODY
With this application, the HD2030 analyzer performs measurements in compliance with
ISO 2631 rule.
In the measurements of the vibrations transmitted by a vehicle to the driver through the
driver seat, it is used an accelerometer placed in a rubber disk in compliance with ISO 10326-1
(code HD5313M2). The accelerometer is triaxial, low profile, with a sensitivity of approximately
100mV/g and a resonance frequency greater than 1000Hz.
The acceleration peak is usually less than 100g.
The HD2030 analyzer has four measurement channels that are read simultaneously, and
allows to combine with the accelerometer for the seat, also a monoaxial accelerometer to be
mounted on the flatcar of the vehicle, just below or directly on the seat peg. Correlating the
measurements of the two accelerometers, it is possible to distinguish between the actual vibrations transmitted through the vehicle and the driver's movements, thus determining the
vibrations damping capability of the driving seat.
For the measurements of the vibrations transmitted by vibrating surfaces with which the
body is in contact, it is used a standard triaxial or monoaxial accelerometer mounted on a
heavy block to be put on the surface itself (code HD2030AC5). Also in this case, in most prac-
-
18
-
tical situations it is used an accelerometer with a sensitivity of approximately 100mV/g and a
resonance frequency greater than 1000Hz.
BUILDING VIBRATION
With this application, the HD2030 analyzer performs measurements in compliance with
ISO 2631. When measuring the vibrations transmitted by the building structure to its occupants, accelerometers with high sensitivity are used, usually mounted on a heavy block to be
put on the floor (code HD2030AC5).
The accelerometer is triaxial, with a sensitivity of at least 1V/g and a resonance frequency greater than 1000Hz. The peak acceleration is usually less than 10g.
-
19
-
MEASUREMENT MODES
The HD2030 analyzer is able to measure in two different modes, selectable with the parameter Menu >> Settings>> General>> Measures>> Integration Mode:
•
Single Integration (SING) with measurement time programmable from 1s to 99
hours, and the possibility of manual stop.
•
Multiple Integration (MULT) with manual stop of the measurement. The measurement time is divided in time intervals programmable from 10s to 1 hour.
The measurement starts pressing the START/STOP key.
At the beginning, the measurements are affected by the settling time of the accelerometers signals. To minimize the effect, after starting the measurement pressing the START/STOP
key, the instrument keeps zeroed the instant and integrated parameters until it is elapsed the
delay time, that can be set with the parameter "Menu>> Settings>> General>> Measures>>
Integration Delay", from a minimum of 1 second to a maximum of 99 seconds.
SINGLE INTEGRATION
In this mode, the instrument calculates the integrated parameters, like the
average time of acceleration for example, in the set measurement time Tint.
The measurement time is programmable from a minimum of 1 second to a maximum of
99 hours with the Menu>> Settings>> General>> Measures>> Int. Integration.
It is possible to pause the measurement by pressing the PAUSE key, and restart the
measurement by pressing the same key. While the instrument is paused it is possible to reset
all the integrated parameters by pressing the START/STOP key.
The measurement ends automatically when the set integration time expiries, or
manually by pressing the START/STOP key.
At the end of the measurement, the integrated parameters indicate the value calculated
in all the measuring period, excluding the pause intervals.
The spectral analysis, if performed in AVERAGE mode (Menu>> Settings>> spectrum
analyzer>> Mode: AVERAGE), and the statistical analysis provide respectively the average
spectrum, the probabilities and percentiles levels calculated in the measurement time.
MULTIPLE INTEGRATION
In this mode the instrument calculates the integrated parameters, like the
average acceleration for example, at regular time intervals with a set duration.
The duration Tint of each interval is set through the Menu>> Settings>> General>>
Measures>> Int. Integration, from a minimum of 10 seconds to a maximum of 1 hour.
The measure ends pressing the START/STOP key.
It is possible to pause the measurement pressing the PAUSE key, to start again the
measurement press the same key.
While the instrument is paused, it is possible to reset all the integrated parameters by
pressing the START/STOP key.
At the end of each interval, the integrated parameters, the statistical analysis and the
spectrum, when done in AVERAGE mode (Menu>> Settings >> Spectrum analyzer>> Mode:
AVERAGE), are automatically reset.
This mode of integration can be used for purposes of monitoring, for example when it is
necessary to detect the average value of acceleration every minute.
-
20
-
USE OF THE EXTERNAL MEMORY CARD
The HD2030 has an interface that handles an external memory card for storing the data,
the configuration parameters of the instrument and sensors.
The memory card, supplied with the instrument, has Delta Ohm code HD2030MC. If
cards not supplied by Delta Ohm are used, make sure they have the same read / write speed
performances.
The card must be SD-type with a maximum capacity of 2GB.
To use a new memory card, it is necessary:
1. to format it using the Noise Studio PC software.
2. to initialize it. The initialization function creates the folder where the measurement files
will be placed and copy the calibration log file (see the description of the calibration
program).
The formatting operation requires a PC equipped with a memory card reader (not supplied with the instrument). Normally all the latest laptop and desktop PC are provided with it.
If not, it is possible to use an external memory card reader connectable to a USB port.
To format a SD card, proceed as follows:
•
•
•
•
•
If the PC is without reader, connect an external SD cards reader to a PC USB port.
Start the Noise Studio software.
Press the instrument management key in Noise Studio: press the Format Memory Card key.
Select the path of the card to be formatted and press ENTER.
In the next screen make sure it is selected the parameter "File System = FAT" and press
START: the card is formatted.
• When it appears the message "Formatting completed”, press OK to confirm and CLOSE to
exit.
• Close the Noise Studio software.
• The formatting procedure is complete.
To initialize a card, proceed as follows:
Two methods are provided:
• Use of the "Initialization MC" function in the programs menu of the instrument (see the
details in the description of the programs): this feature erases the eventual data already
existing in the card.
• If the card is new and already formatted, turn on the instrument after inserting the card
into the front slot of the instrument: the initialization procedure starts automatically. At
the end of the operation, it appears the message "MC installed and ready to use."
MC INSTALLED
AND READY TO USE
Size:
500MB
ESC
RD
-
21
-
RD/WR
Press RD/WR to enable all the reading and writing functions.
Press RD alone to read the content of a card. The recording of new data is disabled: in
this way it is avoided to overwrite the files already stored in the card.
The card is ready to be used.
-
22
-
RECORDING MODES
The HD2030 is able to perform three different types of memorization:
•
Single Record. It can be manual or automatic.
•
Single Profile with a recording interval programmable from 1s to 1 hour.
•
Continuous Multi Profile, with 1s recording interval or at intervals programmable from
10s to 1 hour.
The memorizations are saved, for all the active channels, in the internal FLASH memory
of the analyzer or in the memory card, following the setting of the parameter Menu >> Settings>> General >> Input/Output >> Memory.
Each memorization is preceded by a summary screen reporting:
•
the memory where the data are going to be saved (memory card or internal Flash
memory);
•
the sequential number that identifies the block of data;
•
date and time;
•
size of the file and memory space available.
MEMORY CARD
RECORDING
Block N. 00001
2009/01/31 12:00:00
Size: 3KB
Disp: 6.7%
COMM.
ESC
SAVE
Pressing the SAVE key (right arrow on the keypad), the data are saved.
Pressing the EXIT key (left arrow of the keypad), the instrument exits without saving
and returns to measure mode.
Pressing the COMM. key (CURSOR key on the keypad), it is possible to save the data file
adding an audio commentary by connecting a microphone to the appropriate input on the front
of the instrument.
Simultaneously to the recording of the measurement parameters calculated by the
HD2030 analyzer, it is also possible to memorize the signals of the accelerometers, setting the
parameter Menu >> Settings >> Recording>> Profiles >> ADC Channels. The parameter allows to select among the memorization of all the channels of the analyzer, only one of the four
channels or the first three channels (RIGHT input). The direct recording of the ADC channels
can be activated only in the memory card and it is not available for the internal FLASH memory
of the analyzer.
Choosing the recording of a Single profile or Continuous Multi Profile, it is available
the Auto-Store function to automatically memorize the global parameters, i.e. integrated in all the measurement time.
To activate the recording of the global parameters, it is used the parameter Menu >>
Settings >> Recording >> Global >> Auto-Store.
-
23
-
The memorized parameters are defined in the menu: Menu >> Setting >> Recording >>
Global. Together with the global parameters are also recorded the average spectrum and the
statistics.
SINGLE RECORD
In this mode it is possible to memorize in a single record, the values visualized in the
VLM, SPRECTRUM, PROBABILITY and PERCENTILES screens.
Manual Recording “Single record”
The data can be memorized manually pressing the REC key for at least two seconds.
This operation is allowed when the instrument is in STOP mode.
The first two VLM (VLM_1 and VLM_2) screens will be memorized, whose measurement
parameters are defined in Menu >> Settings>> Vibrometer.
To get the average spectrum of the acceleration in the measurement time and the
statistics, it is necessary to set the spectral analysis in AVERAGE mode (Menu >> Settings >>
Spectrum Analyzer>> Mode: AVERAGE).
Automatic Recording “Single record”
To activate the automatic recording, enable from the menu the Auto-Store parameter:
Menu >> Settings >> Recording >> Global>> Auto-Store = ON.
The display shows the activation of the Auto-Store function with the alternated blinking
of the REC and STOP symbols.
They will be recorded the two screens VLM_3 and VLM_4 (whose measurement parameters are defined in Menu >> Settings >> Recording >> Global), the spectral analysis and the
statistics.
The data are automatically recorded at the end of the set integration interval Tint or, before the Tint interval is elapsed, pressing the STOP key.
SINGLE PROFILE
This mode allows the memorization of the time profile of the measurement parameter selected for the PROFILE screen. The parameter is memorized at intervals
programmable from 1s to 1 hour.
To make a manual recording of a Single Profile set:
•
The single integration mode: Menu >>Settings >> General >> Measures>> Integration
Mode: SING
•
The sampling interval of the time profile: Menu >>Settings >> General >> Measures>>
Samp. Profile: from 1 second to 1 hour.
•
The measurement time: Menu >>Settings >> General >> Measures>> Int. Integration:
from 1 second to a maximum of 99 hours.
•
The recording mode: Menu >>Settings >> Recording >> Profiles >> Mode: PROFILE
•
The parameter whose time profile has to be acquired: Menu >>Settings >> Vibrometer
>> profile, choosing among those available.
The recording starts pressing at the same time REC and START/STOP keys, and
stops when the set measurement time Tint expires or pressing the START/STOP key.
During the acquisition it is possible to temporarily pause the instrument pressing the
PAUSE/CONTINUE key and start again the recording pressing a second time the same key.
In the recording it is also possible to add markers that will are saved together with the
profile and that can be visualized with the Noise Studio software.
There are 9 available markers, each of them with maximum 15 characters.
-
24
-
To insert a marker, press the REC key during the recording: with the UP and DOWN arrows choose one of the 9 markers and confirm with the REC key. Press the ESC key to exit
without memorizing the marker.
2008/10/15
10:00:00
MARKER
RECORDING
1
TITLE_MARKER1
ESC
It is possible to assign a name to a marker through the instrument menu (see “Menu >>
Settings>> Recording >> Profiles” in “DESCRIPTION OF MENU FUNCTIONS” chapter) or by
using the Noise Studio software.
Automatic recording of a single profile
If the Auto- Store function is active (Menu >> Settings>> Recording >> Global >>
Auto-Store = ON), the average spectrum and the statistics are also memorized together with
the global parameters.
MULTI PROFILE
This mode allows to memorize the time profile of more parameters.
Two recording modes are provided: one continuous and one at intervals, corresponding
respectively to the setting of the single and multiple integration mode (parameter Menu >>
Settings >> General >> Measures>> Integration Mode).
To perform a Multi Profile recording, set the following parameters:
• The integration mode: Menu >>Settings >> General >> Measures >> Integration Mode:
SING o MULT.
• Recording mode: Menu >>Settings >> Recording >> Profiles >> Mode: FULL
The measurement parameters that are memorized are indicated in the following table.
Parameter
MULTI PROFILE
Single Integration
Multiple Integration
VLM_1 and VLM_2 screens:
- 3 parameters single axis
- 3 parameters for sum and
maximum value vectors
SPECTRUM screen:
octave or third-octave band
spectrum
STATISTIC and PERCENTILES
screens:
statistical analysis in 1dB
classes with 1 second sampling frequency
Integration interval and calculation
X
X
X
X
---
X
1 second
Programmable from 10s to 1
hour (General >> Measures
>> Int. Integration)
with automatic reset of the
parameters at the beginning
of each interval.
-
25
-
The Multi Profile recording with single integration allows to memorize every second:
• The 3 instant or integrated parameters of the VLM_1 screen calculated for all the
measurement channels
• The 3 parameters of the VLM_2 screen calculated on the vector formed by the first three
channels (RIGHT input)
• The spectrum, in octave or third-octave bands.
The Multi Profile mode with multiple integration records, at intervals equal to the set integration time Tint (from 10 seconds to 1 hour):
• The 3 instant or integrated parameters of the VLM_1 screen calculated for all the
measurement channels
• The 3 parameters of the VLM_2 screen calculated on the vector formed by the first three
channels (RIGHT input)
• The spectrum, in octave or third-octave bands
• The statistical analysis in classes of 1dB with 1 second sampling interval.
All the measurement parameters, the spectra and the statistics are automatically reset at the
beginning of each interval.
The recording starts pressing the REC and START/STOP keys.
In the single integration mode, the acquisition stops when the set integration
time Tint is elapsed (Menu >> Settings>> General > Measures > Int. Integration) or
pressing the START/STOP key.
In the multiple integration mode, the recording must be ended manually
pressing the START/STOP key.
During the acquisition it is possible to temporarily pause the instrument pressing the
PAUSE/CONTINUE key and start again the recording pressing a second time the same key.
In the recording it is also possible to add markers that will are saved together with the
profile and that can be visualized with the Noise Studio software.
There are 9 available markers, each of them with maximum 15 characters.
To insert a marker, press the REC key during the recording: with the UP and DOWN arrows choose one of the 9 markers and confirm with the REC key. Press the ESC key to exit
without memorizing the marker.
2008/10/15
10:00:00
MARKER
RECORDING
1
TITLE_MARKER1
ESC
It is possible to assign a name to a marker through the instrument menu (see “Menu >>
Settings>> Recording >> Profiles” in “DESCRIPTION OF MENU FUNCTIONS” chapter) or by
using the Noise Studio software.
If the Auto- Store function is active (Menu >> Settings>> Recording >> Global >>
Auto-Store = ON), the average spectrum and the statistics are also memorized together with
the global parameters.
-
26
-
RECORDING OF AN AUDIO COMMENTARY
The HD2030 can be used as an audio recorder connecting an external microphone (code
HD2030AM) at the MIC input. The recording can be saved as single audio file or it can be associated with a data file as vocal commentary.
To record audio only, keep the REC key pressed for at least two seconds when the instrument is in STOP mode. The following screen appears:
WARNING !
RECORDING OF
VOICE
DATA
Press the VOICE key. The recording starts. To finish the operation, press the STOP key.
To add a vocal commentary to a data file, connect a microphone to the appropriate
MIC input on the instrument front and, when you are going to save, press the COMM (commentary) key.
MEMORY CARD
RECORDING
Block N. 00001
2009/01/31 12:00:00
Size: 3KB
Disp: 6.7%
COMM.
ESC
SAVE
To end the audio commentary recording and save the data file, press the STOP key.
The recordings can be listened directly from the instrument equipped with headphones or
through the Noise Studio software.
See the details in the Browser Program description at paragraph “4) To listen vocal commentaries”).
-
27
-
PROGRAMS DESCRIPTION
The HD2030 analyzer has several programs that are accessed by Menu>> Programs. To
start a program, select it with the UP and DOWN arrow keys and press ENTER.
The programs available are:
• Browser: it allows to examine what it is stored in the internal FLASH memory of the instrument and in the memory card. It is also possible to listen to the audio recordings and
the vocal commentaries associated with the data files using the headphones.
• Setup Management: it allows to save or load the analyzer settings. To facilitate the
choice, each setup has a title.
• Calibration: it sets the sensitivity of the accelerometers connected to the instrument,
both through manual insertion of the calibration values and through the measurement of
the acceleration produced by a vibrations generator.
• Diagnostic Check: it checks the main functions of the instrument.
• Sensors Config.: insertion and modification of the parameters of the sensors that can
be connected to the analyzer.
• Erase MC: it deletes the data in the memory card and set it for the use with the
HD2030.
BROWSER PROGRAM
The Browser Program allows to operate in the internal FLASH memory and in the external
Memory card.
To enter the Browser Program, press the MENU key: Menu >> Programs >> Browser.
If the Memory card is present, the following screen appears:
BROWSER
Choose Memory
ESC
FLASH
MC
Press the FLASH or MC keys to respectively manage the internal memory of the instrument or the memory card.
-
28
-
If there is no Memory Card, the following screen appears:
FLASH BROWSER
Batt: 80%
Mem: 75%
RET.
MODIF.
BROWSE
In the internal FLASH memory it is possible:
• to review the memorized files.
• to copy the single recording or all the files from the internal memory to the memory
card.
• to erase all the memory content. It is not provided the possibility to erase the single files
in the internal memory.
In the Memory Card it is possible:
• to review the memorized files.
• to listen to the vocal recordings.
• to erase single files contained in the Memory Card. To erase all the Memory Card content, run the program “Menu >> Programs >> Erase MC”, as described below.
Note: the deleted files in the Memory Card are still in the card memory, even if new recordings
are added; this allows an eventual recovery through the Noise Studio software supplied with
the analyzer.
To clear the Memory Card it is always possible to use the program "Format Memory
Card" in the Noise Studio software. See the chapter “USE OF THE EXTERNAL MEMORY CARD".
1) To review a file saved in the internal Flash memory
From measure mode, press in sequence the buttons: Menu>> Programs>> Browser and
select the internal Flash memory.
The following screen appears:
FLASH BROWSER
Batt: 80%
Mem: 75%
RET.
MODIF.
BROWSE
Press the BROWSE key: the display shows the characteristics of the first file in memory.
-
29
-
To scroll the memory and display the properties of the other files, press the RIGHT arrow key. After the last file is visualized, the display returns to the starting screen.
The properties of a file in the memory appear like in the following example:
BROWSER FLASH
Batt: 80%
Mem: 75%
Tipo
Tint.
N.
SING
00s
00001
2008/09/16
15:00:00
Tm:00:02:05
RET.
For each file are indicated:
• Type indicates the file type: single report (SING), single profile (PROF) or multi profile
(REP).
• Tint is the integration interval.
• N is the sequential number that identifies the file.
• Tm represents the total recording time.
To visualize the current file content, press the ENTER key: the STOP symbol alternates with the R letter (Replay).
During the replay it is possible to use the MODE key to display the different measure
modes: VLM, PROFILE, SPECTRUM, PROBABILITY, PERCENTILES.
In the same way, with the CHN key it is possible to scroll the different measurement
channels.
To stop or start again the review, use the PAUSE/CONTINUE key.
While the replay is paused, it is possible to visualize the next data pressing the START
key.
If the START key is hold pressed in pause mode, the fast replay mode is entered.
At the end the instrument enters the STOP status.
To exit from REPLAY mode, press the MENU key.
The review operation mode depends on the memorized file type (see the chapter
“RECORDING MODE”):
• “Manual single record” Recording
The file is “Single Report” type: when the ENTER key is pressed, the parameters of the
VLM_1 and VLM_2 screens are automatically loaded and displayed.
• “Automatic single record” Recording
For the recording the Auto-Store function has been enabled, the file is “Single Report”
type: When the ENTER key is pressed, the global parameters of the VLM_3 and VLM_4
screens are automatically loaded and displayed.
• “Manual Single profile” Recording
The time profile of a single parameter has been memorized. Pressing the ENTER key, the
display shows the Profile screen with the timer at 0.
-
30
-
When the START key is pressed, the profile is reviewed automatically. It is possible to
switch from a measurement channel to another one with the CHN key but there are no other
active screens because this mode records only the time profile of the four channels.
• “Automatic Single Profile” Recording
A single profile recording enabling the Auto-Store function was done. When the ENTER
key is pressed, the global parameters of the VLM_3 and VLM_4 screens are automatically
loaded and displayed. With the MODE key it is possible to scroll the spectrum, probability
and percentiles screens calculated on the global parameters: the GLOBAL indication appears at the top of the display.
Pressing the START key, the profile is reviewed automatically. It is possible to switch
from a measurement channel to another one with the CHN key.
• “Multi profile with single integration” Recording
A multi profile recording with single integration mode was done. The data file includes
the VLM_1 and VLM_2 screens and the spectrum. When the ENTER key is pressed, the
instrument goes into VLM_1 screen: at the top it appears the indication “PROFILE”.
Pressing the START/STOP key, the data replay starts. With the MODE key it is possible to
switch from a screen to another one, with the CHN key from a measurement channel to
another one.
• “Multi profile with multiple integration” Recording
A multi profile recording with multiple integration mode was done. The data file includes
the VLM_1 and VLM_2 screens, the spectrum and the statistics.
When the ENTER key is pressed, the instrument goes into VLM_1 screen: at the top appears the indication “REPORT”.
-
31
-
The “Tint” tag blinks to signal that the integration is multiple. When the START/STOP key
is pressed, the instrument displays the data related to the first integration interval and
enters the pause mode. With the MODE key it is possible to switch from a screen to another one, with the CHN key from a measurement channel to another one. While the
replay is paused, it is possible to display the following data pressing the START key.
Holding pressed the START key while in pause mode, the fast replay mode is entered.
Pressing the PAUSE/CONTINUE key, the review proceeds up to the end.
• “Multi Profile with single or multiple integration with Auto Store” Recording
The two previous modes can be integrated during the recording phase with the addition
of the auto-store function: in this case, when the ENTER key is pressed, the global parameters of the VLM_3 and VLM_4 screens, the spectrum and the statistics are
automatically loaded and displayed. With the MODE key it is possible to switch from a
screen to another one, The GLOBAL indication appears at the top of the display.
Pressing the START key, the parameters are reviewed as described in the previous two
points.
-
32
-
2) To review a file saved in the Memory Card
From measure mode, press in sequence the keys: Menu >> Programs >> Browser.
If a Memory Card is present, it appears the screen to select the memory to review: press MC to select the Memory Card.
BROWSER
Choose Memory
ESC
FLASH
MC
The following screen with the file list appears:
NAME
CAL
0001
0002
0003
MC BROWSER
DATE
2008/01/01
2008/01/31
2008/02/28
2008/03/31
RET.
CANC.
TIME
10:00
15:00
16:00
17:00
Note: the first file of the list called “CAL” is the file of sensors calibration. It is a read/write protected file, no operations are allowed on this file.
With the UP and DOWN arrow keys, select the file to be visualized and press ENTER.
The properties of the selected file are indicated:
PROPRIETIES 0001-AAD
#0003 Tipo: REP
2008/01/31 15:00:00
2008/01/31 15:05:00
Tm:00:05:00
44KB
RET.
For each file are indicated:
• The sequential number in the browser file list (“0001” in the example, next to “Properties”).
• three characters code (“AAD” in the example) with the following meaning:
o The first character identifies the recording type:
-
33
-
•
•
•
•
•
S Single type recording
A Autostore type recording
M Multi type recording
R Report type recording
V Audio file recording. In this case the second character is A.
o The second character, if present, can be A only; it identifies a vocal recording or a
file with an audio commentary attached.
o The third character, if present, can be D only; it identifies a file that includes the
ADC channels data.
# is the sequential number that identifies the file.
Type indicates the file type: if single report (SING), single profile (PROF) or multi profile
(REP). If there is also an audio commentary, the “+AUDIO” indication appears.
Date and time of file opening.
Date and tome of file closing.
Tm represents the total recording time. On one side it is indicated the file dimension.
To display the content of the current file, press the ENTER key: the STOP symbol
alternates with the R letter (Replay).
During the replay it is possible to use the MODE key to visualize the different measurement modes: VLM, PROFILE, SPECTRUM, PROBABILITY, PERCENTILES.
In the same way, with the CHN key it is possible to scroll the different measurement
channels.
For the details on how to proceed to visualize the memorized data, see the detailed
description reported in the previous point.
To exit from REPLAY mode, press the MENU key.
3) File management in the internal Flash memory
The allowed operations on the files stored in the internal memory are the copy of a file or
of the entire internal memory into the Memory Card, and the memory clear. It is not possible
to delete single files in the internal memory.
Press in sequence the keys: Menu >> Programs >> Browser.
It appears the screen:
BROWSER
Choose Memory
ESC
FLASH
MC
Press the FLASH key to access to the internal memory of the instrument.
-
34
-
FLASH BROWSER
Batt: 80%
Mem: 75%
RET.
MODIF.
BROWSE
Press the MODIF. key to enter the submenu for the management of the memorized files.
FLASH BROWSER
Batt: 80%
Mem: 75%
RET.
CANC.
COPY
With the CANC. Key all the FLASH memory content is deleted.
With the COPY key all the FLASH memory content is copied into the Memory Card.
When one of the two keys is pressed, the instrument asks to confirm the selected operation, pressing YES.
FLASH BROWSER
Batt: 80%
Mem: 75%
FLASH BROWSER
Batt: 80%
Mem: 75%
CONFIRM
MEMORY
DELETING?
CONFIRM COPY OF
FILES ON MC?
YES
NO
YES
NO
To copy a single file from the internal memory into the Memory Card, select in
sequence the keys: Menu >> Programs >> Browser.
It appears the screen:
-
35
-
BROWSER
Choose Memory
ESC
FLASH
MC
Press the FLASH key to access to the internal memory of the instrument.
FLASH BROWSER
Batt: 80%
Mem: 75%
RET.
MODIF.
BROWSE
Press BROWSE and with the UP and DOWN arrow keys select the file to copy.
FLASH BROWSER
Batt: 80%
Mem: 75%
Type
Tint.
N.
SING
00s
00001
2008/09/16
15:00:00
Tm:00:02:05
RET.
COPY
Press the COPY key and confirm the operation in the next screen.
FLASH BROWSER
Batt: 80%
Mem: 75%
CONFIRM COPY OF
SELECTED FILE ON MC?
YES
NO
Press YES to copy, NO to go back to the previous screen without copying.
-
36
-
4) To listen to the vocal commentaries
The audio commentaries can be listened again through Noise Studio Software or directly
from the HD2030 if equipped with headphones (code HD2030AM).
• Connect the headphones to the appropriate connector on the front of the instrument.
• Select in sequence the keys: Menu >> Programs >> Browser.
• Select the internal memory bank (FLASH) or the external Memory Card (MC).
• Select with the UP and DOWN arrow keys the file with the commentary and press ENTER
to load it.
• Press the COMM key to listen to the vocal commentary.
• With the << and >> arrows of the keypad it is possible to adjust the volume of the
headphones.
• Press STOP to finish in advance the listening of the commentary.
• Press RET. to go back to the main screen of the Browser.
End of the procedure.
-
37
-
SETUP MANAGEMENT PROGRAM
This program allows to choose one of the 10 available setups in the HD2030 analyzer. To
rapidly identify the desired one, to each setup is associated with a title.
The PC software Noise Studio allows to edit the setups, to save them into the PC memory
and to load into the instrument memory the ones you want to use.
Each setup is associated with a configuration for the sensors to be connected to the
RIGHT and LEFT inputs (see the Sensor Configuration Program).
Once the setup is loaded in the instrument, it is possible to manually modify any settings,
including the configuration of the sensors connected to the inputs. The new configuration can
be memorized in any of the of 10 setups.
Note: to proceed with the creation of a new setup to load in the instrument, it is necessary to
have installed in the PC the Noise Studio software.
1) How create a new setup with Noise Studio Software
Proceed in the following way:
• Connect the analyzer to the PC with the serial or USB cable.
• Start the Noise Studio software.
• Press Instrument management key in Noise Studio: start the connection with the Connect key (for details on how to connect, see the software manual).
• Press the Instrument configuration tool in Noise Studio: the software downloads the current settings of the analyzer.
• Modify the General, Channels and Sensors screens in Noise Studio according to your
needs:
o In the General screen the system, input/output and measure parameters can be
set.
o In the Channels screen the measurement variables for the different screens
(VLM, profile, spectra, global parameters), the recording modes and the trigger
can be selected.
o In the Sensors screen the accelerometers to use during the test can be
configured. Insert all the parameters and save the configurations pressing the
Save Config. Key, assigning to each configuration a number from 1 to 9 (see in
the following of this chapter the apposite program Sensors Configuration).
• Select the Predefined screen and press Save Current Settings: insert a name and a
description (optional) to identify the setup.
• Press the “Copy custom settings in the predefined setups of the instrument” key. The
just created setup is added to the setups list in the memory of the instrument and can be
selected directly from the instrument menu, without the need to connect the PC.
• To apply the current setup, push Apply All key in Noise Studio.
The setup is loaded into the instrument memory, ready to be used.
2) How to charge a new setup
To apply a setup present in the instrument memory, press in sequence the keys: MENU >>
Programs>> Setup Management.
• With the UP and DOWN arrows select the setup to apply: press ENTER to confirm.
• In the following screen, press the LOAD key to apply the settings of the new setup.
-
38
-
SETUP MANAGER
2009/01/31
12:00:00
SETUP N.01
TEST_001
2009/01/01
10:00:00
RET.
SAVE
LOAD
• The next screen visualizes the setup features of the sensor for the RIGHT input:
RIGHT
CONFIG. #02
PROD:
DELTA OHM
MOD:
ACC_TRI
SERIAL N.:
123456
TYPE:
ACC TRI
SENS:
10mV/g CAL
RANGE: 500 gpk
SEL.
PREV.
NEXT
• Press SEL to confirm, PREV or NEXT to scroll the list of the sensors that are in the
memory. Following are the setup features of the sensor for the LEFT input.
LEFT
CONFIG. #02
PROD:
DELTA OHM
MOD.:
ACC_MONO
SERIAL N.:
654321
TYPE:
ACC MON
SENS:
100mV/g CAL
RANGE: 100 gpk
SEL.
PREV.
NEXT
• Press SEL to confirm, PREV or NEXT to scroll the sensors list of the sensors that are in
the memory.
Now the instrument is ready to perform a new measurement.
3) How to save an instrument configuration in a setup
A special configuration of the instrument can be saved in one of the ten setups available
in the memory to be recalled at a second time.
Proceed as follows:
• Select through the menu the different instrument parameters, the sensors configuration,
the measurement and recording modes.
• It is possible to start from an already memorized setup, loading it in the memory as
described in the previous paragraph.
-
39
-
• Press in sequence the keys: MENU >> Programs >> Setup Management.
• With the UP and DOWN arrows, select the setup number to be assigned to the new configuration: the current configuration will be overwritten by the new one so do not select a
setup you want to keep. Press ENTER to confirm.
• It appears the screen with the name of the current setup that will be overwritten by new
one.
SETUP MANAGER
2009/01/31
12:00:00
SETUP N.07
TEST_007
2009/01/01
10:00:00
RET.
SAVE
LOAD
• Press the SAVE key.
• The screen for the insertion of the title to apply to the new setup appears:
SETUP TITLE #01
D
C
B
ANNNNNNNNNNNNNNNNNN
RET.
• With the UP and DOWN arrows, select the first character and confirm it with ENTER.
• The cursor skips to the second character.
• Repeat the selection with the UP and DOWN arrows and confirm with ENTER. Proceed in
the same way for the other characters of the title.
• Inserting a SPACE (blank) the remaining characters of the title are cancelled.
• Press RET to save.
• Press ESC to exit from the Setup Management program
4) How to modify a setup in the memory
The setups in the memory can be changed directly through the menu of the instrument
(for the change of a setup through the Noise Studio Software, see point 1 of this paragraph).
Proceed in the following way:
• Start the setup management program pressing in sequence the keys: MENU >> Programs >> Setup Management.
• Load the setup to modify following the steps indicated in point 2 if this paragraph.
• Modify the instrument configuration as desired (for example: displayed units, parameters
of the menu, recording mode,….).
• Go back to the setup management program pressing in sequence the keys MENU >>
Programs >> Setup Management. With the UP and DOWN arrows select again the setup
previously loaded and confirm with ENTER.
-
40
-
• In the following screen, press the SAVE key.
SETUP MANAGER
2009/01/31
12:00:00
SETUP N.01
TEST_001
2009/01/01
10:00:00
RET.
SAVE
LOAD
• The new settings are saved in the place of the previous ones.
• It appears the screen for the insertion of the title to apply to the updated setup:
SETUP TITLE #01
D
C
B
ANNNNNNNNNNNNNNNNNN
RET.
• If it is desired to maintain the name of the previous setup, press RET and then ESC to
exit from Setup management, otherwise, with the UP and DOWN arrows, select the first
character and confirm it with ENTER.
• The cursor skips to the second character.
• Repeat the selection with the UP and DOWN arrows and confirm with ENTER. Proceed in
the same way for the other characters of the title.
• Inserting a SPACE (blank) the remaining characters of the title are cancelled.
• Press RET to save.
• Press ESC to exit from the Setup Management program.
The setup modification procedure is completed.
CALIBRATION PROGRAM
This program calibrates the sensors connected to the HD2030 analyzer.
It is possible to manually insert the calibration parameters of the accelerometers using
the values indicated on the certificates or calibration sheets, or using a vibrations generator
specific for the calibration of the accelerometers.
The calibration parameters are saved in an apposite log file where the last 120 calibrations performed are stored. When the instrument is connected to the PC through the Noise
Studio software, this file is automatically downloaded and saved in the PC as a reference for
the documentation of the measurements performed with the instrument.
Any measurement made with the HD2030 analyzer, therefore, will be associated with a
calibration according to the date.
-
41
-
1) Calibration of a sensor through the direct insertion of the parameters
If the calibration data of the sensor are available, proceed in the following way:
• Start the calibration program of the sensors pressing in sequence the keys: MENU >>
Programs >> Calibration.
• The main screen appears:
CALIBRATION
Date: 2009/01/31 10:00
DELTA OHM
DELTA OHM
ACC_M
ACC_T
Choose the channel
ESC
LEFT
RIGHT
The indicated date refers to the last saving of the log file. On the left side are reported
the manufacturer and the name assigned to the monoaxial sensor, and on the right side the
correspondent information for the triaxial one.
• Press the LEFT Key to select the monoaxial sensor, RIGHT for the triaxial one.
The screen that resumes the current data of the selected sensor appears:
o manufacturer,
o type,
o name,
o serial number,
o sensitivity expressed in mV/g.
CALIBRATION
DELTA OHM
ACC_TRI
ACC_T
123456
SENS:
10mV/g
Calibration Type
ESC
SENS.
MEAS.
• To insert manually the sensitivity, press the SENS key.
• If the sensor is triaxial type, a sensitivity for each axis must be inserted: with the UP and
DOWN arrows select the first axis and confirm with ENTER.
-
42
-
CALIBRATION
DELTA OHM
ACC_TRI
ACC_T
123456
SENS:
10mV/g Axis: 1
Calibration Type
ESC
SENS.
MEAS.
• The following screen appears:
CALIBRATION
DELTA OHM
ACC_TRI
ACC_T
123456
10.15mV/g
RET.
Sensitivity +-
• With the UP and DOWN arrows modify the proposed value and press ENTER. At the following request of confirmation, press again ENTER.
CALIBRATION
DELTA OHM
ACC_TRI
ACC_T
123456
SENS:
10mV/g Axis: 1
Calibration Type
ESC
SENS.
MEAS.
• Select the other axes and proceed in the same way.
• If the sensor is monoaxial, the sensitivity is unique: only one value must be inserted.
CALIBRATION
DELTA OHM
ACC_MON
ACC_M
654321
100.5mV/g
RET.
Sensitivity +-
-
43
-
• With the UP and DOWN arrows change the proposed value and press ENTER. At the following request of confirmation, press again ENTER.
• From the main screen, press ESC to exit from the calibration program.
2) Calibration of a sensor through the vibrations generator
If a calibrator is available, proceed in the following way:
• Set the acceleration level of the calibrator through the item Menu> Settings > Calibration.
• Start the sensors calibration program pressing in sequence the keys: MENU >> Programs
>> Calibration.
• The main screen appears:
CALIBRATION
Date: 2009/01/31 10:00
DELTA OHM
DELTA OHM
ACC_M
ACC_T
Choose channel
ESC
LEFT
RIGHT
The indicated date refers to the last saving of the log file. On the left side are reported
the manufacturer and the name assigned to the monoaxial sensor, and on the right side the
correspondent information for the triaxial one.
• Press LEFT Key to select the monoaxial sensor, RIGHT for the triaxial one.
The screen that resumes the current data of the selected sensor appears:
o manufacturer,
o type,
o name,
o serial number,
o sensitivity expressed in mV/g.
CALIBRATION
DELTA OHM
ACC_TRI
ACC_T
123456
SENS:
10mV/g
Calibration Type
ESC
SENS.
MEAS.
• Apply the transducer to the calibrator and press the MEASURE key: the level that appears is the calibrator nominal value.
With the RIGHT and LEFT arrows the measure unit can be changed between g and m/s2.
• If the sensor is triaxial type, the three axes have to be calibrated separately: with the UP
and DOWN arrows select the first axis and confirm with ENTER.
-
44
-
CALIBRATION
Level
1.02g
Axis: 1
Choose Axis
RET.
• The following screen appears:
CALIBRATION
Level
1.02g
---
A1s
Fz
Turn On
calibrator
FORWARD
ESC
• Switch on the calibrator and press FORWARD.
CALIBRATION
Level
A1s
1.02g
0.9985
Fz
wait stabilization
FORWARD
ESC
• The instrument verifies that the signal level is stable and then asks to confirm the
measured value.
CALIBRATION
Level
A1s
1.02g
1.020
Confirm?
YES
-
45
-
Fz
NO
• Pressing YES the current value is memorized.
• If the sensor is triaxial, the procedure has to be repeated selecting the other two axes:
repeat the operation from the beginning.
• From the main screen, press ESC to exit from the calibration program.
DIAGNOSTIC CHECK PROGRAM
This program perform a check of the main functions of the HD2030 analyzer.
The following functional parameters are checked, in automatic sequence:
• Power Supply: it checks that the voltage supplied to the instrument allows the measurements execution. If this point fails, replace the batteries and repeat the test.
• IEPE Power Supply: it checks that the power supply of the accelerometers is within the
technical specifications.
• Accelerometers Polarization: it checks that the polarization voltage of the connected accelerometers is within the technical specifications.
• DSP Working: it checks that the analog to digital conversion and the DSPs are able to
transmit the measures to the microprocessor.
• Environmental Parameters: it checks that the environment temperature is within the
working specifications of the analyzer.
When one of the checks fails, it is displayed the list of the checks done and the steps that
failed.
In this case it is always suggested to repeat the diagnostic check and, in case of
confirmation, contact the technical service.
In case of failure of the power supply test, replace the batteries before repeating the
diagnostic check.
To perform the diagnostic test, proceed as follows:
• Connect the accelerometers to the appropriate inputs and switch on the instrument.
• Start the diagnostic test pressing in sequence the keys: MENU >> Programs >>
Diagnostic check.
• The test program starts and the different steps are executed:
HD 2030
DIAGNOSTIC TEST
2008/10/25 10:00:00
SUPPLY POWER
IEPE
ACCEL. POL.
OK
OK
TEST
ESC
• At the end it is displayed the test report; if at least one of the steps failed, the message
“FAULT IN DIAGNOSTIC CHECK!” appears. The passed steps are marked with OK, the
failed steps are marked with NO.
-
46
-
SUPPLY POWER
IEPE
ACCEL. POL.
DSP FUNCTION
AMB. PARAMETERS
OK
OK
NO
OK
OK
FAULT IN DIAGNOSTIC
CHECK!
ESC
• If all the steps have been completed without faults, it appears the message
“DIAGNOSTIC CHECK DONE”.
SUPPLY POWER
IEPE
ACCEL. POL.
DSP FUNCTION
AMB. PARAMETERS
OK
OK
OK
OK
OK
DIAGNOSTIC CHECK
DONE
ESC
• Press ESC to exit. To repeat the test, enter the menu again as described above.
The test procedure is completed.
SENSORS CONFIGURATION PROGRAM
This program allows to configure the sensors that will be used for the measurements
with the HD2030 analyzer.
It is possible to memorize up to 9 different sensors for the right input and 9 for the left
input. The sensors related to the right input are triaxial type while the ones related to the left
input are monoaxial type.
The parameters of the sensors are saved in a specific file in the internal memory of the
analyzer and, if present, they are also saved in the Memory Card.
The
•
•
•
•
requested parameters are:
Manufacturer
Model
Serial Number
Type: triaxial or monoaxial accelerometers for the right input and monoaxial for the left
input.
• Nominal Sensitivity: Sensitivity nominal factor of the accelerometer (mV/g)
• Range: the maximum acceleration value measurable (g pk)
At startup the instrument load the file with the parameters of the sensors and it is requested to select a configuration for each of the two sensors. With the PREV. and NEXT. keys
of the keypad it is possible to scroll the different sensors, and with the CURSOR key a sensor
for each input can be selected.
The blinking warning “NO CAL” next to the nominal sensitivity value indicates that, for
that sensor, the calibration data are missing: in this case the nominal sensitivity is used.
-
47
-
The same process is used when a complete setup is loaded (see the Setup Management
program description): the instrument verifies the existence of the calibration file for the two
accelerometers included in the selected setup. If the sensors have been calibrated, the sensitivity parameters are loaded automatically, otherwise it will be used the nominal sensitivity
associated with the configuration.
Note: even if it is possible to operate directly on the instrument, the management of the sensors configuration can be more easily done with the PC software Noise Studio (see the details
in the software manual).
To configure the sensors, proceed as follows:
• Connect the accelerometers to the appropriate inputs and switch on the instruments.
• Start the program pressing in sequence the keys: MENU >> Programs>> Config. Sensors.
SENSORS
CONFIGURATION
Choose channel
ESC
LEFT
RIGHT
• Select the channel where it is connected the sensor to configure.
• A screen similar to the following appears:
RIGHT
PROD:
MOD:
SERIAL N.:
TYPE:
SENS:
RANGE:
CONFIG. #01
DELTA OHM
ACC_ABC
654321
ACC TRI
10mV/g CAL
500 gpk
RET.
•
•
•
•
•
•
•
•
•
With the right and left arrows, select the sensor among the nine available.
With the UP and DOWN arrows, select the row to change.
Press ENTER to go to the parameter of the selected row.
With the UP and DOWN arrows, set the desired value.
Press ENTER to confirm.
Repeat for all the parameters.
Press RET (CURSOR key) to go back to the initial screen and select the other input.
Repeat the steps described above for the sensor connected to the second input.
Press ESC to go back to measurement mode.
The configuration process is completed.
-
48
-
MC INITIALIZATION PROGRAM
This program prepare the memory card for the use with the HD2030 and erases the files previously stored in the card. For the details see the chapter dedicated to the memory card.
Proceed as follows:
• After inserting the card in the slot placed in the front of the analyzer, switch on the instrument.
• When the “MC installed and ready to use” message appears, press the RD/WR key.
• Start the program MENU >> Programs >> MC Initialization.
MC INITIALIZATION
Batt: 90%
Mem: 50%
CONFIRM MEMORY
ERASE?
YES
NO
• Press YES to proceed, NO to cancel the operation.
• At the end the following screen appears:
MC INSTALLED
AND READY TO USE
Size:
500MB
ESC
RD
RD/WR
Press RD/WR to activate all the reading and writing functions.
The card is ready for the use.
-
49
-
DESCRIPTION OF THE MENU FUNCTIONS
The menu provides all the functions to set the parameters for the instrument functioning.
The menu is entered with Menu key> Settings.
The access to the menu is allowed also with the instrument in measure mode, while for
the modification of a parameter the instrument must be in stop mode, If not, it appears a
message requesting to stop the current measurement: WARNING! Stop the measure to
proceed”.
WARNING!
Stop the measure
to proceed.
YES
NO
Pressing YES the instrument enters the STOP mode and it is possible to proceed with the
modification of selected parameter.
Some of the parameters listed in the menu are changeable directly from the measurement screens: see the chapter “DESCRIPTION OF THE SCREENS” dedicated to the different
modes of visualization.
The menu has a multi-level structure: with main categories and submenus. To select a
menu item use the UP and DOWN arrows: the selected item blinks.
If the parameter placed on the right of a menu item does not blink, it means that the
item can not be modified.
SELECT PARAMETER
Instrument:
HD2030
Serial Num.: 123456789
Version: 108v1.3
Config. RIGHT:
1
Config. LEFT:
2
...
This parameter CAN’T be changed
This parameter is CHANGEABLE
Use the ENTER key to access the selected submenu or to modify the selected parameter.
The selected blinking parameter can be modified with the UP and DOWN arrows: to confirm the new value, press the ENTER key, while to cancel the modifications press the MENU
key.
To exit from a menu and go back to the upper level till returning to the measurement
screen, use the MENU key.
-
50
-
2008/10/25
Batt: 95%
10:00:00
Mem: 99.5%
SELECT MENU
General
Vibrometer
Spectrum Analyzer
…
Entering the menus, it is visualized the current date and time and, in the next line, the
remaining charge of the batteries and the memory space available. The memory space refers
to the external card, if any, otherwise to the internal Flash memory.
The message “SELECT MENU” becomes “SELECT SUB MENU” when the meter is inside a
sub menu.
The points at the end of a list indicate that there are other items following the visible
ones: to display them, press the DOWN arrow key.
Pressing MENU once, it appears the screen that allows to choose to access the settings
of the instrument or the programs.
2008/10/25
Batt: 95%
10:00:00
Mem: 99.5%
SELECT
Settings
Program
The following table lists the available menus for the instrument setting.
MENU
DESCRIPTION
General:
•
Identification
Identification of
accelerometers.
the
instrument
and
configuration
•
System
Date and time, type of batteries and display settings.
of
the
Reading of the accelerometers polarization voltages.
•
Input/Output
Setting of the automatic printing. Check of the RS232, USB,
Memory card interfaces.
•
Measurements
General measurement settings and definition of the filters and
coefficients for the calculation of the sum vector.
Vibrometer
Setting of the measurement parameters for the screens: VLM_1
(single axis), VLM_2 (vector), PROFILE, STATISTICS e PERCENTILES.
Spectrum Analyzer
Setting of the measurement parameters of the spectrum.
-
51
-
MENU
DESCRIPTION
Recording:
•
Profiles
Setting of the recording mode and makers.
•
Global
Setting of the global measurement parameters (VLM_3 and
VLM_4 screens). Auto-Store recording function.
Calibration
Setting of the calibrator acceleration.
GENERAL
The General menu contains all the data related to the instrument identification, some instrument and interfaces management parameters, the input and output settings and the global
acquisition parameters. It is composed by four submenus that are described below:
Identification
It contains the information that identifies the instrument and the accelerometers.
•
Instrument: instrument model.
•
Serial number: instrument serial number.
•
Version: firmware version currently installed in the instrument.
•
RIGHT configuration: number of the selected configuration for the RIGHT input. There
are 9 configurations available. The parameter can be selected from 0 (deactivated
channel) to 9.
•
LEFT configuration: number of the selected configuration for the LEFT input. There are
9 configurations available. The parameter can be selected from 0 (deactivated channel)
to 9.
•
RIGHT Channel: it indicates OFF when the channel is deactivated, ON TRI when the
input is connected to a triaxial accelerometer, ON MON when the input is connected to a
monoaxial accelerator.
•
Manufacturer: manufacturer of the accelerometer connected to the RIGHT input.
•
Model: model of the accelerometer connected to the RIGHT input.
•
Serial Number: serial number of the accelerometer connected to the RIGHT input.
•
Sensitivity: nominal sensitivity (in mV/g) of the accelerometer connected to the RIGHT
input.
•
LEFT Channel: it indicates OFF when the channel is deactivated or ON MON when the
input is connected to a monoaxial accelerator.
•
Manufacturer: manufacturer of the accelerometer connected to the LEFT input.
•
Model: model of the accelerometer connected to the LEFT input.
•
Serial Number: serial number of the accelerometer connected to the LEFT input.
•
Sensitivity: nominal sensitivity (in mV/g) of the accelerometer connected to the LEFT
input.
•
Memory Size: Size of the Memory Flash in the instrument. The standard size is
8Mbyte.
•
Options: it indicates the installation of firmware options, if any.
System
It allows to set some system parameters.
•
Hour: current hour.
-
52
-
•
Date: current date in the format year/month/day.
•
Vpol ch1: it indicates the polarization voltage of the accelerometer connected to the
RIGHT input channel n.1. The STOP indication, if displayed, indicates that the instrument is in stop mode or that the input is not connected to a sensor.
•
Vpol ch2: it indicates the polarization voltage of the accelerometer connected to the
RIGHT input channel n.2. The STOP indication, if displayed, indicates that the instrument is in stop mode or that the input is not connected to a sensor.
•
Vpol ch3: it indicates the polarization voltage of the accelerometer connected to the
RIGHT input channel n.3. The STOP indication, if displayed, indicates that the instrument is in stop mode or that the input is not connected to a sensor.
•
Vpol ch4: it indicates the polarization voltage of the accelerometer connected to the
LEFT input. The STOP indication, if displayed, indicates that the instrument is in stop
mode or that the input is not connected to a sensor.
•
Battery: it indicates the battery type installed in the instrument. It is possible to
choose between ALKALINE (alkaline batteries) or NiMH (rechargeable Nickel-metal hydride batteries).
•
Display Lighting: it indicates the activation of the of the display backlit. The backlit
can also be activated or deactivated through the keyboard, holding pressed the CURSOR
key while one of the VLM screens is visualized.
•
Display Contrast: it allows to adjust the display contrast. When the ambient temperature changes, the display contrast has a small variation: it can be compensated
inserting a higher value in order to increase the contrast or a smaller value to decrease
it. The value can be set from 3 (minimum) to 9 (maximum).
•
Auto-Switching Off: the instrument has a function to switch itself off automatically after 5 minutes if the instrument is in STOP mode and no keys are pressed in this time
interval. Before switching itself off, the instrument emits a series of warning beeps:
press a key to avoid the switching off of the instrument.
Input/Output
Submenu for the choice of the parameters related to the inputs and outputs of the instrument.
•
Type of print: it activates the printing of the measured levels and it allows to choose
which data to print. If the parameter is set to OFF, the printing is disabled. In the other
cases the data are automatically printed at the end of the measurement. The possible
settings are: OFF indicates printing disabled, VLM for printing the numerical parameters visualized in the VLM screen, SPC for the printing of the octave or third-octave
bands levels and VLM+SPC for printing both. See the chapter “CONNECTION TO A
PRINTER”.
•
TRGOUT Source: the TRGOUT output, if activated with TRGOUT=RUN, switches from
the pause level to the active level when the instrument enters the acquisition mode
(RUN). When the parameter is set to OFF, the TRGOUT output is deactivated.
•
TRGOUT Polarity: the TRGOUT output can have a positive (POS) or negative (NEG)
polarity, with low or high pause level respectively.
•
RS232 Baud Rate: this parameter allows to select the data transfer speed for the
RS232serial connection from a minimum of 300 to a maximum of 115200 baud. A
higher value indicates a faster communication, so, if there are no other contrary indications, select the higher possible value to speed up the data transfer. If the
instrument is connected to a printer with RS232 serial input or with serial/parallel converter, the value supplied by the printer manufacturer must be set.
WARNING: when the serial interface is used, the communication between the
instrument and the PC (or device with serial input) works only if the Baud Rate
of the instrument and PC (or device) is the same. The supplied Noise Studio
software sets automatically the serial port of the PC: on the instrument set
“RS232 Baud Rate = 115200”.
-
53
-
•
Memory: it allows to select the memory device where the data will be recorded. It is
possible to select between the internal memory (FLASH) or the SD memory card
(CARD).
•
Serial Device: it identifies the device connected to the serial interface.
The connection possibilities are:
RS232: connection to a PC with COM ports or to a printer with RS232 serial interface
(for example HD40.1).
USB: connection to a PC through USB port. The connection to the USB port of a PC
requests the installation of the apposite driver included in the Noise Studio CD-ROM.
Measures
Under the item MEASURES there are the general acquisition parameters.
•
Application: it is possible to choose the type of measure between the vibrations
transmitted to the hand-arm system (HA), to the whole body (WB) or by buildings
(BV).
•
Input Gain: select the appropriate input gain among 0dB, 10dB or 20dB, according to
the vibrations level to be measured (see the technical data).
•
Integration Delay: It allows to start the measurement after a stabilization interval
settable from a minimum of 1 s to a maximum of 99s.
•
Integration Mode: the instrument has two different integration modes: single (SING)
and multiple (MULT). The single mode resets the integrated levels at the beginning of
the measurement and integrates in the Tint time set in Menu>>Settings >> General
>> Measures >> Int. Integration. At the end, the instrument stops automatically the
measure.
The multiple integration mode divides the measurement time in intervals equal to
the Tint integration time set in Menu >> Settings >> General >> Measures >> Int. Integration. At the beginning of each interval the integrated parameters are reset
automatically. For a description of the modes, see the “MEASUREMENT MODES” chapter.
•
Profile Sampling: sampling interval in the visualization of the time profile, settable
from a minimum of 1s to a maximum of 1 hour.
•
Integration Interval: in single integration mode, this parameter acts as a timer that
stops the display updating (HOLD), settable from a minimum of 1s to a maximum of 99
hours. If set to 0s, the timer is deactivated and the integration can only be stopped
manually with the START/STOP key. In the multiple integration mode, this parameter
determines the duration of each integration interval from a minimum of 10s to a maximum of 1 hour.
•
Measure unit: the instrument shows in the VLM screens the acceleration levels with
one of the following measure units: m/s2, cm/s2, ft/s2, in/s2, g and dB (referred to 10-6
m/s2). When a measure unit different from dB is selected, the acceleration values in the
other screens are visualized in m/s2.
•
Pond. CH-1: filter applied to the acceleration detected in channel 1 of the RIGHT input
for the calculation of the vector acceleration.
•
Pond. CH-2: filter applied to the acceleration detected in channel 2 of the RIGHT input
for the calculation of the vector acceleration.
•
Pond. CH-3: filter applied to the acceleration detected in channel 3 of the RIGHT input
for the calculation of the vector acceleration.
•
Pond. CH-4: filter applied to the acceleration detected in channel 4 of the LEFT input
for the calculation of the vector acceleration.
•
Coefficient 1: coefficient applied to the weighted acceleration related to channel 1 in
the calculation of the vector acceleration.
•
Coefficient 2: coefficient applied to the weighted acceleration related to channel 2 in
the calculation of the vector acceleration.
-
54
-
•
Coefficient 3: coefficient applied to the weighted acceleration related to channel 3 in
the calculation of the vector acceleration.
•
High-Pass: high-pass filter that cuts the frequencies lower than 0.6 Hz. It can be useful
to decrease the settling time of the accelerometers signal and to improve the response
to vibrations with frequent pulses.
•
Ch1-4 0=OFF 1=ON: the function allows to disable one or more measurement channels that, for example, are not used. The status of each channel is described by a
number: 0 (zero) indicates disabled channel, 1 enabled channel.
The four channels are indicated in the sequence CH1, CH2, CH3, CH4: to have them all
active, the menu item must be Ch1-4=1111. To disable for example the channel CH1,
the menu item must be Ch1-4=0111. It is not allowed to disable all the channels at
the same time.
VIBROMETER
Vibrometer Menu contains all the parameters related to the VLM_1, VLM_2 and PROFILE
screens.
These items can be modified directly in the correspondent screens as described in “DESCRIPTION OF DISPLAY MODES” chapter.
•
Par. Sing. 1 ÷ Par. Sing. 3: measurement parameters visualized in the VLM_1 screen
in relation with the measure of the acceleration values for a single axis.
•
Par. Vect. 1 ÷ Par. Vect. 3: measurement parameters visualized in the VLM_1 screen
in relation with the measure of the vector acceleration values.
•
Profile: measurement parameter visualized in the PROFILE screen.
SPECTRUM ANALYZER
The Spectrum Analyzer menu contains the parameters related to the spectrum calculation and visualization modes. These items, excluded the parameter Order, can be modify
directly in the Spectrum screen.
•
Auxiliary Pond: the frequency weighting of the wide band channel associated with the
spectrum and visualized with a vertical bar placed on the right of the display. The pondered level is calculated weighting, according to the selected filter, the octave or thirdoctave bands levels.
•
Mode: the updating mode of the octave or third-octave bands spectrum. It can be
Multi-Spectra (MULTISP), maximum (MAXIMUM), minimum (MINIMUM) or Integrated
(AVERAGE). The multi-spectral mode provides a spectrum per second while the AVERAGE, MAXIMUM and MINIMUM modes visualize respectively the average, maximum and
minimum spectrum integrated in the measurement time.
•
Order: it allows to choice the order of the visualized spectrum: 1/1 for the octave
bands spectrum and 1/3 for the third-octave bands spectrum.
•
Spectrum Integration: this function of frequency integration allows to switch from the
visualization of the accelerations spectrum (a) (OFF: no integration) to the speeds spectrum (v) (X 1: single integration) or displacements (s) (X 2: double integration). The
same setting can be obtained directly in measure mode through the arrow keys of the
keypad.
RECORDING
In the recording menu are contained the parameters related to the memorization of the
measured data. It is composed by the two submenus Profiles and Global that are described
below.
-
55
-
Profiles
It contains the markers and the profile recordings settings.
•
Mark1 ÷ Mark9: represent the available markers. During the recording it is possible to
insert the markers to signal interesting events for the current measurement (for the details see the chapter (“RECORDING MODES”)
To assign a name to a marker:
•
Use the UP and DOWN arrows to select one of the nine markers and confirm with
ENTER.
•
The first character of the marker is selected and it can be modified by pressing the
UP and DOWN arrows.
•
Press the right arrow to move to the second character, use the UP and DOWN arrows to change the character.
•
Repeat the previous two steps for all the characters that form the marker name.
•
When the name is completed, press MENU to exit from the name modifying mode.
Note: the markers can also be set by using the Noise Studio software.
•
Mode: they are the two recording modes available Profile and Full.
“Profile” allows to memorize the profile of a measurement parameter (PROFILE screen),
with the sampling interval set in “Menu >> Settings >> General >> Measurements
>>Sampling Profile” from 1s to 1 hour.
The second recording mode “Full”, when the integration mode is single (Menu >> Settings >> General >> Measures >> Integration Mode) allows the recording of the
profiles of the parameters visualized in the VLM_1 and VLM_2 screens and the spectra
every second. When the multiple integration mode is active, it is also recorded the statistical analysis together with the VLM_1 and VLM_2 parameters and the spectra. The
recording interval is programmable from 10s to 1 hour (Menu >> Settings >> General
>> Measure >> Integration Interval).
ADC Channels: it sets the direct memorization of the samples supplied by the AD converters. Through the UP and DOWN arrows it is possible to choose to record all the four
channels (1234), only one at choice (1---, -2--, …) or the first three of the RIGHT input
(123-). When “ADC Channels” is set on “OFF”, the ADC samples are not memorized.
Note 1: it is not possible to select an ADC channel if the corresponding measuring channel CH is disabled: enable the measuring channels selecting MENU >> General >>
Ch1-4.
Note 2: The storing of the ADC samples is possible only in the Memory card.
Global
It contains the settings related to the recording of the global measurement parameters.
• Par. Sing. 1 ÷ Par. Sing. 3: global parameters visualized in the VLM_3 screen related to
the measurement of the acceleration levels for a single axis.
• Par. Vect. 1 ÷ Par. Vect. 3: global parameters visualized in the VLM_4 screen related to
the measure of the vector acceleration levels.
•
Auto-Store: it activates the automatic memorization of global levels at the end of the
measurement (for the details see the chapter “RECORDING MODES”).
CALIBRATION
•
Level: the acceleration value produced by the device used for the calibration of the
measurement chain. The acceptable values vary from 0.95m/s2 to 100.00m/s2 with a
resolution of 0.05m/s2.
-
56
-
FIRMWARE UPDATE
The firmware, the program that handles all the analyzer functions, can be updated
transferring the file from a PC to the HD2030 through the serial port.
In this way it is possible to update the instrument functionality.
The updating files are available at the authorized dealers.
To proceed with the update, it is necessary to have installed in the PC the Noise Studio
software.
Refer to the on line manual of the software for the operation details.
-
57
-
REPORTING OF LOW BATTERIES AND REPLACEMENT OF THE
BATTERIES
placed in the upper right corner of the display constantly indicates
The battery symbol
the charge status of the batteries of the analyzer. As the batteries run down, the symbol is
gradually "emptied"…
... when the battery voltage reaches the minimum value to operate correctly, the symbol
blinks. In this condition change the batteries as soon as possible.
Continuing to use the instrument, the battery voltage drops further, and the
analyzer is no longer capable of providing a proper measure; any data recording is
automatically stopped, finally the acquisition is also stopped and the instrument enters the STOP mode.
Below a certain level the instrument turns itself off automatically. The stored
data remain. Below a certain level of batteries charge it will not be possible to turn
on the instrument.
The charge level of the batteries is available in the main screen of the menu, expressed
as a percentage value. The item is accessed pressing the MENU key. When the level is 0%, it is
necessary to replace the batteries.
The battery symbol is replaced by a mains plug when the external power supply is connected.
Note: the battery symbol blinks also when it is disabled the automatic auto-switch off (Auto
Power OFF = OFF).
To replace the batteries, switch off the instrument and unscrew anti-clockwise the two
closing screws of the battery compartment cover. After the replacement of the batteries (4
batteries type AA, 1.5 V alkaline or NiMH rechargeable), close the cover screwing the two
screws clockwise. Check the date and time after the replacement of the batteries.
If the batteries replacement takes less than two minutes, it should not be necessary to
adjust the clock.
-
58
-
Instead of alkaline batteries, it is possible to use rechargeable batteries NiMH type.
To allow the analyzer to properly manage the charge level of the batteries, it must be selected in the menu the type of batteries used (MENU key>> Settings>> General>> System>>
Battery = Alkaline or NiMH).
The external power supply does not charge the batteries: rechargeable batteries
must be charged separately with an external charger.
WARNING ON BATTERIES USE
•
•
•
•
•
If the analyzer is not used for a long period of time, remove the batteries.
If the batteries are discharged, replace them immediately.
Avoid leakage from the batteries.
Use watertight and good quality batteries, alkaline or NiMH.
If the product does not turn on after the change of the batteries:
• Remove the batteries
• Wait at least 5 minutes to allow a complete discharge of the vibrations analyzer internal circuit
• Insert the missing battery: with charged batteries, the instrument should switches
itself on automatically.
-
59
-
INSTRUMENT STORAGE
Storage conditions of the instrument:
• Temperature: -25 ... 70 ° C.
• Humidity: less than 90% R.H. not condensing.
• In the storage avoid places where:
The humidity is high.
The instrument is exposed to direct radiation of the sun.
The instrument is exposed to a source of high temperature.
There are strong vibrations.
There are steam, salt and/or corrosive gas.
The casing of the instrument is made of ABS plastic material and the protective band is
made of rubber: do not use solvents to clean them.
-
60
-
SERIAL INTERFACE
The instrument has a dual serial interface:RS232C and USB.
The RS232 port has an 8-pole Mini-Din connector and it can be connected to any COM
port of a PC or to a printer (e.g. the HD40.1) using the proper connection cable HD2110CSNM.
The USB port allows the connection to a USB port of a PC through the supplied cable
CP22 type A/B.
The interface selection is done through the menu item "MENU>> Settings >> General
>> Input/Output >> Serial Dev.:
• RS232: connection through RS232 interface to a PC provided with a COM type port. For
the connection it can be supplied on request the HD2110CSNM cable, null-modem type
with female 9-pole subD connector. This cable is also usable for the connection to the
HD40.1 portable printer.
• USB: connection through USB interface to a PC that has installed the appropriate driver
VCOM. The drivers are included in the CD-ROM of the Noise Studio software. For the connection is supplied the cable CP22.
Unlike the RS232 connection that requires no special programs for its operation, the USB
connection requires the prior installation in the PC of a special program (driver) provided in the
CD that is supplied with the instrument.
In the MiniDin female 8-pole connector of the instrument there are the following signals:
Pin
1
2
3
4
5
6
External view 7
8
Direction
Output
Output
Input
Output
Output
Input
Signal
VDD
DTE
DCE - CD
RTS
TD
RD
Description
3.3V power supply
DTE ready
DCE ready – Carrier detect
Request to send
Channel data reception
Channel data transmission
Input
GND
CTS
Reference ground
Clear to send
In the subD female 9-pole connector of the HD2110CSNM cable, there are the following
signals:
External view
Pin
1
2
Direction
DCE >> HD2110
DCE >> HD2110
Signal
DCE - CD
RD
Description
DCE ready – Carrier detect
Channel data reception
3
4
5
7
8
9
HD2110
HD2110
HD2110
DCE >>
HD2110
TD
DTE
GND
RTS
CTS
VDD
Channel data transmission
DTE ready
Reference ground
Request to send
Clear to send
3.3V power supply
>> DCE
>> DCE
>> DCE
HD2110
>> DCE
When the instrument is connected via a serial interface to an active terminal
(DCE active, for example a PC), the auto-switch off is disabled and it is not possible
to switch off the instrument.
If the analyzer is turned off, the connection to an active terminal (DCE active)
will lead to the automatic switch on.
The standard serial transmission parameters of the instrument are:
• Baud rate
115200 baud
• Parity
None
• N. bit
8
• Stop bit
1
• Protocol
Hardware.
-
61
-
It is possible to change the speed of the data transmission through the item "baudrate"
in the menu (MENU >> Settings >> General >> Input/Output >> baudrate).
The available baud rates are: 115200, 57600, 38400, 19200, 9600, 4800, 2400, 1200,
600, 300. The other transmission parameters can not be altered.
To enable the full control of the instrument through a PC, the HD2030 is equipped with a
communication protocol with a complete set of commands described in detail in the appendix.
-
62
-
MEASURE PARAMETERS
The parameters that can be displayed in the VLM and PROFILE screens are selectable
among the ones of the following lists:
VLM_1 screen: Single axis parameters.
Parameter Description
Pk
instant peak value of the frequency weighted acceleration.
Pkmx
Max peak value of the frequency weighted acceleration.
AeqS
Time average (linear) of the frequency weighted acceleration calculated in the last
second (“running r.m.s.”):
⎛ t
⎞
AeqS (t ) = ⎜⎜ ∫ a w2 (ξ )dξ ⎟⎟
⎝ t −1s
⎠
1/ 2
Where:
aw(ξ) is the frequency weighted single axis instant acceleration.
Aeq
Time average (linear) of the frequency weighted acceleration, calculated in the
measurement time:
⎛1T 2
⎞
Aeq = ⎜⎜ ∫ a w (ξ )dξ ⎟⎟
⎝T 0
⎠
1/ 2
where:
aw(ξ) is the frequency weighted single axis instant acceleration
T is the measurement time.
A1s
Time average (exponential) of the frequency weighted acceleration with time
constant of 1 second:
⎛1 t 2
⎛ ξ − t ⎞ ⎞⎟
A1s (t ) = ⎜⎜ ∫ a w (ξ ) exp⎜
⎟dξ
⎝ τ ⎠ ⎟⎠
⎝ τ −∞
1/ 2
Where:
aw(ξ) is the frequency weighted single axis instant acceleration
τ = 1s is the time constant of the exponential function.
A8s
Time average (exponential) of the frequency weighted acceleration with a time
constant of 8 seconds.
A1smx
Maximum value of the timed average (exponential) of the frequency weighted
acceleration with time constant of 1 second.
A8smx
Maximum value of the timed average (exponential) of the frequency weighted
acceleration with time constant of 8 seconds.
A1smn
Minimum value of the timed average (exponential) of the frequency weighted
acceleration with time constant of 1 second.
A8smn
Minimum value of the timed average (exponential) of the frequency weighted
acceleration with time constant of 8 seconds.
A(1s)
Equivalent value of the frequency weighted acceleration in the measurement time
referenced to 1 second:
⎛1 T 2
⎞
A(1s ) = ⎜⎜ ∫ a w (ξ )dξ ⎟⎟
⎝ T0 0
⎠
1/ 2
where:
aw(ξ) is the frequency weighted single axis instant acceleration
T is the measurement time.
-
63
-
A(8)
Equivalent value of the frequency weighted acceleration in the measurement time
referenced to 8 hours:
⎛ 1 T 2
⎞
A(8) = ⎜⎜
a w (ξ )dξ ⎟⎟
∫
⎝ T8 h 0
⎠
1/ 2
where:
aw(ξ) is the frequency weighted single axis instant acceleration
T8h = 28800 is the number of seconds in 8 hours.
VDV
Vibrations Dose Value in the measurement time:
⎛T
⎞
VDV = ⎜⎜ ∫ a w4 (ξ )dξ ⎟⎟
⎝0
⎠
1/ 4
where:
aw(ξ) is the frequency weighted single axis instant acceleration.
VDV,d
Daily evaluation (8 hours) of the vibrations dose:
⎛ T T 4
⎞
⎟
VDV , d = ⎜⎜
a
(
ξ
)
d
ξ
w
∫
⎟
T
⎝ 8h 0
⎠
1/ 4
where:
aw(ξ) is the frequency weighted single axis instant acceleration
T is the measurement time
T8h = 28800 is the number of seconds in 8 hours.
MTVV
Maximum value of the time average (linear) of the frequency weighted acceleration calculated in the last second.
CFeq
Crest factor calculated as ratio between the maximum peak value and the time
average of the frequency weighted acceleration:
CFeq =
Pk mx
⎞
⎛1T 2
⎜ ∫ a w (ξ )dξ ⎟
⎟
⎜T
⎠
⎝ 0
1/ 2
where:
aw(ξ) is the frequency weighted single axis instant acceleration
T is the measurement time.
CF
Crest factor calculated as ratio between the instant peak value and the time
average of the frequency weighted acceleration in the last second:
CF (t ) =
Pk (t )
⎞
⎛ t 2
⎜ ∫ a w (ξ )dξ ⎟
⎟
⎜
⎠
⎝ t −1s
1/ 2
where:
aw(ξ) is the frequency weighted single axis instant acceleration.
CFmx
Maximum value of the Crest factor CF calculated as ratio between the instant peak
value and the time average of the frequency weighted acceleration in the last
second.
VDVr
Ratio between the vibrations dose value (VDV) and the time average (linear) of
the frequency weighted acceleration in the measurement time:
VDVr =
VDV
⎞
⎛1 2
⎜ ∫ a w (ξ )dξ ⎟
⎟
⎜T
⎠
⎝ 0
T
1/ 2
where:
aw(ξ) is the frequency weighted single axis instant acceleration
T is the measurement time.
-
64
-
MTVVr
Ratio between the maximum value calculated in the last second (MTVV) and the
time average (linear) of the frequency weighted acceleration calculated in the
measurement time:
MTVVr =
MTVV
⎞
⎛1T 2
⎜ ∫ a w (ξ )dξ ⎟
⎟
⎜T
⎠
⎝ 0
1/ 2
where:
aw(ξ) is the frequency weighted single axis instant acceleration
T is the measurement time.
OL
Percentage of time with “overload”.
UR
Percentage of time with “under-range”
VLM_2 screen: Parameters referred to the acceleration vector.
Parameter Description
Pk
Instant peak value of the frequency weighted acceleration:
Pk (t ) = c12 Pk12 (t ) + c 22 Pk 22 (t ) + c32 Pk 32 (t )
where:
Pk1,2,3(t) are the instant peak values of the frequency weighted acceleration in
each axis
c1,2,3 are multiplying coefficients dependent on the specific application.
Pkmx
Maximum peak value of the frequency weighted acceleration.
AeqS
Time average (linear) of the frequency weighted acceleration calculated in the last
second (“running r.m.s.”):
⎞
⎛ t
AeqS (t ) = ⎜⎜ ∫ c12 a12, w (ξ ) + c 22 a 22, w (ξ ) + c32 a32, w (ξ ) dξ ⎟⎟
⎠
⎝ t −1s
(
)
1/ 2
where:
a1,2,3,w(ξ) are the instant frequency weighted accelerations in each axis
c1,2,3 are multiplying coefficients dependent on the specific application.
Aeq
Time average (linear) of the frequency weighted acceleration, calculated in the
measurement time:
⎞
⎛1T
Aeq = ⎜⎜ ∫ c12 a12, w (ξ ) + c 22 a 22, w (ξ ) + c32 a32, w (ξ ) dξ ⎟⎟
⎠
⎝T 0
(
)
1/ 2
where:
a1,2,3,w(ξ) are the instant frequency weighted accelerations in each axis
c1,2,3 are multiplying coefficients dependent on the specific application
T is the measurement time.
A1s
Time average (exponential) of the frequency weighted acceleration with time
constant of 1 second:
⎛1 t
⎛ ξ − t ⎞ ⎞⎟
A1s (t ) = ⎜⎜ ∫ c12 a12, w (ξ ) + c 22 a 22, w (ξ ) + c32 a32, w (ξ ) exp⎜
⎟dξ ⎟
τ
τ
⎠ ⎠
⎝
⎝ −∞
(
)
1/ 2
where:
a1,2,3,w(ξ) are the instant frequency weighted accelerations in each axis
c1,2,3 are multiplying coefficients dependent on the specific application
τ = 1s is the time constant of the exponential equation.
A8s
Time average (exponential) of the frequency weighted acceleration with a time
constant of 8 seconds.
-
65
-
A1smx
Maximum value of the time average (exponential) of the frequency weighted
acceleration with time constant of 1 second.
A8smx
Maximum value of the time average (exponential) of the frequency weighted
acceleration with time constant of 8 seconds.
A1smn
Minimum value of the time average (exponential) of the frequency weighted
acceleration with time constant of 1 second.
A8smn
Minimum value of the time average (exponential) of the frequency weighted
acceleration with time constant of 8 seconds.
A(1s)
Equivalent value of the frequency weighted acceleration in the measurement time
referenced to 1 second:
⎛1
A(1s ) = ⎜⎜
⎝ T0
T
∫ (c
a (ξ ) + c a
2 2
1 1, w
2
2
2
2, w
(ξ ) + c a
2
3
2
3, w
0
⎞
(ξ ) dξ ⎟⎟
⎠
)
1/ 2
where:
a1,2,3,w(ξ) are the instant frequency weighted accelerations in each axis
c1,2,3 are multiplying coefficients dependent on the specific application
T is the measurement time.
A(8)
Equivalent value of the frequency weighted acceleration in the measurement time
referenced to 8 hours:
⎛ 1
A(8) = ⎜⎜
⎝ T8 h
T
∫ (c
a (ξ ) + c a
2 2
1 1, w
2
2
2
2, w
(ξ ) + c a
0
2
3
2
3, w
⎞
(ξ ) dξ ⎟⎟
⎠
)
1/ 2
where:
a1,2,3,w(ξ) are the instant frequency weighted accelerations in each axis
c1,2,3 are multiplying coefficients dependent on the specific application
T8h = 28800 is the number of seconds in 8 hours.
MTVV
Maximum value of the time average (linear) of the frequency weighted acceleration calculated in the last second.
CFeq
Crest factor calculated as ratio between the maximum peak value and the time
average of the frequency weighted acceleration:
CFeq =
Pk mx
⎞
⎛1T 2 2
⎜ ∫ c1 a1, w (ξ ) + c 22 a 22, w (ξ ) + c32 a32, w (ξ ) dξ ⎟
⎟
⎜T
⎠
⎝ 0
(
)
1/ 2
where:
Pkmx is the maximum peak value of the frequency weighted acceleration vector
a1,2,3,w(ξ) are the instant frequency weighted accelerations in each axis
c1,2,3 are multiplying coefficients dependent on the specific application
T is the measurement time.
CF
Crest factor calculated as ratio between the instant peak value and the time
average of the frequency weighted acceleration in the last second:
CF (t ) =
Pk (t )
⎞
⎛ t 2 2
⎜ ∫ c1 a1, w (ξ ) + c 22 a 22, w (ξ ) + c32 a32, w (ξ ) dξ ⎟
⎟
⎜
⎠
⎝ t −1s
(
)
1/ 2
where:
Pk is the instant peak value of the frequency weighted acceleration vector
a1,2,3,w(ξ) are the instant frequency weighted acceleration in each axis
c1,2,3 are multiplying coefficients dependent on the specific application.
CFmx
Maximum value of the Crest factor CF calculated as ratio between the instant peak
value and the time average of the frequency weighted acceleration in the last
second.
-
66
-
MTVVr
Ratio between the maximum value calculated in the last second (MTVV) and the
time average (linear) of the frequency weighted acceleration calculated in the
measurement time:
MTVVr =
MTVV
⎞
⎛1T 2 2
⎜ ∫ c1 a1, w (ξ ) + c 22 a 22,w (ξ ) + c32 a32, w (ξ ) dξ ⎟
⎟
⎜T
⎠
⎝ 0
(
)
1/ 2
where:
a1,2,3,w(ξ) are the instant frequency weighted accelerations in each axis
c1,2,3 are multiplying coefficients dependent on the specific application
T is the measurement time.
VLM_3 Screen: Single axis global parameters.
Parameter Description
Pkmx
Maximum peak value of the frequency weighted acceleration.
Aeq
Time average (linear) of the frequency weighted acceleration calculated in the
measurement time:
⎞
⎛1T 2
Aeq = ⎜⎜ ∫ a w (ξ )dξ ⎟⎟
⎠
⎝T 0
1/ 2
where:
aw(ξ) is the single axis frequency weighted instant acceleration
T is the measurement time.
A1smx
Maximum value of the time average (exponential) of the frequency weighted
acceleration with time constant of 1 second.
A8smx
Maximum value of the time average (exponential) of the frequency weighted
acceleration with time constant of 8 seconds.
A1smn
Minimum value of the time average (exponential) of the frequency weighted
acceleration with time constant of 1 second.
A8smn
Minimum value of the time average (exponential) of the frequency weighted
acceleration with time constant of 8 seconds.
A(1s)
Equivalent value of the frequency weighted acceleration in the measurement time
referenced to 1 second:
⎞
⎛1 T
A(1s ) = ⎜⎜ ∫ a w2 (ξ )dξ ⎟⎟
⎠
⎝ T0 0
1/ 2
where:
aw(ξ) is the frequency weighted single axis instant acceleration
T is the measurement time.
A(8)
Equivalent value of the frequency weighted acceleration in the measurement time
referenced to 8 hours.
⎞
⎛ 1 T 2
A(8) = ⎜⎜
a w (ξ )dξ ⎟⎟
∫
⎠
⎝ T8 h 0
1/ 2
where:
aw(ξ) is the frequency weighted single axis instant acceleration
T8h = 28800 is the number of seconds in 8 hours.
VDV
Vibrations Dose Value in the measurement time:
⎞
⎛T
VDV = ⎜⎜ ∫ a w4 (ξ )dξ ⎟⎟
⎠
⎝0
where:
-
67
-
1/ 4
aw(ξ) is the frequency weighted single axis instant acceleration.
VDV,d
Daily evaluation (8 hours) of the vibrations dose:
⎞
⎛ T T 4
⎟
a
(
ξ
)
d
ξ
VDV , d = ⎜⎜
w
∫
⎟
T
⎠
⎝ 8h 0
1/ 4
where:
aw(ξ) is the frequency weighted single axis instant acceleration
T is the measurement time.
T8h = 28800 is the number of seconds in 8 hours.
MTVV
Maximum value of the time average (linear) of the frequency weighted acceleration calculated in the last second.
CFeq
Crest factor calculated as ratio between the maximum peak value and the time
average of the frequency weighted acceleration:
CFeq =
Pk mx
⎞
⎛1T 2
⎜ ∫ a w (ξ )dξ ⎟
⎟
⎜T
⎠
⎝ 0
1/ 2
where:
aw(ξ) is the frequency weighted single axis instant acceleration
T is the measurement time.
CF
Crest factor calculated as ratio between the instant peak value and the time
average of the frequency weighted acceleration in the last second:
CF (t ) =
Pk (t )
⎞
⎛ t 2
⎜ ∫ a w (ξ )dξ ⎟
⎟
⎜
⎠
⎝ t −1s
1/ 2
where:
aw(ξ) is the frequency weighted single axis instant acceleration.
CFmx
Maximum value of the Crest factor CF calculated as ratio between the instant peak
value and the time average of the frequency weighted acceleration in the last
second.
VDVr
Ratio between the vibrations dose value (VDV) and the time average (linear) of
the frequency weighted acceleration in the measurement time:
VDVr =
VDV
⎞
⎛1T 2
⎜ ∫ a w (ξ )dξ ⎟
⎟
⎜T
⎠
⎝ 0
1/ 2
where:
aw(ξ) is the frequency weighted single axis instant acceleration
T is the measurement time.
MTVVr
Ratio between the maximum value calculated in the last second (MTVV) and the
time average (linear) of the frequency weighted acceleration calculated in the
measurement time:
MTVVr =
MTVV
⎞
⎛1T 2
⎜ ∫ a w (ξ )dξ ⎟
⎟
⎜T
⎠
⎝ 0
1/ 2
where:
aw(ξ) is the frequency weighted single axis instant acceleration
T is the measurement time.
OL
Percentage of time with “overload”.
UR
Percentage of time with “under-range”.
-
68
-
VLM_4 Screen: Acceleration vector global parameters.
Parameter Description
Pkmx
Maximum value of the frequency weighted acceleration.
Aeq
Time average (linear) of the frequency weighted acceleration calculated in the
measurement time:
⎞
⎛1T
Aeq = ⎜⎜ ∫ c12 a12, w (ξ ) + c 22 a 22, w (ξ ) + c32 a32, w (ξ ) dξ ⎟⎟
⎠
⎝T 0
(
)
1/ 2
where:
a1,2,3,w(ξ) are the instant frequency weighted accelerations in each axis
c1,2,3 are multiplying coefficients dependent on the specific application
T is the measurement time.
A1smx
Maximum value of the time average (exponential) of the frequency weighted
acceleration with time constant of 1 second.
A8smx
Maximum value of the time average (exponential) of the frequency weighted
acceleration with time constant of 8 seconds.
A1smn
Minimum value of the time average (exponential) of the frequency weighted
acceleration with time constant of 1 second.
A8smn
Minimum value of the time average (exponential) of the frequency weighted
acceleration with time constant of 8 seconds.
A(1s)
Equivalent value of the frequency weighted acceleration in the measurement time
referenced to 1 second:
⎛1
A(1s ) = ⎜⎜
⎝ T0
T
∫ (c
a (ξ ) + c a
2 2
1 1, w
2
2
2
2, w
(ξ ) + c a
2
3
2
3, w
0
⎞
(ξ ) dξ ⎟⎟
⎠
)
1/ 2
where:
a1,2,3,w(ξ) are the instant frequency weighted accelerations in each axis
c1,2,3 are multiplying coefficients dependent on the specific application
T is the measurement time.
A(8)
Equivalent value of the frequency weighted acceleration in the measurement time
referenced to 8 hours:
⎛ 1
A(8) = ⎜⎜
⎝ T8 h
T
∫ (c
a (ξ ) + c a
2 2
1 1, w
2
2
2
2, w
(ξ ) + c a
0
2
3
2
3, w
⎞
(ξ ) dξ ⎟⎟
⎠
)
1/ 2
where:
a1,2,3,w(ξ) are the instant frequency weighted accelerations in each axis
c1,2,3 are multiplying coefficients
T8h = 28800 is the number of seconds in 8 hours.
MTVV
Maximum value of the time average (linear) of the frequency weighted acceleration calculated in the last second.
CFeq
Crest factor calculated as ratio between the maximum peak value and the time
average of the frequency weighted acceleration:
CFeq =
Pk mx
⎞
⎛1T 2 2
⎜ ∫ c1 a1, w (ξ ) + c 22 a 22, w (ξ ) + c32 a32, w (ξ ) dξ ⎟
⎟
⎜T
⎠
⎝ 0
(
)
1/ 2
where:
Pkmx is the maximum peak value of the frequency weighted acceleration vector
a1,2,3,w(ξ) are the instant frequency weighted accelerations in each axis
c1,2,3 are multiplying coefficients dependent on the specific application
T is the measurement time.
-
69
-
CFmx
Maximum value of the Crest factor CF calculated as ratio between the instant peak
value and the time average of the frequency weighted acceleration in the last
second.
MTVVr
Ratio between the maximum value calculated in the last second (MTVV) and the
time average (linear) of the frequency weighted acceleration calculated in the
measurement time:
MTVVr =
MTVV
⎞
⎛1
⎜ ∫ c12 a12, w (ξ ) + c 22 a 22,w (ξ ) + c32 a32, w (ξ ) dξ ⎟
⎟
⎜T
⎠
⎝ 0
T
(
)
1/ 2
where:
a1,2,3,w(ξ) are the instant frequency weighted accelerations in each axis
c1,2,3 are multiplying coefficients dependent on the specific application
T is the measurement time.
PROFILE Screen page (only single axis parameters):
Parameter Description
Pkmx
Maximum peak value of the frequency weighted acceleration.
Aeq
Time average (linear) of the frequency weighted acceleration calculated in the
measurement time:
⎞
⎛1T 2
Aeq = ⎜⎜ ∫ a w (ξ )dξ ⎟⎟
⎠
⎝T 0
1/ 2
where:
aw(ξ) is the single axis frequency weighted instant acceleration
T is the measurement time.
A1smx
Maximum value of the time average (exponential) of the frequency weighted
acceleration with time constant of 1 second.
A8smx
Maximum value of the time average (exponential) of the frequency weighted
acceleration with time constant of 8 seconds.
A1smn
Minimum value of the time average (exponential) of the frequency weighted
acceleration with time constant of 1 second.
A8smn
Minimum value of the time average (exponential) of the frequency weighted
acceleration with time constant of 8 seconds.
The parameter selected in the PROFILE mode is used for the statistical analysis.
The attribute of the parameters that can be displayed in the VLM and PROFILE modes
indicates the related frequency weighting.
APPLICATION
Hand-Arm (HA)
Whole Body (WB)
Building Vibrations (BV)
FREQUENCY WEIGHS
Fz, Fc, Wh
Fz, Fa, Wb, Wc, Wd, We, Wj, Wk
Fz, Fm, Wm
Fz:
Fa:
Fc:
Fm:
Flat weighting on the entire frequency range
Band limitation filter for whole body measurements: 0.4Hz ÷ 100Hz
Band limitation filter for Hand-Arm system measurements: 6.3Hz ÷ 1250Hz
Band limitation filter for vibrations transmitted by buildings measurements: 0.8Hz ÷
100Hz
Wb: filter for the measurement of the whole body vertical acceleration (z axis) for standing,
sitting or supine people (ISO 2631-4)
Wc: filter for the measurement of the whole body horizontal acceleration (x axis) transmitted
from back to sitting people (ISO 2631-1)
-
70
-
Wd: filter for the measurement of the whole body horizontal acceleration (x or y axis), for
standing, sitting or supine people (ISO 2631-1)
We: filter for the measurement of the whole body angular acceleration (all directions) for sitting people (ISO 2631-1)
Wh: filter for the measurement of the acceleration transmitted to the hand-arm system (all
directions) (ISO 5349-1)
Wj: filter for the measurement of the head vertical acceleration (x axis) for supine people
(ISO 2631-1)
Wk: filter for the measurement of the whole body vertical acceleration (z axis) for standing,
sitting or supine people (ISO 2631-1)
Wm: filter for the measurement of the buildings transmitted acceleration (all directions) (ISO
2631-2)
The acceleration values can be displayed also as acceleration level in decibel using the relation:
Lw = 20 log
aw
a0
where:
aw is the frequency weighted acceleration
a0 is the reference acceleration equal to 10-6 m/s2 (ISO 1683).
The measurement parameters can be displayed with different units.
SYMBOL
Pk
Pkmx
AeqS
Aeq
A1s
A8s
A1smx
8smx
A1smn
A8smn
A(1s)
A(8)
MTVV
VDV
VDV,d
MEASURE PARAMETER
DESCRIPTION
Instant peak
Maximum peak value in the measurement time
Average acceleration value calculated every
second with linear integration
Average acceleration value linearly integrated in
the measurement time
Average acceleration value calculated every
second with a time constant equal to 1 second
Average acceleration value calculated every
second with a time constant equal to 8 seconds
Maximum value of the average acceleration
calculated every second with 1s time constant
Maximum value of the average acceleration
calculated every second with 8s time constant
Minimum value of the average acceleration
calculated every second with 1s time constant
Minimum value of the average acceleration
calculated every second with 8s time constant
Value referenced to 1 second of the acceleration
linearly integrated in the measurement time
Value referenced to 8 hours of the acceleration
linearly integrated in the measurement time
Maximum value of the average acceleration
linearly integrated every second
Vibrations dose value linearly integrated in the
measurement time
Value referenced to 8 hours of the vibrations
dose linearly integrated in the measurement time
-
71
-
MEASURE UNIT
m/s2, cm/s2, ft/s2, in/s2,
g, dB
m/s1.75
SYMBOL
CFeq
CF
CFmx
VDVr
MTVVr
OL
UR
MEASURE PARAMETER
DESCRIPTION
Crest factor calculated as ratio between the
maximum peak and the average of the acceleration. It is calculated in the measurement time
Instant crest factor calculated as ratio between
peak and average value of the acceleration in 1
second
Maximum instant crest factor value calculated as
ratio between peak and average value of the acceleration in 1 second. It is calculated in the
measurement time
Ratio between vibrations dose and the average
value of the acceleration linearly integrated in the
measurement time
Ratio between the maximum value of average
acceleration integrated every second and the
average
acceleration
integrated
in
the
measurement time. The acceleration integration
is linear.
Overload time percentage during measurement
Under-range time percentage during measurement
-
72
-
MEASURE UNIT
without dimension
%
DIRECT PRINTER CONNECTION
The HD2030 analyzer can print the
visualized levels in a format compatible with
that of a portable printer with 24 columns like
the HD40.1 printer.
The printer has to be connected to the
serial port of the instrument.
Printer and vibrations analyzer must
be properly configured.
HD2030 configuration
1. Set the parameter MENU >> General >>
Input/Output >> RS232 Baud Rate: 38.4k.
2. Set the parameter MENU >> General >>
Input/Output >> Serial Dev.: RS232.
Printer configuration
1. The communication speed of the printer
(Baud Rate) must be equal to the one set in the analyzer (38400 baud).
This is the only parameter requested for the HD40.1 printer.
The other connection parameters for printers different from the HD40.1 are:
2. Data bits: 8.
3. Parity: none.
4. Stop bit: 1.
5. Flow control (Handshaking): Hardware.
6. Automatic paper advance (Autofeed): enable.
Connect the HD2030 to the printer using the HD2110CSNM cable.
To proceed with the data printing:
• Switch on the instrument.
• Enter the MENU >> General >> Input/Output and set the item:
o
Print type =
VLM for printing the numerical parameters visualized in the VLM screen,
SPC for printing the octave or third-octave bands levels,
VLM+SPC for printing both.
• Start the measurement: when the instrument enter the stop mode, the data are automatically printed.
• To disable the printing, set the menu item Print Type = OFF.
-
73
-
CONNECTION TO A PC WITH USB INTERFACE
The HD2030 can be connected to the USB port of a PC using the CP22 cable.
The connection through the USB port requires the installation of a driver supplied with
the Noise Studio Software.
Before connecting the instrument to the USB port of the PC, install the Noise
Studio software.
Proceed in the following way:
1.
Install the Noise Studio software.
2.
Set in the instrument the menu item “MENU >> General >> Input/Output >> Serial Dev.” to “USB”. Confirm and exit from the menu.
3.
Connect the device to the USB port of the PC. When Windows recognizes the new device,
“The new hardware guided installation” starts.
4.
If it asks for the authorization to search an updated driver, answer NO and proceed.
5.
In installation windows, select the option “Install from a list or specific path”.
6.
In the next window, select the options “Search the best available driver in these paths” and
“Include the following path in the search”.
7.
With the “Browse” key, indicate the FTDI installation folder that, by default is:
C:\NoiseStudio\FTDI\
Confirm with OK.
8.
If it appears the message that the software didn’t pass the Windows Logo testing, select
“Continue”.
9.
The USB drivers are installed: at the end press “End”.
10. The installation program asks for the file location a second time: repeat the steps
already described and indicate the location of the same folder (see point 7).
11. Wait: the operation can last a few minutes.
12. The installation process is completed: at any next connection the analyzer will be
recognized automatically.
In order to check if the operation has been completed correctly, from CONTROL PANEL
click twice on the SYSTEM icon. Select the “Peripherals” screen and connect the instrument to
the USB port.
The following items have to appear:
•
“USB Composite Device >> FT2232C Dual 232A Test Board” and “Ports (COM and LPT)
>> USB-Serial Port (COM#)” for operating systems Windows 98 and Windows Me,
•
“Controller USB >> USB Serial Converter” and “Ports (COM e LPT) >> USB-Serial Port
(COM#)” for operating systems Windows 2000, NT and Xp.
When the USB cable is disconnected, these two items disappear and when the instrument
is connect again they reappear.
Notes.
1. If the analyzer is connected to the USB port before the installation of the Noise Studio
software, Windows signals the presence of an unknown device: in this case cancel the operation and install the software.
2. In the documentation supplied with the CDROM there is a detailed version with images of
this chapter. There are also indicated the steps necessary to remove the USB drivers.
-
74
-
ACCELEROMETERS DESCRIPTION
The accelerometers for the HD2030 can be Triaxial or Monoaxial type with integrated
electronics (IEPE type or compatible).
The accelerometers are current supplied with a polarization voltage of 25V and a maximum current of 2mA.
In order to do the different types of vibrations measurements (hand-arm system, whole
body or vibrations transmitted by the buildings), it is necessary to couple the accelerometer to
the source.
On request, apposite accessories can be supplied, listed later in this chapter.
The following accelerometer models are available (see also the “Accelerometers
technical features” paragraph):
HD3023A2
Miniature triaxial accelerometer with integrated electronics (LIVMTM)
that is usually used for hand-arm measurements.
It has a nominal sensitivity of 10mV/g and a measurement range of
±500g.
10-32 UNF threaded hole. The mounting screw HD6200 is included.
The accelerometer is connected to the right triaxial input of the
HD2030 through the HD2030CAB3-xM cable (not included).
HD3263M8
Miniature triaxial accelerometer for the measurement of the vibrations
transmitted to the hand-arm system or to the whole body.
Sensitivity 100mV/g, range ±50g, weight 5.6g.
4-40 UNC threaded hole.
The dual threading from 4-40 UNC to 10-32 UNF mounting screw
made of copper-beryllium alloy (HD6307) is included.
The accelerometer is connected to the right triaxial input of the
HD2030 through the HD2030CAB3-xM cable (not included).
HD5313M2
Low profile triaxial accelerometer with integrated electronics
(LIVMTM) inserted in a rubber pad.
This sensor is usually used for the measurement of the vibrations transmitted to the whole body through the seat.
It has a nominal sensitivity of 100mV/g and a measurement
range of ±50g.
The 1.5 m connecting cable is included.
-
75
-
HD3056B2
Monoaxial accelerometer with integrated electronics (LIVMTM).
This sensor is suitable for general use.
It has a nominal sensitivity of 100mV/g and a measurement
range of ±50g.
10-32 UNF threaded hole. The mounting screw HD6200 is included.
The accelerometer is connected to the left monoaxial input of
the HD2030 analyzer through the HD2030CAB1-xM cable or to
the right triaxial input through the HD2030CAB1B and
HD2030CAB13 cables (not included).
HD3200B5T
Monoaxial accelerometer with integrated electronics (LIVMTM).
This sensor is usually used for hand-arm measurements when
the peak acceleration exceeds the dynamic range of the
HD3023A2 model, or for shock measurements
It has a nominal sensitivity of 100mV/g and a measurement
range of ±50g.
The 10-32 UNF mounting screw is integrated.
The accelerometer is connected to the left monoaxial input of
the HD2030 analyzer through the HD2030CAB1 cable (not included) or to the right triaxial input through the HD2030CAB1B
and HD2030CAB13 cables (not included).
HD3233A
High sensitivity triaxial accelerometer with
integrated electronics (LIVMTM).
Usually it is used for the measurement of
the
vibrations
transmitted
by
the
buildings.
It has a nominal sensitivity of 1V/g and a
measurement range of ±50g.
The M4x20 mounting screw and a washer
are included. It requires the HD2030CAB3xM cable for the connection to the right
input of the analyzer.
-
76
-
ACCESSORIES
A series of adapters is available for the hand-arm type measurements and also supports
for the measurement on vibrating surfaces.
HD2030AC1
It is a cube-shaped adapter for mounting the accelerometers
on the tools handle. The adapter has to be fastened with
plastic cable-tie or metallic clamp as close as possible to the
handle holding hand. Made of light alloy, it is suitable for light
tools, where the weight of the measurement system must be
minimized.
To be coupled for example with the HD3023A2 triaxial
accelerometer.
HD2030AC2
The adapter, inserted between the hand and
the handle, is pushed against the handle by
the hand itself. Because the accelerometer is
placed in a lateral position, the measurement
must be repeated placing the accelerometer
both on the right and left side of the hand.
Suitable for large cylindrical handles.
Material: light alloy.
To be coupled for example with the
HD3023A2 triaxial accelerometer.
HD2030AC3
The adapter, inserted between the hand and
the handle, is pushed against the handle by
the hand itself. Because the accelerometer is
placed in a lateral position, the measurement
must be repeated placing the accelerometer
both on the right and left side of the hand.
Suitable for large cylindrical handles and for
accelerometers with integrated screw like for
example the HD3200B5T.
Material: inox.
HD2030AC4
The adapter, inserted between the hand and the handle, is pushed
against the handle by the hand itself. The accelerometer is placed in
central position between the middle-finger and the ring-finger or between the forefinger and the middle-finger. Suitable for anatomical
handles even if not cylindrical or with small dimensions.
Material: light alloy.
To be coupled for example with the HD3023A2 triaxial accelerometer.
-
77
-
HD2030AC5
Support suitable for measurements on the floors and other
vibrating surfaces.
Three different fixing points are provided:
• In the cavity placed in bottom side of the support;
• In the central hole placed under the adapting cube;
• On the adapting cube fixed on the upper side.
To access the cavity, unscrew the three screws that close
the bottom. The sensor to use is the HD3233A and it has
to be oriented in a manner that the writings on its surface,
when the support is in the working place, are pointing
downwards.
To tight the screw supplied with the accelerometer, use a
dynamometric key applying a torque of about 1.7Nm.
The connection cable must be passed through the side hole,
as visible in the picture.
If necessary, act on the two moving feet to correct the horizontal position of the support: use the leveling device as
reference.
To facilitate the analysis of the measured signals, it is advisable to mark on the upper
surface of the support, the mutual position of the sensor axes.
With the support it is supplied an adapting cube to be fixed on the top side, to connect
three high sensitivity monoaxial accelerometers. This solution is useful when the sensitivity of
the HD3233A triaxial sensor is not sufficient.
Removing the adapting cube, it is possible to access a 10-32 UNF threaded hole for the
sensor fixing, for example of an HD3056B2 accelerometer.
-
78
-
CONNECTORS DESCRIPTION
Front panel connectors
The following figure indicates the connectors in the HD2030 front panel.
Right connector
Identified with R letter, it is a male connector with 4 poles LEMO-B type for the connection of a
triaxial or monoaxial accelerometer with integrated electronics (IEPE type or compatible). The
pin numbering is seen from outside.
PIN
DESCRIPTION
1
2
Ground
Accelerometer channel #3
3
4
Accelerometer channel #2
Accelerometer channel #1
LINE connector
Identified with AC_OUT indication, it is a 6 poles connector LEMO-B type for the analog outputs (LINE) of the 4 accelerometric channels.
The pin numbering is seen from outside
PIN
DESCRIPTION
1
2
Ground
Line Output #1
3
Line Output #2
4
5
6
Line Output #3
Line Output #4
Audio output
Left connector
Identified with L letter, it is a male connector with 4 poles LEMO-B type for the connection of a
monoaxial accelerometer with integrated electronics (IEPE type or compatible).
The pin numbering is seen from outside
PIN
DESCRIPTION
1
2
3
4
Ground
Accelerometer channel #4
Not connected
Not connected
-
79
-
Trigger Connector
Male connector with 4 poles LEMO-00type for the trigger function, it is identified with TRG indication. The trigger input is differential type.
The pin numbering is seen from outside.
PIN
DESCRIPTION
1
2
3
4
Negative input of trigger
Trigger output
Ground
Positive input of trigger
Headphones jack
Jack (Ø3.5mm) type output for the connection of the headphones.
Audio Signal
Ground
Audio Signal
Microphone jack
Jack (Ø3.5mm) type input pin for the microphone.
NC
Ground
Audio Signal
Base panel connectors
Following is the description of the connectors present in the base panel of the HD2030.
-
80
-
Power supply connector
Male connector for external power supply (∅ 5.5mm-2.1mm pin).
It requires a 9…12Vdc/300mA power supply.
The positive of the power supply is supplied to central pin.
MiniDin 8 poles connector
MiniDin 8 poles connector for RS232C serial port. For the connection use the null-modem
dedicated serial cable (HD2110CSNM code), provided with a subD 9 poles connector.
Note: inserting the connector, be sure that the arrow printed its on surface is upwards.
The connector description is indicated in the “SERIAL INTERFACE” chapter.
USB Connector
USB connector type B for the connection of the vibration analyzer to the USB port of a PC with
CP22 code cable.
The pin numbering is seen from outside.
PIN
DESCRIPTION
1
2
3
4
+5Vdc
Data Data +
Ground
-
81
-
INSTRUCTIONS FOR THE CONNECTION OF THE HD2030 TO A
PC WITH WINDOWS OPERATING SYSTEM
This chapter describes in detail the necessary operations to transfer the data from the
HD2030 to the PC where it is installed the Windows operating system using the HyperTerminal
program: how to connect the analyzer to the PC, how to set the transmission parameters in
the PC and in the device.
If using the Noise Studio software, refer to the manual supplied with software
package and not to what it is indicated below.
HARDWARE CONNECTION
1. The analyzer must be disconnected from the PC.
2. Switch on the instrument and set the connection type, RS232 or USB [MENU key >>Settings >> General >> Input/Output >> Serial Dev.].
3. For the USB connection it is necessary to install the drivers in the CDROM supplied with the
instrument (see “CONNECTION TO A PC WITH USB INTERFACE” chapter).
4. Connect the serial port of the analyzer to a free serial port (COM or USB type) of the PC
using the HD2110CSNM cable for the RS232 interface and CP22 for the USB interface.
5. Set the baud rate to 115.2k [MENU key>> Settings >> General >> Input/Output >>
RS232 BaudRate].
Note on the use of USB port: USB driver supplied with the HD2030 adds a new COM serial
port to the ones supplied with the PC. This virtual port works as a normal serial port and appears in the serial ports list that the PC uses. So what it is specified it is also valid for this kind
of ports. Any functioning anomaly is due to the driver that simulates the port.
WINDOWS 98, NT, ME, 2000 AND XP SOFTWARE CONNECTION
A) After the startup of WINDOWS select START >> PROGRAMS >> ACCESSORIES >> COMMUNICATIONS>> HyperTerminal.
Run HYPERTRM.EXE (double click).
B) Communication name:
• In the “Connection Description” window assign a name to the communication that you
want to activate and select an icon (it will be possible, during the next communications,
to activate directly the chosen icon instead of HYPERTRM.EXE, restoring automatically all
the settings saved with the icon).
• OK to confirm.
• At the next window, press Cancel.
C) Communication settings:
• In HyperTerminal window select FILE >> PROPERTIES (1 click), it is visualized the
“Properties” windows.
• In the “Connect to” tab choose, for the Connect property, “directly to COM#" selecting
the serial port to be used for the communication with the instrument.
• Always in the “Connect to” folder select CONFIGURE (1 click), it appears “Properties –
COM1” folder.
• Select:
BITS PER SECOND:
115200, (See the note below)
DATA BIT:
8
PARITY:
None
STOP BIT:
1
FLOW CONTROL:
Hardware
OK to confirm the setting of the port (1 click).
-
82
-
In the same window PROPERTIES >>SETTING:
• select "Emulation": TTY.
• Press OK to confirm the set “Properties” (1 click).
Warning: for correct communication between the HD2030 and the PC, it is necessary that
the data “Bits per second” (transmission speed) in the HyperTerminal and the
Baud rate in the instrument are set to the same value.
To transfer the data with the maximum speed, it is suggested to use the highest baud
rate value possible (115200 baud).
Only if a not standard connection cable, longer than a few meters, between the instrument and the PC is used, and there are some data downloading problems, it is suggested to
reduce the baud rate value.
D) If it is necessary to modify the character type :
• in the HyperTerminal window, select DISPLAY >> CHARACTER (1 click), it appears the
Character Type selection window, set : Terminal.
• As Style select: Normal
• Set Dimension to 9 or 11
• OK to confirm (1 click).
E) To receive the instrument data:
• in the HyperTerminal window, select CALL >> CONNECT (or CALL, depending on the operating system in use).
In this way it is possible to see on the monitor the characters sent by the analyzer.
F) To save the data received from the instrument:
• in the HyperTerminal window, select TRANSFER >> TEXT CAPTURE (1 click), it appears
the windows to set the name of the file where the received data will be memorized: insert in the proper line the name of the file where you want to save the received data.
• START to set the reception file name (1 click).
Now the HyperTerminal software is able to receive the data from the analyzer and to
memorize them in the set file.
G) Switch on the HD2030.
• Enter the menu MENU >> Settings>> General >> Input/Output and set the item Print
results to ON.
• Select the type of print with the next command Type of Print (see the details in the
menu description).
• Start the measurement: at the end when the instrument enters the STOP mode, the
data are sent automatically to the printer.
H) To end the data reception from the analyzer:
• in the HyperTerminal window, select TRANSFER >> TEXT CAPTURE (1 click): in the
submenu select FINISH (1 click).
Now the data reception from the device is ended and the file saved in the computer can be
managed with software packages for WINDOWS.
I) To end the execution of HyperTerminal:
• in the HyperTerminal window, select FILE >> ESC (1 click).
• YES (1 click) if you want to save the settings of the communication done.
-
83
-
TECHNICAL SPECIFICATIONS
The HD2030 vibrations analyzer is able to detect the accelerations in four axis.
The sensors that can be connected are IEPE type with amplifying integrated electronics,
triaxial or monoaxial type.
Three axes are grouped in the right channel that supports triaxial or monoaxial type accelerometers; the fourth axis is associated with the left channel that supports monoaxial
accelerometers. The instrument analyzes the signal provided by the accelerometers and elaborates the four axes data at the same time. The instrument perform octave or third-octave
bands spectrum analysis and statistical analysis.
The HD2030 vibrations analyzer complies with the following Rules:
• ISO 8041:2005 “Human response to vibration – Measuring instrumentation”
• ISO 5349-1:2001 “ Mechanical vibration – Measurement and evaluation of human exposure to hand-transmitted vibration – General requirements”
• ISO 5349-2:2001 “ Mechanical vibration – Measurement and evaluation of human exposure to hand-transmitted vibration – Practical guidance for measurement at the
workplace”
• ISO 2631-1:1997 “Mechanical vibration and shock – Evaluation of human exposure to
whole body vibration – General requirements”
• ISO 2631-2:1989 “Evaluation of human exposure to whole body vibration – Continuous
and shock-induced vibrations in buildings (1 to 80 Hz)”
• IEC 61260:1995 “Electroacoustics – Octave band and fractional-octave band filters”
Accelerometers models
It is possible to connect triaxial or monoaxial accelerometers with integrated electronics
(IEPE type or equal). The accelerometers are current supplied with a polarization voltage
of 25V and a maximum current of 2mA. With the HD2030 analyzer can be supplied the
following accelerometers:
• HD3023A2 model: miniature triaxial accelerometer, manufactured by Dytran, with
nominal sensitivity 10mV/g and maximum acceleration 500g. This sensor is usually used
for the measurement of the vibrations transmitted to the hand-arm system.
• HD3263M8 model: miniature triaxial accelerometer, manufactured by Dytran, with
nominal sensitivity 100mV/g and maximum acceleration 50g. The sensor is used for the
measurement of the vibrations transmitted to the hand-arm system or to the whole
body.
• HD5313M2 model: triaxial accelerometer, manufactured by Dytran, with nominal sensitivity 100mV/g and maximum acceleration 50g. This sensor, inserted in a round rubber
pad, is usually used for the measurement of the vibrations transmitted to the whole body
thought the seat.
• HD3056B2 model: monoaxial accelerometer, manufactured by Dytran, with nominal
sensitivity 100mV/g and maximum acceleration 50g. This sensor is usually used for the
measurement of the vibrations transmitted to the whole body.
• HD3200B5T model: monoaxial accelerometer, manufactured by Dytran, with nominal
sensitivity 1mV/g and maximum acceleration 5000g. This sensor is usually used for the
measurement of the vibrations transmitted to the hand-arm system when the HD3023A2
model has not a sufficient dynamics or when there are high shock levels.
• HD3233A model: triaxial accelerometer, manufactured by Dytran, with nominal
sensitivity 1V/g and maximum acceleration 50g. This sensor is usually used for the
measurement of the vibrations transmitted by the buildings.
-
84
-
Accessories
The following accessories are supplied on request:
• HD6188: tube of hydro-repellent silicone grease and electrically insulating.
• HD6273: tray with bonding wax.
• HD6200: screw with double thread 10-32 UNF-2A. It is included in the HD3023A2 and
HD3056B2 accelerometers.
• HD6202: screw with double thread 10-32 UNF-2A and M5 X 0.8.
• HD6203: screw with double thread 10-32 UNF-2A and M6 X 1.
• HD6207: screw with double thread 10-32 UNF-2A and 4-40 UNC.
• HD6239: accelerometer push-rod.
• HD6286: adhesive metallic plate for assembly through magnet. Used to magnetically
couple the accelerometer on non-metal surfaces.
• HD6284: insulated magnetic base with 10-32 UNF-2A threaded hole.
• HD6196: magnetic base with integrated 10-32UNF screw.
• HD6226: adhesive base with threaded thru-hole (10-32 UNF).
• HD6245: adhesive insulated base with integrated screw 10-32 UNF.
• HD6220: insulated base with integrated mounting 10-32 UNF-2A screw and threaded
hole 10-32 UNF-2A for accelerometer assembly.
METROLOGIC FEATURES
The HD2030 vibrations analyzer can perform measurement on the hand-arm system, the
whole body or vibrations transmitted by the buildings. The weighting filters and the frequency
range of the filters with constant percentage octave or third-octave band depend on the chosen analysis mode.
Frequency Weighting for RMS measurements:
Fz, Fc e Wh for the measurement on the hand-arm system
Fz, Fa, Wb, Wc, Wd, We, Wj, Wk for the whole body measurements
Fz, Fm e Wm for the measurements of vibrations transmitted by the buildings.
The Fz weighting is flat on all the frequency range with the following features:
Fz
High-pass OFF
Attenuation
[dB]
Frequency range
[Hz]
< 0.1
<1
<3
1.25 ÷ 1600
0.4 ÷ 3200
0.2 ÷ 3700
Activating the High Pass filter (Menu >>Settings >> General >> Measures >> High Pass)
the Fz ponderation have the following features:
Fz
High-pass ON
Attenuation
[dB]
Frequency range
[Hz]
< 0.1
<1
<3
4 ÷ 1600
1.25 ÷ 3200
0.7 ÷ 3700
-
85
-
The Fa, Fb and Fc ponderations are Band-pass filters with the following features (High-Pass
OFF):
Filter
Band Limits (to -3dB)
[Hz]
0.4 ÷ 100
0.4 ÷ 1250
6.3 ÷ 1250
Fa
Fb
Fc
The Wb, Wc, Wd, We, Wj, Wk and Wm filters respect ISO 8041:2005 Rule.
Octave or third-octave bands spectral Analysis
The constant percentage band filters comply with the rule IEC 61260. The range of the
central frequencies depends on the selected application as reported in the following table.
Central frequencies range
Application
Octave bands
Third-octave bands
[Hz]
Hand-Arm
Whole body
Building vibration
4 ÷ 2000
0.5 ÷ 250
0.5 ÷ 250
3.15 ÷ 3150
0.315 ÷ 315
0.315 ÷ 315
Self generated noise
The intrinsic noise, for the different frequency ponderations and for constant percentage
bands, both in octave and third-octave, is measured short-circuiting the input channels.
For the Hand-Arm measurements, the detected values are indicated in the following tables:
HAND ARM
Fz
Fc
17
10
Weightings
[uV]
Center frequency
octave bands
[Hz]
[uV]
Center frequency
third-octave bands
[Hz]
[uV]
Center frequency
third-octave bands
[Hz]
[uV]
Center frequency
third-octave bands
[Hz]
[uV]
Wh
7
4
8
16
32
63
125
250
500
1000
2000
4
4
3
3
4
4
4
5
6
7
3.2
4
5
6.3
8
10
12.5
16
20
25
2
2
2
2
2
2
2
2
2
2
32
40
50
63
80
100
125
160
200
250
315
2
2
2
2
2
2
2
2
2
3
3
400
500
630
800
1k
1.3k
1.6k
2k
2.5k
3.2k
3
3
3
3
3
4
4
5
5
5
-
86
-
For Whole-Body measurements, the detected values are indicated in the following tables:
Weightings
[uV]
Central Frequency
octave bands
[Hz]
Self generated Noise
[uV]
Central Frequency
third-octave bands
[Hz]
Self generated Noise
[uV]
Central Frequency
third-octave bands
[Hz]
Self generated Noise
[uV]
Central Frequency
third-octave bands
[Hz]
Self generated Noise
[uV]
Fz
21
Fa
14
WHOLE BODY
Wb
Wc
8
13
Wd
13
We
11
Wj
10
Wk
9
0.5
1
2
4
8
16
32
63
125
250
8
6
5
3
5
2
2
3
3
3
0.32
0.4
0.5
0.63
0.8
1
1.25
1.6
2
2.5
5
5
4
4
4
4
3
3
3
2
3.2
4
5
6.3
8
10
12.5
16
20
25
2
2
2
2
2
2
1
1
1
1
32
40
50
63
80
100
125
160
200
250
315
1
1
1
2
2
2
2
2
2
2
2
For building vibrations measurements, the values are indicated in the following tables:
BUILDING VIBRATIONS
Weightings
Fz
Fm
[uV]
21
13
Wm
10
For the Buildings Vibration measurements, the detected values of the octave and thirdoctave bands noise is the same detected for the Whole Body measurements.
Linearity range
The linearity range is independent from the frequency and it is equal to 80dB. The maximum measurable level depends on the gain of the input amplifier as indicated in the following
table:
Gain
[dB]
0
10
20
Lower Limit
[mVrms]
0.7
0.22
0.07
Upper Limit
[Vrms]
7
2.24
0.7
As an example, following are indicated the linear ranges for two different sensitivity of
the accelerometer.
Gain
[dB]
0
10
20
Linear range with accelerometer
Sensitivity
Sensitivity
10mV/g ∼ 1mV/m/s2
1V/g ∼ 100mV/m/s2
0.7 ÷ 7000 m/s2
117 ÷ 197 dB
0.7 cm/s2 ÷ 70 m/s2
77 ÷ 157 dB
2
0.22 ÷ 2240 m/s
107 ÷ 187 dB
0.22 cm/s2 ÷ 22.4 m/s2
67 ÷ 147 dB
0.07 ÷ 700 m/s2
97 ÷ 177 dB
0.07 cm/s2 ÷ 7 m/s2
57 ÷ 137 dB
-
87
-
Integration Time
The integration time can be set from a minimum of 1s to a maximum of 99 hours.
Crosstalk
The crosstalk between channels is <100dB@1kHz.
Reference conditions
• The measure range is the one with input gain equal to 10dB.
• The level is equal to 10mV corresponding to 140dB or 10m/s2 for an accelerometer with
a sensitivity equal to 10mV/g.
Operating conditions
• Storage temperature: -25 ÷ 70°C.
• Working temperature: -10 ÷ 50°C.
• Protection Degree: IP64.
Drift
• Temperature: ± 0.3dB over the range -10 ÷ 50°C.
ELECTRICAL FEATURES
Pre-heating time
Less than 1 minute.
Power supply
• Internal batteries: 4 x 1.5 V alkaline or NiMH rechargeable batteries type AA. The instrument does not charge the batteries.
• Autonomy: > 10 hours in acquisition (RUN) mode with good quality alkaline batteries.
• External batteries: it is possible to connect an external battery pack to the instrument
through the male connector for external power supply (∅ 5.5mm-2.1mm pin). The positive pole has to be connected to the central pin. The battery has to supply 9÷12V with
at least 300mA/h. The maximum limit for external supply is 15V.
• Mains: mains adaptor with 9÷12Vdc/300mA direct voltage.
• Switching off: automatic, it can be disabled.
When the batteries voltage is less than 3.8V, the instrument is not able to measure.
However, it is still possible to view and download the memorized data.
Under 3.5V the instrument switches itself off automatically. The memorized data, the configuration and the calibration parameters are kept also without power supply.
Maximum input levels
The input signal must be in the range 0V÷25V.
LINE
•
•
•
•
•
outputs
Multi-pole circular connector (LEMO)
Pre-amplified signal not pondered with an gain equal to 0.1V/V.
Linearity: 110dB with maximum output level equal to 1.5Vrms.
Series impedance: 1kΩ
Typical load: 100kΩ
TRGOUT output
• Jack stereo socket ∅ 3.5mm
• Digital output 0 ÷ 3.3V short-circuit protected
• Pull-up impedance : 1kΩ
• Pull-down impedance: 30Ω
-
88
-
TRGIN input (Advanced Analyzer option)
• Jack stereo socket ∅ 3.5mm
• Current input: threshold 0.5mA max 20mA
• Voltage input: threshold 2V max 10V
• Series impedance: 470 Ω
RS232 Serial Interface:
• Socket: MiniDin 8 poles.
• Type: RS232C (EIA/TIA574) not isolated
• Baud rate: from 300 to 115200baud
• Data bit: 8
• Parity: None
• Stop Bit: 1
• Flow Control: Hardware
• Cable length: max 15m
USB Serial Interface:
• Socket: USB-B
• Type: USB 1.1 o 2.0 with 500mA
STATISTIC ANALYSIS
1s sampling.
1dB classes.
Calculation and visualization of the statistical graphs.
Graph of the probability distribution of the levels.
Graph of the percentile levels from L1 to L99.
SPECTRAL ANALYSIS
Channels: 4
Sampling: 8 kHz
Resolution: 25bit
Average spectrum or Multi-spectrum with 1 second sampling time.
Octave bands from 4 Hz to 2kHz for hand-arm measurements and from 0.5Hz to 250Hz for
whole body or buildings measurements.
Third-octave bands from 3.2Hz to 3.2kHz or from 0.32Hz to 315Hz
Ratio of the center frequencies: base 2
VISUALIZATION
Graphic Display
128x64 pixel with 56x38mm wide backlit.
Mode:
VLM_1 and VLM_3 (vibration level meter) screens, each one with 3 parameters at choice
for acceleration measurements related to the single channel.
VLM_2 and VLM_4 (vibration level meter) screens, each one with 3 parameters at choice
for acceleration measurements related to the vector formed by 1,2 and 3 channels.
-
89
-
time profile of a parameter at choice with sampling time from 1s to 1 hour.
Octave or third-octave spectrum.
probability distribution of levels in 1dB classes.
Graph of the percentile levels from L1 to L99.
MEASUREMENTS MEMORIZATION
8MB permanent internal memory FLASH type
Card slot for SD memory type up to 2GByte
Safety of memorized data
Independent from the condition of the batteries charge.
OTHER FEATURES
Print
It is possible to activate the automatic printing of the acquired parameters at the end of the
measurement. The printer must be connected to the RS232 interface.
Slot
• Dimensions (Length x Width x Height): 245x100x50mm,
• Weight: 740g (complete with batteries)
• Materials: ABS, rubber
Time:
Date and time: clock and calendar updated in real time
Maximum deviation: 1min/month
-
90
-
ACCELEROMETERS TECHNICAL FEATURES
HD3023A2 Model
Type:
Sensitivity:
Measure range:
Frequency response:
Resonance frequency:
Linearity:
Transverse sensitivity:
Maximum Shock:
Working Temperature:
Thermal Drift:
Polarization Voltage:
Mechanical features:
• Weight:
• Dims. (mm):
• Mounting:
• Connector:
• Material:
• Isolation:
Triaxial
miniature
accelerometer
with
integrated
electronics (LIVMTM). This sensor is usually used for handarm measurement.
10mV/g
±500g
1.5Hz ÷ 10kHz (-5% / +15%)
40kHz
1% F.S.
5% max
5000g
-50°C ÷ 120°C
0.06%/°C
10Vdc
4gr
(height x width x depth) 12.5x9.15x9.15
hole at the base for screw 10-32 UNF-2A (supplied)
SMA 4-pin lateral
titanium steel
enclosure connected to the ground terminal
HD3263M8 Model
Type:
Sensitivity:
Measure range:
Frequency response:
Resonance frequency:
Linearity:
Transverse sensitivity:
Maximum Shock:
Working Temperature:
Thermal Drift:
Polarization Voltage:
Mechanical features:
• Weight:
• Dims. (mm):
• Mounting:
• Connector:
• Material:
• Isolation:
Miniature triaxial accelerometer with integrated electronics
(LIVMTM). The sensor is usually used for the measurements of the vibrations transmitted to the hand-arm
system or to the whole body.
100mV/g
±50g
0.3Hz ÷ 10kHz (±5%)
40kHz
1% F.S.
5% max
5000g
-50°C ÷ 80°C
0.06%/°C
11Vdc
5.6g
(height x width x depth) 11x12x12
hole at the base for screw 4-40 UNC-2B (supplied)
SMA 4-pin lateral
titanium steel
enclosure connected to the ground terminal
HD5313M2 Model
Type:
Sensitivity:
Measure range:
Frequency response:
Resonance frequency:
Linearity:
Transverse sensitivity:
Low profile triaxial accelerometer with integrated
electronics (LIVMTM) inserted in a rubber pad. This sensor
is usually used for the measurement of the vibrations
transmitted to the whole body thought the seat.
100mV/g
±50g
0.5Hz ÷ 3kHz (±5%)
25kHz
1% F.S.
5% max
-
91
-
Maximum Shock:
Working Temperature:
Thermal Drift:
Polarization Voltage:
Mechanical features:
• Weight:
• Dims.(mm):
• Connector:
• Material:
• Isolation:
1500g
-50°C ÷ 120°C
0.06%/°C
9Vdc ÷ 12Vdc
227gr
(diameter x thickness) 232mm x 12mm
1.5 integrated cable with 4-pin LEMO connector
rubber with central plates in anodized aluminum
>10Mohm between the enclosure and the ground terminal
HD3056B2 Model
Type:
Sensitivity:
Measure range:
Frequency response:
Resonance frequency:
Linearity:
Transverse sensitivity:
Maximum Shock:
Working Temperature:
Thermal Drift:
Polarization Voltage:
Mechanical features:
• Weight:
• Dim.(mm):
• Mounting:
•
•
•
Connector:
Material:
Isolation:
Accelerometer with integrated electronics (LIVMTM). This
sensor is suitable for general use.
100mV/g
±50g
1Hz ÷ 10kHz (±5%)
32kHz
2% F.S.
5% max
2000g
-50°C ÷ 120°C
0.12%/°C
9Vdc ÷ 12Vdc
10gr
(Hex-diameter x height) 12.7mm x 23.1mm
Threaded hole on the base with a depth of 3.8mm for 1032 UNF-2A screw (supplied)
upper micro coaxial 10-32
titanium steel
>10Mohm between the enclosure and the ground terminal
HD3200B5T Model
Type:
Sensitivity:
Measure range:
Frequency response:
Resonance frequency:
Linearity:
Transverse sensitivity:
Maximum Shock:
Working Temperature:
Polarization Voltage:
Mechanical features:
• Weight:
• Dimensions:
• Mounting:
• Connector:
• Material:
• Isolation:
Accelerometer with integrated electronics (LIVMTM). This
sensor is usually used for hand–arm measurements when
the peak acceleration exceeds the dynamic range of
3023A2 model or for shock measurements.
1mV/g
±5000g
0.5Hz ÷ 40kHz (-5% / +5%)
130kHz
1% F.S.
3% max
50000g
-50°C ÷ 120°C
8.5Vdc
6gr
(hex-diameter x height) 12.7mm x 23.1mm
integrated screw 10-32 UNF-2A
upper micro coaxial 10-32
steel
>10Mohm between the enclosure and the ground terminal
-
92
-
HD3233A Model
Type:
High sensitivity triaxial accelerometer with integrated
electronics (LIVMTM). This sensor is usually used for the
measurement of the vibrations transmitted by the
buildings.
1V/g
±5g
0.4Hz ÷ 3kHz (±10%)
20kHz
1% F.S.
5% max
5000g
-50°C ÷ 120°C
0.06%/°C
10Vdc
Sensitivity:
Measure range:
Frequency response:
Resonance frequency:
Linearity:
Transverse sensitivity:
Maximum Shock:
Working Temperature:
Thermal Drift:
Polarization Voltage:
Mechanical features:
• Weight:
28gr
• Dimensions (mm): (height x width x depth) 25.4x33x13.2
• Mounting:
through hole for M4 screw (included)
• Connector:
SMA 4-pin lateral
• Material:
steel titanium
• Isolation:
Body connected to the ground terminal and isolated from
the mounting surface.
-
93
-
REFERENCE RULES
•
•
•
•
•
•
ISO 8041:2005 “Human response to vibration – Measuring instrumentation”
ISO 5349-1:2001 “ Mechanical vibration – Measurement and evaluation of human exposure to hand-transmitted vibration – General requirements”
ISO 5349-2:2001 “ Mechanical vibration – Measurement and evaluation of human exposure to hand-transmitted vibration – Practical guidance for measurement at the
workplace”
ISO 2631-1:1997 “Mechanical vibration and shock – Evaluation of human exposure to
whole body vibration – General requirements”
ISO 2631-2:1989 “Evaluation of human exposure to whole body vibration –
Continuous and shock-induced vibrations in buildings (1 to 80 Hz)”
IEC 61260:1995 “Electroacoustics – Octave band and fractional-octave band filters”
EMC STANDARD RULES
•
•
•
•
•
•
•
Protection degree
Safety
Electrostatic Discharge
Fast Electrical Transients
Voltage Variations
Susceptibility to electromagnetic interference
Electromagnetic interference emissions
IP64
EN61000-4-2, EN61010-1 level 3
EN61000-4-2 level 3
EN61000-4-4 level 3, EN61000-4-5 level 3
EN61000-4-11
IEC1000-4-3
EN55020 class B
ITALIAN LEGISLATION
•
Vibrations in the workplace: : D.Lgs 187 dated 19/08/2005 and 2002-44-CE Directive.
-
94
-
ORDER CODES
HD2030 kit 1: It includes: HD2030 analyzer with four channels, suitcase, Noise Studio Software basic module, serial cable for USB (CP22) ports, 1GM memory card
(HD2030MC), silicone grease (HD6188) and wax tray for gluing (HD6273).
At the time of order, specify the accelerometers,
bles and the accessories.
the connection ca-
Accelerometers
HD3023A2:
Triaxial miniature accelerometer for the measurement of the vibrations
transmitted to the hand-arm system. Sensitivity 10mV/g, range ±500g.
The HD6200 mounting screw is included. It’s necessary to use
HD2030CAB3-xM cable for the connection with the analyzer.
HD5313M2:
Triaxial accelerometer inserted in a rubber pad for the measurement of
the vibrations transmitted to the whole body. 1.5m connection cable to
the analyzer included. Sensitivity 100mV/g, range ±50g.
HD3263M8:
Miniature triaxial accelerometer for the measurement of the vibrations
transmitted to the hand-arm system or to the whole body. Sensitivity
100mV/g, range ±50g. 4-40 UNC threaded hole. The double threaded
from 4-40 UNC to 10-32 UNF mounting screw (HD6307) is included. The
accelerometer is connected to the HD2030 analyzer through the
HD2030CAB3-xM cable (not included).
HD3056B2:
Monoaxial accelerometer for the measurement of the vibrations transmitted to the whole body. Sensitivity 100mV/g, range ±50g. The HD6200
mounting screw is included. It is connected to the left input of the
HD2030 analyzer through the HD2030CAB1 cable (not included) or to the
right input through the HD2030CAB1B and HD2030CAB13 cables (not included).
HD3200B5T:
Monoaxial accelerometer for the measurement of the vibrations transmitted to the hand-arm system at high shock levels. Sensitivity 1mV/g,
range ±5000g. The mounting screw is integrated. It is connected to the
left input of the HD2030 analyzer through the HD2030CAB1 cable (not included) or to the right input through the HD2030CAB1B and
HD2030CAB13 cables (not included).
HD3233A:
Triaxial accelerometer with nominal sensitivity 1V/g and maximum
acceleration 5g. This sensor is usually used for the measurement of the
vibrations transmitted by the buildings. The M4x20 mounting screw and a
washer are included. It requires the HD2030CAB3-xM cable for the
connection to the analyzer.
Supports
HD2030AC1:
Cubic support for the accelerometer mounting on grips through plastic or
metal bands as close as possible to the hand. It is suitable for measurements on small tools where the weight of the measurement chain must
be minimized. Material: light alloy. The adapter can be used with the
HD3023A2 accelerometer.
It includes:
• hex socket screw 10-32UNF
• 4mm hexagonal key
• 10 plastic cable ties, 4.5mm width, 200 mm length
• 1 metallic clamp 9mm width
HD2030AC2:
Adapter to be placed between the hand and the grip. The accelerometer is
fixed in lateral position, at the left or right of the hand. It is suitable for
-
95
-
large cylindrical grips. Material: light alloy. The adapter can be used with
the HD3023A2 accelerometer.
It includes:
• hex socket screw 10-32UNF
• 4mm hexagonal key
• 10 plastic cable ties, 4.5mm width, 200 mm length
• 1 metallic clamp 9mm width
• 2 velcro straps 24.5m width (HD2030FV).
HD2030AC3:
adapter to be placed between the hand and the grip The accelerometer is
fixed in lateral position, at the left or right of the hand. It is suitable for
cylindrical grips with large dimensions and for accelerometer with integrated screw.
Material: inox. The adapter can be used with the
HD3200B5T accelerometer.
It includes:
• 10 plastic cable ties, 4.5mm width, 200 mm length
• 2 velcro straps 24.5m width
HD2030AC4:
adapter to be place between the hand and the grip The accelerometer is
fixed in central position, between the middle-finger and ring-finger or between the forefinger and middle-finger. It is suitable for anatomic grips
even if not cylindrical and with small dimensions.
Material: light alloy. The adapter can be used with the HD3023A2
accelerometer.
It includes:
• hex socket screw 10-32UNF
• 4mm hexagonal key
• 10 plastic cable ties, 4.5mm width, 200 mm length
• 2 velcro straps 25mm width (HD2030FV).
HD2030AC5:
Support for triaxial and monoaxial accelerometers suitable for the
measurement of the vibrations transmitted by floors and vibrating
surfaces in general. It has a leveling device and three support feet, the
height of two of the feet is adjustable. The support has a cavity for the
installation of a triaxial accelerometer with high sensitivity to measure
vibrations in buildings. The upper surface has a 10-32 UNF threaded hole
for the mounting of an accelerometer. For the assembly of three
monoaxial accelerometers it is supplied a cubic adapter to be mounted on
the upper surface. Material: Nickel-plated steel, weight 1.9kg. It can be
used with the HD3233A, HD3263M8 and HD3056B2 accelerometers.
HD2030AC5 includes:
• Steel support with three feet and leveling device. It has a 10-32
UNF threaded hole on the upper surface and a cavity on the bottom
side with M4 threaded hole.
• Cubic adapter to be mounted on the upper surface through two M4
screws (included). The cube has 10-32 UNF threaded holes on three
orthogonal sides.
• 3mm hexagonal key
Accelerometers mounting accessories
HD6188: Tube of hydro-repellent silicone grease and electrically insulating.
HD6273: Tray with bonding wax.
HD6200:
Double thread screw 10-32 UNF-2A. It is included in the HD3023A2
and HD3056B2 accelerometers.
-
96
-
HD6202:
Double thread screw 10-32 UNF-2A and M5 X 0.8
It can be used with the HD3023A2 and HD3056B2 accelerometers.
HD6203:
Double thread screw 10-32 UNF-2A and M6 X 1.
It can be used with the HD3023A2 and HD3056B2 accelerometers.
HD6307
Screw with double threading 4-40 UNC and 10-32 UNF. It is included in the HD3263M8 accelerometer.
HD6239:
Push-rod for accelerometer.
It can be used with the HD3023A2, HD3263M8, HD3056B2 and
HD3200B5T accelerometers.
HD6286:
Adhesive metallic disc. Used to magnetically couple the accelerometer to non-metallic surfaces.
It can be used with the HD3023A2, HD3263M8, HD3056B2 and
HD3200B5T accelerometers.
HD6284:
Small magnetic base with threaded hole 10-32UNF.
It can be used with the HD3023A2, HD3263M8, HD3056B2 and
HD3200B5T accelerometers.
HD6196
Large magnetic base with integrated screw 10-32UNF.
It can be used with the HD3023A2 ed HD3056B2 accelerometers.
HD6226:
Base with threaded thru-hole 10-32 UNF for adhesive mounting.
HD6245:
Insulated Base with integrated screw 10-32 UNF for adhesive
mounting.
It can be used with the HD3023A2, HD3263M8, HD3056B2 and
HD3200B5T accelerometers.
It can be used with the HD3023A2 and HD3056B2 accelerometers.
HD6220:
Insulated Base with integrated mounting screw 10-32 UNF-2A and
threaded hole 10-32 UNF-2A for accelerometers assembly.
It can be used with the HD3023A2 and HD3056B2 accelerometers.
HD2030FV
Velcro strap, width 25mm, length 300mm.
Cables
HD2110CSNM:
PC connection serial cable for COM ports and for the direct connection to
HD40.1 printer.
CP22:
PC connection serial cable for USB ports with A and B type connectors.
HD2030CAB1-3M:
low noise coaxial cable for the connection of monoaxial accelerometers
to the HD2030 analyzer, complete with connectors. 3m length.
-
97
-
HD2030CAB1-5M:
low noise coaxial cable for the connection of monoaxial accelerometers
to the HD2030 analyzer, complete with connectors. 5m length.
HD2030CAB1-10M: low noise coaxial cable for the connection of monoaxial accelerometers
to the HD2030 analyzer, complete with connectors. 10m length.
HD2030CAB3-3M:
cable for the connection of triaxial accelerometers to the HD2030 analyzer, complete with connectors. 3m length.
HD2030CAB3-5M:
cable for the connection of triaxial accelerometers to the HD2030 analyzer, complete with connectors. 5m length.
HD2030CAB3-10M: cable for the connection of triaxial accelerometers to the HD2030 analyzer, complete with connectors. 10m length.
HD2030CAB13:
cable for the connection of three monoaxial accelerometers to the
triaxial input of the HD2030 analyzer, compete with connectors. 40 cm
length with BNC connectors. It is necessary to use a HD2030CAB1B
cable for each accelerometer.
HD2030CAB1B-3M: coaxial cable for the connection of monoaxial accelerometers to the
HD2030CAB13 cable, complete with connectors. 3m length.
HD2030CAB.BNC-xxM: coaxial extension cable for the connection of monoaxial accelerometers to the HD2030CAB13 cable. The maximum cable length is 50m and
both ends are terminated with BNC female connectors.
Other accessories
HD2030MC:
1GB SD memory card.
HD2030AM:
headset with microphone.
SWD10
stabilized power supply 100-240Vac/12Vdc-1A.
VTRAP:
tripod with a maximum height of 1550mm.
HD40.1:
kit including 24-column portable thermal printer, serial interface, paper
width 57 mm, 4 x 1.2V NiMH rechargeable batteries, SWD10 power supply device, 5 rolls of thermal paper and user manual.
BAT-40:
spare battery pack for the printer HD40.1 with temperature integrated
sensor.
kit of four rolls of thermal paper; 57mm width, 32mm diameter.
RCT:
-
98
-
HOW TO SOLVE THE PROBLEMS
The HD2030 analyzer is equipped with a diagnostic program (DIAGNOSTIC CHECK) that
checks automatically the main instrument parameters. To run the program and check the analyzer functions, press the keys MENU >> Programs >> Diagnostic Checks (see “PROGRAMS
DESCRIPTION” chapter).
If the DIAGNOSTIC CHECK fails:
Repeat it with new batteries after waiting the stabilization time (at least 1 minute) and, if
the problem persists, contact the technical service.
RESTORE OF FACTORY SETUP
The factory configuration of the analyzer parameters (factory setup) can be recalled
through a key combination. This operation does not cancel the content of the data
memory.
With the instrument switched off, turn on the HD2030 keeping the ENTER key pressed.
All the parameters present in the menu are simultaneously set to the factory default.
VARIOUS PROBLEMS
If the CALIBRATION program with the calibrator fails:
Make sure the analyzer is not subjected to noise and/or high vibrations.
Repeat after the waiting the stabilization time and, if the problem persists, contact the
technical service.
After changing the batteries, the instrument does not switch on.
Remove one of the batteries and wait 5 minutes before inserting it again. The instrument should switch itself on automatically when the missing battery is inserted.
The levels detected by the analyzer seem not corrected.
Make sure there is no condensation. Do not turn on the instrument if there is the
probability of condensation.
Wait for the measures stabilization time.
Check the accuracy of the measurement with the calibrator.
The analyzer switches itself off automatically after the startup screen.
The batteries are discharged.
The instrument does not communicate with PC:
If you are using a communication program like Hyperterminal, check that the communication speed of the PC and HD2030 are the same (Menu >> Settings >>
General >> Input/Output >> Baud rate).
Check that the connection cable is correctly inserted and it is connected to a RS232
serial port or USB of PC
Check that the item MENU>> Settings >> General >> Input/Output >> Serial Dev.
is set to the port type in use: RS232 or USB.
If using the USB interface, check if the driver is correctly installed.
If you are using Noise Studio software, try to disable the Auto Detect function (Menu
Option >> Port Settings) and set the connection directly to the COM where the instrument is connected.
It is not possible to activate the continuous recording. Pressing REC and RUN keys the analyzer
starts the measurement without recording.
The instrument has no available memory for further data. Download the data and/or
erase the memory.
-
99
-
KEYBOARD DESCRIPTION
HOLD key
The HOLD key can be used to stop temporarily the display updating while the analyzer
still continues with the requested measurements. A “H” in the upper left corner indicates that
the display is in this mode. Press again the key to go back to the normal measure.
While the device is in HOLD, it is possible to switch from a screen to another, activate the
cursors of the graphic screens, print and save the data.
The recording is not affected by the HOLD status.
ON/OFF key
The instrument switching on and off can be done pressing, for at least a second, the
ON/OFF key. At startup the analyzer briefly shows the Delta Ohm logo and the program version. Then it is requested to select the configuration for the sensors that are connected to the
two inputs: first the triaxial right input and then the monoaxial left one.
RIGHT
PROD:
MOD:
SERIAL:
TYPE:
SENS:
RANGE:
CONFIG. #02
DELTA OHM
ACC_TRI
123456
ACC TRI
10mV/g CAL
500 gpk
SEL.
PREV.
NEXT
For both inputs press PREV or NEXT to scroll the list of the sensors that are in memory,
SEL to confirm the visualized configuration.
Then the instrument enters the VLM (Vibration Level Meter) working mode, visualizing in
numerical form 3 instant or integrated parameters.
If there is an external memory card, after the initial screen, the sensors configuration file
is loaded and it appears the following screen:
-
100
-
MC INSTALLED
AND READY TO USE
Size:
500MB
ESC
RD
RD/WR
Press RD/WR to enable all the reading and writing functions and proceed with the selection of the configurations.
Before switching off the instrument, it is necessary to stop the current measurement
pressing the STOP key. Otherwise a message requesting to stop the current measurement,
appears:
WARNING!
Stop measurement
before continue
YES
NO
Pressing YES, the instrument enters the STOP mode and it is possible to switch it off with
the ON/OFF button.
"Auto-Power Off" Function
The Auto-Power Off function works if instrument remains in STOP mode for at least 5
minutes without pressing any key. Before switching itself off, a series of warning beeps are
emitted: in this phase, if desired, it is possible to press a key to avoid the switching off.
The function can be disable through the MENU acting on the “Auto-Switching Off” item
(MENU >> Settings>> General >> System >> Auto-Power Off = OFF). In this case the battery symbol blinks to remind that the instrument will not switch itself off automatically but only
pressing the <ON/OFF> key.
The auto-power off function is temporarily disabled when the external power supply is
used, when the instrument is in acquisition mode or it is running a program.
MENU Key
Pressing the MENU key, the two items Settings and Programs are accessed: the first
contains all the instrument parameters that, depending on the use, can be modified by the
user.
The second one contains some functions of frequent use; management of files in
memory, setup, calibration, …
-
101
-
The Settings menu includes the following items:
• General
• Vibrometer
• Spectrum Analyzer
• Recording
• Calibration
The
•
•
•
•
•
•
Programs menu includes the following items:
Browser
Setup Management
Calibration
Diagnostic Check
Sensors Configuration
Memory Card Initialization
In the menu and programs it is possible:
• To move from an item to another one in the same menu, using the UP and DOWN arrows,
• To select an item to modify, pressing the ENTER key,
• To modify the selected blinking parameter using the UP and DOWN arrows,
• To confirm the modification with the ENTER key or cancel the modification with the MENU
key,
• To exit from the submenu or from the menu with the MENU key.
Some of the parameters available in the menu are also settable directly in measure mode
(like for example the integration interval, the measurement range, etc.).
Entering the menu, it is possible to visualize the size of available memory, the remaining
batteries charge, the date and the time.
A detailed description of the menu items is in the “MENU FUNCTIONS DESCRIPTION”
AND “PROGRAMS DESCRIPTION” chapters.
CHN Key
The CHN (Channel) key allows to select the measurement channel among the four
available: CH1…CH3 refer to the triaxial right input, CH4 to the left monoaxial input.
The key works in all the screens.
MODE Key
The MODE key selects in sequence the different analyzer visualization modes, switching
from VLM to temporal profile, to the octave or third-octave spectra, to the probability distribution and the percentiles levels.
All the working modes are simultaneously active even if they are not visualized: using
the MODE key it is possible to choose the visualization mode without affecting the acquisition.
At startup, after the selection of the inputs configuration, the instrument displays the
VLM screen.
-
102
-
PAUSE/CONTINUE Key
The PAUSE key stops the calculation of the integrated measures (Leq, the maximum and
minimum level, the spectra, etc.) and the eventual recording. The instant levels continues to
be measured and visualized in the VLM screen. To start again the measurement, press again
the PAUSE/CONTINUE key.
If in PAUSE mode, during a measurement session, the START/STOP/RESET key is
pressed, the integrated parameters are reset.
If in PAUSE mode, during the review of a recording, the START/STOP/RESET key is
pressed, the next memorized data is displayed.
If the START/STOP/RESET key is hold pressed, the fast review mode is entered.
REC Key
If the REC key is pressed for at least 2 seconds, what it is visualized is saved in memory
as single report.
The REC key together with the START/STOP/RESET key activates the continuous recording of the data in memory.
To memorize the time profile (both single and multi profile), press at the same time the
REC and START/STOP/RESET keys: the selection of the single or multiple mode depends on
the settings of some parameters in menu. See the details in the “RECORDING MODE” chapter.
START/STOP/RESET Key
Pressing the START key, starting from the STOP mode, reset the initial values of the integrated measures like Leq, MAX/MIN levels, etc. and starts a new execution.
Pressing the STOP key the next time, it is stopped the execution of the integrated measures.
If pressed while in pause mode, all the integrated parameters are reset.
In the review mode of the memorized data, if the START/STOP/RESET key is pressed
while in pause mode, the next data is displayed; if hold pressed, the fast review mode is entered.
UP arrow Key
The UP arrow key selects the previous row in the menu or increases the selected parameter.
In the VLM screen, it modifies the horizontal bar limits.
It decreases the vertical initial and full scale and of the time profile or frequency spectra
moving in this way the graph up.
-
103
-
LEFT arrow Key
In the menu, the LEFT key moves the cursor on the left during the insertion of a
character.
After the modification of a parameter of the menu, it goes back to the selection of the
whole line in order to move among the various items.
It compresses (ZOOM-) the vertical scale of the time profile and frequency spectra.
In the VLM screens it changes the measure unit of the visualized parameters.
When the integration mode is multiple, the “Tint” symbol blinks: to go back to the single
integration mode, select the “Tint” symbol with the ENTER key and press the LEFT arrow.
ENTER Key
The ENTER key confirms the selected parameter. With the instrument in STOP mode, it
allows the direct modification of the measurement parameters without entering the menu.
During the setting of the menu parameters, to exit from the setting mode of a parameter
without saving it, press the MENU key.
Keeping ENTER pressed while switching on, the factory configuration of the parameters is
loaded.
RIGHT arrow Key
In the menu, the RIGHT arrow key moves the cursor on the right during the insertion of
a character. It allows to modify the parameter of the menu in the selected line.
It extends (ZOOM+) the vertical scale of the time profile and frequency spectra.
In the VLM screens it changes the measure unit of the selected parameters.
It allows to select the multiple integration mode directly from the measure screens without having to access the menu. Press ENTER to have the time after the indication “Tint=…”
blinking. Press the “RIGHT arrow” key. The indication “Tint=” blinks to show that the multiple
integration mode has been selected. To go back to single integration mode, press the LEFT arrow.
DOWN arrow Key
The DOWN arrow key selects the next row in the menu or decreases the selected parameter.
In the VLM screen, it changes the limits of the horizontal bar.
It increases the vertical initial and full scale of the time profile or frequency spectra
moving, in this way, the graph down.
-
104
-
CURSOR Key (keypad)
In a graphic mode, it activates the cursors. Pressing repeatedly the key, they are activated in sequence the fist cursor (L1), the second cursor (L2) or both in “tracking” (ΔL): at the
next pressing of the key, the cursors are disabled.
The selected blinking cursor is moved on the graphic with the LEFT and RIGHT arrows on
the keypad.
In the upper part of the display the related values are displayed.
In time profile, they are indicated the level and the time or the difference of the level
between the two cursors and the time distance.
In working mode as spectrum analyzer, they are visualized the level and the central
frequency corresponding to the cursor selected band. The cursor can also select the wideband
level placed on the right of the display.
When the function of the two cursors is not active, it is possible to switch from the
visualization of the acceleration of each band to the speed or displacement visualization,
pressing in sequence the left and right cursor keys.
Keeping the CURSOR key pressed, the limit acceleration curve is displayed.
To disable the limit acceleration curve, keep the CURSOR key pressed.
In the probability distribution, it is possible to read the probabilities in two points of
the graph or, when they are both selected, to calculate the probability to have a value between
two cursors.
In the percentile levels screen the cursor indicates the percentile level when the
visualized parameter changes.
Keeping the CURSOR key pressed, while one of the VLM screens is visualized, it is possible to activate or deactivate through the keyboard the backlit.
LEFT Key (keypad)
The LEFT arrow key moves on the left the cursor or the two active cursors (blinking).
In VLM mode, it allows to scroll the VLM_1, …, VLM_4 screens.
In working mode as spectrum analyzer, the left and right cursor keys allow to switch
from acceleration to speed or displacement visualization.
RIGHT arrow Key (Keypad)
The RIGHT arrow key moves on the right the cursor or the two active cursors (blinking).
In VLM mode, it allows to scroll the VLM_1, …, VLM_4 screens.
In working mode as spectrum analyzer, the left and right cursor keys allow to switch
from acceleration to speed or displacement visualization.
-
105
-
APPENDIX
A1. MEASURE PARAMETERS OF HD2030
In the following paragraphs are indicated the acoustic levels with the related abbreviations used to identify them that can be visualized numerically or graphically and memorized.
ACOUSTICAL LEVELS NUMERICALLY VISUALIZABLES
Frequency weightings
Application
Weight
Fz
HA
Fc
Wh
Fz
Fa
Wb
Wc
WB
Wd
We
Filter for measure of vibration at the top for vertical axis (x),
lying person, ISO 2631-1
Filter for measurements on vertical axis (z), ISO 2631-1
Filter with a flat frequency response.
Band-pass filter for building measurements: 0.8Hz ÷ 100Hz
Filter for building measurements.
Wj
BV
DESCRIPTION
Filter with a flat frequency response.
Band-pass filter for hand-arm measurements 6.3Hz ÷
1250Hz
Filter for hand-arm measurements.
Filter with a flat frequency response.
Band-pass filter for measurements on the whole body:
0.4Hz ÷ 100Hz
Filter for measures in the vertical axis (z), ISO 2631-4
Filter for measures in horizontal axis from the back to the
shoulders (x), back for a sitting person, ISO 2631-1
Filter for measures on horizontal axis (x o y), ISO 2631-1
Filter for rotational vibrations measures in all the directions
Sitting person, ISO 2631-1
Wk
Fz
Fm
Wm
MEASURE PARAMETERS CALCULATED IN EACH CHANNEL
Instant values calculated every second
Broadband
PARAMETER
aw,pk
aw,1s
Linear Average
aw,1s
Exponential Average
aw,8s
Exponential Average
CF
ABBREV.
DEFINITION
Pk
Peak of weighted acceleration
AeqS
Linear Average in 1 second of weighted acceleration
A1s
A8s
CF
Exponential Average in 1 second of weighted acceleration
Exponential Average in 8 second of weighted acceleration
Crest Factor = aw,pk/aw,1s
-
106
-
Integrated values in the measurement time
Broadband
PARAMETER
Aw,pkmax
aw, T
Linear Average
aw,1s max
Exponential Average
aw,1s min
Exponential Average
aw,8s max
Exponential Average
aw,8s min
Exponential Average
ABBREV.
Pkmx
Aeq
A1smx
A1smn
A8smx
A8smn
aw(eq,1s)
A(1s)
aw(eq,8h)
A(8)
VDV
VDV,8h
VDV
VDV,d
MTVV
MTVV
CF
Linear Average
Maximum CF
DEFINITION
Maximum peak of weighted acceleration
Linear Average in the measurement time of weighted
acceleration
Maximum exponential average in 1 second of weighted
acceleration
Minimum exponential average in 1 second of weighted
acceleration
Maximum exponential average in 8 second of weighted
acceleration
Minimum exponential average in 8 second of weighted
acceleration
Equivalent value of the frequency weighted acceleration
in the measurement time referenced to 1 second
(it is equivalent to SEL)
Equivalent value of the frequency weighted acceleration
in the measurement time referenced to 8 hours
Vibration dose
Estimated daily vibration dose
Maximum Linear Average in 1second of the weighted
acceleration
CFeq
Average Crest Factor = aw,pkmax/aw,T
CFmx
Maximum Crest Factor = aw,pk/aw,1s
VDV Ratio
VDVr
MTVV Ratio
MTVVr
%OL
OL
= VDV/aw,T/T1/4
The limit value is equal to 1.75
= MTVV/aw,T
The limit value is equal to 1.5
Percentage of overload time
%UR
UR
Percentage of under-range time
MEASURE PARAMETERS CALCULATED ON THE ACCELERATION VECTOR
Instant values calculated every second
Broadband
PARAMETER
aw,pk
aw,1s
Linear Average
aw,1s
Exponential Average
aw,8s
Exponential Average
CF
ABBREV.
Pk
DEFINITION
Peak of the weighted acceleration
AeqS
Linear Average in 1 second of weighted acceleration
A1s
A8s
CF
Exponential Average in 1 second of weighted acceleration
Exponential Average in 8 seconds of weighted acceleration
Crest Factor = aw,pk/aw,1s
-
107
-
Integrated values in the measurement time
Broadband
PARAMETER
Aw,pkmax
aw, T
Linear Average
aw,1s max
Exponential Average
aw,1s min
Exponential Average
aw,8s max
Exponential Average
aw,8s min
Exponential Average
ABBREV.
Pkmx
Aeq
A1smx
A1smn
A8smx
A8smn
aw(eq,1s)
A(1s)
aw(eq,8h)
A(8)
MTVV
MTVV
CF
Linear Average
Maximum CF
MTVV Ratio
DEFINITION
Maximum peak of weighted acceleration
Linear average in the measurement time of weighted
acceleration
Maximum Exponential Average in 1 second of the
weighted acceleration
Minimum Exponential Average in 1 second of the
weighted acceleration
Maximum Exponential Average in 8 seconds of the
weighted acceleration
Minimum Exponential Average in 8 seconds of the
weighted acceleration
Equivalent value of the frequency weighted acceleration in the measurement time referenced to 1 second
(Equal to SEL)
Equivalent value of the frequency weighted acceleration in the measurement time referenced to 8 hours
Maximum Linear Average in 1 second of the weighted
acceleration
CFeq
Average crest factor = aw,pkmax/aw,T
CFmx
Maximum crest factor = aw,pk/aw,1s
= MTVV/aw,T
The limit value is equal to 1.5
MTVVr
-
108
-
A2. MEMORY CAPACITY DURING THE RECORDING FUNCTION
The following table reports the indicative values of the memorization capacity of the
HD2030 analyzer in the different recording modes, expressed as the necessary time to fill the
memory or as the number of recordings. The internal memory of the analyzer is 8MB.
Mode
Single recording and
automatic
memorization
Profile recording
Profile interval = 1s
Multiple profiles
recordings.
Single integration.
Multiple profiles
recording. Multiple
integration with
integration interval =
10s
Description
Only LEFT input.
Spectral analysis by octave bands.
Only RIGHT input.
Spectral analysis by octave bands.
LEFT+RIGHT inputs.
Spectral analysis by octave bands.
Only LEFT input.
Spectral analysis by third-octave bands
Only RIGHT input.
Spectral analysis by third-octave bands
LEFT+RIGHT inputs.
Spectral analysis by third-octave bands
Only LEFT input.
Only RIGHT input.
LEFT+RIGHT inputs.
Only LEFT input.
Spectral analysis by octave bands.
Only RIGHT input.
Spectral analysis by octave bands.
LEFT+RIGHT inputs.
Spectral analysis by octave bands.
Only LEFT input.
Spectral analysis by third-octave bands
Only RIGHT input.
Spectral analysis by third-octave bands
LEFT+RIGHT inputs.
Spectral analysis by third-octave bands
Only LEFT input.
Spectral analysis by octave bands.
Only RIGHT input.
Spectral analysis by octave bands.
LEFT+RIGHT inputs.
Spectral analysis by octave bands.
Only LEFT input.
Spectral analysis by third-octave bands
Only RIGHT input.
Spectral analysis by third-octave bands
LEFT+RIGHT inputs.
Spectral analysis by third-octave bands
Memory capacity
8500
3900
2700
8100
3300
2500
11 days
7 days
6 days
63 hours
22 hours
17 hours
28 hours
9 hours
7 hours
60 hours
20 hours
15 hours
55 hours
18 hours
14 hours
When a vocal commentary is memorized, about 16kB/s are necessary. The internal
memory of the analyzer can contain at maximum 8 minutes of audio recording corresponding,
for example, to more than 48 recordings with 10s commentaries.
-
109
-
For a comparison, in the following table are reported the indicative values of the memorization capacity with a 1GB memory card.
Mode
Single recording and
automatic
memorization
Profile recording.
Profile interval = 1s
Multiple profiles
recording.
Single integration.
Multiple profiles
recordings.
Multiple integration
with integration
interval= 10s
Description
Only LEFT input.
Spectral analysis by octave bands.
Only RIGHT input.
Spectral analysis by octave bands.
LEFT+RIGHT inputs.
Spectral analysis by octave bands.
Only LEFT input.
Spectral analysis by third-octave bands
Only RIGHT input.
Spectral analysis by third-octave bands
LEFT+RIGHT inputs.
Spectral analysis by third-octave bands
Only LEFT input.
Only RIGHT input.
LEFT+RIGHT inputs.
Only LEFT input.
Spectral analysis by octave bands.
Only RIGHT input.
Spectral analysis by octave bands.
LEFT+RIGHT inputs.
Spectral analysis by octave bands.
Only LEFT input.
Spectral analysis by third-octave bands
Only RIGHT input.
Spectral analysis by third-octave bands
LEFT+RIGHT inputs.
Spectral analysis by third-octave bands
Only LEFT input.
Spectral analysis by octave bands.
Only RIGHT input.
Spectral analysis by octave bands.
LEFT+RIGHT inputs.
Spectral analysis by octave bands.
Only LEFT input.
Spectral analysis by third-octave bands
Only RIGHT input.
Spectral analysis by third-octave bands
LEFT+RIGHT inputs.
Spectral analysis by third-octave bands
-
110
-
Memory capacity
65000
65000
65000
65000
65000
65000
1350 days
910 days
780 days
314 days
110 days
87 days
140 days
48 days
37 days
300 days
100 days
77 days
275 days
92 days
69 days
A3. COMMUNICATION PROTOCOL
The commands are made by ASCII strings with variable length ending with CR-LF.
The instrument always gives an answer when it receives a command. If the command is
not accepted, the answer string is always NAK-CR-LF. It is possible to deactivate the answer,
when it is not explicitly requested by the command, acting on VERBOSE parameter (see PAR
paragraph).
The commands are divided in 5 groups, as indicated in the following table.
Group
PAR
KEY
STT
DMP
CNF
N.commands
66
18
3
5
10
Description
PARAM: Parameters Config.
KEY: Keyboard simulation
STATUS: Analyzer Status
DUMP: Memory download
CONFIG: Sensor Config.
Each group contains a certain number of commands. Each command is identified by a
specified string. The generic syntax of a command is the following:
<group>:<key>:<value>:CR-LF
e.g.:
“PAR:INPUT_GAIN:10\r\n”
Set the parameter INPUT_GAIN to the value 10dB (see the paragraph SET).
Only capital characters are recognized. Each token can be shortened to the minimum
number of characters that uniquely identifies it. The example can be shortened as follows:
“PAR:INP:10\r\n”
In the following the possible formats of the commands are reported.
A3 - PAR:INT_TIME:<{SS,MM,HH}>:<value>CRLF
A4 - PAR:TIME:<hh>:<month>CRLF
A5 - PAR:DATE:<year>:< month >:<day>CRLF
A6 - PAR:x_AXIS_PARAMETER:<Parameter abbrev. >:<Parameter attribute>CRLF
A7 - PAR:PROFILE_PARAMETER:< Parameter abbrev. >:< Parameter attribute >CRLF
A8 - PAR:<KEY>:<value>CRLF
A10 - PAR:< KEY >:?CRLF
C1 - KEY:< KEY >CRLF
C2 - KEY:< KEY >:<value>CRLF
D1 - STT:< KEY >:<OPTION>CRLF
E1 - DMP:< KEY >CRLF
F1 - CNF:<KEY >:<CHANNEL>:<#configuration>:<value or string>CRLF
Inserting appropriately the character “?” in the string, it is possible to get both help in
order to fill the desired command and the current status of the instrument parameters.
Following we reported the formats of the commands that use the “?” character.
0
A9
A10
C3
D2
D3
E2
F2
F3
?CRLF
PAR:?CRLF
PAR:<KEY>:?CRLF
KEY:?CRLF
STT:?CRLF
STT:<KEY>:?CRLF
It provides the list of the commands groups.
It provides the PAR group list.
It provides the current status of the parameter.
It provides the KEY group list
It provides the STT group list
It provides the current status related to the specified
command.
DMP:?CRLF
It provides the DMP group list
CNF:?CRLF
It provides the CNF group list
CNF:<KEY>:<CHANNEL>:<#configuration>:?CRLF
It provides the current status of the configuration parameter.
-
111
-
PAR GROUP (PARAMETERS)
The following table indicates the key list of PAR group
Key
INSTR_MODEL
INSTR_NUMBER
INSTR_VERSION
RIGHT_CONFIG
Format
A10
A10
A10
A8
LEFT_CONFIG
A8
RIGHT_TYPE
A10
RIGHT_MANUF
A10
RIGHT_MODEL
RIGHT_NUMBER
A10
A10
RIGHT_SENS
A8
LEFT_TYPE
A10
LEFT_MANUF
A10
LEFT_MODEL
LEFT_NUMBER
A10
A10
LEFT_SENS
A8
MEM_SIZE
OPTIONS
TIME
DATE
VERBOSE
VPOL_1
A10
A10
A4
A5
A8
A8
VPOL_2
A8
VPOL_3
A8
VPOL_4
A8
BATTERY TYPE
BACKLIGHT
DISP_CONTRAST
AUTO_POWEROFF
PROT_CODE
PRINT_OUT
PRINT_MODE
TRG_OUTPUT
TRG_OUT_POLARITY
BAUD_RATE
A8
A8
A8
A8
A10
A8
A8
A8
A8
A8
Description
Instrument model – NOT CHANGEABLE
Instrument serial number - NOT CHANGEABLE
Instrument version - NOT CHANGEABLE
Configuration number of right channel (1÷9, 0
means that the channel is not active).
Configuration number of left channel (1÷9, 0 means
that the channel is not active).
Sensor type connected to the right channel (ACC
TRI for triaxial accelerometer or OFF).
Manufacturer of the sensor connected to the right
channel.
Model of the sensor connected to the right channel.
Serial number of the sensor connected to the right
channel.
Nominal sensitivity of the sensor connected to the
right channel.
Type of sensor connected to the left channel (ACC
MON for monoaxial accelerometer or OFF).
Manufacturer of the sensor connected to the left
channel.
Model of the sensor connected to the left channel.
Serial number of the sensor connected to the left
channel.
Nominal sensitivity of the sensor connected to the
left channel.
Memory size – NOT CHANGEABLE
Firmware options – NOT CHANGEABLE
Time (hh:mm)
Date (yyyy/mm/dd)
Answer mode to the commands (default ON).
Polarization voltage of n.1 axis related to the sensor
connected to the right channel. – Parameter available only for reading.
Polarization voltage of n.2 axis related to the sensor
connected to the right channel. Parameter available
only for reading.
Polarization voltage of n.3 axis related to the sensor
connected to the right channel. Parameter available
only for reading.
Polarization voltage of left sensor related to the sensor connected to the right channel. Parameter
available only for reading.
ALKALINE (default) or NiMH Battery Type
Backlight Display (ON/OFF, default:ON)
Display Contrast (3÷9, default: 5)
Instrument Auto off (ON/OFF, default: OFF)
Protection code. Changeable with password.
Results printing (ON/OFF, default: OFF)
Printing results type (VLM, SPC o VLM+SPC)
TRGOUT output (ON/OFF, default: OFF)
Polarity TRGOUT output (POS/NEG)
Baud rate RS232 port
-
112
-
Key
MEM_TYPE
DEVICE
VIB_MODE
INPUT_GAIN
INT_DELAY
INT_MODE
PROFILE_TIME
INTEGRATION_TIME
MEAS_UNIT
POND_1
POND_2
POND_3
COEFF_1
COEFF_2
COEFF_3
HIGH_PASS
1_AXIS_PARAMETER
2_AXIS_PARAMETER
3_AXIS_PARAMETER
1_VEC_PARAMETER
2_VEC_PARAMETER
3_VEC_PARAMETER
PROFILE_PARAMETER
SPECT_AUX_POND
SPECT_TYPE
SPECT_ORDER
Format
A8
A8
A8
A8
A8
A8
A8
A3
A8
A8
A8
A8
A8
A8
A8
A8
A6
A6
A6
A6
A6
A6
A7
A8
A8
A8
SPECT_INTEGRATION
A8
1_MARKER
2_MARKER
3_MARKER
4_MARKER
5_MARKER
6_MARKER
7_MARKER
8_MARKER
9_MARKER
DLOG_TYPE
DLOG_ADC_SAMPLES
A10
A10
A10
A10
A10
A10
A10
A10
A10
A8
A8
1G_AXIS_PARAMETER
2G_AXIS_PARAMETER
3G_AXIS_PARAMETER
1G_VEC_PARAMETER
2G_VEC_PARAMETER
3G_VEC_PARAMETER
DLOG_AUTO_STORE
A6
A6
A6
A6
A6
A6
A8
CAL_LEVEL
A8
Description
Memory type for data logging (FLASH/CARD)
Serial device (RS232/USB)
Vibrometer Application (HA/WB/BV)
Input amplification (0/10/20)
Integration delay (1÷99)
Integration mode (SING/MULT)
Profile time
Integration time in s, m (1÷59) or h (1÷99)
Measure unit
Axis 1 weight for the calculation of the vector
Axis 2 weight for the calculation of the vector
Axis 3 weight for the calculation of the vector
Axis 1 coefficient for the calculation of the vector
Axis 2 coefficient for the calculation of the vector
Axis 3 coefficient for the calculation of the vector
Activation high-pass filter 0.6Hz
Parameter 1 single axis (see parameter list)
Parameter 2 single axis (see parameter list)
Parameter 3 single axis (see parameter list)
Parameter 1 vector (see parameter list)
Parameter 2 vector (see parameter list)
Parameter 3 vector (see parameter list)
Profile parameter (see parameter list)
Auxiliary spectrum weighting
Spectrum Type (AVR/MLT)
Spectrum Order: octave (1/1), or third-octave
(1/3).
Spectrum integration: none (OFF), single (X1) or
double (X2).
Marker n.1 identification
Marker n.2 identification
Marker n.3 identification
Marker n.4 identification
Marker n.5 identification
Marker n.6 identification
Marker n.7 identification
Marker n.8 identification
Marker n.9 identification
Data logging type (PROFILE/FULL)
It activates the ADC samples recording: at choice
axis 1,2,3 or 4 or the combinations 123 and 1234.
Global parameter 1 single axis (see parameter list)
Global parameter 2 single axis (see parameter list)
Global parameter 3 single axis (see parameter list)
Global parameter 1 vector (see parameter list)
Global parameter 2 vector (see parameter list)
Global parameter 3 vector (see parameter list)
It activates the Auto-Store function (ON/OFF, default: OFF)
Calibration level in m/s2 (0.1 ÷ 300, default: 10.0)
The value that some of the parameters can assume is indicated in the following table
(the default value is bolded).
-
113
-
Parameter
Value
ALKALINE
NiMH
VLM
SPC
VLM+SPC
POS
NEG
300
600
1.2k
2.4k
4.8k
9.6k
19.2k
38.4k
57.6k
115.2k
FLASH
CARD
RS232
USB
HA
WB
BV
0
10
20
SING
MULT
dB
m/s2
cm/s2
ft/s2
in/s2
g
AVR
MLT
1/1
1/3
OFF
X1
X2
PROFILE
FULL
OFF
1
2
3
4
123
1234
BATT_TYPE
PRINT_MODE
TRG_OUT_POLARITY
BAUD_RATE
MEM_TYPE
DEVICE
VIB_MODE
INPUT_GAIN
INT_MODE
MEAS_UNIT
SPECT_TYPE
SPECT_ORDER
SPECT_INTEGRATION
DLOG_TYPE
DLOG_ADC_SAMPLES
-
114
-
KEY GROUP
The following table indicates the commands list of KEY group
Command
OFF
HOLD
Format
C1
C1
MENU
CHN
MODE
PAUSE
STORE
C1
C1
C1
C1
C1
START
UP
DOWN
RIGHT
LEFT
ENTER
CURSOR
CLEFT
CRIGHT
DATA_LOG
PRN_VAL
EXEC
C1
C1
C1
C1
C1
C1
C1
C1
C1
C1
C1
C2
Description
It switches off the instrument
HOLD key
MENU key
CHN key
MODE key
PAUSE/CONTINUE key
It simulates the pressure for more than 2 seconds of
the REC key
START/STOP key
UP arrow key
DOWN arrow key
RIGHT arrow key
LEFT arrow key
ENTER key
CURSOR key
LEFT CURSOR arrow key
RIGHT CURSOR arrow key
REC+START key
It sends to the serial interface the visualized levels
Execution of programs
-
115
-
STT (STATUS) GROUP
The following table indicates the commands list of STT (STATUS) group.
Command
ACQUISITION
DISPLAY
SETUP
Description
Acquisition control
Display management
Setup management
In the following table are indicated the commands of the ACQUISITION subgroup that
can be activated with the string: ACQUISITION:<key>.
Command
HOLD
UPDATE
PAUSE
RUN
STOP
CLEAR
CONTINUE
Format
D1
D1
D1
D1
D1
D1
D1
Description
It stops the updating of the display
It activates the display updating
It pause the measurement
It starts the measurements
It ends the measurements
It resets the measured levels
It starts again to measure
The command STT:ACQUISITION:? gives the information about the acquisition status as
indicated in the following example.
STT:ACQ:?
STT:ACQUISITION:STOP
BATTERY: 32%
MEMORY: 95.4%
DUMP TIME:00:00:01
TEMP. CORR.: 0.01dB
LAST CALIBRATION: 2003/07/31 08:37
In the following table are indicated the commands of the DISPLAY subgroup that can be
activated with STT:DISPLAY:<key> string.
Command
VLM_AXIS
VLM_VECTOR
PROFILE
OCTAVE
PROB_DISTR
CUMUL_DISTR
Format
D1
D1
D1
D1
D1
D1
Description
It visualizes the
It visualizes the
It visualizes the
It visualizes the
It visualizes the
It visualizes the
VLM screen related to a single axis
VLM screen related to the vector
PROFILE screen
SPECTRUM screen
STATISTIC screen
PERCENTILES screen
STT:DISPLAY:? command gives information about what it is currently visualized on the
vibrations analyzer display as indicated in the following example.
STT:DIS:?
STT:DISPLAY:Mode:PROFILE
In the following table are indicated the commands of the SETUP subgroup.
Command
LOAD
STORE
Format
D2
D2
Description
It loads the specified setup
It memorizes the specified setup
-
116
-
The syntax of the setup reading command is:
STT:SETUP:LOAD:<# setup>
The specified setup is loaded into the instrument.
The syntax of the setup memorization command is:
STT:SETUP:STORE:<# setup>:<title (max 21 characters)>
The current setup is memorized, with title, in the specified position.
The setup number must be chosen in the interval 1÷10.
DMP (DUMP) GROUP
The following table indicates the commands list of the DMP (DUMP) group.
Command
ON
OFF
NEXT_RECORD
RECORD
CLEAR
Format
E1
E1
E1
E1
E1
Description
It starts the download of the memory.
It stops the download of the memory.
It asks for the transmission of the next record.
It asks for the transmission of the current record.
It cancel the memory
The download of the data memorized in the FLASH memory of the instrument is performed with following the commands sequence:
• DMP:ON\r\n
If there are data in memory, it is printed the header that ends with the “MEMORY DUMP\r\n”
string
• DMP:RECORD\r\n
It prints in binary format the previous record
• DMP:NEXT_RECORD\r\n
It downloads in binary format a block of 512 bytes (followed by checksum). If there are
no other data in memory, the string “END OF DUMP\r\n” is printed.
• DMP:CLEAR\r\n (optional)
It resets the content of the FLASH memory
• DMP:OFF\r\n
It stops the data download.
In case of a fault during the transmission of the block (checksum fault) it is possible to
request to transmit again the same block with the command:
• DMP:RECORD\r\n
It prints in binary format the current record
The data download can be stopped at any time with the command:
• DMP:OFF\r\n
It stops the data download.
CNF (CONFIGURE) GROUP
The following table indicates the command list of the CNF (CONFIGURE) group.
Key
PROD
MODL
MATR
TIPO
INDX
RANG
STOR
Format
F1
F1
F1
F1
F1
F1
F1
Description
Sensor Manufacturer
Model
Serial Number
Sensor Type
Index of nominal sensitivity
Maximum level measurable
Memorization of the configuration
-
117
-
A sensor configuration is performed with the following commands sequence:
• CNF:PROD:<CHANNEL>:<#configuration>:<manufacturer (max 10 characters)>\r\n
Set the sensor manufacturer
• CNF:MODL:<CHANNEL>:<#configuration >:<model (max 10 characters)>\r\n
Set the sensor model.
• CNF:MATR:<CANALE>:<#configuration>:<serial number (max 10 characters)>\r\n
Set the serial number of the sensor
• CNF:TIPO:<CANALE>:<#configuration>:<code type>\r\n
Set the sensor type according to the numerical code indicated in the following table.
Code
0
64
96
Description
No sensor
Monoaxial accelerometer.
Triaxial accelerometer.
The right channel can use only triaxial accelerometers while the left channel can use only
monoaxial accelerometers.
• CNF:INDX:<CHANNEL>:<#configuration>:<sensitivity index >\r\n
• Set the sensitivity nominal index of the sensor according to the numeric code indicated in
the following table:
Code
0
1
2
3
4
5
6
7
8
9
Nominal sensitivity
Sensitivity interval
[mV/g]
1
0 ÷ 1.5
2
1÷3
5
2.5 ÷ 7.5
10
5 ÷ 15
20
10 ÷ 30
50
25 ÷ 75
100
50 ÷ 150
200
100 ÷ 300
500
250 ÷ 750
1000
500 ÷ 1500
The code to insert is the one related to the sensitivity interval more adequate to the sensor.
• CNF:RANG:<CHANNEL>:<#configuration>:<level>\r\n
Set the maximum level of acceleration measurable by the sensor (in g).
• CNF:STOR\r\n
Permanently memorize the modifications made to the table of the sensors configuration.
After the execution of this command, it is necessary proceed with the calibration of the
inserted or modified sensors.
The CHANNEL code is R for the right channel and L for the left one. The configuration
number is chosen in the interval 1 ÷ 9.
-
118
-
NOTES ABOUT THE OPERATION AND USER SAFETY
Authorized use
Observe the technical specifications indicated in the chapter “TECHNICAL FEATURES”. It is authorized only the use in compliance with the instructions indicated in this manual. Any other
use is to be considered not authorized.
General safety instructions
This instrument was built and checked in compliance with the EN 61010-1 safety rules for the
electronic measurement instruments and left the factory in perfect technical safety conditions.
The regular functioning and the operational safety of the instrument can be warranted only if
are observed all the normal safety measures as well as the specifications described in this
manual.
The regular functioning and the operational safety of the instrument can be warranted only at
temperature condition specified in “TECHNICAL FEATURES” chapter.
Do not use or store the instrument in ways and/or places where there are:
• Quick changes in temperature that could cause condense formation.
• Corrosive or flammable gas.
• Direct vibrations or instrument shocks.
• High intensity electromagnetic fields, static electricity.
If the product is transported from a cold to a warm place, the formation of condense can disturbs its operation. In this case it must be waited until the temperature of the instrument
reaches the room temperature before putting it in operation.
User obligations
The user of the instrument must ensure the observation of the following rules and directives on
the treatment of hazardous materials:
•
EC directives for safety at work
•
national legal standards for safety at work
•
prevention regulations
-
119
-
SUMMARY
CONNECTORS AND KEYBOARD ................................................................................... 3
INSTRUMENT OVERVIEW............................................................................................ 4
BLOCK DIAGRAM OF HD2030 ....................................................................................... 4
MEASURE CHANNELS .................................................................................................. 4
THE INSTRUMENT ...................................................................................................... 4
HOW TO CONNECT THE ACCELEROMETERS TO THE ANALYZER ..................................................... 5
INTRODUCTION.......................................................................................................... 6
DESCRIPTION OF DISPLAY MODES............................................................................. 8
VLM SCREEN ............................................................................................................ 11
PROFILE SCREEN ........................................................................................................ 13
SPECTRUM SCREEN ..................................................................................................... 14
DISTRIBUTION OF PROBABILITY SCREEN ............................................................................. 16
PERCENTILES SCREEN .................................................................................................. 17
APPLICATIONS ......................................................................................................... 18
HAND ARM ............................................................................................................... 18
WHOLE BODY ............................................................................................................ 18
BUILDING VIBRATION................................................................................................... 19
MEASUREMENT MODES ............................................................................................. 20
SINGLE INTEGRATION .................................................................................................. 20
MULTIPLE INTEGRATION ................................................................................................ 20
USE OF THE EXTERNAL MEMORY CARD ..................................................................... 21
RECORDING MODES.................................................................................................. 23
SINGLE RECORD......................................................................................................... 24
SINGLE PROFILE ......................................................................................................... 24
MULTI PROFILE .......................................................................................................... 25
RECORDING OF AN AUDIO COMMENTARY ............................................................................. 27
PROGRAMS DESCRIPTION ........................................................................................ 28
BROWSER PROGRAM .................................................................................................... 28
SETUP MANAGEMENT PROGRAM ....................................................................................... 38
CALIBRATION PROGRAM ................................................................................................ 41
DIAGNOSTIC CHECK PROGRAM ................................................................................... 46
SENSORS CONFIGURATION PROGRAM ................................................................................ 47
MC INITIALIZATION PROGRAM ........................................................................................ 49
DESCRIPTION OF THE MENU FUNCTIONS ................................................................. 50
GENERAL ............................................................................................................... 52
IDENTIFICATION...................................................................................................... 52
SYSTEM ............................................................................................................... 52
INPUT/OUTPUT ....................................................................................................... 53
MEASURES ............................................................................................................ 54
VIBROMETER ............................................................................................................. 55
SPECTRUM ANALYZER ................................................................................................... 55
RECORDING .............................................................................................................. 55
PROFILES ............................................................................................................. 56
GLOBAL ............................................................................................................... 56
CALIBRATION ............................................................................................................ 56
FIRMWARE UPDATE.................................................................................................. 57
REPORTING OF LOW BATTERIES AND REPLACEMENT OF THE BATTERIES ................ 58
INSTRUMENT STORAGE ............................................................................................ 60
-
120
-
SERIAL INTERFACE................................................................................................... 61
MEASURE PARAMETERS ............................................................................................ 63
DIRECT PRINTER CONNECTION ................................................................................ 73
CONNECTION TO A PC WITH USB INTERFACE........................................................... 74
ACCELEROMETERS DESCRIPTION ............................................................................. 75
ACCESSORIES ........................................................................................................ 77
CONNECTORS DESCRIPTION .................................................................................... 79
INSTRUCTIONS FOR THE CONNECTION OF THE HD2030 TO A PC WITH WINDOWS
OPERATING SYSTEM................................................................................................. 82
HARDWARE CONNECTION .............................................................................................. 82
WINDOWS 98, NT, ME, 2000 AND XP SOFTWARE CONNECTION ................................................ 82
TECHNICAL SPECIFICATIONS ................................................................................... 84
METROLOGIC FEATURES ................................................................................................ 85
ELECTRICAL FEATURES ................................................................................................. 88
STATISTIC ANALYSIS ................................................................................................... 89
SPECTRAL ANALYSIS .................................................................................................... 89
VISUALIZATION .......................................................................................................... 89
MEASUREMENTS MEMORIZATION ...................................................................................... 90
OTHER FEATURES ....................................................................................................... 90
ACCELEROMETERS TECHNICAL FEATURES ............................................................................. 91
REFERENCE RULES.................................................................................................... 94
EMC STANDARD RULES ................................................................................................ 94
ITALIAN LEGISLATION .................................................................................................. 94
ORDER CODES .......................................................................................................... 95
HOW TO SOLVE THE PROBLEMS................................................................................ 99
RESTORE OF FACTORY SETUP .......................................................................................... 99
VARIOUS PROBLEMS .................................................................................................... 99
KEYBOARD DESCRIPTION....................................................................................... 100
APPENDIX .............................................................................................................. 106
A1. MEASURE PARAMETERS OF HD2030................................................................... 106
ACOUSTICAL LEVELS NUMERICALLY VISUALIZABLES ............................................................ 106
A2. MEMORY CAPACITY DURING THE RECORDING FUNCTION ..................................... 109
A3. COMMUNICATION PROTOCOL ............................................................................ 111
PAR GROUP (PARAMETERS)................................................................................... 112
KEY GROUP ...................................................................................................... 115
STT (STATUS) GROUP ........................................................................................ 116
DMP (DUMP) GROUP........................................................................................... 117
CNF (CONFIGURE) GROUP .................................................................................. 117
NOTES ABOUT THE OPERATION AND USER SAFETY ................................................ 119
-
121
-
-
122
-
CERTIFICATO DI CONFORMITÀ DEL COSTRUTTORE
MANUFACTURER’S CERTIFICATE OF CONFORMITY
rilasciato da
issued by
DELTA OHM SRL
DATA
DATE
STRUMENTI DI MISURA
2008/10/13
Si certifica che gli strumenti sotto riportati hanno superato positivamente tutti i test di
produzione e sono conformi alle specifiche, valide alla data del test, riportate nella documentazione tecnica.
We certify that below mentioned instruments have been tested and passed all production tests,
confirming compliance with the manufacturer's published specification at the date of the test.
La riferibilità delle misure ai campioni internazionali e nazionali dei suoi laboratori SIT è
garantita da una catena di riferibilità ininterrotta che ha origine dalla taratura dei campioni di laboratorio presso l’Istituto Primario Nazionale di Ricerca Metrologica.
The traceability of measures assigned to international and national reference samples of Delta
Ohm’s SIT laboratories is guaranteed by a uninterrupted reference chain which source is the calibration of laboratories samples at the Primary National Metrological Research Institute.
Tipo Prodotto:
Product Type:
Analizzatore di vibrazioni
Vibration meter
Nome Prodotto:
Product Name:
HD2030
DELTA OHM SRL
35030 Caselle di Selvazzano (PD) Italy
Via Marconi, 5
Phone. +39.0498977150 r.a. - Telefax +39.049635596
Cod. Fisc./P.Iva IT03363960281 - N.Mecc. PD044279
R.E.A. 306030 - ISC. Reg. Soc. 68037/1998
-
123
-
GUARANTEE
GUARANTEE CONDITIONS
All DELTA OHM instruments have been subjected to strict tests and are guaranteed for 24 months from
date of purchase. DELTA OHM will repair or replace free of charge any parts which it considers to be inefficient within the guarantee period. Complete replacement is excluded and no request of damages are
recognized. The guarantee does not include accidental breakages due to transport, neglect, incorrect use,
incorrect connection to voltage different from the contemplated for the instrument. Furthermore the guarantee is not valid if the instrument has been repaired or tampered by unauthorized third parties. The
instrument has to be sent to the retailer without transport charge. For all disputes the competent court is
the Court of Padua.
The electric and electronic devices with the following symbol cannot be disposed in the public
dumps. According to the Directive UE 2002/96/EC, the European users of electric and electronic
devices are allowed to give back to the Distributor or Manufacturer the used device at the time of
purchasing a new one. The illegal disposing of electric and electronic devices is punished by a
pecuniary administrative penalty.
This guarantee must be sent together with the instrument to our service centre.
N.B.: Guarantee is valid only if coupon has been correctly filled in all details.
Instrument type
HD2030
Serial number
RENEWALS
Date
Date
Inspector
Inspector
Date
Date
Inspector
Inspector
Date
Date
Inspector
Inspector
CE CONFORMITY
Safety
Electrostatic discharge
EN61000-4-2, EN61010-1 LEVEL 3
Electric fast transients
EN61000-4-4 LEVEL 3
Voltage variations
EN61000-4-11
Electromagnetic interference susceptibility
IEC1000-4-3
Electromagnetic interference emission
EN55020 class B
EN61000-4-2 LEVEL 3
-
124
-