1
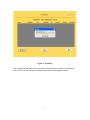
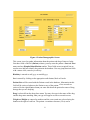
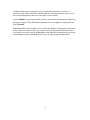
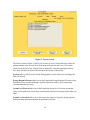
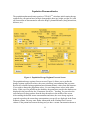
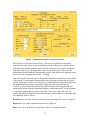
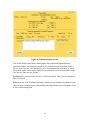
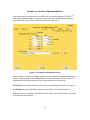
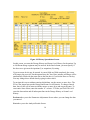
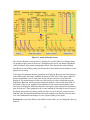
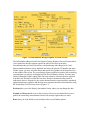
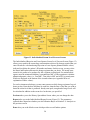
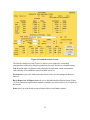
T. D. M. S.
Version 6.0
For Windows
THERAPEUTIC
DRUG
MONITORING
SYSTEM
USER MANUAL
Copyright 1986-2003
Healthware, Inc.
PO Box 33483
San Diego, CA 92163
Phone/FAX : (858) 452-0297
Designed by : Jenn Ting, Pharm.D.
Written by : Philip O. Anderson, Pharm.D.
Jenn Ting, Pharm.D.
The programs and equations contained in T.D.M.S.TM were derived from the medical
literature identified in the documentation provided with this program and are combined
to provide a system that supplements the judgment of the clinician in dosing various
drugs. T.D.M.S.TM is not intended to replace the sound clinical judgment of the user in
the care of patients. Neither Healthware, Inc. nor any of its employees shall be liable for
any damages resulting from any use of this software package. By the use of this software
package, the user waives all warranties, expressed or implied, including any warranties to
the accuracy, quality or suitability of T.D.M.S.TM for any particular purpose, either
medical or nonmedical.
Healthware, Inc. provides a license to use T.D.M.S.TM under the following conditions:
1. You may make a copy of the program to a working diskette or hard disk as a backup to
use on any machine owned by the purchaser, so long as only the number of copies
allowed by the T.D.M.S.TM protection scheme is not exceeded.
2. Copies of T.D.M.S.TM screens may be made for teaching or patient care purposes. No
copies of T.D.M.S.TM screens may be made for any other purposes, commercial or
noncommercial, without written permission of Healthware, Inc.
3. You may transfer the program and license to another party if the other party agrees to
the terms and conditions of this agreement.
4. You may not modify, copy or transfer T.D.M.S.TM in any way except as provided for in
this license.
Any other uses or copies of T.D.M.S.TM are not allowed under this license, and use of this
program indicates your acceptance of these terms and conditions.
The T.D.M.S.TM User Manual is copyright Healthware, Inc, 2003. No part of this manual
may be reproduced in any form or by any means without permission in writing from
Healthware, Inc.
T.D.M.S.TM is a trademark of Healthware, Inc. and all references to T.D.M.S.TM in this
manual refer to the trademark, although they may not be designated as such.
2
ACKNOWLEDGEMENTS
The authors would like to thank James Lane, Jr., Pharm.D., William Murray, Pharm.D.,
and Edmund Capparelli, Pharm.D. who have provided numerous pharmacokinetic
insights that improved the program.
3
CHAPTER 1. SYSTEM OVERVIEW
Figure 1. Title Screen
The Title Screen (Figure 1) displays the program name, version, the name of your
institution and today’s date as it is set in your computer. There are two choices on this
screen:
Configure Database allows you to designate the location of the T.D.M.STM. database
where patient data are stored (see Appendix A. T.D.M.S. Installation Procedures for
more details). You are required to press this button and designate a database location the
fist time you run T.D.M.STM after it is installed.
Next allows you to proceed to the following screen. Note that you can either click on this
Next button or press the keyboard combination of Alt-N to proceed. Wherever you see a
letter underlined on a button throughout the program, you can use the Alt-letter
combination to activate the button.
4
Figure 2. Database Search Screen
This screen displays the legal disclaimer at the top and has two boxes that allow you to
search for a patient in the database. You only need to fill in one of the two boxes.
Patient:s Last Name allows you to search for a patient by the last name. Partial name
searches are possible, so entering the letter “An” will retrieve all patient:s whose last
name starts with “An”.
Enter Patient ID Number allows you to search by the identification number you have
stored in the database, such as the patient:s medical record number.
Previous takes you back to the Title Screen.
Next allows you to proceed to the following screen. If you entered information into one
of the boxes above, you will be taken to the Database Screen (Figure 3) where search
results are displayed. If you entered nothing in either box, you will be taken to the Patient
Demographics screen.
5
Figure 3. Database Screen
The Database Screen displays all Patients in the T.D.M.S.TM database that meet your
search criteria. Several columns of information are listed to assist you in selecting the
appropriate database entry. Listed below the name of each Patient are the specific
“Cases” that have been saved for this Patient. Each Case represents a record containing
data saved on different drug or date. You may choose information by Patient name or
Case by double clickicking on the desired line. Patient information (selecting by patient
name) is only demographic information, whereas Case information (selecting by drug) is
the Patient:s complete demographic information, all drug-specific dosage and serum
level history as well as previously entered notes and recommendations for that Case.
Options are as follows:
Previous takes you back to the Database Search Screen where you can reenter a database
search.
Delete allows you to delete a specified Patient or Case. Deleting a Patient also deletes all
associated Cases.
Next takes you to the patient demographic screen.
If no match is found in the database that match your search criteria the following
message will appear.
6
Figure 3. No Match
After clicking the OK button, you may either press the Previous button to reformulate
your search or the Next button to continue to the Patient Demographics screen.
7
Figure 4. Patient Demographics Screen
This screen is used to gather information about the patient and drug of interest. In the
first three fields of the left (Patient) column, you may enter the patient:s Last and First
names and any Hospital Identification number. These fields are not required, but are
used to store and later identify the patient in the database. You may jump between fields
with a mouse click, enter key or tab key.
Birthday is entered as m/d/yyyy or mm/dd/yyyy.
Sex is entered by clicking on the appropriate radio button, Male or Female
Patient Note will be stored with the Patient record in the database. Information in this
field will be retrieved whenever the Patient or any of the patient:s Case records are
retrieved. In the right (Case) column you enter data about the particular course of drug
therapy that you are studying.
Drug is selected from the drop-down menu. You may also type in the name of the drug
and the drug name matching what you type will appear as soon as a match occurs.
Weight and Height are entered as numbers and the correct units are selected using the
buttons to the right of each box. The patient:s creatinine clearance (CLcr) can be
8
calculated from serum creatinine (Crs) or it can be entered directly if you have a
measured value. Select either Crs or CLcr with the radio button and enter the value in
the corresponding units in the box to the right of your selection.
Serum Albumin is only required when you have selected the drug phenytoin. Otherwise,
this entry is skipped. The date that this particular Case was updated is displayed in the
field, Updated.
Case Note will be stored with the Case record in the database. Information in this field
will be retrieved whenever this Case record is retrieved. Buttons at the bottom of this
screen allow you to go back to the Previous screen, Save the information on this screen
in the database or proceed with analysis of this case by pressing the Next button.
9
Figure 5 . Factors Screen
The Factors Screen (Figure 5) allows you to enter up to two factors known to affect the
pharmacokinetics (by at least 10%) of the drug being used in this Case. Click on the
check box to the left of any factor(s) that are applicable. Once the appropriate factors
have been checked, click one of the buttons at the bottom of the screen.
Previous takes you back to the Patient Demographics screen where you can change the
data you entered.
Dosage Regimen Forecast takes you to the Population Dosage Regimen Forecast screen
that allows you to predict the dosage regimen required to achieve given serum drug
concentrations that you enter.
Serum Level Forecast takes you to the Population Serum Level Forecast screen that
allows you to predict the serum drug concentrations achieved by dosage regimen that you
enter.
Serum Level Analysis takes you to the screens for analysis of specific dosage regimen
and serum drug concentrations that the patient has received.
10
Population Pharmacokinetics
The population pharmacokientics portion of T.D.M.S.TM calculates initial starting dosage
regimens for your patient based on their demographic data (age, height, weight, etc.) and
any factors that are documented to affect the drugs’s pharmacokientics (drug interactions,
diseases, etc.).
Figure 6 . Population Dosage Regimen Forecast Screen
The population dosage regimen forecast screen (Figure 6) allows you to predict the
dosage regimen required to achieve the exact serum drug concentrations that you enter.
Results are calculated using population-based pharmacokinetic values from the literature.
If you wish to change the population values, you can change those values in the white
boxes. If this case was pulled from the database, the parameters stored in the database are
displayed in the boxes below the “Parameters Saved On...” heading. You can select the
route and specific drug product from the drop-down box in the middle of the screen.
After entering the desired serum concentrations and times, the exact dosage regimen
required to produce the serum drug concentrations you specify are displayed in the Exact
Estimate column. You may enter further information in the Loading Dose Forecast
column. If the patient has been on the drug and you have a serum concentration drawn at
11
a known time, you can enter these. T.D.M.S.TM. will calculate the dose required to
produce the Desired Post that you specified after the first dose. Because calculations
often result in impractical doses or frequencies, the results obtained on this screen should
be considered approximate dosage regimens. The best exact regimens should be
determined by using the Population Serum Drug Level Forecast Screen.
Previous takes you back to the Factors screen where you can change the factors entered.
Serum Level Forecast takes you to the serum level forecast screen that allows you to
predict the serum drug concentrations achieved by dosage regimen that you enter.
Done takes you to the Mode screen which provides several further options.
12
Figure 7. Population Serum Level Forecast Screen
The Serum Level Forecast Screen (Figure 7) allows you to predict the serum drug
concentrations achieved by dosage regimen that you enter. Results are calculated using
population-based pharmacokinetic values from the literature. If you wish to change the
population values, you can change those values in the white boxes. If this case was
downloaded from the database, the parameters stored in the database are displayed in the
boxes below the “Parameters Saved On...” heading.
You can select the route and specific drug product from the drop-down box in the middle
of the screen. For intermittent administration, enter the dosage regimen that you desire
and the steady-state serum levels predicted to be produced by this regimen are displayed.
For administration by continuous infusion, simply enter the desired serum and
T.D.M.S.TM will calculate the infusion rate needed to achieve this concentration. For
antimicrobial agents, enter the minimum inhibitory concentration (MIC) of the organism
to calculate pharmacodynamic values (Post/MIC, Time Above MIC and AUIC) at
steady-state which are displayed at the bottom of the second column. See Appendix B for
an explanation of these values.
Previous takes you to the Factors screen where you can change the factors you entered.
Report takes you to the Population Report Screen (Figure 8).
Done takes you to the Mode screen which provides several further options.
13
Figure 8. Population Report Screen
This screen displays the Patient:s demographic data, population pharmacokinetic
parameters and the last dosage regimen that you evaluated on the Population Serum
Level screen. The Case Note box allows you to enter optional free text that you would
like printed on the written report. This free text can later be saved in the database in the
Case record. There are two options:
Previous takes you back to the Serum Level Forecast Screen where you can change the
data you entered.
Print takes you to the Windows print utility where you can designate the printer of your
choice to print a written report. After printing, the program takes you to the Mode screen
to work on the next patient.
14
Serum Level Analysis Pharmacokinetics
Once serum drug concentrations are available for your patient, the part of T.D.M.S.TM
uses standard pharmacokinetic equations to help you create an individualized dosage
regimen for the patient. These equations are listed in Appendix C.
Figure 9. Parameters Adjustment Screen
Prior to analysis of a specific dosage regimen, you may adjust the population parameters
used as a starting point for the fitting routine. You may also need to specify a route of
administration and drug product from the dropdown menu for some drugs.
Previous takes you to the Factors screen where you can change the factors you entered.
No Fitting takes you to the Mode screen which provides several further options.
Next takes you to the History Spreadsheet Screen where you enter the dosage and serum
level histories of the patient.
15
Figure 10. History Spreadsheet Screen
On this screen you enter the Dosage History and Serum Level History for the patient. Up
to 9 different dosage regimens may be entered. In the final column, you must specify if
the doses were given on the inpatient (I) or outpatient (O) setting.
Up to ten serum levels may be entered. As most fields are filled completely, the cursor
will jump to the next cell. On subsequent lines, the Year, Date, minutes and Route will be
automatically filled with the same data as the line above if you hit the Enter or Tab key.
You may change these default data by typing in other values.
To navigate this screen without entering default data, use the mouse or arrow keys. The
F2 key also jumps between the Dosage and Serum Level Histories. To change entered
data, move to the cell of interest with the mouse or arrow keys and retype the entry. To
erase entire lines of data, enter the number “0" or letter “X”in the year field. This will
erase the data on that and all subsequent lines in the Dosage History or Serum Level
History.
Previous takes you to the Parameters Adjustment Screen where you can change the data
you entered.
Next takes you to the Analysis Results Screen.
16
Figure 11. Analysis Results Screen.
The Analysis Results screen (Screen 11) displays the results of the curve fittings which
are grouped in three parts of the screen. Throughout this screen, red denotes Population
values calculated from patient demographic factors, blue denotes the results obtained
from Bayesian curve fitting, and green denotes the results obtained from nonlinear LeastSquares curve fitting.
In the upper left, pharmacokinetic parameters are displayed. Bayesian and Least-Squares
values also display the Range (standard deviation) of each value. In the upper right, the
serum concentration value at each point in time when a serum level was entered is
displayed. The actual measured values are followed by the values calculated using the
Population, Bayesian, and Least Squares pharmacokinetic values for that time point. At
the bottom of the screen, graphical representations of the serum concentrations versus
time plots are displayed, with Bayesian and Least-Squares plots compared to Population
plots in each case. These graphs provide a visual method of checking for correct entry of
the dosage and serum level history on the previous screen. If only one serum level was
obtained, only the Population and Bayesian values and plots are displayed because there
is no valid mathematical meaning to a Least- Squares fitting of one point.
Previous takes you to the History Spreadsheet Screen where you can change the data you
entered.
17
Routine Bayes Analysis takes you to the Individualized Routine Dosage Regimen
Forecast Screen (Screen 12) that allows you to predict the dosage regimen required to
achieve given serum drug concentrations that you enter. Results are calculated using
Bayesian pharmacokinetic values.
Routine LS Analysis takes you to the Individualized Routine Dosage Regimen Forecast
Screen (Screen 12) that allows you to predict the dosage regimen required to achieve
given serum drug concentrations that you enter. Results are calculated using Least
Squares pharmacokinetic values.
Detailed Analysis takes you to the Detailed Analysis Screen that allows you to predict
the serum drug concentrations achieved by dosage regimen that you enter using both
Bayesian and Least Squares values.
18
Figure 12. Individualized Dosage Regimen Forecast Screens
The Individualized Bayesian and Least Squares Dosage Regimen Forecast Screens allow
you to predict the dosage regimen required to achieve the exact serum drug
concentrations that you enter. Results are calculated using either Bayesian or LeastSquares pharmacokinetic values, indicated just below the patient’s ID number and name.
On this screen, you may select the Route and specific drug product in the dropdown box
in the middle of the screen. The exact dosage regimen required to produce the serum drug
concentrations you specify are displayed in the Exact Estimates column. You may enter
further information in the Loading Dose Forecast column to calculate the dose required
to produce the Desired Post after the first dose. Because calculations often result in
impractical doses or frequencies, the results obtained on this screen should be considered
approximate dosage regimens and the best exact regimens should be determined by using
the Serum Drug Level Forecast Screen (Figure 13).
Previous takes you to the History Spreadsheet Screen where you can change the data.
Serum Level Forecast takes you to the serum level forecast screen that allows you to
predict the serum drug concentrations achieved by dosage regimen that you enter.
Done takes you to the Mode screen which provides several further options.
19
Figure 13. Individualized Serum Level Forecast Screens
The Individualized Bayesian and Least Squares Serum Level Forecast Screen (Figure 13)
allows you to predict the serum drug concentrations achieved by dosage regimen that you
enter. Results are calculated using Bayesian or Least Squares pharmacokinetic values,
indicated just below the patient’s ID number and name. On this screen, you may select
the Route and Product and enter the dosage regimen that you desire. The steady-state
serum levels predict to be produced by this regimen are displayed. For antimicrobial
agents, enter the minimum inhibitory concentration (MIC) of the organism to calculate
pharmacodynamic values (i.e., Post/MIC, Time Above MIC and AUIC) at steady-state
which are displayed at the bottom of the second column (see Appendix B for an
explanation of these values).
For oral or intramuscular drugs you may enter an uneven daily dosage regimen of up to 4
doses per day. Enter the dose and hour on each line, then the time of day that you wish to
know the serum level that is predicted. Steady-state peak, trough and average levels will
be calculated in addition to the serum level at the time you specified.
Previous takes you to the History Spreadsheet Screen where you can change the data.
Report takes you to the Individualized Report Screen (Figure 15). The parameters
reported there depend on whether you select Routine Bayes or Routine L.S. Analysis on
the previous screen.
Done takes you to the Mode screen which provides several further options.
20
Figure 14. Detailed Analysis Screen
The Detailed Analysis Screen (Figure 14) allows you to predict the serum drug
concentrations achieved by dosage regimen that you enter. Results are calculated using
both Bayesian and Least-Squares values and provide both mean serum concentration
values and the 95% confidence intervals around each level.
Previous takes you to the Analysis Results Screen where you can change the data you
entered.
Bayes Report and LS Report both take you to the Individualized Report Screen (Figure
15). The parameters reported there depend on whether you select Bayes or L.S. Report on
this screen.
Done takes you to the Mode screen which provides several further options.
21
Figure 15. Individualized Report Screen
The Individualized Report Screen (Figure 15) displays the Patient:s demographic data,
Bayesian or Least Squares pharmacokinetic parameters and the last dosage regimen that
you evaluated on the previous screen. The Case Note box allows you to enter optional
free text that you would like printed on the written report. This free text can later be
saved in the database in the Case record. In the Report Printing Options box, you can
uncheck the Print Graphics and Print Population Parameters options to simplify the
report that is printed.
Previous takes you back to the Bayesian, Least Squares or Detailed Serum Level
Analysis Screen, depending on where you came from, where you can change the data you
entered.
Print takes you to the Windows print utility where you can designate the printer of your
choice to print a written report.
22
Figure 16. Mode Screen
The Mode Screen gives you several options:
Work on the Same Patient and Same Drug saves all the Patient and Case data. You
can only work on the same drug that you have been analyzing.
Work on the Same Patient saves all the Patient data. You can work on any drug with a
new patient.
Work on a New Patient deletes all Patient and Case data.
Save this Case in Database saves all data you have entered in the database.
Previous takes you back to the last screen you were working on.
Exit ends T.D.M.S.TM
23


![TEMPLATE No1 [CPMP positive opinion full application]](http://vs1.manualzilla.com/store/data/005681628_1-1a3acb54fcca990dd8c826546eb4788f-150x150.png)