1
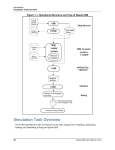
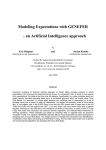
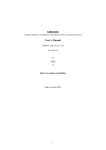
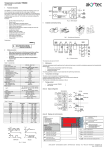
Software Manual
Institute of Bioinformatics, Johannes Kepler University Linz
RoCoCo
An R Package Implementing a Robust Rank
Correlation Coefficient and a Corresponding Test
Ulrich Bodenhofer1 and Martin Krone2
1 Institute
of Bioinformatics, Johannes Kepler University
Altenberger Str. 69, 4040 Linz, Austria
2 Department
of Computer Science
Ostfalia University of Applied Sciences
Salzdahlumer Str. 46/48, 38302 Wolfenbüttel, Germany
[email protected]
Version 1.1.1, February 27, 2014
Institute of Bioinformatics
Johannes Kepler University Linz
A-4040 Linz, Austria
Tel. +43 732 2468 4520
Fax +43 732 2468 4539
http://www.bioinf.jku.at
2
Contents
Scope and Purpose of this Document
This document is a user manual for the R package rococo. It is only meant as a gentle introduction
into how to use the basic functions implemented in this package. Not all features of the R package
are described in full detail. Such details can be obtained from the documentation enclosed in the
R package. Further note the following: (1) this is not an introduction to robust rank correlation;
(2) this is not an introduction to R. If you lack the background for understanding this manual, you
first have to read literature on these subjects.
Contents
1
Introduction
3
2
Installation
2.1 Installation via CRAN . . . . . . . . . . . . . . . . . . . . . . . . . . . . . . .
2.2 Manual installation . . . . . . . . . . . . . . . . . . . . . . . . . . . . . . . . .
2.3 Compatibility issues . . . . . . . . . . . . . . . . . . . . . . . . . . . . . . . . .
3
3
3
4
3
Getting Started
4
4
Adjusting Similarities and t-Norms
4.1 Background . . . . . . . . . . . . . .
4.2 Choosing the Family of Similarities .
4.3 Parametrizing Similarities . . . . . .
4.4 Choosing the t-Norm for Aggregation
.
.
.
.
.
.
.
.
.
.
.
.
.
.
.
.
.
.
.
.
.
.
.
.
.
.
.
.
.
.
.
.
.
.
.
.
.
.
.
.
.
.
.
.
.
.
.
.
.
.
.
.
.
.
.
.
.
.
.
.
.
.
.
.
.
.
.
.
.
.
.
.
.
.
.
.
.
.
.
.
.
.
.
.
.
.
.
.
.
.
.
.
7
7
7
10
11
5
A Note on Permutation Testing
13
6
The Gaussian Rank Correlation Estimator
16
7
Change Log
7.1 Upgrading to Version 1.1.1 . . . . . . . . . . . . . . . . . . . . . . . . . . . . .
17
18
8
How to Cite This Package
18
1
Introduction
1
Introduction
3
Correlation measures are among the most basic tools in statistical data analysis and machine learning. They are applied to pairs of observations to measure to which extent the two observations
comply with a certain model. The most prominent representative is surely Pearson’s product
moment coefficient [1, 15], often nonchalantly called correlation coefficient for short. Pearson’s
product moment coefficient can be applied to numerical data and assumes a linear relationship as
the underlying model; therefore, it can be used to detect linear relationships, but no non-linear
ones.
Rank correlation measures [9, 12, 14] are intended to measure to which extent a monotonic
function is able to model the inherent relationship between the two observables. They neither
assume a specific parametric model nor specific distributions of the observables. They can be
applied to ordinal data and, if some ordering relation is given, to numerical data too. Therefore,
rank correlation measures are ideally suited for detecting monotonic relationships, in particular, if
more specific information about the data is not available. The two most common approaches are
Spearman’s rank correlation coefficient (short Spearman’s rho) [17, 18] and Kendall’s tau (rank
correlation coefficient) [2, 11, 12]. Another simple rank correlation measure is the gamma rank
correlation measure according to Goodman and Kruskal [9].
The rank correlation measures cited above are designed for ordinal data. However, as argued
in [5], they are not ideally suited for measuring rank correlation for numerical data that are perturbed by noise. Consequently, [5] introduces a family of robust rank correlation measures. The
idea is to replace the classical ordering of real numbers used in Goodman’s and Kruskal’s gamma
[9] by some fuzzy ordering [10, 3, 4] with smooth transitions — thereby ensuring that the correlation measure is continuous with respect to the data. This package provides this family of rank
correlation measures along with corresponding statistical tests (as introduced in [6]). Moreover,
the package also implements the Gaussian rank correlation estimator [7] and a corresponding statistical test.
2
Installation
2.1
Installation via CRAN
The R package rococo (current version: 1.1.1) is part of the Comprehensive R Archive Network
(CRAN)1 . The simplest way to install the package, therefore, is to enter the following command
into your R session:
> install.packages("rococo")
2.2
Manual installation
If, for what reason ever, you prefer to install the package manually, download the package file
suitable for your computer system and copy it to your harddisk. Open the package’s page at
CRAN2 and then proceed as follows.
1
2
http://cran.r-project.org/
http://cran.r-project.org/web/packages/rococo/index.html
4
3
Getting Started
Manual installation under Windows
1. Download rococo_1.1.1.zip and save it to your harddisk
2. Open the R GUI and select the menu entry
Packages | Install package(s) from local zip files...
(if you use R in a different language, search for the analogous menu entry). In the file dialog
that opens, go to the folder where you placed rococo_1.1.1.zip and select this file. The
package should be installed now.
Manual installation under Linux/UNIX/MacOS
1. Download rococo_1.1.1.tar.gz and save it to your harddisk.
2. Open a shell window and change to the directory where you put rococo_1.1.1.tar.gz.
Enter
R CMD INSTALL rococo_1.1.1.tar.gz
to install the package.
2.3
Compatibility issues
Both the Windows and the Linux/UNIX/MacOS version available from CRAN have been built
using the latest version, R 3.0.2. However, the package should work without severe problems on
R versions ≥2.12.0.
3
Getting Started
To load the package, enter the following in your R session:
> library(rococo)
You will probably see a message that package Rcpp has been loaded (in case it has not been loaded
previously in the current R session). Apart from this, you can be sure that the package has been
installed successfully if this command terminates without any further error message or warning.
If so, the package is ready for use now.
The package includes both a user manual (this document) and a reference manual (help pages
for each function). To view the user manual, enter
> vignette("rococo")
Help pages can be viewed using the help command. It is recommended to start with
> help(rococo)
3
Getting Started
5
For demonstration purposes, let us first create an artificial toy data set:
> x1 <- rnorm(15)
> y1 <- 2 * x1 + rnorm(length(x1), sd=0.25)
> plot(x1, y1)
4
●
2
●
●●
y1
●
●
0
●
●
●
●
●
−2
●
●
●
−1
0
1
2
x1
Obviously, these are linearly correlated Gaussian data, so Pearson’s product moment correlation
coefficient [1, 15] would be the optimal choice. We use these data anyway, only for illustration
purposes. The function rococo() can be used to compute the robust rank correlation coefficient
as follows:
> rococo(x1, y1)
[1] 0.9856833
To perform a robust rank correlation test, use the function rococo.test:
> rococo.test(x1, y1, alternative="two.sided")
Robust Gamma Rank Correlation:
data: x1 and y1 (length = 15)
similarity: linear
rx = 0.1575895 / ry = 0.3151384
t-norm: min
alternative hypothesis: true gamma is not equal to 0
sample gamma = 0.9856833
estimated p-value = < 2.2e-16 (0 of 1000 values)
6
3
Getting Started
The argument alternative works in the same way as for the standard function cor.test().
The function rococo.test() is a generic method that can be called on two numeric vectors
(as above) or, alternatively, using a formula to conveniently extract two columns from a data frame:
> data(iris)
> plot(~ Sepal.Length + Petal.Length, iris)
> rococo.test(~ Sepal.Length + Petal.Length, iris, alternative="two.sided")
Robust Gamma Rank Correlation:
7
data: Sepal.Length and Petal.Length (length = 150)
similarity: linear
rx = 0.13 / ry = 0.35
t-norm: min
alternative hypothesis: true gamma is not equal to 0
sample gamma = 0.7940949
estimated p-value = < 2.2e-16 (0 of 1000 values)
●
●●
6
5
4
●
●
●
●●
●
●
●
●
3
2
1
●
●
●●
●●
●●
●●●
●
●
●
●● ●●
●
●●
●●●
●●●●
●●●●●●●
● ● ●●
●●
●●
●●●●
●●
●
●
●
●●
●
●
Petal.Length
●
●
●●
●
●
●
●●●
●
● ●
● ●
●● ●
●
●
●
●
●
●
●●●●●
●●
●
●
●●
●●●
●●●●●●●
●
●●
●
●
●
●
4.5
5.0
●
●
●
5.5
6.0
6.5
7.0
7.5
8.0
Sepal.Length
All examples above use default settings for the fuzzy orderings that are used to define the
rank correlation coefficient. In the following section, we introduce the concept behind the robust
gamma rank correlation coefficient in greater depth and describe how to adjust the corresponding
settings properly.
4
Adjusting Similarities and t-Norms
4
Adjusting Similarities and t-Norms
4.1
7
Background
The robust gamma rank correlation coefficient requires the definition of two strict fuzzy orderings
[4], RX and RY . A strict fuzzy ordering is a two-place function that measures to which degree its
second argument is strictly larger than its first argument. Given a data set consisting of n pairs of
observations (where n ≥ 2)
(xi , yi )ni=1 ,
(1)
RX is used for comparing x observations and RY is used for comparing y observations.
Given a data set as in Eq. (1), the strict fuzzy orderings RX and RY are used to compute two
important numbers, the number of concordant pairs C̃ and the number of discordant pairs D̃:
C̃ =
n X
X
T̄ (RX (xi , xj ), RY (yi , yj ))
i=1 j6=i
D̃ =
n X
X
T̄ (RX (xi , xj ), RY (yj , yi ))
i=1 j6=i
The function T̄ is a triangular (t-norm) [13] that is used to aggregate degrees of relationships
between pairs of x observations and the corresponding degrees for y observations (see below).
The final robust gamma rank correlation coefficient is then computed as
γ̃ =
C̃ − D̃
C̃ + D̃
in perfect analogy to Goodman’s and Kruskal’s gamma [9].
4.2
Choosing the Family of Similarities
It should be clear from the description above that the robust gamma rank correlation coefficient
requires the following ingredients:
1. A fuzzy ordering RX for the x observations
2. A fuzzy ordering RY for the y observations
3. A t-norm T̄ for aggregation.
For RX and RY , the rococo package provides five possible choices which are identified by the
similarity that is used to define the strict fuzzy ordering (for more details see [4, 5]). Table 1
provides an overview.
Obviously, in all five cases, the strict fuzzy ordering R is computed from the similarity E in
the following way:
(
1 − E(x, x0 ) if x0 > x
0
R(x, x ) =
0
otherwise
8
4
Adjusting Similarities and t-Norms
Table 1: Overview of strict fuzzy orderings implemented in the rococo package:
Setting
Similarity
Strict fuzzy ordering
"linear"
E(x, x0 ) = max(0, 1 − 1r |x − x0 |)
R(x, x0 ) = max(0, min(1, 1r (x0 − x)))
"exp"
E(x, x0 ) = exp(− 1r |x − x0 |)
R(x, x0 ) = max(0, 1 − exp(− 1r (x0 − x)))
(
"gauss"
E(x, x0 ) = exp(− 2r12 (x − x0 )2 )
"epstol"
(
1
E(x, x ) =
0
(
"classical"
if |x − x0 | ≤ r
otherwise
0
0
E(x, x ) =
1
0
if x = x0
otherwise
R(x, x0 ) =
1 − exp(− 2r12 (x − x0 )2 ) if x ≤ x0
0
otherwise
(
0
R(x, x ) =
(
0
R(x, x ) =
if x0 > x + r
otherwise
1
0
1
0
if x0 > x
otherwise
Further note that the choices "epstol" and "classical" are not continuous. The former is the
well-known ε-intolerant similarity that has been discussed widely in the context of the Poincaré
paradox (note that this similarity is not a transitive relation). The latter setting "classical"
corresponds to the classical Goodman and Kruskal gamma.
The functions rococo() and rococo.test() choose the first variant "linear" by default,
both for x and y observations. If one wants to choose a different setting or two different strict fuzzy
orderings for x and y observations, the similarity argument can be used. For demonstrating this,
we create a noisy data set from a function f that has a large flat area:
>
>
+
+
+
+
+
>
>
x2 <- rnorm(15)
f2 <- function(x)
{
if (x > 0.8) x - 0.8
else if (x < -0.8) x + 0.8
else 0
}
y2 <- sapply(x2, f2) + rnorm(length(x2), sd=0.1)
plot(x2, y2)
Adjusting Similarities and t-Norms
9
1.0
4
0.5
●
y2
●●
●
0.0
●
●
●
●
●
●
●
●
●
−0.5
●
●
−1.0
−0.5
0.0
0.5
1.0
1.5
x2
As said before, "linear" is the default choice:
> rococo.test(x2, y2, alternative="greater")
Robust Gamma Rank Correlation:
data: x2 and y2 (length = 15)
similarity: linear
rx = 0.1357292 / ry = 0.02639592
t-norm: min
alternative hypothesis: true gamma is greater than 0
sample gamma = 0.62615
estimated p-value = 0.002 (2 of 1000 values)
This default setting makes sense in particular if no information about the data, their distribution,
or not even the noise distribution is known. Now let us try some different settings:
> rococo.test(x2, y2, similarity="gauss", alternative="greater")
Robust Gamma Rank Correlation:
data: x2 and y2 (length = 15)
similarity: gauss
rx = 0.1357292 / ry = 0.02639592
t-norm: min
alternative hypothesis: true gamma is greater than 0
sample gamma = 0.7052882
estimated p-value = < 2.2e-16 (0 of 1000 values)
10
4
Adjusting Similarities and t-Norms
> rococo.test(x2, y2, similarity=c("classical", "gauss"), alternative="greater")
Robust Gamma Rank Correlation:
data: x2 and y2 (length = 15)
similarity for x: classical
similarity for y: gauss (ry = 0.02639592)
t-norm: min
alternative hypothesis: true gamma is greater than 0
sample gamma = 0.6467861
estimated p-value = < 2.2e-16 (0 of 1000 values)
Particularly note the latter of the two examples: different settings for x and y observations can be
done by supplying a vector to the similarity argument, where the first element determines the
choice for x observations and the second element determines the choice for y observations.
4.3
Parametrizing Similarities
So far, we have neglected that four of the five similarities/fuzzy orderings listed in Table 1 require
an additional parameter r. In all four cases, r controls the importance of observations that are
close to each other. The smaller r, the more similar observations are taken into account when
computing the numbers of concordant and discordant pairs. This entails that, the smaller r, the
easier noise can corrupt the result. The larger r, the less similar observations are considered, i.e.
the more noise-tolerant the result will be. However, that does not mean that the largest possible r
is the best choice. An overly large r can result in unspecific and unsignificant results. The rococo
package allows for setting one r for both x and y observations:
> rococo.test(x2, y2, similarity="gauss", r=0.1, alternative="greater")
Robust Gamma Rank Correlation:
data: x2 and y2 (length = 15)
similarity: gauss
rx = 0.1 / ry = 0.1
t-norm: min
alternative hypothesis: true gamma is greater than 0
sample gamma = 0.7638568
estimated p-value = < 2.2e-16 (0 of 1000 values)
It is also possible to specify different values of r for x and y observations. Analogously to the
parameter similarity, this can be done by supplying a two-element vector to the parameter r:
> rococo.test(x2, y2, similarity=c("linear", "gauss"), r=c(0.05, 0.1),
+
alternative="greater")
4
Adjusting Similarities and t-Norms
11
Robust Gamma Rank Correlation:
data: x2 and y2 (length = 15)
similarity for x: linear (rx = 0.05)
similarity for y: gauss (ry = 0.1)
t-norm: min
alternative hypothesis: true gamma is greater than 0
sample gamma = 0.742687
estimated p-value = 0.002 (2 of 1000 values)
It should be clear from the formulas in Table 1 that r = 0 is either invalid or does not make sense.
The rococo package still admits choosing a zero value. In this case, rococo makes an automatic
adjustment of r to 10% of the interquartile range (the difference between the 75% and the 25%
quantile) of the observation under consideration:
> rococo.test(x2, y2, similarity=c("linear", "gauss"), r=0, alternative="greater")
Robust Gamma Rank Correlation:
data: x2 and y2 (length = 15)
similarity for x: linear (rx = 0.1357292)
similarity for y: gauss (ry = 0.02639592)
t-norm: min
alternative hypothesis: true gamma is greater than 0
sample gamma = 0.6497884
estimated p-value = < 2.2e-16 (0 of 1000 values)
> IQR(x2) * 0.1
[1] 0.1357292
> IQR(y2) * 0.1
[1] 0.02639592
In the results above, note the values rx and ry in the output of rococo.test(). These are the
values that have been specified or that have been determined automatically. The computations of
10% of the interquartile range should demonstrate that this is what takes place when r is set to 0.
Note that this is also done by default if the argument r is not specified.
4.4
Choosing the t-Norm for Aggregation
As mentioned above, the robust gamma rank correlation coefficient further requires to specify a
t-norm T̄ that is used for aggregation of the ordering measures from x and y observations. The
rococo package offers three built-in t-norms that can be selected by specifying the tnorm argument when calling the functions rococo() and rococo.test(). Table 2 provides an overview.
Here is an example that uses the product t-norm for aggregation:
12
4
Adjusting Similarities and t-Norms
Table 2: Overview of strict fuzzy orderings implemented in the rococo package:
Setting
t-Norm
"min" (default)
TM (x, y) = min(x, y)
"prod"
TP (x, y) = x · y
"lukasiewicz"
TL (x, y) = max(0, x + y − 1)
> rococo.test(x2, y2, similarity=c("linear", "gauss"), tnorm="prod",
+
alternative="greater")
Robust Gamma Rank Correlation:
data: x2 and y2 (length = 15)
similarity for x: linear (rx = 0.1357292)
similarity for y: gauss (ry = 0.02639592)
t-norm: prod
alternative hypothesis: true gamma is greater than 0
sample gamma = 0.6513292
estimated p-value = < 2.2e-16 (0 of 1000 values)
The choice of the t-norm T̄ is not particularly critical and should not have a strong influence
on the significance of results. Most users will suffice with the default setting "min". The choice
"prod" produces similar, but slightly smoother results which may be suitable in combination with
the only differentiable fuzzy ordering (similarity="gauss").
Even though the choice is not critical, the rococo package also offers the choice of userdefined t-norms by supplying a two-place function as tnorm argument. Here is an example with
some Yager t-norm [13, 19]:
>
+
+
+
+
+
>
+
+
+
+
+
+
DrastictNorm <- function(x, y)
{
if (x == 1) y
else if (y == 1) x
else 0
}
YagertNorm <- function(lambda)
{
fun <- function(x, y)
{
if (lambda == 0)
DrastictNorm(x, y)
else if (is.infinite(lambda))
5
A Note on Permutation Testing
13
+
min(x, y)
+
else
+
max(0, 1 - ((1 - x)^lambda + (1 - y)^lambda)^(1 / lambda))
+
}
+
+
attr(fun, "name") <- paste("Yager t-norm with lambda =", lambda)
+
+
fun
+ }
> rococo(x2, y2, tnorm=YagertNorm(0.5))
[1] 0.6367255
> rococo.test(x2, y2, tnorm=YagertNorm(0.2))
Robust Gamma Rank Correlation:
data: x2 and y2 (length = 15)
similarity: linear
rx = 0.1357292 / ry = 0.02639592
t-norm: Yager t-norm with lambda = 0.2
alternative hypothesis: true gamma is not equal to 0
sample gamma = 0.6367255
estimated p-value = < 2.2e-16 (0 of 1000 values)
Note that the rococo package performs only a few basic checks on a user-defined t-norm. It
remains the duty of the user to ensure that the function is actually a valid t-norm.
The three built-in t-norms (see Table 2) are efficiently implemented in C++ and called with
the help of the Rcpp package [8] while user-defined t-norms have to be evaluated in R loops. Even
though we use the compiler package (if available) to pre-compile the user-defined t-norm, this
may still result in a drastic slowdown of computations, particularly for larger data sets or when
using rococo.test() with exact=TRUE (see end of next section).
5
A Note on Permutation Testing
Classical rank correlation measures only depend on the sorting of x and y observations. Thus,
for a given number of samples n, one can deduce the distribution of the test statistic under the
H0 hypothesis as a simple function of the number of samples n. We neither want to make any
prior assumption about the distribution of data nor does the complex inner structure of the robust
gamma rank correlation coefficient and the variety of possible parameter settings allow for an
analytic deduction of the test statistic’s distribution. Therefore, we use permutation testing for
estimating the null distribution of the test statistic under the assumption of independence. This
is done in the following way: For a given data set (xi , yi )ni=1 , we first compute the robust rank
correlation coefficient according to the specified parameters. Then we create K random shuffles
14
5
A Note on Permutation Testing
(yi0 )ni=1 of (yi )ni=1 and compute the robust rank correlation coefficient for (xi , yi0 )ni=1 according
to the specified parameters. Due to the shuffling, (xi )ni=1 and (yi0 )ni=1 are independent, where
(yi0 )ni=1 has the same marginal distribution as (yi )ni=1 . Thus, the robust rank correlation coefficients
obtained for a sufficiently large number of shuffles allows for estimating the distribution of the test
statistics under the H0 hypothesis with given marginal distributions and we can estimate the test’s
p-value in the following simple way:
as the relative frequency the test statistics’ absolute value exceeded the absolute value of the
test statistic for the unshuffled data in case we perform a two-sided test,
as the relative frequency the test statistic was greater than the test statistic for the unshuffled
data in case we perform a one-sided test with alternative hypothesis that there is a positive
correlation, and
as the relative frequency the test statistic was less than the test statistic for the unshuffled
data in case we perform a one-sided test with alternative hypothesis that there is a negative
correlation.
This p-value is contained in the slot p.value of the output object the test returns. This output
object further contains a slot count that corresponds to the absolute number of times
the test statistics’ absolute value exceeded the absolute value of the test statistic for the
unshuffled data in case we perform a two-sided test,
the test statistic was greater than the test statistic for the unshuffled data in case we perform
a one-sided test with alternative hypothesis that there is a positive correlation, and
the test statistic was less than the test statistic for the unshuffled data in case we perform a
one-sided test with alternative hypothesis that there is a negative correlation.
Please note that these p-values are only estimates. The smaller the number of shuffles, the
higher the variance of the estimates. This number of shuffles performed by rococo.test() is
controlled by the parameter numtests (the default is 1000). We concur that 1000 samples are
sufficient (at least with high probability) if one wants to test whether the association is significant
with a significance threshold of 95% or 99%. If the user, however, is interested in much more
exact estimates of the p-value or if he/she wants to test against much more stringest significance
thresholds, it may be necessary to perform much higher numbers of shuffles. Needless to mention,
this will also result in an increase of computation times, where the computation time grows linearly
with the number of shuffles.
Here is an example with 100,000 shuffles, where we use the option storeValue=TRUE to get
access to the rank correlation values for all random shuffles:
> res <- rococo.test(x2, y2, numtests=100000, storeValues=TRUE)
> res
Robust Gamma Rank Correlation:
5
A Note on Permutation Testing
15
data: x2 and y2 (length = 15)
similarity: linear
rx = 0.1357292 / ry = 0.02639592
t-norm: min
alternative hypothesis: true gamma is not equal to 0
sample gamma = 0.62615
estimated p-value = 0.00107 (107 of 100000 values)
For small data sets (not more than 10 samples), the package further provides computations of
exact p-values. This can be enforced by passing the argument exact=TRUE to rococo.test(). In
this case, all possible permutations are considered (using the Steinhaus-Johnson-Trotter algorithm;
see, e.g., [16]) and the exact p-value is computed as the quotient of the above count (slot count)
over the number of trials (the factorial of the length of x and y):
> rococo.test(x2[1:8], y2[1:8], exact=TRUE)
Robust Gamma Rank Correlation:
data: x2[1:8] and y2[1:8] (length = 8)
similarity: linear
rx = 0.1253808 / ry = 0.02205911
t-norm: min
alternative hypothesis: true gamma is not equal to 0
sample gamma = 0.4110654
exact p-value = 0.1771329 (7142 of 40320 values)
Using the exact test for 10 samples results in 10! = 3628800 permutations that have to be considered. For the built-in t-norms, such a computation should finish within a few seconds. However,
in conjunction with a user-defined t-norm, computations may be significantly longer, in the range
of several minutes.
Kendall’s rank correlation test is based on a normal approximation of the null distribution. The
following picture suggests that a normal approximation may also be suitable for the robust rank
correlation test (data from the above example with 100,000 shuffles):
> hist([email protected], breaks=100, probability=TRUE, xlab="gamma",
+
main="Distribution of gamma for random shuffles")
> plot(function(x) dnorm(x, [email protected], [email protected]),
+
min([email protected]), max([email protected]), col="red", lwd=2, add=TRUE)
16
6
The Gaussian Rank Correlation Estimator
1.0
0.0
0.5
Density
1.5
Distribution of gamma for random shuffles
−0.5
0.0
0.5
gamma
However, statistical analyses have shown that the null distributions are seldom normal. Anyway, the rococo package also provides p-values based on the normal approximation in the slot
p.value.approx of the resulting output object:
> [email protected]
[1] 0.002012103
The user should be warned, however, that these p-values are systematically biased and that he/she
is recommended to use the standard p-values as described above (for a sufficiently large number
of shuffles).
6
The Gaussian Rank Correlation Estimator
The Gaussian rank correlation estimator [7] is a simple and well-performing alternative to our
proposed robust gamma rank correlation coefficient. Since, to our best knowledge, no R implementation has been available so far, we implemented this rank correlation measure and the
corresponding test in the rococo package. Example:
> gauss.cor(x1, y1)
[1] 0.9783698
> gauss.cor.test(x1, y1, alternative="two.sided")
7
Change Log
17
Gaussian rank correlation estimator
data: x1 and y1
t = 17.0526, df = 13, p-value = 2.81e-10
alternative hypothesis: true correlation is not equal to 0
95 percent confidence interval:
0.9344238 0.9929723
sample estimates:
cor
0.9783698
> gauss.cor.test(~ Sepal.Length + Petal.Length, iris, alternative="two.sided")
Gaussian rank correlation estimator
data: Sepal.Length and Petal.Length
t = 21.4175, df = 148, p-value < 2.2e-16
alternative hypothesis: true correlation is not equal to 0
95 percent confidence interval:
0.8240938 0.9038302
sample estimates:
cor
0.8695177
7
Change Log
Version 1.1.1:
adapted dependencies and linking to Rcpp version 0.11.0
cleared up package dependencies
Version 1.1.0:
estimation of p-values now based on relative frequencies
Gaussian rank correlation estimator and test added
corresponding adaptations of man pages and vignette
updated citation
moved vignette to ’vignettes’ according to the new guidelines
Version 1.0.1:
improved estimation of p-values
added exact computation of p-values (only for 10 or less samples)
corresponding adaptations of man pages and vignette
Version 1.0.0: first official release, released October 3, 2011
18
7.1
References
Upgrading to Version 1.1.1
Users who upgrade to Version 1.1.1 from an older version should be aware that the package now
requires Rcpp Version 0.11.0 (or newer). This issue can simply be solved by re-installing Rcpp
from CRAN using install.packages("Rcpp").
8
How to Cite This Package
If you use this package for research that is published later, you are kindly asked to cite it as follows:
U. Bodenhofer, M. Krone, and F. Klawonn (2012). Testing noisy numerical data for
monotonic association. Inform. Sci., DOI: 10.1016/j.ins.2012.11.026.
U. Bodenhofer and F. Klawonn (2008). Robust rank correlation coefficients on the
basis of fuzzy orderings: initial steps. Mathware Soft Comput. 15(1):5–20.
To obtain a BibTEX entry of the reference, you can enter the following into your R session:
> toBibtex(citation("rococo"))
Acknowledgment
The core of this package was implemented during a short-term scientific mission of Martin Krone
at the Institute of Bioinformatics, Johannes Kepler University, within the framework of COST
Action IC0702 “SoftStat — Combining Soft Computing Techniques and Statistical Methods to Improve Data Analysis Solutions”. Therefore, the support of this project is gratefully acknowledged.
References
[1] H. Abdi. Coefficients of correlation, alienation and determination. In N. J. Salkind, editor,
Encyclopedia of Measurement and Statistics. Sage, Thousand Oaks, CA, 2007.
[2] H. Abdi. The Kendall rank correlation coefficient. In N. J. Salkind, editor, Encyclopedia of
Measurement and Statistics. Sage, Thousand Oaks, CA, 2007.
[3] U. Bodenhofer. A similarity-based generalization of fuzzy orderings preserving the classical
axioms. Internat. J. Uncertain. Fuzziness Knowledge-Based Systems, 8(5):593–610, 2000.
[4] U. Bodenhofer and M. Demirci. Strict fuzzy orderings with a given context of similarity.
Internat. J. Uncertain. Fuzziness Knowledge-Based Systems, 16(2):147–178, 2008.
[5] U. Bodenhofer and F. Klawonn. Robust rank correlation coefficients on the basis of fuzzy
orderings: initial steps. Mathware Soft Comput., 15(1):5–20, 2008.
References
19
[6] U. Bodenhofer, M. Krone, and F. Klawonn. Testing noisy numerical data for monotonic
association. Inform. Sci., 2013. (accepted).
[7] K. Boudt, J. Cornelissen, and C. Croux. The Gaussian rank correlation estimator: robustness
properties. Stat. Comput., 22(2):471–483, 2012.
[8] D. Eddelbuettel and R. François. Rcpp: seamless R and C++ integration. J. Stat. Softw.,
40(8):1–18, 2011.
[9] L. A. Goodman and W. H. Kruskal. Measures of association for cross classifications. J.
Amer. Statist. Assoc., 49(268):732–764, 1954.
[10] U. Höhle and N. Blanchard. Partial ordering in L-underdeterminate sets. Inform. Sci.,
35:133–144, 1985.
[11] M. G. Kendall. A new measure of rank correlation. Biometrika, 30:81–93, 1938.
[12] M. G. Kendall. Rank Correlation Methods. Charles Griffin & Co., London, third edition,
1962.
[13] E. P. Klement, R. Mesiar, and E. Pap. Triangular Norms, volume 8 of Trends in Logic.
Kluwer Academic Publishers, Dordrecht, 2000.
[14] W. H. Kruskal. Ordinal measures of association. J. Amer. Statist. Assoc., 53(284):814–861,
1958.
[15] K. Pearson. Notes on the history of correlation. Biometrika, 13:25–45, 1920.
[16] R. Sedgewick. Permutation generation methods. ACM Comput. Surv., 9(2):137–164, 1977.
[17] C. Spearman. The proof and measurement of association between two things. Am. J. Psychol., 15(1):72–101, 1904.
[18] C. Spearman. Demonstration of formulae for true measurement of correlation. Am. J. Psychol., 18(2):161–169, 1907.
[19] R. R. Yager. On a general class of fuzzy connectives. Fuzzy Sets and Systems, 4:235–242,
1980.