1
Tropes – Reference Manual
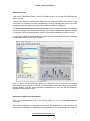
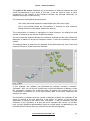
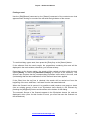
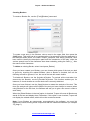
The graph of the actors represents the concentration of relations between the main
actors (actants/acted) in the whole of the text. It can be used to make a visual
comparison of the "weight" of the Relations between the principal references (or
between the groups in the Scenario).
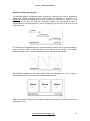
The references are displayed along two axes:
-the X axis (horizontal) shows the actant/acted ratio (from left to right),
-the Y axis (vertical) shows the concentration of relations for each reference
(strong at the top of the graph, weak at the bottom).
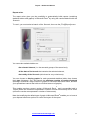
The concentration of relations is calculated, for each reference, by dividing the total
number of relations by the number of different relations.
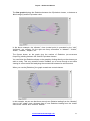
The lines show the relations between the reference selected and the other references
displayed. A dotted line shows an infrequent relation. A solid line indicates a frequent
relation.
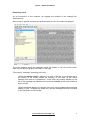
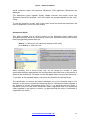
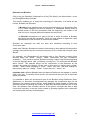
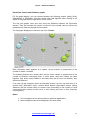
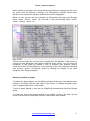
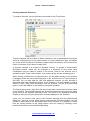
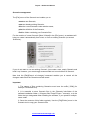
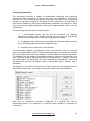
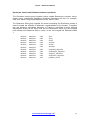
The example below is taken from the analysis of the [Remember.txt]. One of the most
frequent reference ("seară") has been selected.
In this example, the software has positioned the principal concepts (“calendar”,
“perioadă”, “apă”, etc.) at the left (actants with a high concentration of relations), while
the secondary concepts are positioned either at bottom left (actants with a low
concentration of relations) or on the right (acted). Most of the other references are
acted (on the right).
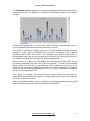
The frequency of relations and the number of different relations are indicators of the
centre of interest of the text analyzed. If the author, or authors, of the text have
associated a reference with many other references, it may be deduced that this
reference is very important, or at any rate more important than others. On another
level, this new graphical representation shows an overall graph, not depending on the
selected reference alone (as is the case with the star and area graphs).
www.semantic-knowledge.com
24