1
VisLog User's Manual (Novo Tech
Software Ltd.)
VisLog User's Manual (Novo Tech Software Ltd.)
Table of Contents
1. About ...................................................................................................................................................................... 3
2. License agreement ................................................................................................................................................. 4
3. Contents ................................................................................................................................................................. 6
3.1 Introduction...................................................................................................................................................... 6
3.2 Toolbar and Menus .......................................................................................................................................... 6
3.3 Using Help ........................................................................................................................................................ 7
3.4 Borehole Editor ................................................................................................................................................ 8
3.5 Soil Profiles ....................................................................................................................................................... 9
3.6 Texture or Color? ............................................................................................................................................ 11
3.7 Working with graphs ...................................................................................................................................... 11
3.8 Import............................................................................................................................................................. 13
3.8.1 From text file (*.txt) ................................................................................................................................. 13
3.8.2 From gINT file (*.gpj) ............................................................................................................................... 14
3.9 Export ............................................................................................................................................................. 14
3.9.1 As image format ...................................................................................................................................... 14
3.9.2 As Autocad R12 DXF format (*.dxf) ......................................................................................................... 15
3.9.3 As movie format (*.avi) ........................................................................................................................... 15
3.10 Preferences .................................................................................................................................................. 15
3.11 Soil Grouping ................................................................................................................................................ 17
3.12 Soil Class Editor ............................................................................................................................................ 18
3.13 Object Management ..................................................................................................................................... 19
3.14 Viewer .......................................................................................................................................................... 20
3.14.1 Starting with VisLog ............................................................................................................................... 20
3.14.2 3D Viewer .............................................................................................................................................. 22
3.14.3 Info-Layers and Viewer Settings ............................................................................................................ 22
3.15 Examples ...................................................................................................................................................... 25
3.15.1 Topography Modelling........................................................................................................................... 25
3.15.2 Ground Improvement Modelling ........................................................................................................... 25
3.15.3 Object Modelling ................................................................................................................................... 25
3.16 File Formats .................................................................................................................................................. 26
3.16.1 Points ..................................................................................................................................................... 26
1
VisLog User's Manual (Novo Tech Software Ltd.)
3.16.2 Polyline .................................................................................................................................................. 26
3.16.3 Polyface ................................................................................................................................................. 26
3.16.4 Surface ................................................................................................................................................... 26
4. Online ................................................................................................................................................................... 28
4.1 Novo Tech Software website .......................................................................................................................... 28
4.2 Our other programs ........................................................................................................................................ 28
4.3 Updates .......................................................................................................................................................... 28
4.4 Contact us ....................................................................................................................................................... 28
2
VisLog User's Manual (Novo Tech Software Ltd.)
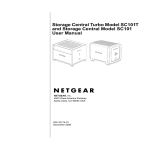
1. About
Software :
VisLog
First Release : September 2008
Development : Microsoft Visual Studio 2010
Licensing Model : License File, On-demand
Production Team : Programming: Alireza Afkhami (M.A.Sc Civil/Geotechnical, M.C.P, I.C.D.L, P.Eng)
Similar Programs :
-
Updates : click to open
Disclaimer : click to read(See 2.)
Using VisLog, the user is able to enter borehole information including their depth, coordinates,
ground water level, etc. and have a three-dimensional interactive view of the subsurface layers at
the site. The ultimate aim of VisLog is to help users with making an image of the soil layers close to
real condition. Input data can be manually entered or imported from gINT - the most widely used
borehole log software in the world. User can enter data using internal borehole editor. When the
model is built based upon the borehole information provided by user, user can zoom, pan and rotate
the 3-dimensional model, print it or even save it as graphic formats or video.
Please keep your software up-to-date by visiting the program's web page.
Although all efforts have been undertaken to ensure that this software is of the highest possible
quality and that the results obtained are correct, the authors do not warrant the functions contained
in the program will meet your requirements or that the operation of the program will be
uninterrupted or error-free. The authors are not responsible and assume no liability for any results
or any use made thereof, nor for any damages or litigation that may result from the use of the
software for any purpose. All results to be verified independently by user.
4188 Hoskins Road,
North Vancouver, BC, Canada
3
VisLog User's Manual (Novo Tech Software Ltd.)
2. License agreement
PLEASE READ THIS END USER LICENSE AGREEMENT ("EULA") CAREFULLY BEFORE DOWNLOADING
OR USING THE SOFTWARE. BY DOWNLOADING THE SOFTWARE, OR USING THE SOFTWARE, YOU
ARE CONSENTING TO BE BOUND BY THIS AGREEMENT. IF YOU DO NOT AGREE TO ALL OF THE
TERMS OF THIS AGREEMENT DO NOT DOWNLOAD AND/OR USE THE SOFTWARE.
The Product is Copyright © 2008-2012 “Novo Tech Software―. You may use it and distribute
it according to this following License Agreement. If you do not agree with these terms, please
remove the Product from your system. By incorporating the Product in your work or distributing the
Product to others you implicitly agree to these license terms.
DEFINITIONS
1. "VisLog" or "Software" refers to “Novo Tech Software―’s program, in each case,
supplied by “Novo Tech Software― herewith, and corresponding documentation, associated
media, and online or electronic documentation.
2. "Trial Version― means a free version of the Software for personal use only, so identified, to be
used in one computer only and for a period of 14 days. The Trial Version is fully functional with no
restrictions compared to the registered version.
3. "Registered Version" means a version which has been bought to “Novo Tech Software―.
LIABILITY DISCLAIMER
The Software and its user manuals and documentations are provided "AS IS" and "WITH ALL
FAULTS," without warranty of any kind, including without limitation the warranties of
merchantability, fitness for a particular purpose and non-infringement. Novo Tech Software makes
no warranty that the Software is free of defects or is suitable for any particular purpose. In no event
shall Novo Tech Software be responsible for loss or damages arising from the installation or use of
the Software, including but not limited to any indirect, punitive, special, incidental or consequential
damages of any character including, without limitation, damages for loss of goodwill, work stoppage,
computer failure or malfunction, or any and all other commercial damages or losses. The entire risk
as to the quality and performance of the Software is borne by user. Should the Software prove
defective, user and not Novo Tech Software assume the entire cost of any service and repair. User is
assumed to have adequate technical and engineering knowledge required to use, interpret and make
the decision on accuracy and adequacy of the results of the Software. All analysis results and
outputs should be validated independently.
FOR VisLog TRIAL VERSION:
(a) You may install and use the Software on a single computer; OR install and store the Software on
a storage device, such as a network server, used only to install the Software on your other
computers over an internal network, provided you have a license for each separate computer on
which the Software is installed and run. A license for the Software may not be shared, installed or
used
concurrently
on
different
computers.
(b) The VisLog Registered version allows the registered user to publish its work according to the
license agreement, but nor “Novo Tech Software― nor any member of the company can be
held
liable
for
the
content
or
accuracy
of
the
publication.
(c) The VisLog Registered version guaranties to the registered user free updates for a whole version
cycle
and
for
12
(twelve)
months.
(d) You shall not use, copy, rent, lease, sell, modify, decompile, disassemble, otherwise reverse
engineer, or transfer the Product except as provided in this Agreement. Any such unauthorized use
shall
result
in
immediate
and
automatic
termination
of
this
Agreement.
(e) Once purchased, the Software may not be return to "Novo Tech Software". The price paid for the
Software is not refundable.
FOR VisLog REGISTERED VERSION:
4
VisLog User's Manual (Novo Tech Software Ltd.)
(a) You may install and use the Software on a single computer; OR install and store the Software on
a storage device, such as a network server, used only to install the Software on your other
computers over an internal network, provided you have a license for each separate computer on
which the Software is installed and run. A license for the Software may not be shared, installed or
used concurrently on different computers.
(b) The VisLog Registered version allows the registered user to publish its work according to the
license agreement, but nor “Novo Tech Software― nor any member of the company can be
held liable for the content or accuracy of the publication.
(c) The VisLog Registered version guaranties to the registered user free updates for a whole version
cycle and for at least 12 (twelve) months.
(e) Once purchased, the Software may not be return to "Novo Tech Software". The price paid for the
Software is not refundable.
(f) The VisLog license is issued for one computer based on the Hardware ID provided by user. Any
transfer of license to another computer, if approved by Novo Tech Software, will be subject to 18
percent charge based on latest VisLog price. if user needs to format his/her computer (because of
virus, etc.) or replaces the hardware parts, Software should be de-activated from that computer in
advance. If the HardwareID does not change after reformatting, we will re-activate that Hardware
ID
with
no
cost.
TERMS
This license is effective until terminated. You may terminate it by destroying the program, the
documentation and copies thereof. This license will also terminate if you fail to comply with any
terms or conditions of this agreement. You agree upon such termination to destroy all copies of the
program and of the documentation, or return them to the author.
OTHER RIGHTS AND RESTRICTIONS
All other rights and restrictions not specifically granted in this license are reserved by us. If you
have any questions regarding this agreement, please write to [email protected]
YOU ACKNOWLEDGE THAT YOU HAVE READ THIS AGREEMENT, UNDERSTAND IT AND AGREE TO BE
BOUND BY ITS TERMS AND CONDITIONS.
5
VisLog User's Manual (Novo Tech Software Ltd.)
3. Contents
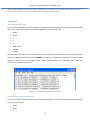
3.1 Introduction
This computer program has been designed to help all geoscience engineers making an image of
subsurface soil layers. Using VisLog you can import most of your existing data from text files or
gINT database files and run the model. VisLog can export your 3D model to graphic formats such as
JPG, BMP and so on. Some of the most common use of VisLog are listed below:
Borehole Log Visualization
The main usage of VisLog is to visualize the boreholes in a site. Input data for this type of
application comprises of: Borehole Name, Total depth, Coordinates, Water Level, and more. VisLog
will show the 3D view of all boreholes in a project and visually presents the ground and water
surface. It also automatically draws the soil profiles through selected boreholes. You can either
manually enter Boreholes data using Borehole Editor(See 3.4) or import data from text files, excel
spreadsheets, or gINT databases .
Ground Improvement or Piling
Another application of VisLog is to envisage the ground improvement in a site. For example, in a
given site if the stone-columns are required to improve the subsurface soil layers, VisLog can
demonstrate the 3D view of the site showing the stone-columns in place, with their length as well as
scatter of diameter, length, volume, etc in different colors across the site. Please see Ground
Improvement Example(See 3.15.2) for more details
Topography and Site Visualizer
This application helps users to add additional objects such as buildings, topography surfaces,
polygons, etc to the scene. For more information on how to use this feature please see Topography
Example(See 3.15.1) and Object Management(See 3.13) help pages.
3.2 Toolbar and Menus
You can access most of the commands by using toolbar buttons. These buttons are also accessible
through the menubar.
New : To start a new VisLog model.
Open : To Open an existing VisLog model.
Import from gINT : imports borehole data from gINT database files.
6
VisLog User's Manual (Novo Tech Software Ltd.)
Edit Boreholes : To edit the properties of the boreholes or adding new boreholes in
Borehole
Editor(See 3.4) page
Save : To save the current VisLog model.
Rotate X : To rotate the current VisLog model around the X axis.
Rotate Z : To rotate the current VisLog model around the Z axis.
Toggle Texture/Color Mode : click to switch between using textures (image files) or plain color for
drawing soil profiles (read
more(See 3.6))
Zoom In/Out : used to zoom in and out the model. Alternatively you can use mouse wheel for zoom
actions.
Zoom Extent : To show the whole model in the viewer.
Standard Views : To show the standard (top, bottom, front, back, left and right) VisLog model.
Light On/Off : To turn the scene light on and off.
Object Manager : To open the
Options : To open the
Object Management(See 3.13) page.
preferences page(See 3.10).
Save As Image : To save the current view of the model to graphic formats such as BMP, JPG, etc.;
see
Export features(See 3.9.1) for more information.
Save As Movie : When enabled, it captures any actions in the
viewer(See 3.14.2) into a movie and
saves it on the user's hard disk.
Save As DXF : is used to save the current model to AutoCad DXF (R12) format.
Print : To prepare a report containing 6 pictures from different view-points from the current VisLog
model. This Report can also be printed.
About : To open this help file.
3.3 Using Help
Activating Help
Help button is placed at the top-right
corner of all pages, as shown on this
screenshot. In order to get the help
content associated with the page, please
click on this button.
7
VisLog User's Manual (Novo Tech Software Ltd.)
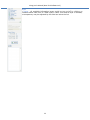
How to Choose Help Language?
Most of our help files are available in
both English and Spanish language. In
order to choose your desired language
please click on Help Help Contents
menu and choose your language from
the list. Please notice that Help language
could be different from the program
user-interface language(See 3.10).
The entire help content is also available
in PDF format and is presented through
User Manuals menu as shown on the
right.
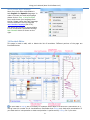
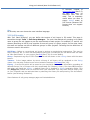
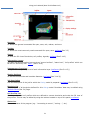
3.4 Borehole Editor
This page is used to add, edit or delete the list of boreholes. Different portions of the page are
illustrated below:
All input data in VisLog are unit-netral; for example when depth of a borehole is entered as 14.5,
VisLog uses this number for all visualizations. Remember that VisLog only deals with presentation of
your data and no interpretation or data-manipulation is performed by VisLog. So if you enter
8
VisLog User's Manual (Novo Tech Software Ltd.)
borehole depth and co-ordinates in metres, the same unit should be used when you enter depth of
each field test and thickness of each layer. In VisLog there are 3 ways to enter borehole data:
Manual Data Entry
To enter a new borehole click on "Add new borehole" button on toolbar; a new empty row will be
added to the end of the boreholes and soil layers table. The Field Test table on the right hand-side
of the page will be empty as well. Please enter borehole data in the new row and then enter soil
layers and field test data on corresponding tables.
Import From Text File
If you have already stored the boreholes data in a Text file, you can easily import them (using the
yellow folder icon on top-right corner of tables) into VisLog . Please read The Import from File help
page(See 3.8.1) for more information.
Import From gINT database files
VisLog has a feature to import directly from gINT database files; Please
Database Files(See 3.8.2) for more info.
read Import From gINT
Field test data can be any sort of test performed in a borehole including SPT, CPT, Moisture
Content, Vane Shear, Shear Wave Velocity, etc. Just enter test depth and test value in the
corresponding table.
VisLog supports all soil classes defined in Unified Soil Classification System. For visualization
purposes when you select a Soil Type from the drop-down list, VisLog automatically finds the Soil
Group it is associated with. An then the Soil Group texture / color is used for visualization and
drawing soil profiles. To see how to manage Soil Grouping, please read this article(See 3.11).
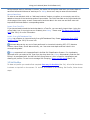
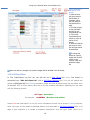
3.5 Soil Profiles
To draw soil profile you need to first complete
data entry for boreholes(See 3.4). A list of all boreholes
is shown on top-left on the screen. To include a borehole in an existing Soil Profile, follow these
steps:
9
VisLog User's Manual (Novo Tech Software Ltd.)
Step 1
Click on the borehole which should be added to an
existing soil profile.
Step 2
Hold the left mouse button and drag the selected
borehole into "List of sections" frame.
Step 3
Release the mouse button on the section you
want it to be added to.
The selected borehole will be placed after the last
borehole in the corresponding section (soil
profile). User can use the following buttons to
modify the soil profiles:
Once a soil profile is defined, it is updated in the viewer. Each soil layer along the profile will be
shown with corresponding texture image. Similar soil layers in adjacent boreholes will be
automatically connected together. For more information on how to define soil groups and assign
texture images,
read this article(See 3.11).
10
VisLog User's Manual (Novo Tech Software Ltd.)
3.6 Texture or Color?
VisLog can draw soil profiles and visualize the soil layers by using either Textures (image files
selected for each Soil Group(See 3.11)) or Plain Colors. Click on the
button on the toolbar to
switch between using textures and plain colors. When Plain Color is selected, VisLog will
mathematically calculates the dominant color of the Soil Group texture and assigns it to the soil
layer.
3.7 Working with graphs
We understand that presentation of the analysis results is very important to our users. Everywhere
in Novo Tech Software programs when you click on a chart, a new dialog appears containing the
chart and its associated data. In the following example, the corresponding dataset is shown on right
and can be scrolled horizontally and vertically to view all data. In addition, toolbar buttons provide
you with more features:
11
VisLog User's Manual (Novo Tech Software Ltd.)
To change line styles of the plot
To change the scale (minimum, maximum
and gridlines) of each axis. Please click on
small arrow on right side of the icon to
open the dropdown menu
To toggle between normal/logarithmic
scale for horizontal axis
To change the chart type
To open the advanced settings page for
the chart
To save the dataset table as Microsoft
Excel file
To save the chart as text and graphic
format
To print the chart
Opens this help page
How can I change the appearance of the chart such as legend, chart type, etc?
You can configure almost everything in the chart by clicking on
open the following dialog box:
12
button from the toolbar. This will
VisLog User's Manual (Novo Tech Software Ltd.)
Click on the desired element from the list located on the left side of the page; more options will be
shown on the right portion. Click on OK button to apply your changes.
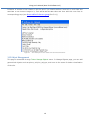
3.8 Import
3.8.1 From text file (*.txt)
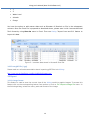
If your boreholes data stored in a text file, you can import them directly to VisLog and save the data
entry time. The first 8 columns should be arranged in the following order:
Name
Depth
X
Y
Z
Water Level
Azimuth
Plunge
You may add more columns for custom data such as diameter of Borehole or Pile to the subsequent
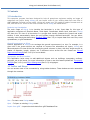
columns. Separate data columns with comma on each row. Following is a sample of boreholes data
saved in a text file. In this example, three custom data: "Gravel Vol", "Diameter" and "Date" are
also stored in additional columns.
Figure 1 : borehole data stored in Text file.
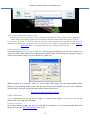
Importing data from Microsoft Excel
You can also import data indirectly from Excel spreadsheets. The first 8 columns should be arrange
in the following order:
Name
Depth
X
13
VisLog User's Manual (Novo Tech Software Ltd.)
Y
Z
Water Level
Azimuth
Plunge
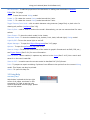
You have the option to add custom data such as Diameter of Borehole or Pile in the subsequent
columns. Once the Excel file is prepared as described above, please save it with 'comma-delimited
Text' format by using Save As menu in Excel. Then use VisLog "Import from text file" feature to
import this data.
Figure 2 : borehole data stored in Microsoft Excel file.
3.8.2 From gINT file (*.gpj)
Please read our online documentation about importing gINT files into VisLog:
http://www.novotechsoftware.com/docs/onlinehelp/smartsync/
3.9 Export
3.9.1 As image format
This feature is used to save the current view of the VisLog model to graphic images. To access this
feature click on the corresponding button from toolbar or click on FileExportImage File menu. In
the following dialog, select the name, path and format of the image.
14
VisLog User's Manual (Novo Tech Software Ltd.)
3.9.2 As Autocad R12 DXF format (*.dxf)
This feature is used to save the current model to AutoCad DXF (R12) format. This is especially
useful when user wants to edit the soil profiles in AutoCad and prepare the report. Click on
FileExportAutoCad DXF R12 file menu to save the model. Please notice that DXF format does not
support textures for the soil profiles. So if you have set the model to show textures, please switch to
plain color(See 3.6) before exporting your model to DXF format.
3.9.3 As movie format (*.avi)
Use toolbar button, or FileExportVideo File menu to start recording the scene into AVI format. You
will be provided with a dialog box (as shown below) which allows you selecting the compressor type by
which screen capture is done, as well as frame rate, quality, etc.
While recording you can rotate, zoom, etc in the model. When done, click on corresponding toolbar
button to stop recording. Please notice that the size of the movie depends on your screen resolution,
selected codec, frame per second and other options selected by the user.
See sample video captured by VisLog
3.10 Preferences
VisLog preferences can be set on this page. In toolbar menu select ToolsOptions to set the
preferences. This page has three tabs:
Texture & Grouping
All existing texture images are shown in this tab. To change the soil types associated with each
Group, you can use Soil Group Manager(See 3.11).
15
VisLog User's Manual (Novo Tech Software Ltd.)
Scene Properties
The following parameters can be set using this tab:
Background Color : sets
the background color of
the viewer and can be set
to either White or Black.
Name Color : sets the
color of the title of
boreholes in the viewer.
Always Show Borehole
Locations : If selected,
even if user has chosen to
hide
the
boreholes'
information
layer(See
3.14.3),
locations
of
borehole will be specified
on the viewer with a small
sphere.
Show Borehole's
If selected, name
the boreholes
printed adjacent
borehole.
Name :
(title) of
will be
to each
"Zoom All" During Autorotation : If selected,
when user clicks on Rotate
X or Rotate Y buttons
from toolbar and when
scene is rotating, all the
boreholes and soil profiles
will be fit into the viewer
on each frame.
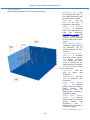
Faces Color : Sets the
color
of
faces
(see
illustration).
Gridlines Color : Sets the
color of gridlines (see
illustration).
Always
Draw
Binding
Frame
:
If
selected,
always shows the binding
frame
always
(see
illustration)
even
if
Gridlines are turned off in
information layers.
Always
Show
Bottom
Surface : If selected,
always shows the bottom
surface
always
(see
illustration)
even
if
Gridlines are turned off in
information layers.
Use dominant plain color :
16
VisLog User's Manual (Novo Tech Software Ltd.)
If
selected,
instead of
associated texture(See 3.5)
for each soil layer, its
dominant color will be
used. This is especially
useful when you want to
export VisLog model to
DXF format (because DXF
format does not support
texture).
Misc.
On this tab, user can choose the user interface language.
3.11 Soil Grouping
With "Soil Class Grouping" you can define the texture of soil layers in 3D model. This page is
accessible through Tools Soil Group Manager. The main idea behind soil grouping is to enable
users to group the soil classes as per the requirements of each project. For example, CL and ML soil
classes (according to USCS) may consider as one soil group in a given project; on the other hand,
the exact soil classes can be two different groups in other projects. Following are the definitions of
the terms used in this article:
Soil Class : Refers to conventional soil types in geology or geotechnical engineering. This may be
USCS, AASHTO, etc. or even user defined soil/rock type. For example you can define new soil class
as "New Red Granite" in your project (See here(See 3.12) for more details)
Group : Represents a group of Soil Classes which will be shown on the VisLog viewer with the same
texture.
Texture : Is the image pattern by which a Group of soil layers will be rendered on the VisLog
viewer. You may also choose to use colors instead of textures ( read more(See 3.6)).
Library : Is a text file which will be saved on your hard-disk and hold the information regarding all
defined Groups (list of Groups with their associated Soil Classes). Library files have lib extension
and when you install the VisLog , a default library file is installed in VisLog installation folder. This
file (defgrp.lib) should never be removed from your hard-disk. You may have several Library files
on your computer and can activate them by selecting the Library file and pressing "Set As Default"
button (see following illustration).
Some features of soil group manager page are illustrated below:
17
VisLog User's Manual (Novo Tech Software Ltd.)
How to associate a
soil type to a soil
group?
1- Make sure the
soil group exists in
the left table. If
necessary, add a
new soil group to
the bottom of the
table.
2- Find the soil type
on the right table
and click on the
corresponding row.
3- Click on the
"Associated Group"
column to open up
the list of soil
groups.
4- Select the desired
soil group to which
this soil type should
be associated
To change the
texture of a group,
simply click on third
column in the
"Groups" table and
locate the image
file.
Please note that any changes in the texture images will be reflected in the 3D viewer.
3.12 Soil Class Editor
In "Soil Classification Log File" you can edit the list of
accessible from "Edit Soil Class List" link in
Soil Classes(See 3.11). This feature is
Soil Group Manager.(See 3.11) All soil classes are
stored in SoilTypes.ini file in VisLog installation folder and may be edited using any text editor such
as Notepad. As it is shown below, each line in this file contains information regarding one soil class
with the following format:
Soil Type | Description
for example:
BLDRCBBL | Boulders and cobbles
Please note that "description" is only for user's information and will not be shown in VisLog interface,
while "soil type" will be shown on the first column of Groups table in
Soil Group Manager(See 3.11)
page. A pipe character | is needed to separate "description" and "soil type" fields. There is no
18
VisLog User's Manual (Novo Tech Software Ltd.)
limitation of number of soil classes in this file and if you need to define a new soil or rock class and
associate a new texture image to it, first add a row to new class and then add this new class to
corresponding group (see
how to add soil class to a group(See 3.11))
Figure 1 : An example of soil class file and its structure.
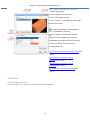
3.13 Object Management
This page is accessible through ToolsManage Objects menu. In Manage Objects page, you can add
geometrical objects such as sphere, polyline, polygon, and more to the scene for better visualization
of the site.
19
VisLog User's Manual (Novo Tech Software Ltd.)
How to add a new object to the scene?
1- Select object type
2- Enter object's size and color
3- Click "Add object" button
4- Click "Close" to come back to main page
and see the viewer
The required format for coordinates is
X,Y,Z (separated by comma)
When Polygon, Pointset and Surface
objects are to be added, their vertices
coordinates should be read from Text files.
To see the sample Text files click on
corresponding link:
File format for showing a set of Points (See
3.16.1)
File format for showing a set of
Polylines(See 3.16.2)
File format for showing a set of
Polyfaces(See 3.16.3)
File format for showing a Surface(See
3.16.4)
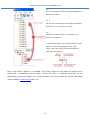
3.14 Viewer
3.14.1 Starting with VisLog
The main page of VisLog can be divided to the following parts:
20
VisLog User's Manual (Novo Tech Software Ltd.)
Menubar
To access the general commands like open, save, exit, redraw, and more
Toolbar
To access the most commonly used commands like open, save,
Viewer
To show the 3D view of boreholes, soil profiles, legends,
and more(See 3.2)
and more(See 3.14.2)
Information Layers
This plan lists all information layers such as "ground surface", "water level", "soil profiles" which can
be turn on and off by user. more ...(See 3.14.3)
Transparency Track-bar
To adjust the transparency level of each information layer (read
more (See 3.14.3) )
Display Settings
To set the vertical scale and borehole diameter ( read more(See 3.14.3))
Job Description
Is a text description of the job for which the VisLog model is prepared (read
more)(See 3.14.3)
Borehole List
Contains a list of all boreholes defined for this VisLog model. Boreholes' data may be edited using
Borehole Editor(See 3.4) Page.
Soil Profiles List
Contains a list of all soil profiles which are defined to connect boreholes and make the 3D view of
the profiles. This list may be edited by using the buttons located on top of this panel ( read more)
Status-bar
Shows the status of the program (e.g. "connecting to server", "saving ...", etc.)
21
VisLog User's Manual (Novo Tech Software Ltd.)
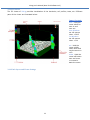
3.14.2 3D Viewer
The 3D viewer of VisLog provides visualization of the boreholes, soil profiles, tests, etc. Different
parts of the viewer are illustrated below:
Viewer Controls
Zoom : use your
mouse wheel for
zoom-in and
zoom-out
Zoom Window :
user left mouse
button + Shift
Fine Window :
user left mouse
button + Ctrl
Pan : Hold the
mouse middle
button down and
drag the scene to
move
Rotate : Hold the
mouse left button
down and move
the mouse to
rotate the scene
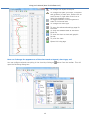
3.14.3 Info-Layers and Viewer Settings
22
VisLog User's Manual (Novo Tech Software Ltd.)
Layers
In VisLog , all available information layers could be turn on/off by clicking on
checkbox before each item on "Data Layers" frame. Also when a layer is selected,
its transparency may be adjusted by the slide-bar below the list:
23
VisLog User's Manual (Novo Tech Software Ltd.)
Ground Surface Represents a triangulated 3D surface of the ground surface. This surface
is mathematically generated based on top elevation of boreholes.
Water Level Represents a triangulated 3D surface of the water level based on
boreholes data.
Bottom Surface Represents a triangulated 3D surface of the bottom elevation of
boreholes. This feature may be especially useful when boreholes have
been stopped by encountering a bedrock; In this case, this surface shows
the bedrock surface.
Boreholes Represents all boreholes of the model
Field Test Plot Represents the plots of field test data for each borehole. This field test
data could be SPT, Vane Shear, CPT, DCPT and any other field test. This
plots are shown dimensionless so literally any field test can be presented
using this feature.
Profiles Represents all soil profiles which are defined by the user.
Gridlines Geometrically, the scene containing all boreholes and other objects inside
the model, is embedded in a cube. Faces of this cube is shaded for better
3D imagination. Gridlines represents faces of the cube and could be turn
on and off if necessary.
GI Contours If additional data is imported and attached to the boreholes (such as
length or diameter of piles in a project), those data can be shown across
the site via color contours.
Adjusting Transparency
To change the transparency level of each info-layer, simply click on it and then use the slide-bar to
adjust the transparency of the object. While dragging, notice the change in transparency of the infolayer in the viewer.
Contours
This feature is specifically used when user-data is imported and attached to the boreholes data.
Select the corresponding parameter from the drop-down list inside the "Contours" frame to see the
variation of parameter on ground surface.
Display Settings
Display Settings are to change the vertical scale or borehole's diameter. If you select to show the
field test plots along with boreholes, you may adjust the scale of these plots as well. After changing
the fields, click on Refresh button to apply the new settings.
Job Information
This is a text description of the job for which the VisLog model is prepared.
24
VisLog User's Manual (Novo Tech Software Ltd.)
3.15 Examples
3.15.1 Topography Modelling
coming soon ...
3.15.2 Ground Improvement Modelling
coming soon ...
3.15.3 Object Modelling
This page is accessible through ToolsManage Objects menu. In Manage Objects page, you can add
geometrical objects such as sphere, polyline, polygon, and more to the scene for better visualization
of the site.
How to add a new object to the scene?
1- Select object type
2- Enter object's size and color
3- Click "Add object" button
4- Click "Close" to come back to main page
and see the viewer
The required format for coordinates is
X,Y,Z (separated by comma)
When Polygon, Pointset and Surface
objects are to be added, their vertices
coordinates should be read from Text files.
To see the sample Text files click on
corresponding link:
File format for showing a set of Points (See
3.16.1)
File format for showing a set of
Polylines(See 3.16.2)
File format for showing a set of
Polyfaces(See 3.16.3)
File format for showing a Surface(See
3.16.4)
25
VisLog User's Manual (Novo Tech Software Ltd.)
3.16 File Formats
3.16.1 Points
The presumed formatting for a file containing this type of object is explained below:
Data format
1- Each line consists of 3 numbers separated by
comma
2- Numbers will be X,Y,Z on each line,
respectively
3.16.2 Polyline
Data format
1- Each polyline is represented
with n vertices
2- Each line holding one vertex
information
3- X,Y,Z are separated with
comma on each line
4- An empty line after each
polyline
3.16.3 Polyface
What is a Polyface?
It is a 3D surface defined by its
vertices and is shown as a surface
filled with a color.
Data format
1- Each Polyface is represented with n vertices
2- Each line holding one vertex information
3- X,Y,Z are separated with comma on each line
4- An empty line after each Polyface
3.16.4 Surface
Data format
1- Each line
consists of one vertex information for each point
on the surface
2- Numbers will
be X,Y,Z on each line, respectively
3- VisLog will
triangulate all points and generates 3D faces for
triangles
connecting points together.
26
VisLog User's Manual (Novo Tech Software Ltd.)
This feature is especially useful when visualizing topographic data.
27
VisLog User's Manual (Novo Tech Software Ltd.)
4. Online
4.1 Novo Tech Software website
http://www.novotechsoftware.com
4.2 Our other programs
http://www.novotechsoftware.com/products/
4.3 Updates
http://www.novotechsoftware.com/updatelogs/vislog.txt
4.4 Contact us
http://www.novotechsoftware.com/html/contact/Contact.htm
28